

Abstract
We report on the impact of TiN interfaces on the ferroelectricity of nondoped HfO2. Ferroelectric properties of nondoped HfO2 in TiN/HfO2/TiN stacks are shown in capacitance–voltage and polarization–voltage characteristics. The Curie temperature is also estimated to be around 500 °C. The ferroelectricity of nondoped HfO2 clearly appears by thinning HfO2 film down to ∼35 nm. We directly revealed in thermal treatments that the ferroelectric HfO2 film on TiN was maintained by covering the top surface of HfO2 with TiN, while it was followed by a phase transition to the paraelectric phase in the case of the open surface of HfO2. Thus, it is concluded that the ferroelectricity in nondoped HfO2 in this study was mainly driven by both of top and bottom TiN interfaces.
Export citation and abstract BibTeX RIS
1. Introduction
Recently, doped HfO2 has attracted much attention from the viewpoints of ferroelectric1–9) as well as higher dielectric constant (k) properties.10,11) Since HfO2 is now employed for the gate dielectric film in advanced CMOS, its impact on CMOS application is different from those of typical ferroelectrics such as PZT and BTO.12) According to studies on the ferroelectricity of HfO2, cation (e.g., Si, Al, Y, Gd, or Zr) doping is required to induce the ferroelectricity of HfO2.1–9) Although it is considered that the cation doping into HfO2 may cause various effects (oxygen vacancy formation,13) molar volume change,10) and bonding character modification) in HfO2, the role of cation doping into HfO2 in the ferroelectricity has not been clarified.
On the other hand, it was reported that the highly symmetric phase of nondoped HfO2 with higher k was also achieved by the interface control14) or nonequilibrium process.15) Therefore, it is expected that nondoped HfO2 may be crystallized into the ferroelectric phase owing to an appropriate interface control and/or nonequilibrium process. In fact, we recently reported that nondoped HfO2 films exhibited ferroelectric properties by selecting the interface of HfO2.16) In this study, we focused on the effect of the TiN interface on ferroelectricity in nondoped HfO2 films, because it was reported that the TiN cap layer stabilized a structural phase of nondoped HfO2 with higher k,14) and suppressed the phase transition to paraelectric phase in Hf0.5Zr0.5O2 films.17) We also discuss the stability of the ferroelectric phase of nondoped HfO2 films.
2. Experimental
To clarify the TiN interface and capping effects, we prepared HfO2/TiN and TiN/HfO2/TiN stacks. Nondoped HfO2 was deposited on the TiN substrate by rf sputtering in Ar, and then a 60-nm-thick top TiN electrode was also deposited by rf sputtering for the TiN/HfO2/TiN stack. HfO2 films in both TiN/HfO2/TiN and HfO2/TiN stacks were crystallized in a rapid thermal annealing furnace at 600 °C for 30 s in N2. For electric measurements, a metal electrode (Al) was thermally evaporated on the HfO2/TiN stack after the crystallization annealing. TiN and Al top electrodes with an area of 2.5 × 10⁻⁵ cm2 were fabricated by chemical etching with diluted H2O2+NH4 solution and tetramethylammonium hydroxide solution through photoresist pattern, respectively. The polarization–voltage (P–V) and capacitance–voltage (C–V) characteristics were measured using Toyo FCE-1/1A and Agilent E4980A LCR meter. X-ray diffraction (XRD; Rigaku Smart Lab) was used for a structural analysis.
3. Results and discussion
3.1. Ferroelectricity of nondoped HfO2
First, we focus on the ferroelectricity of nondoped HfO2. Figure 1(a) shows the P–V characteristics of the TiN/HfO2/TiN and Al/HfO2/TiN capacitors with 20-nm-thick HfO2 films which were thermally annealed at 600 °C for 30 s in N2. As we previously reported,16) the Al/HfO2/TiN capacitor shows a linear relationship with no hysteresis, which indicates that the HfO2 film in the Al/HfO2/TiN stack is paraelectric, while the TiN/HfO2/TiN capacitor clearly shows a ferroelectric hysteresis in P–V characteristics. The difference is discussed in the later part. The ferroelectricity of nondoped HfO2 film in the TiN/HfO2/TiN stack is qualitatively in good agreement with that recently reported by another research group.18)
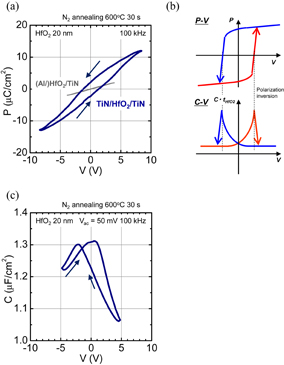
Fig. 1. (a) P–V characteristics of TiN/nondoped HfO2/TiN and Al/nondoped HfO2/TiN capacitors. The Al/HfO2/TiN capacitor shows a linear P–V characteristic, whereas the TiN/HfO2/TiN one shows a clear hysteresis. (b) Relationship between P–V and C–V characteristics. (c) C–V characteristics of TiN/HfO2/TiN MIM capacitor. The characteristic C–V hysteresis is also a strong evidence of ferroelectric HfO2 in TiN/HfO2/TiN.
Download figure:
Standard image High-resolution imageWe also confirmed the ferroelectricity from C–V characteristics. The relationship of the area of hysteresis observed in P–V curve and in C–V characteristics is described as

where Q and tHfO2 are the accumulated charge and HfO2 film thickness in the capacitor, respectively. Thus, the C–V curve is obtained from the differential of the P–V curve. However, since a small ac voltage at a high frequency (50 mV at 100 kHz in this work) is generally used for probing in the differential C–V measurement, it is noted that only the reversible polarization processes involving ionic and electronic displacements and domain wall motion19) can be detected. The relationship between P–V and C–V measured by differential C–V is described in Fig. 1(b). The applied dc voltage dependence of capacitance in the TiN/HfO2/TiN capacitor exhibits a characteristic curve with a large hysteresis showing ferroelectricity as shown in Fig. 1(c). The dielectric loss values [tan δ = (2πfCRp)−1, where f, C, and Rp are the measurement frequency, capacitance, and parallel resistance connected to the capacitor, respectively] at Vg = ±4.8 V in the parallel mode measurement were less than 0.07, which indicates that the leakage current was substantially low, and that the characteristic C–V with hysteresis in Fig. 1(c) was not an artifact. Therefore, it was confirmed that the hysteresis in the P–V curve is not caused by a property of the nonlinear lossy dielectric but by that of the ferroelectric film. Moreover, the k of the HfO2 film in TiN/HfO2/TiN stack was estimated to be 22–30. This value is higher than that of monoclinic phase of nondoped HfO220) and comparable to that of the ferroelectric doped HfO2.1,2,5,6)
To further examine the ferroelectricity of nondoped HfO2 in TiN/HfO2/TiN stacks, the temperature dependence of C–V characteristics was measured. Figure 2(a) shows the C–V characteristics measured at various temperatures ranging from 300 to 100 K. Two points that characterize the ferroelectricity of nondoped HfO2 in TiN/HfO2/TiN stacks are addressed. One is the voltage hysteresis shown by an arrow in Fig. 2(a) being almost independent of the measurement temperature. This suggests that the origin of hysteresis is not the diffusion of thermally activated charged species.21) The other point is the temperature dependence of the electric susceptibility χ, where χ in the ferroelectric system is generally proportional to 1/(T − TC), TC being the Curie temperature in the ferroelectric phase transition. Since k = 1 + χ and χ ≫ 1 in ferroelectric films, χ should be proportional capacitance. Figure 2(b) shows the inverse of capacitance as a function of the measurement temperature, in which the characteristic capacitance is defined by the crossing value around the center of the C–V hysteresis in Fig. 2(a). The inverse of capacitance linearly decreases with the increase of measurement temperature. This fact also ensures that nondoped HfO2 in the TiN/HfO2/TiN stack is ferroelectric. Furthermore, the Curie temperature TC of nondoped HfO2 is estimated to be above 500 °C by extrapolating 1/C to zero. It has also been reported that the ferroelectricity of Si-doped HfO2 was observed up to 200 °C,22) and that the Curie temperature of Y-doped HfO2 was estimated to be around 450 °C.23) These results suggest that the ferroelectricity of HfO2 may not be due to doping elements but to the intrinsic HfO2 crystalline structure.

Download figure:
Standard image High-resolution image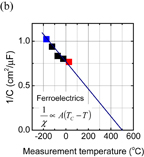
Fig. 2. (a) C–V characteristics of TiN/HfO2/TiN capacitor measured at several temperatures. Since the voltage difference between capacitance peaks is almost constant, the origin of hysteresis is not a thermal activation process. On the other hand, note that the capacitance is drastically reduced with decreasing measurement temperature. (b) Inverse of capacitance as a function of the measurement temperature, in which the characteristic capacitance is defined by the crossing point value in C–V hysteresis. The linear relationship between 1/C and temperature is in good agreement with the general behavior of ferroelectric films below TC. TC is estimated to be 500 °C by the extrapolation of the linear relationship.
Download figure:
Standard image High-resolution image3.2. Effect of film thickness on the ferroelectricity and structure
Next, we discuss the effect of film thickness on ferroelectricity. Since it is known that the structural phase of HfO2 is sensitive to the film thickness,24) it is expected that the ferroelectricity of nondoped HfO2 will be also strongly affected by the film thickness. Figure 3(a) shows XRD patterns of 40-, 20-, and 13-nm-thick nondoped HfO2 in TiN/HfO2/TiN stacks. Note that the XRD of HfO2 films was measured through the TiN electrode on HfO2. The peak intensity is normalized by the height of the peaks at around 30.5°, which is assigned to highly symmetric phases (i.e., cubic, tetragonal, and orthorhombic phases25)). It is clearly shown that the crystallization into the monoclinic phase is significantly suppressed by decreasing the HfO2 film thickness. We analyzed the ferroelectricity of HfO2 in TiN/HfO2/TiN stacks from C–V characteristics at 100 kHz to reduce possible leakage current effects. Figure 3(b) shows C–V characteristics of TiN/HfO2/TiN capacitors with various HfO2 thicknesses ranging from 13 to 40 nm. The hysteresis in C–V characteristics was clearly made visible by decreasing the film thickness. Furthermore, we discuss the ferroelectricity from the hysteresis in C–V curve. The analysis of ferroelectricity was performed based on the relationship between P–V and (C · tHfO2)–V characteristics in ferroelectrics as shown in Fig. 3(c). Since point A in Fig. 3(c) is in the polarization inversion process, the ferroelectric domain wall motion, which is reversible in a small ac voltage, is detectable in addition to the electron motion and ion displacement. On the other hand, since point B in Fig. 3(c) is not in the polarization inversion process, only the electron motion and ion displacement are detected. Considering the fact that C · tHfO2 corresponds to k, the Δ(C · tHfO2) shown in Fig. 3(c) represents a change in k in the polarization inversion. Therefore, it is possible to evaluate the ferroelectricity of film by estimating Δ(C · tHfO2). Figure 3(d) shows the dependence of film thickness on Δ(C · tHfO2). It is clearly observed that Δ(C · tHfO2) is significantly increased by decreasing the HfO2 thickness down to 40 nm. In addition, we note that the static coercive field (EC) can be estimated from the peak distance in the hysteresis of C–V characteristics.26) Figure 3(e) shows that EC is almost constant for the HfO2 thickness between 13 and 30 nm, which suggests that the ferroelectric domain structure in the thickness direction is not significantly affected by the reduction in film thickness.

Fig. 3. (a) XRD patterns of TiN/nondoped HfO2/TiN stacks with three HfO2 thicknesses (40, 20, and 13 nm) annealed at 600 °C. Data are offset for clarity. The intensity is normalized by the peak height of the highly symmetric phases (cubic, tetragonal, and orthorhombic) observed at around 30.5°. By reducing the thickness of HfO2, the crystallization into the monoclinic phase is relatively suppressed. (b) C–V characteristics of TiN/nondoped HfO2/TiN capacitors with various HfO2 thicknesses. (c) Relationship between P–V and (C · tHfO2)–V in ferroelectrics. The ferroelectric polarization is in inversion process at point A, but not at point B. Since C · tHfO2 corresponds to k, the Δ(C · tHfO2) shown in (C · tHfO2)–V represents a change in k attributed to the reversible ferroelectric domain wall motion in the polarization inversion process. (d) HfO2 thickness dependence on Δ(C · tHfO2). By reducing the thickness of HfO2 below 40 nm, the k increase due to the ferroelectricity clearly appears. (e) The static coercive field estimated from the hysteresis of capacitance peaks in C–V characteristics is almost constant, which implies that ferroelectricity is uniform in the direction of film thickness.
Download figure:
Standard image High-resolution imageFrom these results, we would like to discuss the effect of film thickness on the crystallization into the ferroelectric phase. Considering that the interface often acts as an inhomogeneous nucleation center and thin HfO2 films in the TiN/HfO2/TiN stack exhibit ferroelectricity, it is inferred that the TiN interface might work as the nucleation center of the ferroelectric phase of HfO2. When the grain size of HfO2 becomes larger with an increase in film thickness, the paraelectric monoclinic phase becomes more stable than the ferroelectric phase owing to more volume energy gain than surface energy. As shown in Fig. 3(d), the ferroelectricity estimated from C–V characteristics drastically disappears above 40 nm. This view is consistent with the observed crystallization into monoclinic phase in the thick HfO2 film as shown in Fig. 3(a). On the other hand, Δ(C · tHfO2) seems to decrease below 20 nm as shown in Fig. 3(d). Considering the fact that the k of the thin HfO2 film below 20 nm is also estimated to be 25–32 from the C–V characteristics in Fig. 3(b), it might be caused by the partial formation of highly symmetric paraelectric phase with higher k due to its lower surface energy. In addition, since it is known that O2 PDA easily causes the monoclinic phase transition,27) it is inferred that an effect of oxygen blocking into HfO2 might be involved in this monoclinic phase destabilization. However, other effects such as mechanical or doping effects from the interface might be intuitively probable causes of the phase destabilization. The physical mechanism of the TiN interface effect on the HfO2 ferroelectricity should obviously be further investigated to understand and control the HfO2 ferroelectricity.
3.3. Stability of ferroelectric phase in nondoped HfO2
Finally, we discuss the stability of the ferroelectric phase of nondoped HfO2. According to the results shown in Fig. 1, a phase transition of HfO2 film to the paraelectric phase might be induced in the thermal treatment the HfO2/TiN stack, even if the HfO2 film is initially crystallized into the ferroelectric phase. We directly examined the effects of annealing on the ferroelectric HfO2 films with and without the top TiN electrode. We initially fabricated ferroelectric 25-nm-thick HfO2 films in the TiN/HfO2/TiN stack by crystallization at 500 °C for 30 s, and removed top TiN electrode with diluted H2O2+NH4 solution for the samples without the TiN electrode. We confirmed by XRD measurement that no structural transition of HfO2 was detected in the TiN removal process. We then annealed ferroelectric HfO2 films in HfO2/TiN and TiN/HfO2/TiN stacks in N2 at 500 °C, and then analyzed the crystalline structure of the HfO2 films. Figures 4(a) and 4(b) show XRD patterns of the ferroelectric HfO2 films and the monoclinic phase ratio of HfO2 films estimated from three XRD peak areas at around 30°, respectively. The crystalline structure of the ferroelectric HfO2 film in the TiN/HfO2/TiN stack does not change at all through additional annealing, while that in the HfO2/TiN stack exhibits the obvious structural phase transition into the monoclinic phase with an increase of the annealing time. Furthermore, we investigated the effect of additional annealing on the ferroelectricity of HfO2 film. For C–V measurement, we deposited TiN electrodes on the additionally annealed HfO2 film again. The Δ(C · tHfO2) in C–V characteristics is drastically reduced in the additional annealing (not shown). These results directly prove that the ferroelectric nondoped HfO2 film is stabilized by capping the HfO2 surface with a TiN film. This fact is the same as the phase stabilization due to the capping in martensitic phase transition reported previously.15) Thus, the ferroelectric phase in nondoped HfO2 seems to be metastable, but it is successfully stabilized thanks to the TiN interfaces.

Download figure:
Standard image High-resolution image
Fig. 4. (a) XRD patterns of ferroelectric HfO2 films (25 nm) with and without TiN top electrode in an additional annealing. Initially, the ferroelectric HfO2 films were prepared in TiN/HfO2/TiN stacks by thermal treatment at 500 °C for 30 s in N2 (as-crystallized). The top TiN electrode was removed for the sample without the top TiN electrode and then the additional annealing at 500 °C in N2 was performed on the ferroelectric HfO2 films. The ferroelectricity of the as-crystallized HfO2 film was confirmed from the C–V characteristics, as shown in the inset. (b) Paraelectric monoclinic phase ratio rm in those HfO2 films estimated from the XRD peak area observed between 27.5 and 33° as a function of annealing time. rm is calculated from the XRD peak areal intensity as shown in the inset. The phase transition into the monoclinic phase in the sample without the TiN electrode is obviously promoted in the additional annealing process, while a notable phase transition cannot be detected in the sample with the TiN electrode.
Download figure:
Standard image High-resolution image
4. Conclusions
We investigated effects of the TiN/HfO2 interface on the ferroelectricity of nondoped HfO2. Nondoped HfO2 film with a thickness below ∼40 nm in TiN/HfO2/TiN stacks clearly exhibits ferroelectricity. We also directly revealed that the ferroelectric phase in nondoped HfO2 is stabilized by capping the top HfO2 surface with TiN. Furthermore, we estimated the Curie temperature of nondoped HfO2 to be around 500 °C for the first time.
Acknowledgement
This work was supported by CREST, Japan Science and Technology Agency, and partly performed in collaboration with Semiconductor Technology Academic Research Center (STARC).