Transcriptional adaptation in Caenorhabditis elegans
- Max Planck Institute for Heart and Lung Research, Germany
- Goethe University, Germany
- University of Würzburg, Germany
Abstract
Transcriptional adaptation is a recently described phenomenon by which a mutation in one gene leads to the transcriptional modulation of related genes, termed adapting genes. At the molecular level, it has been proposed that the mutant mRNA, rather than the loss of protein function, activates this response. While several examples of transcriptional adaptation have been reported in zebrafish embryos and in mouse cell lines, it is not known whether this phenomenon is observed across metazoans. Here we report transcriptional adaptation in C. elegans, and find that this process requires factors involved in mutant mRNA decay, as in zebrafish and mouse. We further uncover a requirement for Argonaute proteins and Dicer, factors involved in small RNA maturation and transport into the nucleus. Altogether, these results provide evidence for transcriptional adaptation in C. elegans, a powerful model to further investigate underlying molecular mechanisms.
Introduction
Transcriptional adaptation is the ability of certain mutations in a gene to modulate the expression of related genes, referred to as adapting genes (El-Brolosy and Stainier, 2017; El-Brolosy et al., 2019; Ma et al., 2019). At the molecular level, the mutant mRNA, rather than the loss of protein function, is responsible for this transcriptional modulation (Rossi et al., 2015; El-Brolosy and Stainier, 2017; Sztal et al., 2018; El-Brolosy et al., 2019; Ma et al., 2019). According to one model (El-Brolosy et al., 2019), the mutant mRNA, via its degradation products, modulates the expression of adapting genes via transcriptional regulators including antisense RNAs and histone modifiers. According to another model (Ma et al., 2019), the premature termination codon (PTC) containing mutant mRNA interacts with a histone modifier complex leading to transcriptional upregulation of the adapting gene(s). Sequence similarity with the mutant mRNA determines which genes get upregulated during transcriptional adaptation (El-Brolosy et al., 2019). In some cases, the upregulated genes share functionality with the mutated gene leading to functional compensation. However, while transcriptional adaptation is often discussed in the context of genetic robustness (Rossi et al., 2015; El-Brolosy et al., 2019; Ma et al., 2019), it does not always lead to functional compensation (Rossi et al., 2015). In addition, transcriptome analyses suggest that even genes with limited sequence similarity with the mutant mRNA can be upregulated during transcriptional adaptation (El-Brolosy et al., 2019), although clearly more work is required to determine whether the upregulation of these genes is a direct or indirect effect of transcriptional adaptation.
Understanding the mechanisms of transcriptional adaptation will help us better comprehend why for a given gene some mutations cause disease while others do not (Castel et al., 2018). However, despite the importance and growing interest in many aspects of genetic compensation, transcriptional adaptation has currently only been investigated in vertebrates. Thus, it remains unclear whether this phenomenon is observed across metazoans. The evolutionary importance of related genes that have compensatory effects has also been discussed in non-vertebrate eukaryotes (Conant and Wagner, 2004; Plata and Vitkup, 2014). However, it is not known whether these examples of compensation are due to protein feedback loops or transcriptional adaptation.
Only a few factors are known to be involved in the transcriptional adaptation response thus far, and others, including some involved in RNA processing and transport, are likely required. In addition, it is not clear whether the mechanisms of transcriptional adaptation are common or whether each particular case occurs in a different manner, especially at the step leading to transcriptional modulation. Also, as different paralogs or related genes are expressed in distinct tissues and/or at different times (Laisney et al., 2010; Kryuchkova-Mostacci and Robinson-Rechavi, 2015; Radomska et al., 2016; Pasquier et al., 2017; Jojic et al., 2018), it is currently unclear whether the expression of adapting genes can appear in tissues where, and/or at times when, they are not normally expressed.
In this study, we provide examples of transcriptional adaptation in Caenorhabditis elegans and show the ectopic expression of an extrachromosomal reporter in a tissue where it is not normally expressed. In addition, we analyze these transcriptional adaptation models after RNAi-mediated knockdown of different genes involved in RNA metabolism and find that the upregulation of the adapting genes requires factors involved in the maturation and transport into the nucleus of small RNAs (sRNAs).
Results
Examples of transcriptional adaptation in C. elegans
Actins are essential structural components of eukaryotic cells as they mediate a wide range of cellular processes (Pollard and Cooper, 1986). Actin genes are often present in multiple copies in higher eukaryotic genomes and hints of transcriptional adaptation modulating their expression have been reported. For example, mouse embryonic fibroblasts (MEFs) mutant for β-Actin (Actb) display increased expression of other Actins including α- and γ-Actin (ACTA and ACTG1/2) as measured by Western blots (Tondeleir et al., 2012). Similarly, Actg1 knockout, but not knockdown, in MEFs leads to an increase in Acta mRNA levels (Patrinostro et al., 2017), and zebrafish actc1b mutants exhibit mild muscle defects because of the transcriptional upregulation of actc1a (Sztal et al., 2018). Furthermore, Actg1 mutant MEFs and Actb mutant mouse embryonic stem cells (mESCs) display increased mRNA levels of Actg2 and Actg1, respectively, and this upregulation is triggered not by the loss of protein function but by mutant mRNA decay (El-Brolosy et al., 2019). Thus, we decided to investigate actin genes in C. elegans to test for transcriptional adaptation. The C. elegans genome contains five actin genes which display high similarity in their DNA and protein sequences (MacQueen et al., 2005). We started by analyzing several mutant alleles for act-1, act-2, act-3 and act-5, and determined mutant transcript levels. We found significantly reduced act-5 mRNA levels in act-5(dt2019) mutants compared to wild type (Figure 1A), likely caused by nonsense-mediated decay (NMD) due to a premature termination codon (ptc) in the first exon (Figure 1A, Figure 1—figure supplement 1). Most mutant alleles of act-5 cause severe phenotypes including lethality (Estes et al., 2011; MacQueen et al., 2005), sterility (Cui et al., 2004), and paralysis (Etheridge et al., 2015). However, the act-5(dt2019) allele, hereafter referred to as act-5(ptc), does not exhibit any obvious phenotype (MacQueen et al., 2005), an observation we confirmed. We analyzed the mRNA levels of all actin genes in act-5(ptc) mutants (Figure 1A, Figure 1—figure supplement 2), and observed the upregulation of act-3 mRNA and pre-mRNA (Figure 1B, Figure 1—figure supplement 3), consistent with a transcriptional adaptation response.
Figure 1 with 3 supplements see all
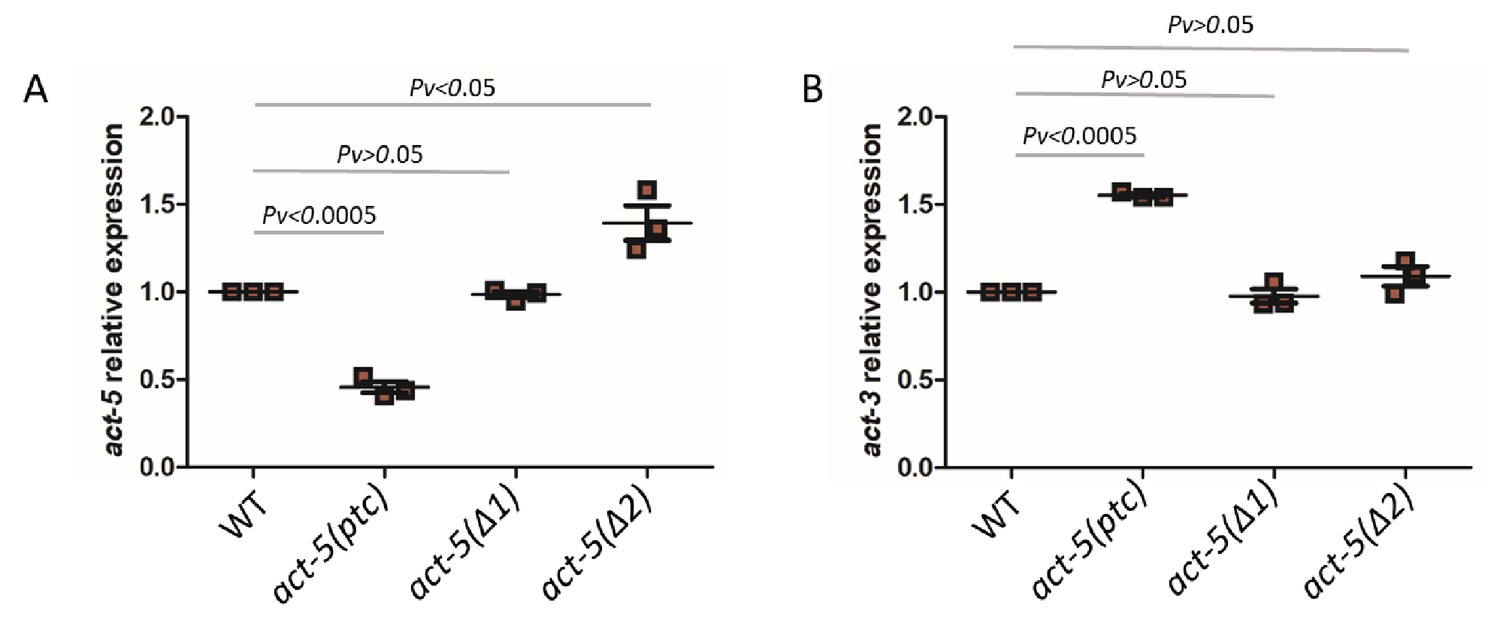
mRNA levels of act-5 and act-3 in WT and mutant alleles.
qPCR analysis of act-5 (A) and act-3 (B) mRNA levels in WT and act-5(ptc), act-5(Δ1), and act-5(Δ2) mutants. act-3 mRNA levels are upregulated when act-5 mutant mRNA levels are reduced (i.e., only in the act-5(ptc) allele). WT expression levels are set at 1. Data are mean ± S.E.M.; average dCt values are shown in Figure 1—source data 1. Two-tailed Student’s t-test was used to calculate P values.
-
Figure 1—source data 1
Average dCt values from qPCR analysis of act-5 and act-3 mRNA levels in WT and act-5 mutants.
- https://cdn.elifesciences.org/articles/50014/elife-50014-fig1-data1-v1.pdf
-
Figure 1—source data 2
Average dCt values from qPCR analysis of act-1, act-2 and act-4 mRNA levels in WT and act-5(ptc) mutants.
- https://cdn.elifesciences.org/articles/50014/elife-50014-fig1-data2-v1.pdf
We also examined the act-5(dt2017) partial deletion allele, hereafter referred to as act-5(Δ1), (Figure 1—figure supplement 1) and found no significant change in act-5 mRNA levels in homozygous mutants compared to wild type (Figure 1A). Notably, act-3 mRNA levels in act-5(Δ1) mutants were not changed compared to wild type (Figure 1B). To further test whether act-3 upregulation in act-5 mutants represents a model of transcriptional adaptation, we analyzed another act-5 deletion allele (ok1397) (Estes et al., 2011), hereafter referred to as act-5(Δ2). The ok1397 deletion removes part of the promoter region and the first two exons (Figure 1—figure supplement 1). We examined this allele for the presence of any transcripts and identified a new isoform which is present in mutants but not in wild type (see Materials and methods) and consists of only 3’ sequence (Figure 1—figure supplement 1). As with the act-5(Δ1) deletion allele, we found no changes in act-5 or act-3 mRNA levels in act-5(Δ2) mutants compared to wild type (Figure 1B).
In multicellular organisms, paralogous genes are often expressed in distinct spatiotemporal patterns, an indication of subfunctionalization (Guschanski et al., 2017). For example, in C. elegans, act-3 is expressed in the pharynx (Hunt-Newbury et al., 2007) while act-5 is expressed in intestinal cells (MacQueen et al., 2005). The models of transcriptional adaptation suggest a cell-autonomous mechanism, that is the mutant mRNA can cell-autonomously trigger transcriptional adaptation. In order to test this hypothesis, we generated transcriptional reporter constructs with the act-3 or act-5 promoter region driving the expression of a red florescent protein gene (Merzlyak et al., 2007). As expected, we observed expression of the extrachromosomal act-5p::rfp transgene in the intestine in wild-type animals (Figure 2A) as well as in act-5(ptc) mutants (Figure 2—figure supplement 1). Likewise, expression of the extrachromosomal act-3p::rfp transgene was only observed in the pharynx in wild-type animals (Figure 2B), consistent with previous studies (Hunt-Newbury et al., 2007). However, extrachromosomal act-3p::rfp expression was also observed in the intestine in act-5(ptc) mutants (Figure 2C), consistent with transcriptional adaptation. In summary, we saw upregulation of expression from a synthetic and extrachromosomal act-3 promoter in tissues where act-5 is expressed, supporting the model that the mutant mRNA cell-autonomously triggers transcriptional adaptation.
Figure 2 with 1 supplement see all
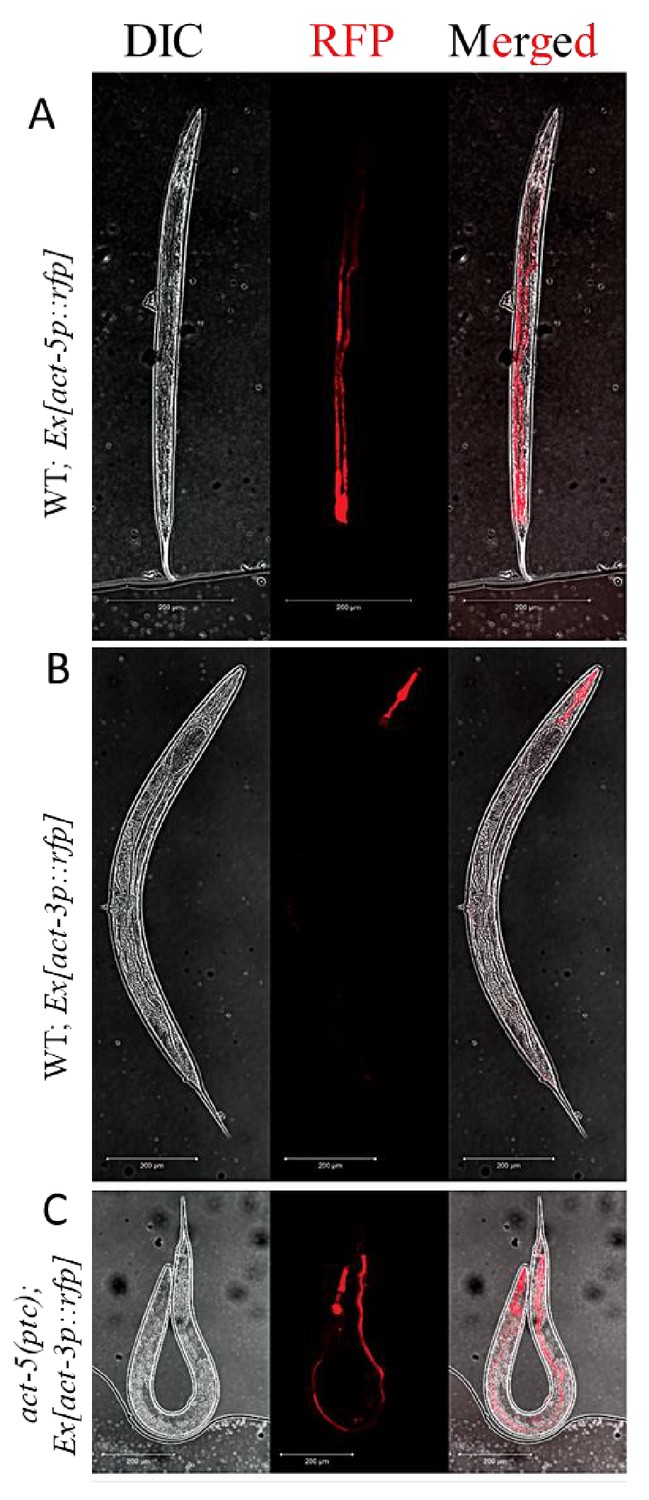
Extrachromosomal reporter expression in WT and mutant alleles.
(A) act-5p::rfp extrachromosomal reporter expression was observed in the intestine in 153 of 300 WT animals. (B) act-3p::rfp extrachromosomal reporter expression was observed in the pharynx in 182 of 400 WT animals. (C) act-3p::rfp extrachromosomal reporter expression was observed in the pharynx and intestine in 138 of 320 act-5(ptc) mutants.
To identify an additional example of transcriptional adaptation in C. elegans, we turned to the titin gene family (Figure 3—source data 1). Due to their size, titin genes are frequent targets of random mutagenesis, and several PTC alleles have been identified (Jorgensen and Mango, 2002; Lipinski et al., 2011). We focused on unc-89 which has many nonsense alleles that do not exhibit an obvious phenotype, potentially indicating functional compensation. We identified three different unc-89 alleles (gk469156, gk509355, gk506355) which exhibit lower levels of mutant mRNA compared to wild type (Figure 3A) and lack an obvious phenotype. Analyzing the mRNA levels of 10 titin related genes (him-4, ttn-1, ketn-1, sax-3, unc-22, unc-52, sax-7, rig-6, unc-40, and unc-73), we found that sax-3 was upregulated in all three unc-89(ptc) alleles (Figure 3—figure supplement 1), both at the mRNA (Figure 3B) and pre-mRNA (Figure 3—figure supplement 2) levels. To test whether this upregulation of sax-3 was due to transcriptional adaptation and not to the loss of UNC-89 function, we generated a 16 kb deletion (bns7000) in unc-89, hereafter referred to as unc-89(Δ), using CRISPR/Cas9 genome editing. This deletion removes part of the promoter region and the first several exons (Figure 3—figure supplement 1). Hence, most unc-89 isoforms are not observed in unc-89(Δ) mutants (Figure 3A). Homozygous unc-89(Δ) worms are maternal-effect sterile and exhibit growth defects, phenotypes not observed in the unc-89(ptc) alleles. In the RNA-less unc-89(Δ) allele, sax-3 was not upregulated (Figure 3B), indicating that sax-3 upregulation is not due to the loss of UNC-89 function and that the mutant mRNA needs to be present for the transcriptional adaptation response. Thus, sax-3 upregulation in the unc-89(ptc) alleles is a second example of transcriptional adaptation in C. elegans.
Figure 3 with 3 supplements see all
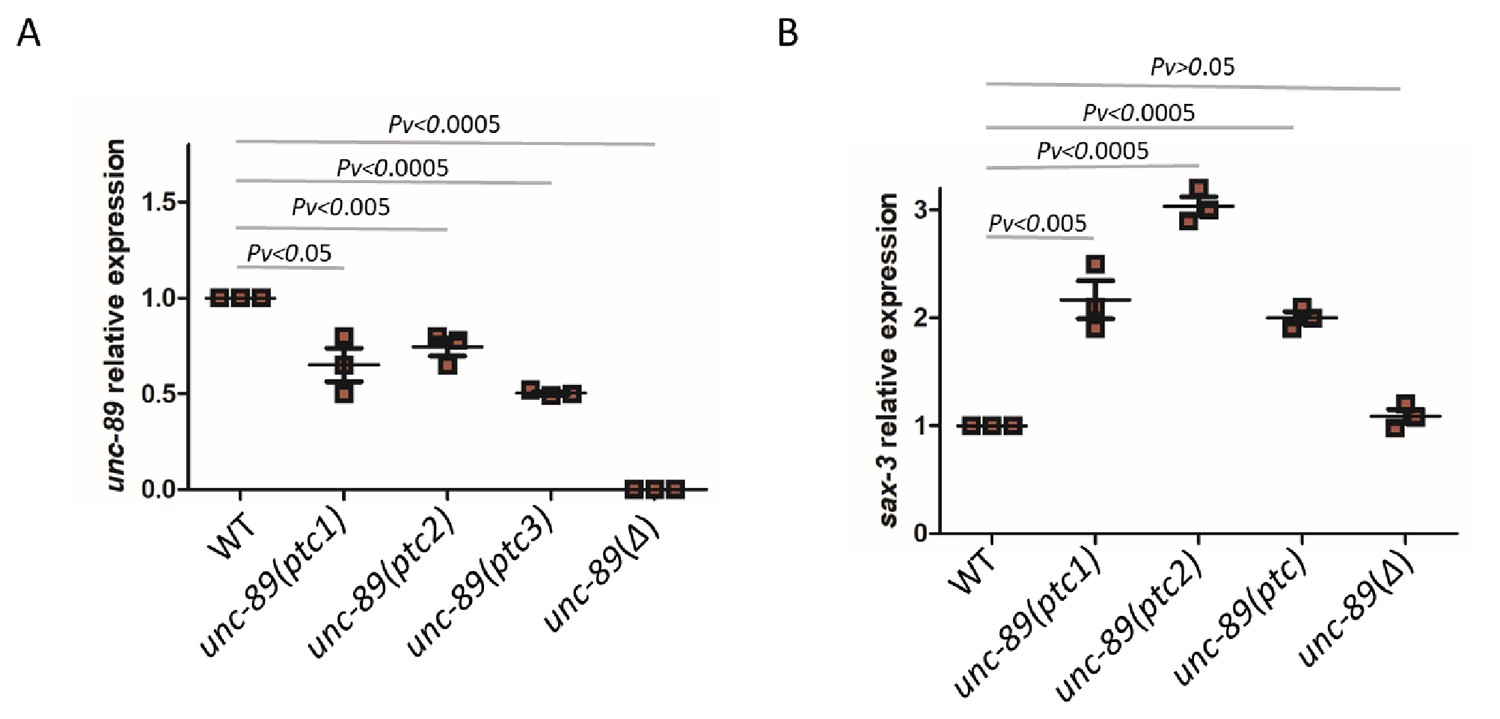
mRNA levels of unc-89 and sax-3 in WT and mutant alleles.
qPCR analysis of unc-89 (C) and sax-3 (D) mRNA levels in WT and unc-89(ptc1), unc-89(ptc2), unc-89(ptc3), and unc-89(Δ) mutants. sax-3 mRNA levels in unc-89 alleles are upregulated when unc-89 mutant mRNA levels are reduced, except in the deletion allele. WT expression levels are set at 1. Data are mean ± S.E.M.; average dCt values are shown in Figure 3—source data 2. Two-tailed Student’s t-test was used to calculate P values.
-
Figure 3—source data 1
List of ttn-1 paralogous genes based on WormBase release WS266.
- https://cdn.elifesciences.org/articles/50014/elife-50014-fig3-data1-v1.pdf
-
Figure 3—source data 2
Average dCt values from qPCR analysis of unc-89 and sax-3 mRNA levels in WT and unc-89 mutants.
- https://cdn.elifesciences.org/articles/50014/elife-50014-fig3-data2-v1.pdf
-
Figure 3—source data 3
Distance, in nucleotides, from each PTC to the next exon-intron junction and to the stop codon in each unc-89 isoform in the unc-89(ptc1), unc-89(ptc2), and unc-89(ptc3) alleles.
‘-’ indicates the absence of the PTC from the isoform.
- https://cdn.elifesciences.org/articles/50014/elife-50014-fig3-data3-v1.pdf
To test whether the observed changes in gene expression in act-5(ptc) and unc-89(ptc) mutants were specific, we measured unc-89 and sax-3 expression in act-5(ptc) mutants as well as act-5 and act-3 expression in unc-89(ptc) mutants. We observed no significant differences (Figure 3—figure supplement 3), suggesting that there is specificity to the gene expression changes.
Identifying additional regulators of transcriptional adaptation
The mutant mRNA has been reported to activate transcriptional adaptation in zebrafish embryos and mouse cell lines (El-Brolosy et al., 2019; Ma et al., 2019). In order to identify additional factors involved in transcriptional adaptation, we performed a candidate RNA interference (RNAi) screen, focusing on genes involved in RNA metabolism (Figure 4—source data 1). We knocked down genes involved in mRNA processing including splicing and nonsense-mediated decay, as well as other genes involved in small RNA synthesis and maturation. We measured the mRNA levels of the mutant and adapting genes in order to position RNAi candidates upstream or downstream of mRNA decay. If the gene targeted by RNAi is required for mutant mRNA decay, we expect to see the mRNA levels of the mutant and adapting genes to be similar to wild-type levels. If the gene targeted by RNAi is involved in transcriptional adaptation downstream of mutant mRNA decay, we expect to see the levels of mutant mRNA remaining lower than in wild type, but the levels of the adapting gene’s mRNA to be similar to wild-type levels. Finally, if the gene targeted by RNAi is not involved in transcriptional adaptation, we expect to see the levels of mutant mRNA remain lower than in wild type and the expression levels of the adapting gene to remain higher than in wild type. For example, when we knocked down drsh-1, a gene involved in miRNA biogenesis (Denli et al., 2004), we saw no significant changes in the mRNA levels of the mutant or adapting genes compared to control (Figure 4—figure supplement 1A,B,C,D), suggesting that drsh-1 is not involved in regulating transcriptional adaptation.
Transcriptional adaptation requires the activity of decay factors (El-Brolosy et al., 2019; Ma et al., 2019), and UPF1, SMG6, and XRN1 were reported to be differentially required in various zebrafish embryo and mouse cell line models of transcriptional adaptation (El-Brolosy et al., 2019). In order to test whether NMD factors are involved in regulating transcriptional adaptation in C. elegans, we knocked down several NMD genes including smg-2 (the C. elegans orthologue of Upf1), smg-4 (Upf3) and smg-6 (Smg6). Knockdown of smg-2 and smg-4 blocked the transcriptional adaptation response in all three unc-89(ptc) alleles but not in the act-5(ptc) allele (Figure 4). Conversely, knockdown of smg-6 blocked the transcriptional adaptation response in the act-5(ptc) allele but not in the three unc-89(ptc) alleles (Figure 4). A differential requirement for Upf1 and Smg6 between gene models was also observed in mouse cells (El-Brolosy et al., 2019).
Figure 4 with 3 supplements see all
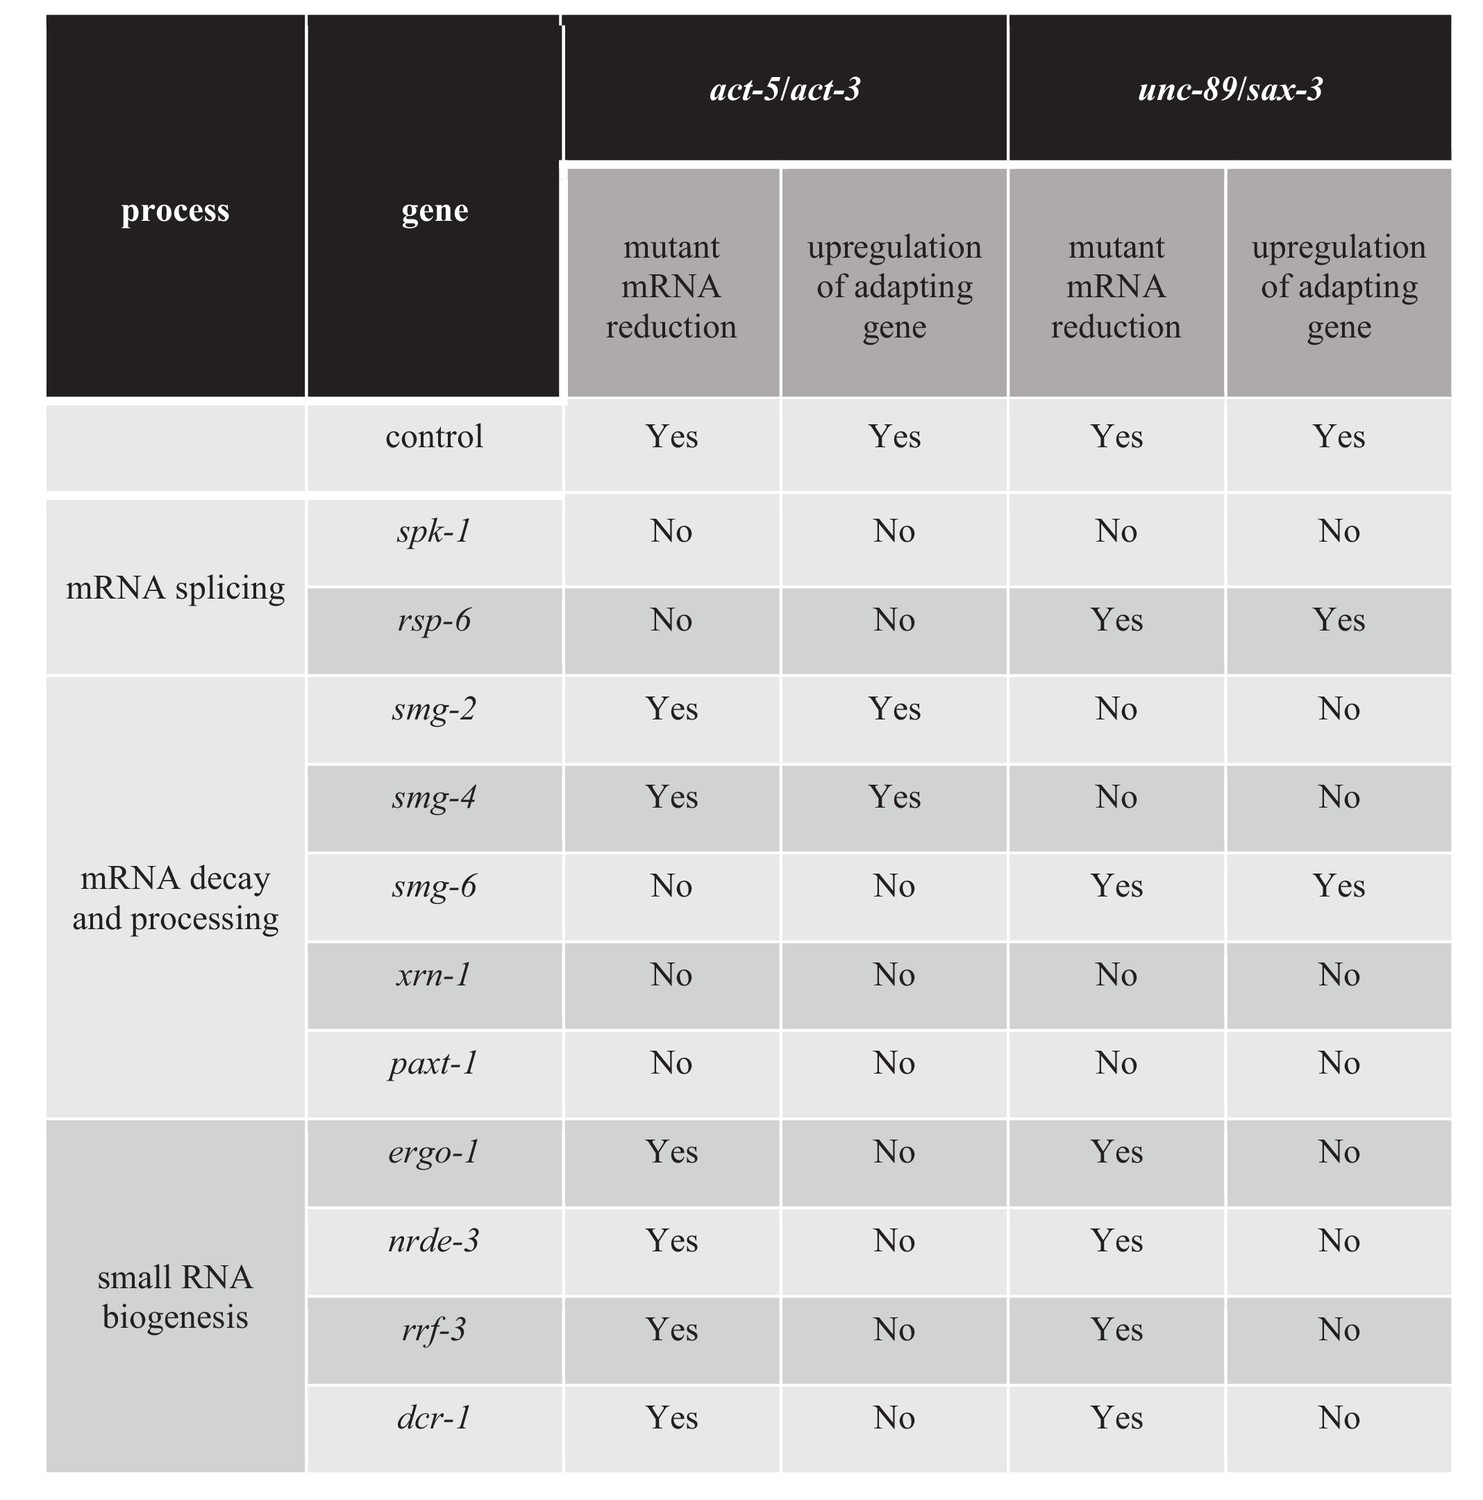
Factors regulating transcriptional adaptation identified in RNAi-mediated knockdown screen.
-
Figure 4—source data 1
List of genes and RNAi clones tested in the screen; average dCt values of qPCR analyses of act-5 and act-3 mRNA levels in WT and act-5 mutants as well as of unc-89 and sax-3 mRNA levels in WT and unc-89 mutants.
- https://cdn.elifesciences.org/articles/50014/elife-50014-fig4-data1-v1.xlsx
As RNAi efficiency can vary in different tissues (Ratliff et al., 2006; Zhuang and Hunter, 2011), we generated double mutant strains with smg-2, smg-4, or smg-6 mutant alleles and the act-5(ptc) and unc-89(ptc) alleles to exclude the possibility of tissue-specific knockdown. Analysis of the double mutant strains confirmed the observations made in the RNAi experiments (Figure 5). For example, we found that the levels of act-5 mRNA were lower in smg-2; act-5(ptc) and smg-4; act-5(ptc) double mutants than in smg-2 and smg-4 single mutants, and that the levels of the adapting gene’s mRNA were higher (Figure 5—source data 1), further indicating that smg-2 and smg-4 are not required for transcriptional adaptation in the act-5 model. However, in smg-4; unc-89(ptc) animals, the mRNA levels of the mutant (unc-89) and adapting (sax-3) genes were similar to those in smg-4 single mutants. Furthermore, these animals exhibited a mild uncoordinated phenotype and grew slowly, suggesting a lack of functional compensation. These data further indicate that smg-4 is required for transcriptional adaptation in the unc-89 model. We could not obtain smg-6; act-5(ptc) viable mutants due to severe larval lethality, possibly as a consequence of blocking the transcriptional adaptation response, that is act-3 upregulation. smg-6; unc-89(ptc) mutants exhibited lower levels of unc-89 mRNA and higher levels of adapting gene mRNA in comparison to single smg-6 mutants (Figure 5—source data 1) similar to the observations in the RNAi experiments. Thus, there are differential requirements for decay factors in different models of transcriptional adaptation.
Figure 5 with 1 supplement see all

Factors regulating transcriptional adaptation analyzed in double mutants.
-
Figure 5—source data 1
List of genes and alleles for each gene tested in the double mutant analysis; average dCt values from qPCR analyses of act-5 and act-3 mRNA levels in WT and act-5 mutants as well as of unc-89 and sax-3 mRNA levels in WT and unc-89 mutants.
- https://cdn.elifesciences.org/articles/50014/elife-50014-fig5-data1-v1.xlsx
Previous data indicate that the exonuclease Xrn1 is involved in regulating the transcriptional adaptation response in mouse cells (El-Brolosy et al., 2019). Therefore, we tested the role of exonucleases in transcriptional adaptation in C. elegans, specifically the exonuclease gene xrn-1 (Jones et al., 2012) and the XRN-2 partner gene paxt-1 (Miki et al., 2014) (Figure 4). We found that knocking down xrn-1 or paxt-1 led to mutant (act-5 and unc-89) mRNA levels similar to wild-type levels. Furthermore, the transcriptional adaptation response was blocked, suggesting that the degradation and processing of mutant transcripts is important to trigger transcriptional adaptation.
We next looked for additional factors required for transcriptional adaptation. Pre-mRNA splicing and NMD are closely related processes via the positioning and use of the exon junction complex (EJC) (Lejeune and Maquat, 2005; Kashima et al., 2010; Fukumura et al., 2016). SR-protein kinases (SRPK) and their substrates, serine/arginine-rich (SR) splicing factors, are key components of the splicing machinery and are well conserved across phyla (Kuroyanagi et al., 2000; Black, 2003; Galvin et al., 2011). Multiple SR proteins are components of the EJC (Singh et al., 2012), consistent with a previously suggested role of SR proteins in mRNA surveillance (Zhang and Krainer, 2004). Knocking down the SRPK gene spk-1 resulted in mutant mRNA levels similar to wild-type levels, and blocked transcriptional adaptation in all act-5 and unc-89 ptc alleles (Figure 4—figure supplement 2A,B,C,D). We also identified the SR family gene rsp-6 as a regulator of transcriptional adaptation in the act-5 model, but were unable to identify a single SR protein whose knockdown influenced the transcriptional adaptation response in the unc-89 model (Figure 4—source data 1), possibly due in part to the complexity of the unc-89 gene structure including the large number of isoforms (Tourasse et al., 2017).
The next group of genes we targeted encode factors involved in small RNA (sRNA) biogenesis, maturation and transport into the nucleus. We tested several pathways (Figure 4—source data 1) and observed that the argonaute proteins ERGO-1 and NRDE-3, the RNA-dependent RNA polymerase RRF-3, as well as the ribonuclease DCR-1 regulate the transcriptional adaptation response downstream of mRNA decay (i.e., the mutant mRNA was still degraded but the adapting gene was not upregulated) (Figure 4, Figure 4—figure supplement 3A,B,C,D, Figure 4—source data 1). These RNAi data were confirmed by analyzing double mutants of the act-5(ptc) or unc-89(ptc) alleles with ergo-1, nrde-3, and rrf-3 (Figure 5), and all these animals exhibited phenotypes comparable to the act-5 or unc-89 deletion alleles analyzed in this study including larval lethality, slow growth and uncoordinated movements, indicating lack of functional compensation. Notably, ERGO-1, NRDE-3, RRF-3, and DCR-1 are involved in 26G RNA biogenesis (Pavelec et al., 2009; Vasale et al., 2010; Fischer, 2010; Grishok, 2013; Yvert, 2014), suggesting that 26G RNAs could play a role in transcriptional adaptation.
Together, these results indicate that mRNA decay as well as small RNA biogenesis and transport are critical in triggering transcriptional adaptation.
Discussion
Recent advances in reverse genetic tools have significantly expanded our ability to generate genetic modifications in a wide range of organisms (Housden et al., 2017). However, some engineered mutants exhibit no apparent phenotype, renewing interest in the concept of genetic robustness. Genetic compensation, and in particular transcriptional adaptation, have been proposed as a means to achieve genetic robustness upstream of protein feedback loops. Despite the potential importance of transcriptional adaptation, its underlying molecular mechanisms remain relatively unexplored. Here, we report two cases of transcriptional adaptation in C. elegans. By carrying out a small RNAi screen and a follow up analysis using double mutants, we identified several new factors that regulate transcriptional adaptation and further validated previously identified ones.
In the C. elegans act-5 model, the mutant gene and related adapting gene (act-5 and act-3, respectively) are primarily expressed in distinct tissues. However, using an extrachromosomal transcriptional reporter, we observed that in act-5(ptc) mutants, the act-3 promoter adapts to drive transcription in the primary site of act-5 expression, the intestine. As act-5(ptc) mutants do not exhibit any obvious phenotype when the transcriptional adaptation response is intact, we predict that ACT-3 and/or other proteins are able to compensate for the loss of ACT-5. Indeed, when we disrupted transcriptional adaptation, act-5(ptc) mutants did not survive. Thus, transcriptional adaptation can in some cases entail the change in the pattern of expression of related gene(s) and suppress phenotypes that would alter the animal’s fitness.
Based on the factors identified in this study, we hypothesize that the transcriptional adaptation response consists of at least three critical processes: mutant mRNA decay, sRNA maturation and sRNA transport. In terms of mutant mRNA decay, we found that the machinery can be gene-specific. In our experiments, SMG-6 is involved in act-5(ptc) mRNA decay, while SMG-2 (UPF1) and SMG-4 (UPF3) impact unc-89(ptc) mRNA decay. Similar observations were made in mouse Actb and Rela mutant cells in which siRNA-mediated knock down of SMG6 blocked the transcriptional adaptation response in Actb mutant mESCs but had little influence on Rela mutant MEFs. Conversely, siRNA-mediated knockdown of UPF1 blocked the transcriptional adaptation response in Rela mutant MEFs but not in Actb mutant mESCs (El-Brolosy et al., 2019). Consistently, mutant mRNA decay can involve different factors in the same organism (Nickless et al., 2017), possibly due to differential expression of the decay factors. However, we cannot exclude the possibility that SMG6 could function as a decay factor independent of NMD, especially since it has been reported to have NMD-independent cleavage activity (Gehring et al., 2005; Glavan et al., 2006; Huntzinger et al., 2008; Chakrabarti et al., 2014).
Transcriptional adaptation can be triggered by the degradation products of the mutant mRNA (El-Brolosy et al., 2019), which could seed the generation of sRNAs (Mattick and Makunin, 2005; Boivin et al., 2018). We found that factors involved in sRNA maturation and transport, including RRF-3, DCR-1, ERGO-1 and NRDE-3, also regulate transcriptional adaptation. Transcriptional modulation of genes by sRNAs of approximately 20–30 nucleotides in length is a widespread and diverse feature of prokaryotes (Melamed et al., 2019) and eukaryotes (Ambros et al., 2003; Yigit et al., 2006; Hutvagner and Simard, 2008; Portnoy et al., 2011; Castel and Martienssen, 2013; Rechavi and Lev, 2017; Billmyre et al., 2019). Notably, the factors we identified are known to be involved in somatic gene regulation by sRNAs, described as the RRF-3 pathway (Gent et al., 2010). RRF-3 is an RNA-dependent RNA polymerase involved along with the DICER complex in the biogenesis of 26-nucleotide RNAs with 5' bias for guanosine monophosphate (26G-RNAs) (Han et al., 2009; Gent et al., 2010; Vasale et al., 2010). 26G sRNAs associate with the Argonaute protein ERGO-1, which is involved in the further maturation of sRNAs and is required to separate the sRNA duplex (Han et al., 2009; Gent et al., 2010; Fischer et al., 2011). Mature sRNAs interacting with Argonaute proteins can direct post-transcriptional gene silencing (Vasale et al., 2010; Phillips et al., 2012), or be transported into the nucleus (Guang et al., 2008; Buckley et al., 2012; Shirayama et al., 2012). NRDE-3 is another Argonaute protein involved in transporting sRNAs into the nucleus (Guang et al., 2008), and we found that knocking it down, and knocking it out, blocked transcriptional adaptation while not affecting mutant mRNA levels. While sRNAs are best known as repressors of gene expression, they can also function as activators (Li et al., 2006; Janowski et al., 2006; Turunen et al., 2009; Portnoy et al., 2011; Wedeles et al., 2013; Li, 2017), although the underlying mechanisms remain poorly understood (Portnoy et al., 2011). Some of these activating sRNAs interact with Argonaute proteins (Seth et al., 2013), and they can target gene regulatory sequences including promoters. Whether they can also interfere with antisense RNAs, which usually function to repress gene expression (Faghihi and Wahlestedt, 2009; Modarresi et al., 2012), is a hypothesis worth testing given our observations in zebrafish embryos and mouse cell lines (El-Brolosy et al., 2019) as well as the previously suggested role of Argonaute proteins in such a process (Ghanbarian et al., 2017).
The transcriptional adaptation factors identified here came from a candidate screen where we specifically targeted pathways involved in RNA metabolism. With this study, we have established C. elegans as a genetic model system to perform unbiased screens to help reveal further mechanisms of transcriptional adaptation, a newly uncovered phenomenon contributing to genetic robustness.
Materials and methods
Key resources table
| Reagent type (species) or resource | Designation | Source or reference | Identifiers | Additional information |
|---|---|---|---|---|
| Gene (Caenorhabditis elegans) | act-1 | CELE_T04C12.6 | WormBase ID: WBGene00000063 | |
| Gene (Caenorhabditis elegans) | act-2 | CELE_T04C12.5 | WBGene00000064 | |
| Gene (Caenorhabditis elegans) | act-3 | CELE_T04C12.4 | WBGene00000065 | |
| Gene (Caenorhabditis elegans) | act-4 | CELE_M03F4.2 | WBGene00000066 | |
| Gene (Caenorhabditis elegans) | act-5 | CELE_T25C8.2 | WBGene00000067 | |
| Gene (Caenorhabditis elegans) | unc-89 | CELE_C09D1.1 | WBGene00006820 | |
| Gene (Caenorhabditis elegans) | sax-3 | CELE_ZK377.2 | WBGene00004729 | |
| Strain, strain background (C. elegans) | N2 | CGC, Bristol strain | wild type | |
| Strain, strain background (C. elegans) | IN2049 | MacQueen et al., 2005 | act-5(ptc); dtIs419[act-5+ rol-6(d)] | |
| Strain, strain background (C. elegans) | IN2051 | MacQueen et al., 2005 | act-5(Δ1); dtIs419[act-5+ rol-6(d)] | |
| Strain, strain background (C. elegans) | VC971 | CGC, Estes et al., 2011 | +/mT1; act-5(Δ2)/mT1 [dpy-10(e128)]. | |
| Strain, strain background (C. elegans) | CB4043 | CGC, Hodgkin et al., 1989 | smg-2(e2008);him-5(e1490) | |
| Strain, strain background (C. elegans) | CB4355 | CGC, Pulak and Anderson, 1993 | smg-4(ma116);him-8(e1490) | |
| Strain, strain background (C. elegans) | TR1396 | CGC, Pulak and Anderson, 1993 | smg-6(r896) | |
| Strain, strain background (C. elegans) | YY168 | CGC, Pavelec et al., 2009 | ergo-1(gg100) | |
| Strain, strain background (C. elegans) | YY158 | CGC, Guang et al., 2008 | nrde-3(gg66) | |
| Strain, strain background (C. elegans) | YY13 | CGC, Pavelec et al., 2009 | rrf-3(mg373) | |
| Strain, strain background (C. elegans) | DYS0005 | This study, crossed IN2049 to N2 | act-5(ptc) | |
| Strain, strain background (C. elegans) | DYS0004 | This study, crossed IN2049 to N2 | +/act-5(Δ1) | |
| Strain, strain background (C. elegans) | DYS0012 | This study, injected in N2 | Ex[act-5p::RFP] | |
| Strain, strain background (C. elegans) | DYS0014 | This study, injected in N2 | Ex[act-3p::RFP] | |
| Strain, strain background (C. elegans) | DYS0015 | This study, crossed DYS0014 to DYS0004 | act-5(ptc);Ex[act-3p::RFP] | |
| Strain, strain background (C. elegans) | DYS0042 | This study, crossed DYS0012 to DYS0005 | act-5(ptc);Ex[act-5p::RFP] | |
| Strain, strain background (C. elegans) | VC40114 | CGC, Million Mutation Project | unc-89(ptc1) | |
| Strain, strain background (C. elegans) | VC40193 | CGC, Million Mutation Project | unc-89(ptc2) | |
| Strain, strain background (C. elegans) | VC40199 | CGC, Million Mutation Project | unc-89(ptc3) | |
| Strain, strain background (C. elegans) | DYS0028 | This study, crossed VC40114 to N2 | unc-89(ptc1) | |
| Strain, strain background (C. elegans) | DYS0030 | This study, crossed VC40193 to N2 | unc-89(ptc2) | |
| Strain, strain background (C. elegans) | DYS0031 | This study, crossed VC40199 to N2 | unc-89(ptc3) | |
| Strain, strain background (C. elegans) | DYS0037 | This study, induced by CRISPR/Cas9 | unc-89(Δ) | |
| Strain, strain background (C. elegans) | DYS0008 | This study, crossed DYS0005 to CB4043 | smg-2(e2008); act-5(ptc) | |
| Strain, strain background (C. elegans) | DYS0057 | This study, crossed DYS0005 to CB4355 | act-5(ptc); smg-4(ma116) | |
| Strain, strain background (C. elegans) | DYS0047 | This study, crossed DYS0028 to CB4355 | unc-89(ptc1); smg-4(ma116) | |
| Strain, strain background (C. elegans) | DYS0048 | This study, crossed DYS0030 to CB4355 | unc-89(ptc2); smg-4(ma116) | |
| Strain, strain background (C. elegans) | DYS0050 | This study, crossed DYS0031 to CB4355 | unc-89(ptc3); smg-4(ma116) | |
| Strain, strain background (C. elegans) | DYS0053 | This study, crossed DYS0028 to TR1396 | unc-89(ptc1); smg-6(r896) | |
| Strain, strain background (C. elegans) | DYS0055 | This study, crossed DYS0030 to TR1396 | unc-89(ptc2); smg-6(r896) | |
| Strain, strain background (C. elegans) | DYS0056 | This study, crossed DYS0031 to TR1396 | unc-89(ptc3); smg-6(r896) | |
| Strain, strain background (C. elegans) | DYS0010 | This study, crossed DYS0005 to YY168 | act-5(ptc); ergo-1(gg100) | |
| Strain, strain background (C. elegans) | DYS0054 | This study, crossed DYS0028 to YY168 | unc-89(ptc1); ergo-1(gg100) | |
| Strain, strain background (C. elegans) | DYS0051 | This study, crossed DYS0030 to YY168 | unc-89(ptc2); ergo-1(gg100) | |
| Strain, strain background (C. elegans) | DYS0052 | This study, crossed DYS0031 to YY168 | unc-89(ptc3); ergo-1(gg100) | |
| Strain, strain background (C. elegans) | DYS0045 | This study, crossed DYS0005 to YY158 | act-5(ptc); nrde-3(gg66) | |
| Strain, strain background (C. elegans) | DYS0065 | This study, crossed DYS0028 to YY158 | unc-89(ptc1); nrde-3(gg66) | |
| Strain, strain background (C. elegans) | DYS0072 | This study, crossed DYS0030 to YY158 | unc-89(ptc2); nrde-3(gg66) | |
| Strain, strain background (C. elegans) | DYS0066 | This study, crossed DYS0031 to YY158 | unc-89(ptc3); nrde-3(gg66) | |
| Strain, strain background (C. elegans) | DYS0046 | This study, crossed DYS0005 to YY13 | rrf-3(mg373); act-5(ptc) | |
| Strain, strain background (C. elegans) | DYS0070 | This study, crossed DYS0028 to YY13 | unc-89(ptc1); rrf-3(mg373) | |
| Strain, strain background (C. elegans) | DYS0062 | This study, crossed DYS0030 to YY13 | unc-89(ptc2); rrf-3(mg373) | |
| Strain, strain background (C. elegans) | DYS0063 | This study, crossed DYS0031 to YY13 | unc-89(ptc3); rrf-3(mg373) | |
| Commercial assay or kit | In-Fusion HD Cloning | Clontech | Clontech:639647 | |
| Commercial assay or kit | Superscript III reverse transcriptase | Takara | Cat. No: 18080–044 | |
| Commercial assay or kit | SMARTer RACE cDNA Amplification Kit | Takara | Cat. N. 634860 | |
| Commercial assay or kit | Advantage 2 PCR kit | Takara | Cat. N. 639207 | |
| RNAi construct | mv_C18D11.4 | BioScience | rsp-8 | |
| RNAi construct | sjj2_C18D11.4 | BioScience | rsp-8 | |
| RNAi constructs | mv_C33H5.12 | BioScience | rsp-6 | |
| RNAi constructs | sjj2_C33H5.12 | BioScience | rsp-6 | |
| RNAi constructs | mv_W02B12.3 | BioScience | rsp-1 | |
| RNAi constructs | sjj2_W02B12.3 | BioScience | rsp-1 | |
| RNAi constructs | mv_D2089.1 | BioScience | rsp-7 | |
| RNAi constructs | sjj2_D2089.1 | BioScience | rsp-7 | |
| RNAi constructs | mv_B0464.5 | BioScience | spk-1 | |
| RNAi constructs | sjj2_B0464.5 | BioScience | spk-1 | |
| RNAi constructs | mv_R05D11.6 | BioScience | paxt-1 | |
| RNAi constructs | sjj2_R05D11.6 | BioScience | paxt-1 | |
| RNAi constructs | mv_F43E2.8 | BioScience | hsp-4 | |
| RNAi constructs | sjj2_F43E2.8 | BioScience | hsp-4 | |
| RNAi constructs | sjj2_Y39G8C.1 | BioScience | xrn-1 | |
| RNAi constructs | mv_Y48G8AL.6 | BioScience | smg-2 | |
| RNAi constructs | sjj2_Y48G8AL.6 | BioScience | smg-2 | |
| RNAi constructs | sjj2_F46B6.3 | BioScience | smg-4 | |
| RNAi constructs | mv_Y54F10AL.2 | BioScience | smg-6 | |
| RNAi constructs | sjj2_Y54F10AL.2 | BioScience | smg-6 | |
| RNAi constructs | mv_F26B1.2 | BioScience | hrpk-1 | |
| RNAi constructs | sjj2_F26B1.2 | BioScience | hrpk-1 | |
| RNAi constructs | mv_F26E4.10 | BioScience | drsh-1 | |
| RNAi constructs | sjj2_F26E4.10 | BioScience | drsh-1 | |
| RNAi constructs | mv_T22A3.5 | BioScience | pash-1 | |
| RNAi constructs | sjj2_T22A3.5 | BioScience | pash-1 | |
| RNAi constructs | sjj2_F26A3.8 | BioScience | rrf-1 | |
| RNAi constructs | mv_ R06C7.1 | BioScience | wago-1 | |
| RNAi constructs | sjj2_ R06C7.1 | BioScience | wago-1 | |
| RNAi constructs | mv_F58G1.1 | BioScience | wago-4 | |
| RNAi constructs | sjj2_F58G1.1 | BioScience | wago-4 | |
| RNAi constructs | sjj2_F10B5.7 | BioScience | rrf-3 | |
| RNAi constructs | mv_M88.5 | BioScience | zbp-1 | |
| RNAi constructs | sjj2_M88.5 | BioScience | zbp-1 | |
| RNAi constructs | sjj2_K12H4.8 | BioScience | dcr-1 | |
| RNAi constructs | mv_T20G5.11 | BioScience | rde-4 | |
| RNAi constructs | sjj2_T20G5.11 | BioScience | rde-4 | |
| RNAi constructs | mv_F36H1.2 | BioScience | kdin-1 | |
| RNAi constructs | mv_K12B6.1 | BioScience | sago-1 | |
| RNAi constructs | sjj2_K12B6.1 | BioScience | sago-1 | |
| RNAi constructs | mv_K08H10.7 | BioScience | rde-1 | |
| RNAi constructs | sjj2_K08H10.7 | BioScience | rde-1 | |
| RNAi constructs | sjj2_R09A1.1 | BioScience | ergo-1 | |
| RNAi constructs | mv_R04A9.2 | BioScience | nrde-3 | |
| RNAi constructs | sjj2_R04A9.2 | BioScience | nrde-3 |
Culture conditions and strains
Request a detailed protocolAll wild-type worms were the N2 reference strain. All C. elegans strains were kept on 6 cm plates with nematode growth medium agar and fed with a lawn of E. coli OP50 grown in 500 μl Luria broth, except for the RNAi mediated knockdown experiments where the worms were fed with E. coli expressing the respective double-stranded RNA. Cultures were maintained at 20°C. Also, to minimize the potential for laboratory evolution of the trait, a new culture of the strains was revived annually from frozen stocks. All plates with fungal or bacterial contamination were excluded from the experiments.
Synchronization of cultures for RNA isolation
Request a detailed protocolWorms from healthy cultures were washed off of plates using M9 buffer and passed through a 41 µm filter (Millipore Cat. No SCNY00040) with vacuum; antibiotics (Ampicillin, Chloramphenicol) were added (50 µg/ml final concentration) to eliminate remaining food bacteria, and the worms were then incubated on a shaker at room temperature for 15 min. Worms were centrifuged at 3000 rpm for 5 min to pellet early larval stage animals. The buffer was aspirated and 1 ml of fresh buffer was added to resuspend the pellet. Samples were confirmed to be primarily L1 and L2 stage larvae by observing two 5 µl samples on a 6 cm nematode growth medium plate. Starving cultures or cultures that had more than one male were excluded from the experiments.
qPCR analysis
Request a detailed protocolTotal RNA from synchronized cultures or manually picked young adults was isolated using TRIzol (ambion by Takara). For reverse transcription (RT), Superscript III reverse transcriptase (Invitrogen, Cat. No: 18080–044) was used following manufacturer's instructions. We used 1–2 μg total RNA for each RT reaction. The qPCR experiments were performed on a CFX Connect Real-Time System (Biorad-Roche Diagnostics) as described previously (El-Brolosy et al., 2019). cdc-42 and Y45F10D.4 (iscu-1) were used as reference genes as described previously (Hoogewijs et al., 2008), and the Ct values ranged from 12.3 to 28.4 for cdc-42 and 11.8 to 26 for Y45F10D.4. The Ct values for all other genes were aimed to be below 30.
The following primers were used to amplify the cDNA of target genes: Y45F10D.4 (forward 5’- CGAGAACCCGCGAAATGTCGGA-3’ and reverse 5’- CGGTTGCCAGGGAAGATGAGGC-3’), cdc-42 (forward 5’-AGCCATTCTGGCCGCTCTCG-3’ and reverse 5’- GCAACCGCTTCTCGTTTGGC-3’), act-1 (forward 5’-ACGACGAGTCCGGCCCATCC-3’ and reverse 5’-GAAAGCTGGTGGTGACGATGGTT-3’), act-2 (forward 5’-GCGCAAGTACTCCGTCTGGATCG-3’ and reverse 5’- GGGTGTGAAAATCCGTAAGGCAGA-3’), act-3 (forward 5’-AAGCTCTTCGCCTTACCATTTTCTC-3’ and reverse 5’-ACAGAGCAAATTGTAGTGGGGTCTTC-3’), act-4 (forward 5’-AGAGGCTCTCTTCCAGCCATCCTTC-3’ and reverse 5’-TGATCTTGATCTTCATGGTGGATGG-3’), act-5 (forward 5’- AAGTGCGATGTCGACATCAGAAAG-3’ and reverse 5’- TAATCTTGATCTTCATTGTGCTTGG-3’), act-5d (forward 5’- AAGTGCGATGTCGACATCAGAAAG-3’ and reverse 5’- TAATCTTGATCTTCATTGTGCTCCGG-3’), unc-89 (forward 5’-AAGGCTGAACTTGTCATCGAAGGAG-3’ and reverse 5’-TCATCTCCACAACATTACCCTCGTG-3’), sax-3 (forward 5’-TGCCGTTTGTCCCGTAACAACTATG-3’ and reverse 5’-ATCTTCTGAAGCTGACGGGGAGAAC-3’), act-3 pre-mRNA (forward 5’-TTTTTCAGAACCATGAAGATCA-3’ and reverse 5’-GAAAATGGTAAGGCGAAGAGC-3’), sax-3 pre-mRNA (forward 5’-TGTAAACCGCACTGCACAAT-3’ and reverse 5’-TCCACCAAGAGCCTGAAAAC-3’). PCR efficiency was determined using external standards on plasmid mini-preparation of cloned PCR products. Expression levels were analyzed by basic relative quantification. qPCR data are based on three biological replicates and three technical replicates for each biological replicate.
Rapid amplification of cDNA ends (RACE)
Request a detailed protocolTotal RNA from manually picked young wild-type and act-5(Δ2) mutant adults was isolated using TRIzol (ambion by Takara). 5’ and 3’ RACE ready cDNA was synthesized by reverse transcription PCR using a SMARTer RACE cDNA Amplification Kit following manufacturer's protocol (Cat. N. 634860, Takara). PCRs were performed using an Advantage 2 PCR kit (Cat. N. 639207, Takara). The following gene-specific primers and nested gene-specific primers were used to amplify 3’ and 5’ cDNA ends: act5GSP2 (5’-ACCACCGGAATCGTTTTGGACACCGGAG-3’), act5NGSP2 (5’-GAAGGATATGCCCTCCCACATGCCATCC-3’), act5GSP1 (5'-AAAAATCAGCTTAGAAGCACTTTCGGTG-3’), act5NGSP1 (5’-TCGATGGGCCGGACTCGTCGTACTCCTG-3’), unc89GSP2 (5’-TTTGGTACCATTTGTATAGAGGCGAGTG-3’), unc89NGSP2 (5’-TTCTGAACTGGACAAATCTTGCTTTTCG-3), unc89N1GSP2 (5’- ACTTTCCAGTATCTCCTGGATGTTGCTTC-3’), and unc89N2GSP2 (5’- TTTGAATACTTTTTGATGAACCGTGTGC-3’). RACE experiment revealed an isoform with an alternative start which is present only in act-5(Δ2) mutants (Figure 1—figure supplement 1A). This new isoform is not affected by the large deletion, and thus the corresponding mRNA is not degraded (Figure 1A).
Plasmid construction and genetic transformation
Request a detailed protocolTo study the expression of act-5, we generated a reporter construct with an act-5 promoter region (2.5 kb from III:13606066 to 13608569) fused to turboRFP in a pUC19 vector. Similarly, a pUC19 vector containing turboRFP was fused with an act-3 promoter region (4.5 kb from V:11073234 to 11077791). The germ line of wild-type animals was injected with the generated plasmids (10 ng ul−1). The transgenic lines were subsequently crossed with act-5(ptc) mutants to transfer the extrachromosomal array to the mutant background.
Confocal microscopy
Request a detailed protocolA Zeiss LSM 700 confocal microscope was used to image adult worms.
RNA interference mediated knockdown
Request a detailed protocolRNAi was performed by feeding double-stranded RNA-expressing bacteria at 25°C from the early larval stage through adulthood (60–75 hr) as previously described (Fraser et al., 2000). For the genes whose knockdown from an early larval stage caused lethality or sterility, we started the RNAi treatment at later stages (L4, adult). Also, for some clones (mv_R05D11.6, sjj2_R05D11.6, sjj2_Y39G8C.1), we diluted the double-stranded RNA-expressing bacteria with empty vector (L4440)-containing bacteria, in order to obtain milder effects. RNAi constructs were obtained from available libraries (Source BioScience) and verified by sequencing. RNAi clones used in this study are listed in the key resources table.
CRISPR/Cas9 induced mutations
Request a detailed protocolTo generate the CRISPR/Cas9-induced unc-89 deletion allele (bns7000), two sgRNAs (final concentration 4 uM each) were injected with Cas9 protein (0.35 ug/ul), and a dpy-10 sgRNA (2.5 uM) was used as a co-injection marker along with a repair oligo (PSdpy-10-PS; 0.73 uM) (Dickinson and Goldstein, 2016).
sgRNA1: 5′-GGTAGTTAGCGACCCCATGAGGG-3′.
sgRNA2: 5′-ACAGACTGGTAAACAAACGAGGG-3′
The following primers were used for genotyping: dunc-89–1 forward (5’-ATACCACCACATGTCTCTTC-3’), dunc-89–2 forward (5’-GCTAAAAGTCAGAGTTCCAC-3’), dunc-89–3 reverse (5’- GGATGGGTTTACATAAAAT-3’), dunc-89–4 reverse (5’-TGAAAAAGAAACAACAAAA-3’), dunc-89–5 forward (5’-TAACAAAAAGCTCAAAATG-3’), dunc-89–6 reverse (5’-GGATAGATTTCTGTTGGAGA-3’). The external primers flank a 19612 bp region in wild types and amplify a 3601 bp fragment in bns7000 mutants. The internal primers with different combinations amplify 500-2600 bp products in wild types.
Double mutant analysis
Request a detailed protocolAll the double mutants exhibited gene expression levels as in the RNAi treated animals with one exception. act-5(ptc); nrde-3 double mutants exhibited act-5 mRNA levels as in the RNAi experiments but also some upregulation of the adapting gene, unlike what was observed in the RNAi experiments (Figures 4 and 5, Figure 5—figure supplement 1A and B). One possible explanation is related to an alternative start site of nrde-3 (Tourasse et al., 2017) which might be used only in some tissues and thus could lead to some protein function in the allele used in our study.
Statistical evaluation
Request a detailed protocolTo calculate the significance of the differences for the expression data, we performed two-tailed Student’s t-test. Mean ± SEM is indicated in graphs. All statistical analyses were implemented in the program Statistica v. 9. Graphs were generated in Prism5.
Gene structure visualization
Request a detailed protocolThe act-5 and unc-89 loci were visualized using the GSDS gene structure visualization tool (Guo et al., 2007).
Data availability
All data generated or analyzed during this study are included in the manuscript and supporting files.
References
-
MicroRNAs and other tiny endogenous RNAs in C. elegansCurrent Biology 13:807–818.https://doi.org/10.1016/S0960-9822(03)00287-2
-
Mechanisms of alternative pre-messenger RNA splicingAnnual Review of Biochemistry 72:291–336.https://doi.org/10.1146/annurev.biochem.72.121801.161720
-
Protein coding genes as hosts for noncoding RNA expressionSeminars in Cell & Developmental Biology 75:3–12.https://doi.org/10.1016/j.semcdb.2017.08.016
-
RNA interference in the nucleus: roles for small RNAs in transcription, epigenetics and beyondNature Reviews Genetics 14:100–112.https://doi.org/10.1038/nrg3355
-
Duplicate genes and robustness to transient gene knock-downs in Caenorhabditis elegansProceedings of the Royal Society of London. Series B: Biological Sciences 271:89–96.https://doi.org/10.1098/rspb.2003.2560
-
Genetic compensation: A phenomenon in search of mechanismsPLOS Genetics 13:e1006780.https://doi.org/10.1371/journal.pgen.1006780
-
Regulatory roles of natural antisense transcriptsNature Reviews Molecular Cell Biology 10:637–643.https://doi.org/10.1038/nrm2738
-
Small RNA-mediated gene silencing pathways in C. elegansThe International Journal of Biochemistry & Cell Biology 42:1306–1315.https://doi.org/10.1016/j.biocel.2010.03.006
-
Regulatory RNAs in Haloferax volcaniiBiochemical Society Transactions 39:159–162.https://doi.org/10.1042/BST0390159
-
The exon junction complex controls the efficient and faithful splicing of a subset of transcripts involved in mitotic Cell-Cycle progressionInternational Journal of Molecular Sciences 17:1153.https://doi.org/10.3390/ijms17081153
-
Biology and mechanisms of short RNAs in Caenorhabditis elegansAdvances in Genetics 83:1–69.https://doi.org/10.1016/B978-0-12-407675-4.00001-8
-
The evolution of duplicate gene expression in mammalian organsGenome Research 27:1461–1474.https://doi.org/10.1101/gr.215566.116
-
A new kind of informational suppression in the nematode Caenorhabditis elegansTrends in Genetics 123:301.
-
Argonaute proteins: key players in RNA silencingNature Reviews Molecular Cell Biology 9:22–32.https://doi.org/10.1038/nrm2321
-
Involvement of AGO1 and AGO2 in mammalian transcriptional silencingNature Structural & Molecular Biology 13:787–792.https://doi.org/10.1038/nsmb1140
-
Distinct 3' UTRs regulate the life-cycle-specific expression of two TCTP paralogs in Trypanosoma bruceiJournal of Cell Science 131:jcs206417.https://doi.org/10.1242/jcs.206417
-
The 5' → 3' exoribonuclease XRN1/Pacman and its functions in cellular processes and developmentWiley Interdisciplinary Reviews: RNA 3:455–468.https://doi.org/10.1002/wrna.1109
-
The art and design of genetic screens: Caenorhabditis elegansNature Reviews Genetics 3:356–369.https://doi.org/10.1038/nrg794
-
Lineage-specific co-evolution of the egf receptor/ligand signaling systemBMC Evolutionary Biology 10:27.https://doi.org/10.1186/1471-2148-10-27
-
Mechanistic links between nonsense-mediated mRNA decay and pre-mRNA splicing in mammalian cellsCurrent Opinion in Cell Biology 17:309–315.https://doi.org/10.1016/j.ceb.2005.03.002
-
RNA Activation1–20, Small RNA-guided transcriptional gene activation (RNAa) in mammalian cells, RNA Activation, Singapore, Springer.
-
The rules and impact of nonsense-mediated mRNA decay in human cancersNature Genetics 48:1112–1118.https://doi.org/10.1038/ng.3664
-
ACT-5 is an essential Caenorhabditis elegans actin required for intestinal microvilli formationMolecular Biology of the Cell 16:3247–3259.https://doi.org/10.1091/mbc.e04-12-1061
-
Small regulatory RNAs in mammalsHuman Molecular Genetics 14:R121–R132.https://doi.org/10.1093/hmg/ddi101
-
Evolution of gene expression after whole-genome duplication: new insights from the spotted gar genomeJournal of Experimental Zoology Part B: Molecular and Developmental Evolution 328:709–721.https://doi.org/10.1002/jez.b.22770
-
Relative importance of βcyto- and γcyto-actin in primary mouse embryonic fibroblastsMolecular Biology of the Cell 28:771–782.https://doi.org/10.1091/mbc.e16-07-0503
-
Genetic robustness and functional evolution of gene duplicatesNucleic Acids Research 42:2405–2414.https://doi.org/10.1093/nar/gkt1200
-
Actin and actin-binding proteins A critical evaluation of mechanisms and functionsAnnual Review of Biochemistry 55:987–1035.https://doi.org/10.1146/annurev.bi.55.070186.005011
-
Small RNA and transcriptional upregulationWiley Interdisciplinary Reviews: RNA 2:748–760.https://doi.org/10.1002/wrna.90
-
mRNA surveillance by the Caenorhabditis elegans smg genesGenes & Development 7:1885–1897.https://doi.org/10.1101/gad.7.10.1885
-
Transgenic expression of CYP7A1 in LDL receptor-deficient mice blocks diet-induced hypercholesterolemiaJournal of Lipid Research 47:1513–1520.https://doi.org/10.1194/jlr.M600120-JLR200
-
Cells lacking β-actin are genetically reprogrammed and maintain conditional migratory capacityMolecular & Cellular Proteomics 11:255–271.https://doi.org/10.1074/mcp.M111.015099
-
Quantitative RNA-seq meta-analysis of alternative exon usage in C. elegansGenome Research 27:2120–2128.https://doi.org/10.1101/gr.224626.117
-
Protection of germline gene expression by the C. elegans argonaute CSR-1Developmental Cell 27:664–671.https://doi.org/10.1016/j.devcel.2013.11.016
-
'Particle genetics': treating every cell as uniqueTrends in Genetics 30:49–56.https://doi.org/10.1016/j.tig.2013.11.002
-
Involvement of SR proteins in mRNA surveillanceMolecular Cell 16:597–607.https://doi.org/10.1016/j.molcel.2004.10.031
Article and author information
Author details
Alexander Gottschalk

Didier YR Stainier
Funding
Max-Planck-Gesellschaft
- Didier YR Stainier
H2020 European Research Council (694455)
- Didier YR Stainier
The funders had no role in study design, data collection and interpretation, or the decision to submit the work for publication.
Acknowledgements
We thank Z Jiang and A Rossi for discussion and comments on the project; G Jakutis, A Rossi, T Sztal, and W Stainier for comments on the manuscript; A McQueen and A Artyukin for some of the act-5 mutant strains; P Goumenaki and B Grohmann for experimental assistance. Some strains were provided by the CGC, which is funded by the NIH Office of Research Infrastructure Programs (P40 OD010440). The unc-89(bns7000) deletion allele was generated in the genome engineering facility, Max Planck Institute of Molecular Cell Biology and Genetics, Dresden, Germany. Research in the Stainier laboratory is supported in part by the Max Planck Society and the European Research Council, ERC AdG 694455-ZMOD.
Version history
- Received: July 8, 2019
- Accepted: January 2, 2020
- Version of Record published: January 17, 2020 (version 1)
Copyright
© 2020, Serobyan et al.
This article is distributed under the terms of the Creative Commons Attribution License, which permits unrestricted use and redistribution provided that the original author and source are credited.
Metrics
-
- 7,895
- views
-
- 1,047
- downloads
-
- 23
- citations
Views, downloads and citations are aggregated across all versions of this paper published by eLife.
Download links
A two-part list of links to download the article, or parts of the article, in various formats.
Downloads (link to download the article as PDF)
Open citations (links to open the citations from this article in various online reference manager services)
Cite this article (links to download the citations from this article in formats compatible with various reference manager tools)
Transcriptional adaptation in Caenorhabditis elegans
eLife 9:e50014.
https://doi.org/10.7554/eLife.50014
Further reading
-
- Chromosomes and Gene Expression
Splicing is the stepwise molecular process by which introns are removed from pre-mRNA and exons are joined together to form mature mRNA sequences. The ordering and spatial distribution of these steps remain controversial, with opposing models suggesting splicing occurs either during or after transcription. We used single-molecule RNA FISH, expansion microscopy, and live-cell imaging to reveal the spatiotemporal distribution of nascent transcripts in mammalian cells. At super-resolution levels, we found that pre-mRNA formed clouds around the transcription site. These clouds indicate the existence of a transcription-site-proximal zone through which RNA move more slowly than in the nucleoplasm. Full-length pre-mRNA undergo continuous splicing as they move through this zone following transcription, suggesting a model in which splicing can occur post-transcriptionally but still within the proximity of the transcription site, thus seeming co-transcriptional by most assays. These results may unify conflicting reports of co-transcriptional versus post-transcriptional splicing.
-
- Chromosomes and Gene Expression
- Genetics and Genomics
Heterogeneity in endothelial cell (EC) sub-phenotypes is becoming increasingly appreciated in atherosclerosis progression. Still, studies quantifying EC heterogeneity across whole transcriptomes and epigenomes in both in vitro and in vivo models are lacking. Multiomic profiling concurrently measuring transcriptomes and accessible chromatin in the same single cells was performed on six distinct primary cultures of human aortic ECs (HAECs) exposed to activating environments characteristic of the atherosclerotic microenvironment in vitro. Meta-analysis of single-cell transcriptomes across 17 human ex vivo arterial specimens was performed and two computational approaches quantitatively evaluated the similarity in molecular profiles between heterogeneous in vitro and ex vivo cell profiles. HAEC cultures were reproducibly populated by four major clusters with distinct pathway enrichment profiles and modest heterogeneous responses: EC1-angiogenic, EC2-proliferative, EC3-activated/mesenchymal-like, and EC4-mesenchymal. Quantitative comparisons between in vitro and ex vivo transcriptomes confirmed EC1 and EC2 as most canonically EC-like, and EC4 as most mesenchymal with minimal effects elicited by siERG and IL1B. Lastly, accessible chromatin regions unique to EC2 and EC4 were most enriched for coronary artery disease (CAD)-associated single-nucleotide polymorphisms from Genome Wide Association Studies (GWAS), suggesting that these cell phenotypes harbor CAD-modulating mechanisms. Primary EC cultures contain markedly heterogeneous cell subtypes defined by their molecular profiles. Surprisingly, the perturbations used here only modestly shifted cells between subpopulations, suggesting relatively stable molecular phenotypes in culture. Identifying consistently heterogeneous EC subpopulations between in vitro and ex vivo models should pave the way for improving in vitro systems while enabling the mechanisms governing heterogeneous cell state decisions.


