Microbiota regulates visceral pain in the mouse
- University College Cork, Ireland
Figures
Figure 1 with 1 supplement
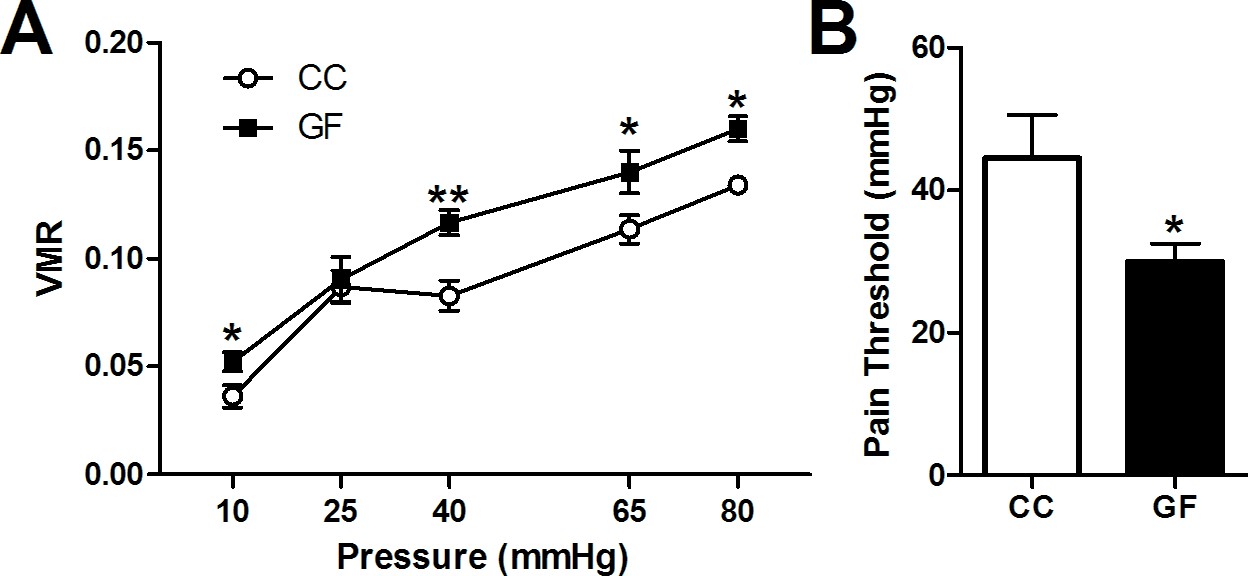
Visceral hypersensitivity in GF mice.
Visceral sensitivity to colorectal distention (CRD; ascending paradigm from 10 to 80 mm Hg) was assessed as the number of visceromotor responses (VMR) over pressures. (A) GF mice displayed increased visceral pain responses compared to controls. (B) The pain threshold was lower in GF compared to CC mice. In this and subsequent figures, *p≤0.05, **p<0.01, and ***p<0.001 versus CC animals. CC, n = 10; GF, n = 9.
Figure 1—figure supplement 1
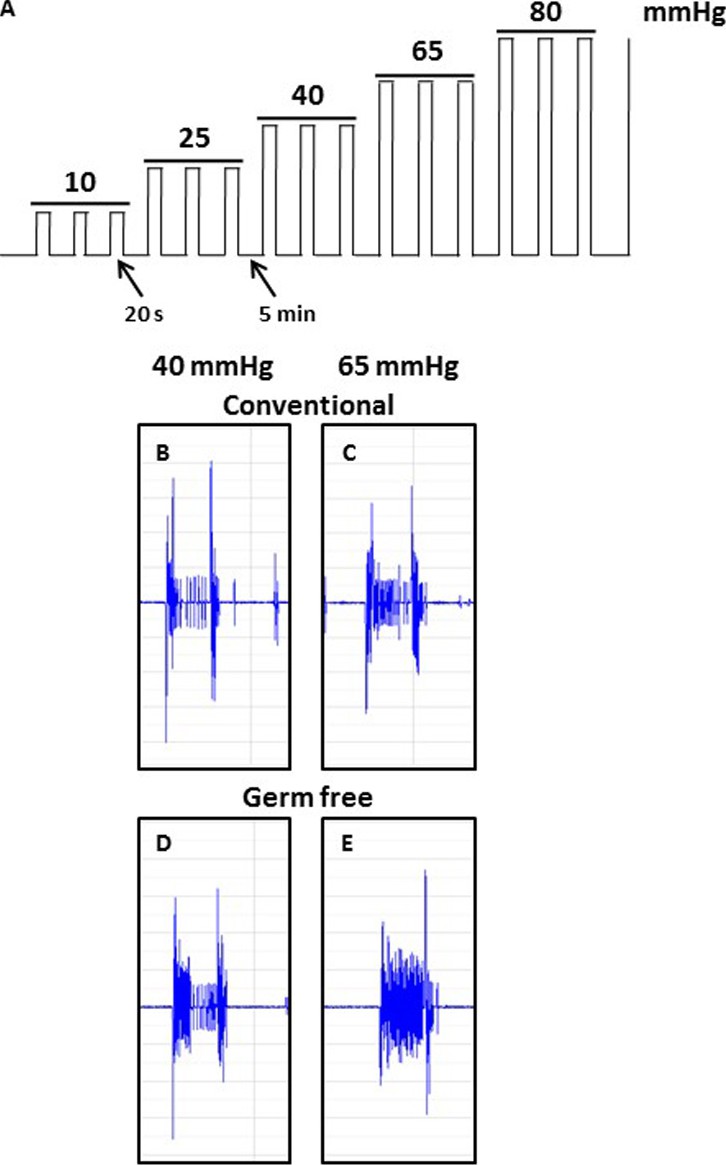
Schematic illustration showing the ascending phasic distension paradigm (10–80 mmHg) (A) and representative CRD traces at the pressure of 40 mmHg and 65 mmHg for conventional (B,C) or germ-free (D, E) mice. The paradigm consists of three repeated pulses at each pressure level, with a pulse duration of 20 s at 5-min intervals.
https://doi.org/10.7554/eLife.25887.004
Figure 2

Increased Toll-like receptor and cytokine gene expression in the spinal cord of GF mice.
(A–H) Gene expression levels of the Toll-like receptors TLR1 (A), TLR2 (B), TLR3 (C), TLR4 (D), TLR5 (E), TLR7 (F), TLR9 (G), and TLR12 (H) were significantly elevated in the spinal cord of GF versus CC mice. (I–M) When compared to controls, GF mice showed increased gene expression levels of the cytokines IL6 (I), TNFα (J), IL10 (K), IL1α (M), and IL1β (N). There was no change in the gene expression of the cytokines IFNγ (L), IL12α (O), and IL12β (P). CC, n = 9–10; GF, n = 9–10.
Figure 3
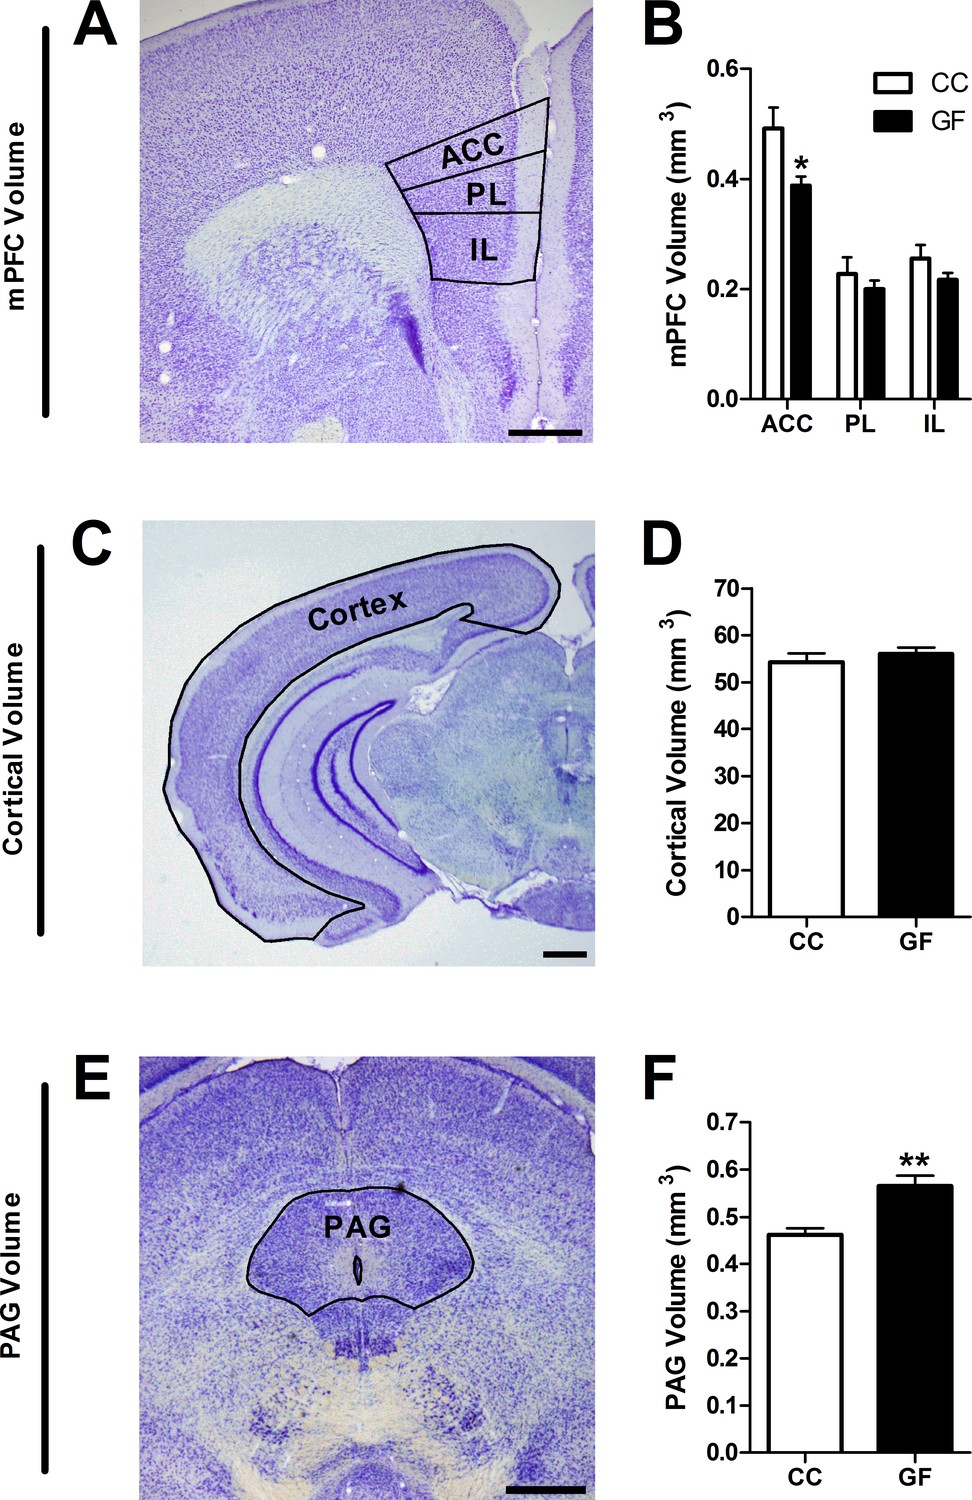
Reduction in ACC and increase in PAG volume in GF mice.
(A,C,E), Representative thionin-stained section of the mPFC (A), cortex (C), and PAG (E). The volumes of the defined (black lines) subregions of interest were estimated using Cavalieri’s principle. Scale bars = 0.5 mm. (B) In GF mice, the volume of the ACC was reduced. (D) Cortical volume did not differ between CC and GF mice. (F) The PAG was larger in GF versus CC mice. CC, n = 5; GF, n = 6–7.
Figure 4 with 1 supplement
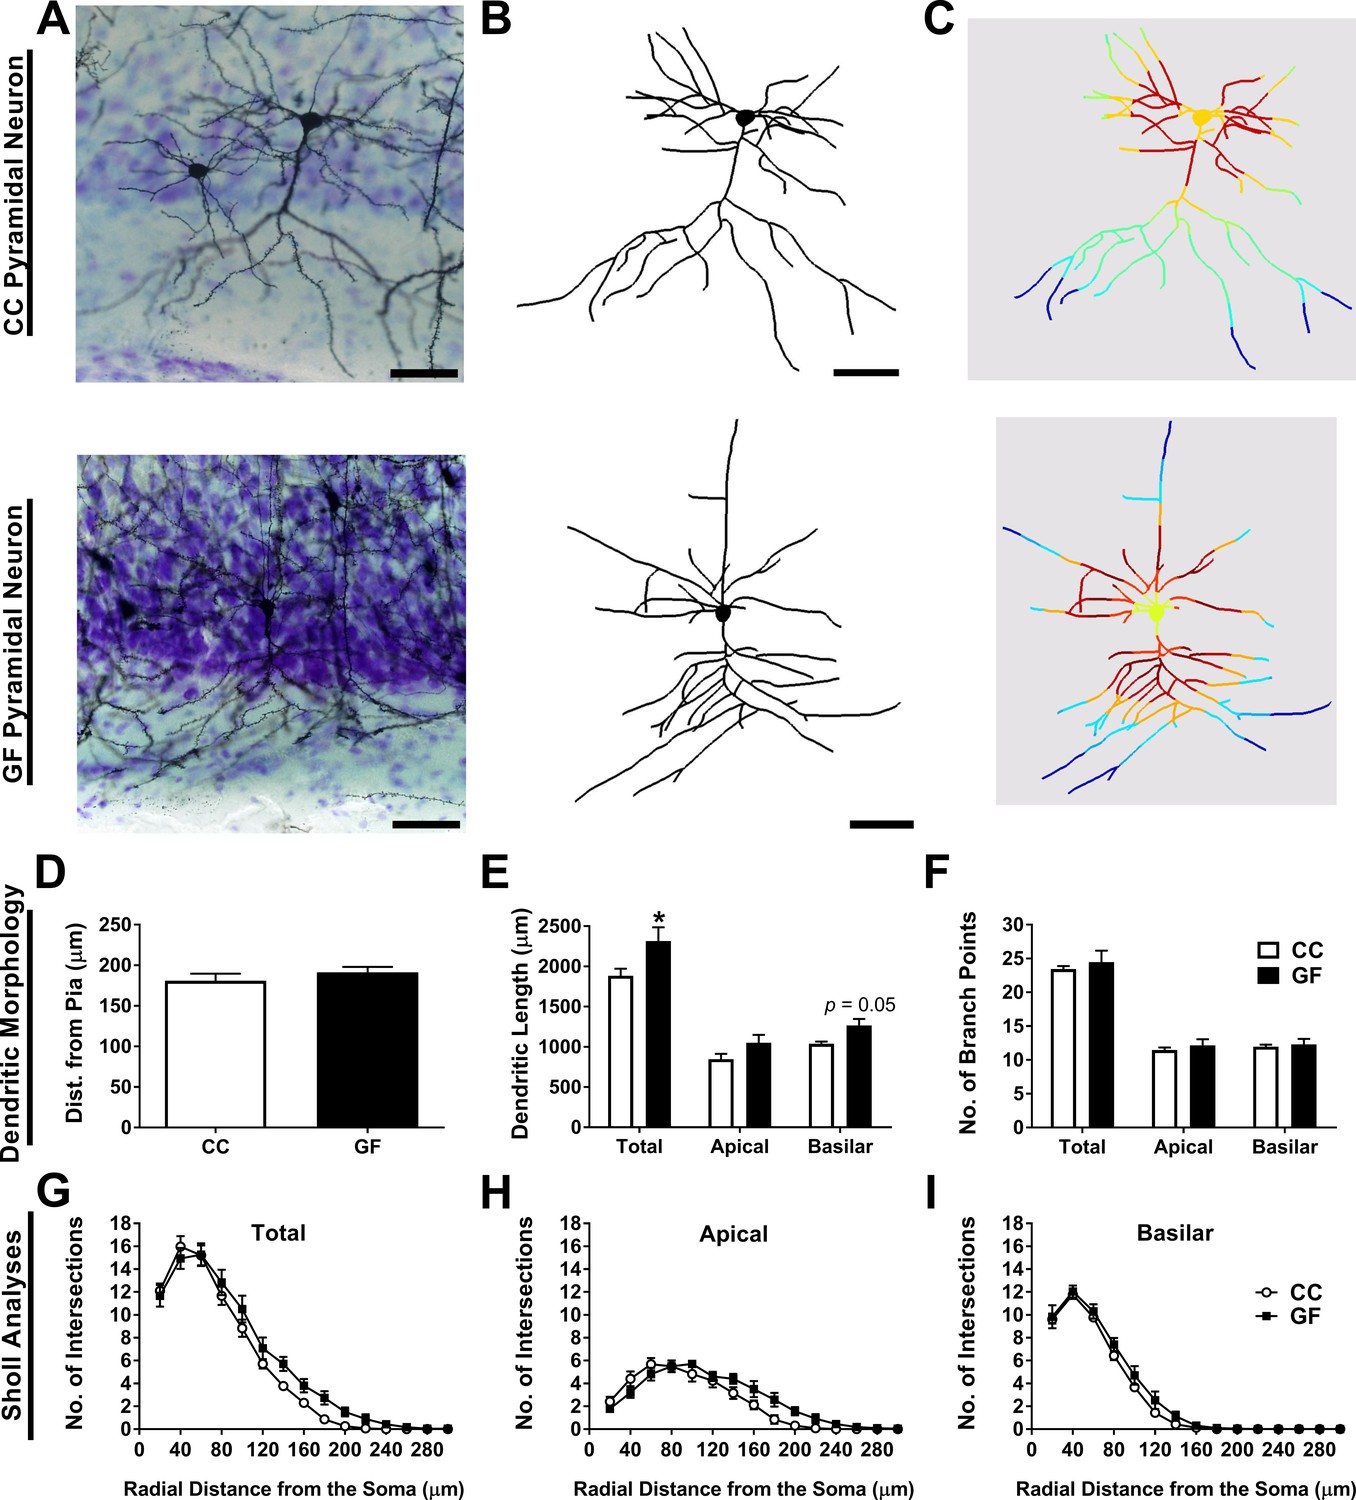
Basilar dendritic elongation in ACC pyramidal neurons of GF mice.
(A,B,C) Representative images of Golgi-stained layer II/III pyramidal neurons of CC and GF mice (A). Neurons were reconstructed in 3D using morphometric software (B). Sholl analysis was performed on 2D renderings of the neurons (incremental radii from the soma are indicated by the color gradient; C). Scale bars = 50 μm. (D) There was no group difference in the topographical location (i.e. cell layer) of the neurons in the ACC. (E) When compared to controls, the dendrites of ACC pyramidal neurons of GF mice were longer. This elongation was principally localized to the basilar dendritic arbor. (F) There was no change in the number of branch points of ACC pyramidal neurons between groups. (G) Sholl analysis of the total dendritic arbor revealed no difference in dendritic complexity between CC and GF mice. (H) In GF mice, the apical dendritic arbor showed altered dendritic complexity; however, post hoc comparisons revealed no statistically significant distances in which this change occurred. (I) There was no group difference in the complexity of basilar dendrites. For both CC and GF mice, n = 5.
Figure 4—figure supplement 1
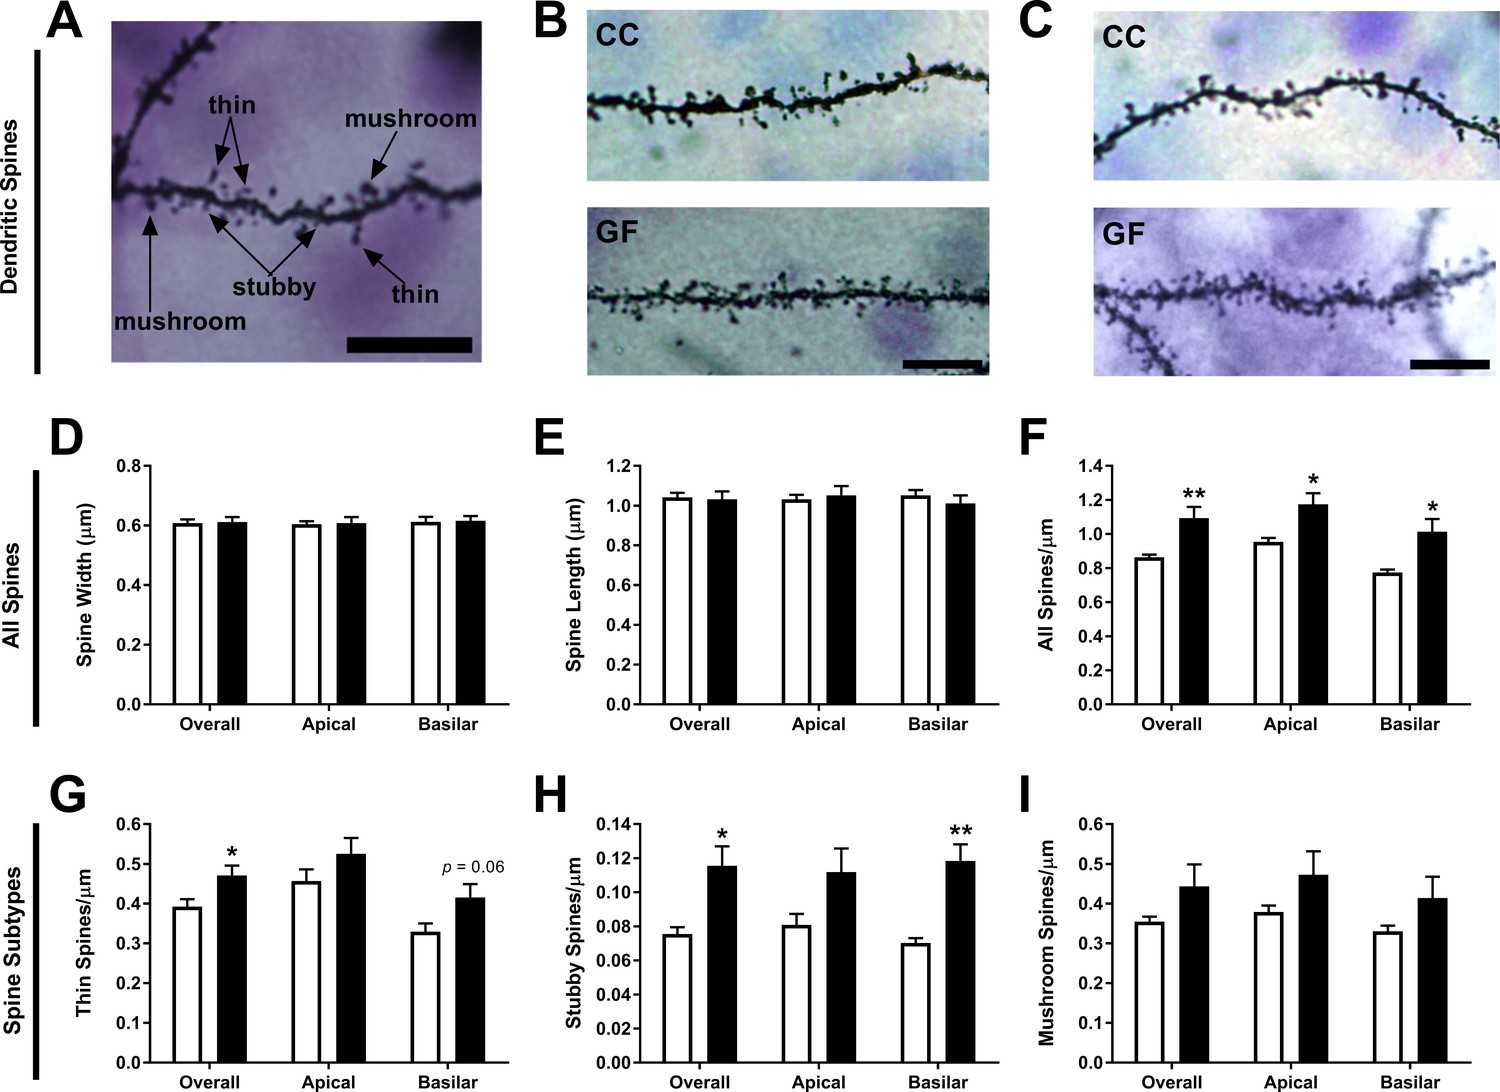
Increase of thin and stubby spines on ACC pyramidal neurons of GF mice.
(A) Image of a dendritic segment with examples of thin, stubby, and mushroom spines. (B,C) Representative images of dendritic spine density from ACC pyramidal neurons of CC (B) and GF mice (C). Scale bars = 10 μm. (D,E) There was no group difference in spine width (D) or length (E). (F) In GF mice, spine density was increased over the entire dendritic arbor. (G) When compared to controls, thin spine density was higher in GF mice, with a trend toward an increase in thin spines on basilar dendrites. (H) In GF mice, stubby spine density was increased overall and on basilar dendrites. (I) There was no significant difference in mushroom spine density in CC compared to GF mice. For both CC and GF mice, n = 5.
Figure 5
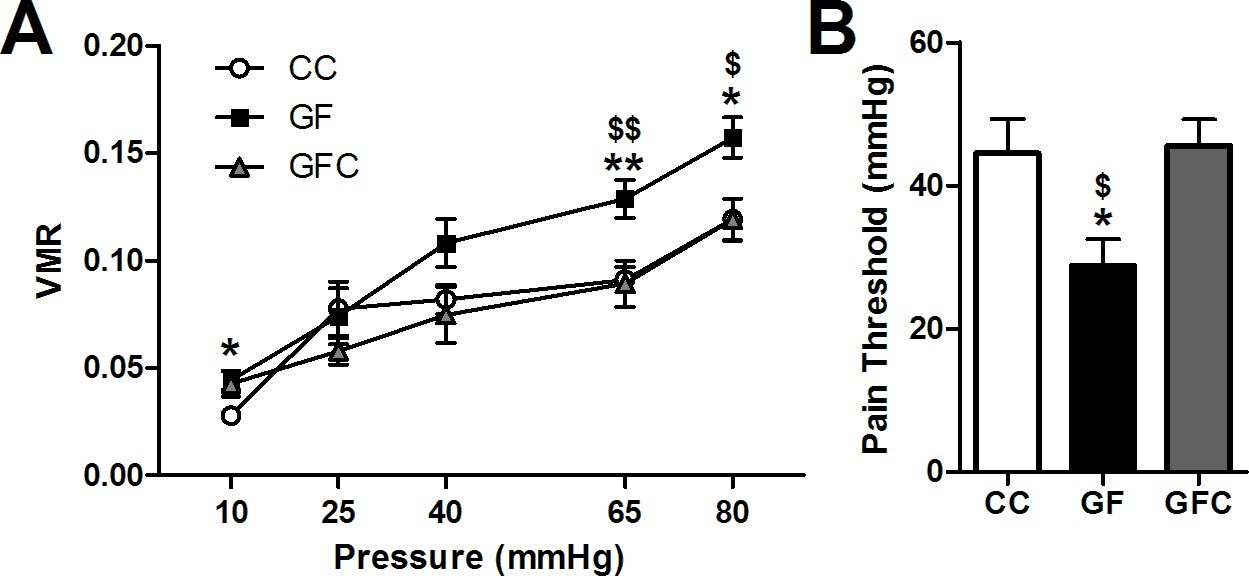
Normalization of visceral hypersensitivity following colonization of GF mice.
(A,B) Microbial colonization restored normal visceral pain responsivity (A) and pain threshold (B). For this and subsequent figures, *p<0.05, **p<0.01, and ***p<0.001 versus CC mice; $p < 0.05; $$p < 0.01 versus GFC mice. CC, n = 10; GF, n = 8; GFC, n = 9.
Figure 6
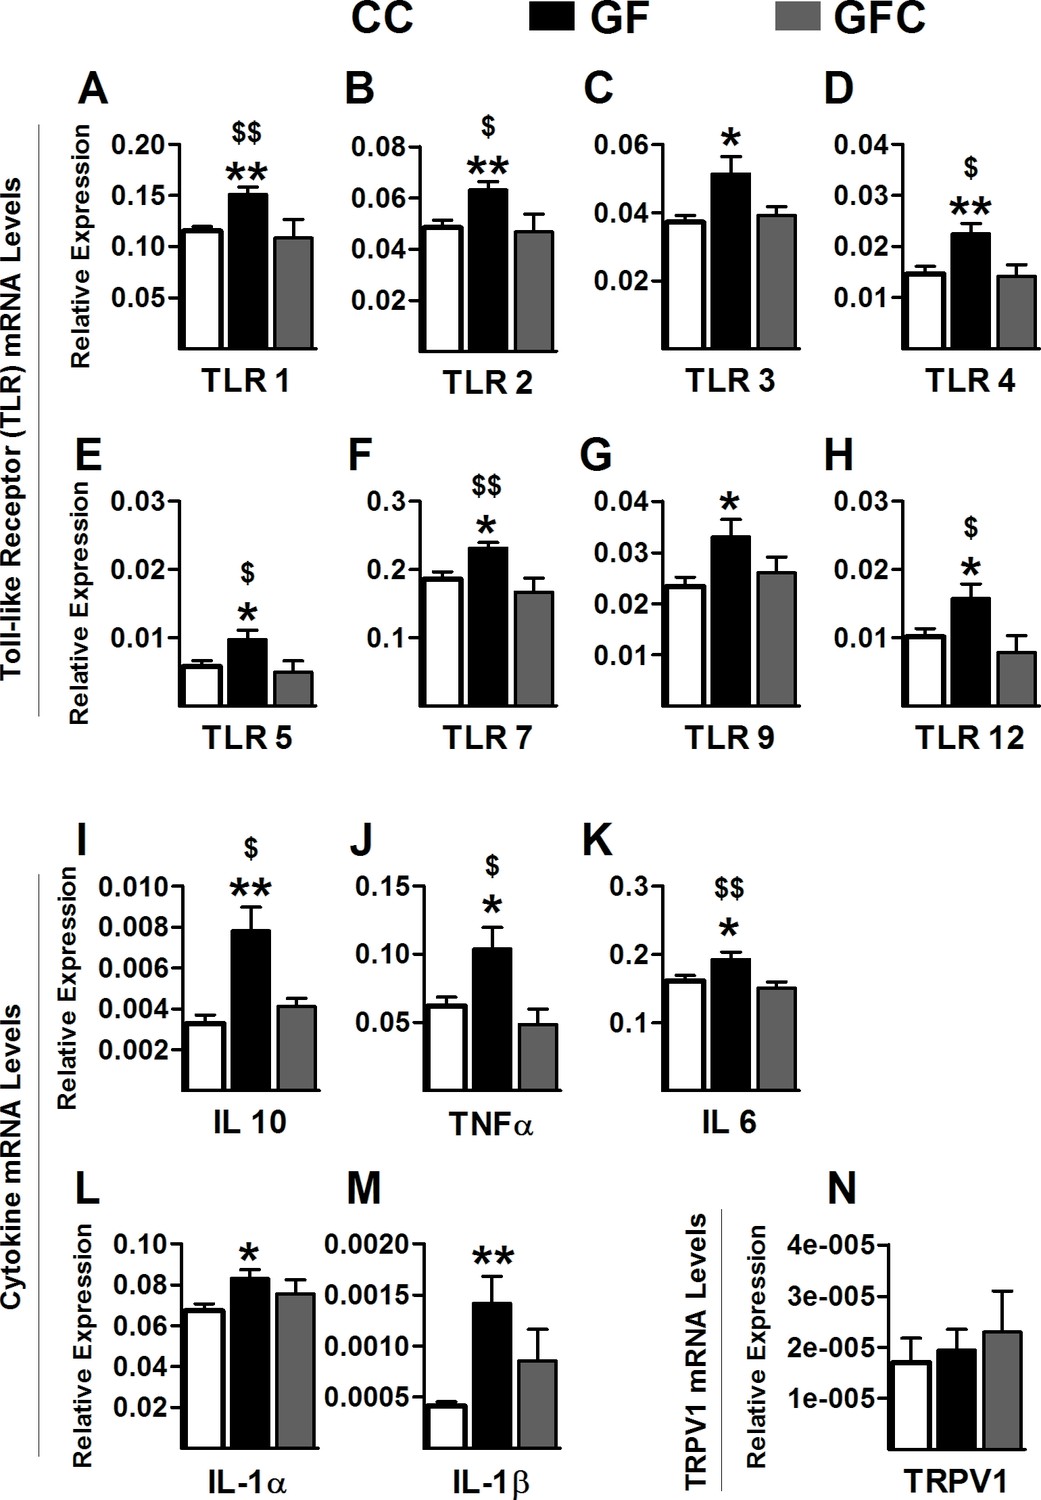
Normalization of toll-like receptor and cytokine gene expression in the spinal cord of GF mice following microbial colonization.
(A–H) Microbial colonization normalized the increased gene expression levels of the toll-like receptors TLR1 (A), TLR2 (B), TLR4 (D), TLR5 (E), TLR7 (F), and TLR12 (H) observed in the spinal cord of GF mice. No changes were observed in the expression levels of TLR3 (C) and TLR9 (G) between GFC and GF mice. (I–M) Microbial colonization reversed the elevated gene expression of the cytokines IL6 (I), TNFα (J), and IL10 (K) in the spinal cord of GF mice. No changes were observed in the expression levels of IL1α (L) and IL1β (M) between GFC and GF mice. (N) No group changes were observed in the expression levels of TRPV1. CC, n = 16–20; GF, n = 15–20; GFC, n = 7–10.
Figure 7
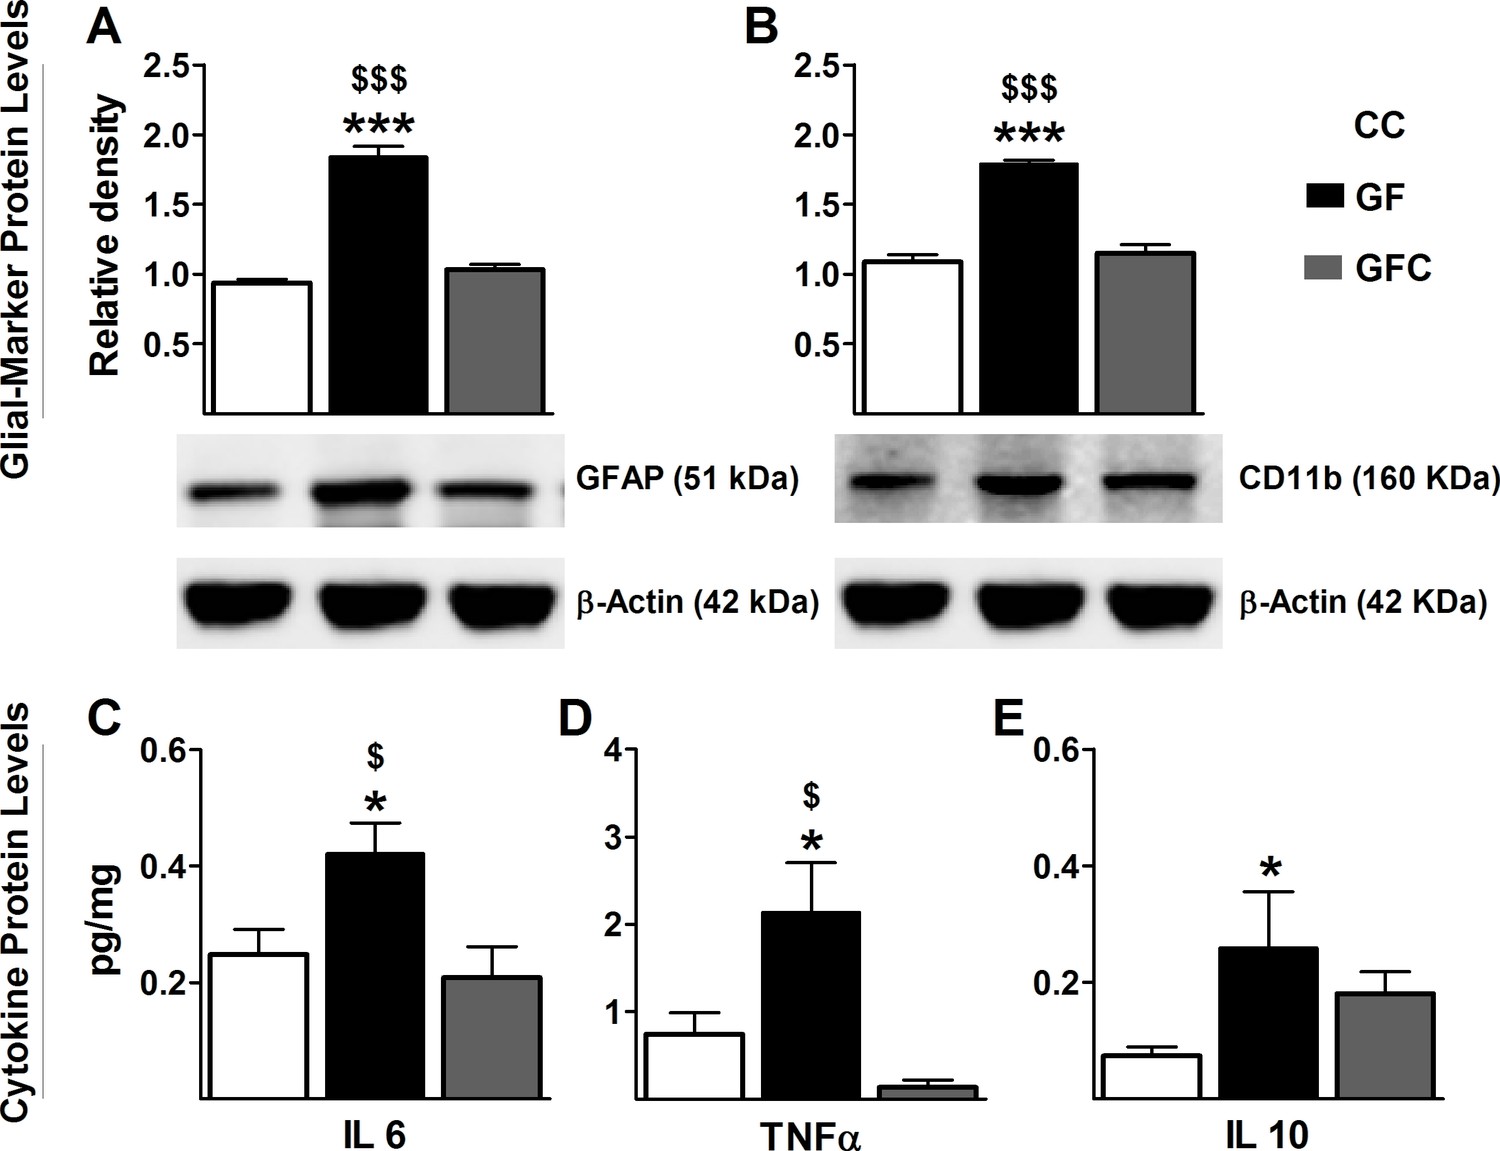
Normalization of glial activation and cytokine protein expression in spinal cord of GF mice following microbial colonization.
Western blot analysis was performed for GFAP (astrocyte marker) and Cd11b (microglial marker) in the lumbosacral region of the spinal cord in CC, GF, and GFC mice. (A,B), The increased expression of both GFAP (A) and CD11b (B) in GF mice was normalized following colonization. (C–E) ELISA assays were performed to assess the protein levels of cytokines. Microbial colonization similarly normalized the elevated protein levels of the cytokines IL6 (C) and TNFα (D) in the spinal cord. However, no change was observed in the expression of IL10 (E) between GFC and GF mice. CC, n = 5–11; GF, n = 6–10; GFC, n = 4–8.
Download links
A two-part list of links to download the article, or parts of the article, in various formats.
Downloads (link to download the article as PDF)
Open citations (links to open the citations from this article in various online reference manager services)
Cite this article (links to download the citations from this article in formats compatible with various reference manager tools)
Microbiota regulates visceral pain in the mouse
eLife 6:e25887.
https://doi.org/10.7554/eLife.25887


