Midbrain dopamine neurons sustain inhibitory transmission using plasma membrane uptake of GABA, not synthesis
- Howard Hughes Medical Institute, Harvard Medical School, United States
- Harvard Medical School, United States
Figures
Figure 1 with 1 supplement
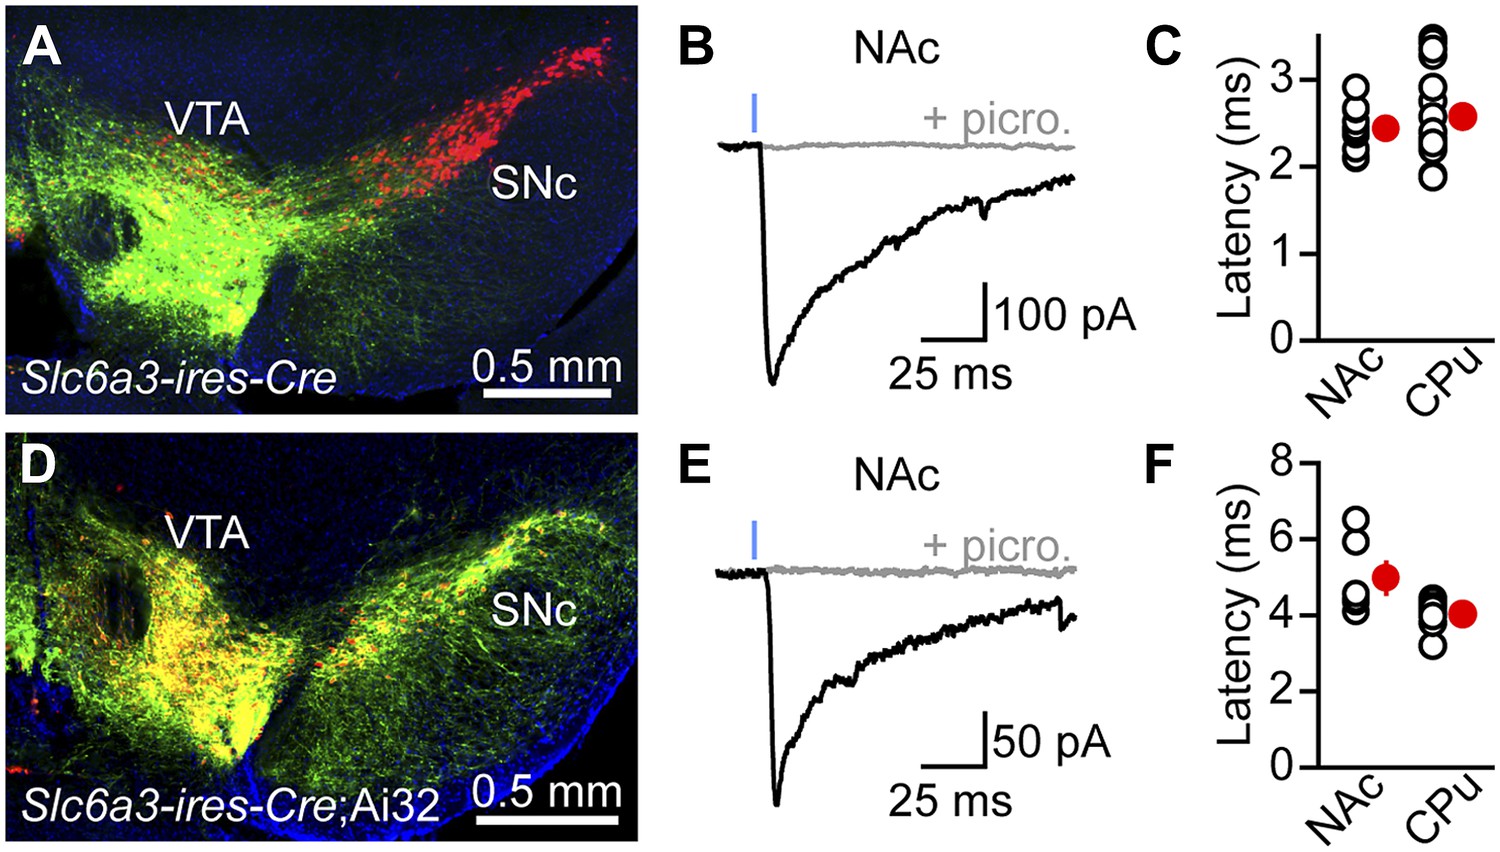
Stimulation of VTA axons evokes GABAergic currents in nucleus accumbens SPNs.
ChR2 was expressed in VTA DA neurons virally (A–C) or genetically (D–F). (A) Coronal cross section of a Slc6a3-ires-Cre mouse ventral midbrain immunolabeled for TH (red) showing viral transduction of ChR2-EYFP in the VTA (green). (B) Representative oIPSC recorded from an indirect-pathway SPN in NAc before (black trace) and after (gray trace) bath application of the GABAA receptor antagonist picrotoxin (100 μM). Blue line depicts a 1-ms full field flash of 473 nm laser light (5 mW·mm−2). All recordings in this and subsequent figures were performed at −70 mV using a high Cl−internal solution in the presence of NBQX (10 μM), R-CPP (10 μM), and CGP55845 (2–5 μM) in the perfusate. (C) Latency from flash onset to oIPSC onset in NAc and dorsal striatum (Caudate/Putamen, CPu) SPNs. For analysis of oIPSCs in CPu, ChR2 was expressed in SNc in a separate cohort of mice. White circles depict individual recordings, red circles are mean ± SEM. (D–F) As in (A–C) for recordings in Slc6a3-ires-Cre;Ai32 mice. Note that the synaptic latency in these mice is significantly longer than in virally transduced Slc6a3-ires-Cre mice in both CPu and NAc (p<0.001, Mann–Whitney test), presumably because of lower ChR2 expression in Ai32 mice.
Figure 1—figure supplement 1
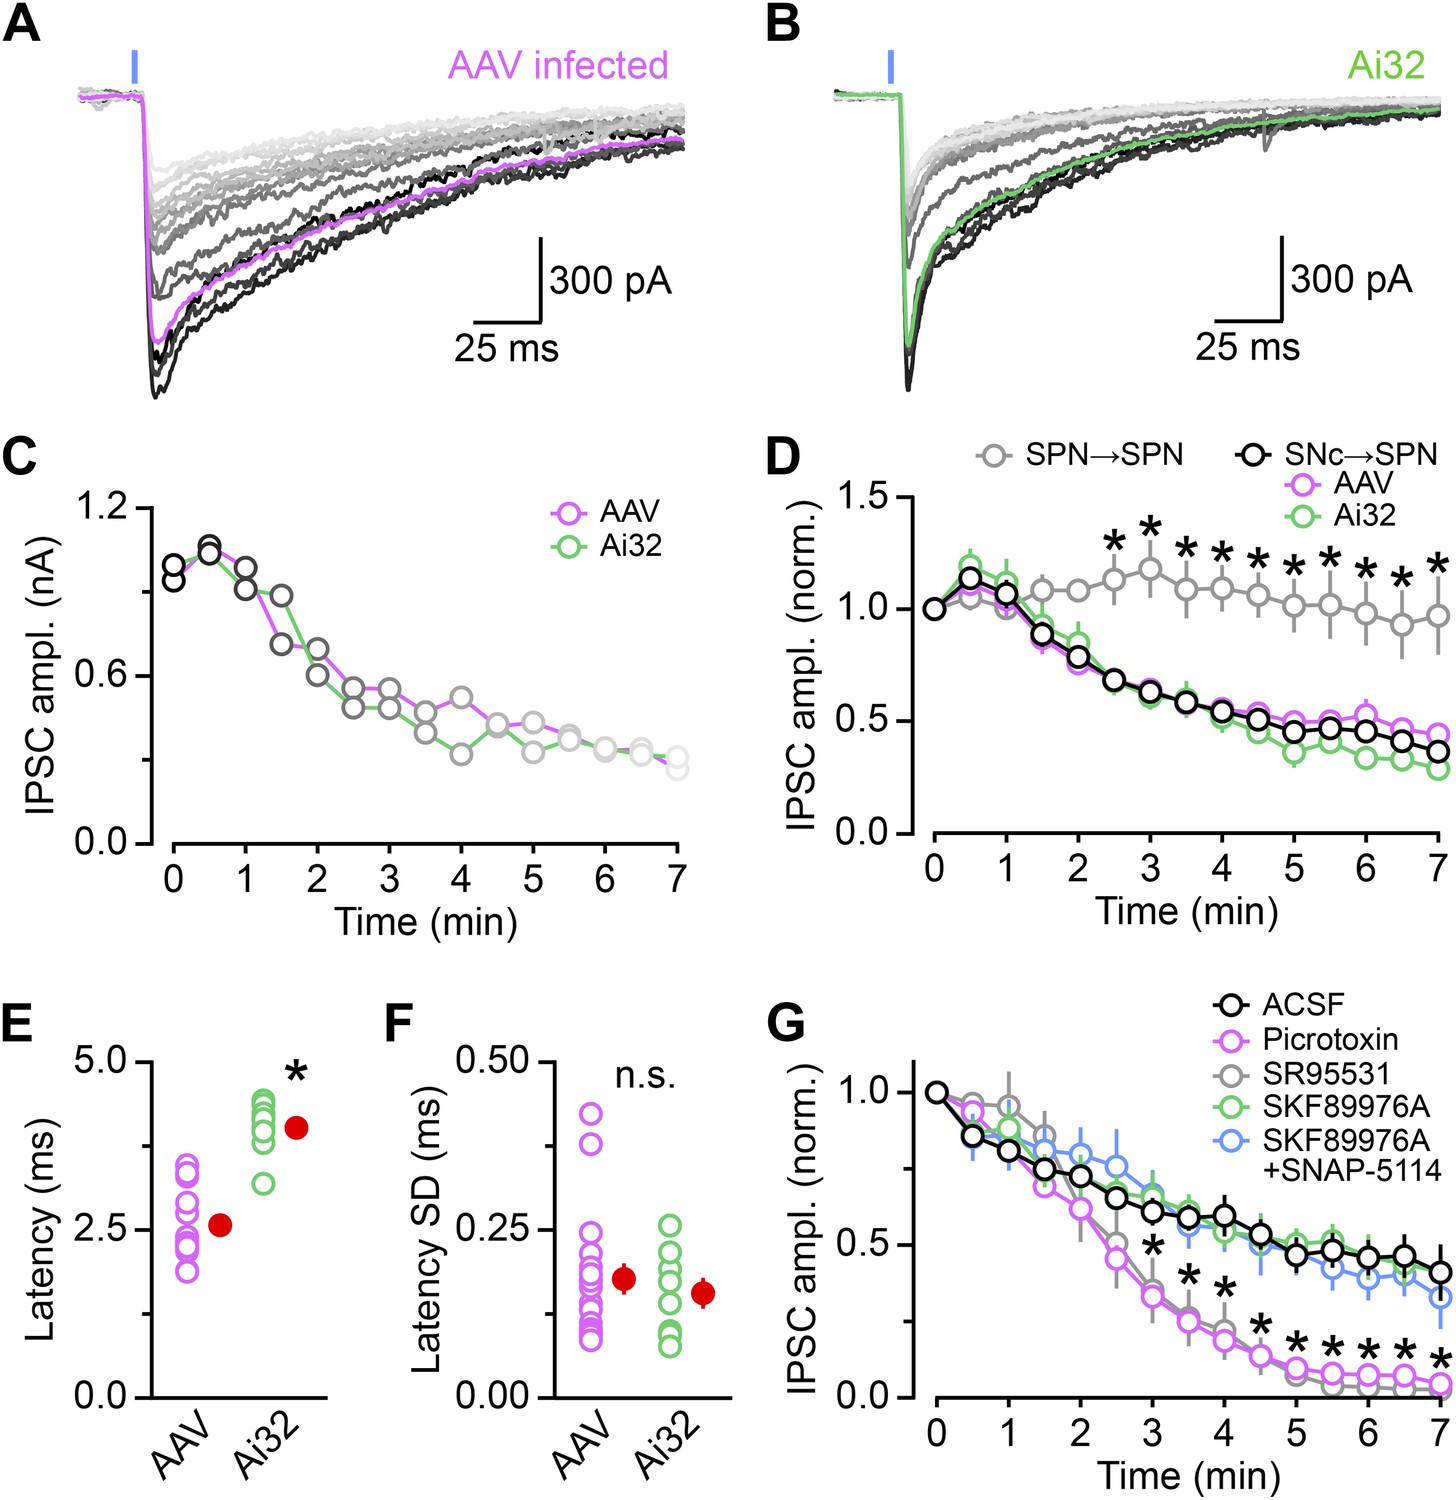
Properties of DA neuron oIPSCs in dorsal striatum.
ChR2 was expressed in SNc DA neurons virally. (A) or genetically (B). (A) Overlay of fifteen consecutive light-evoked (1ms, 473 nm, 5 mW·mm−2; blue line) IPSCs recorded under control conditions at −70 mV from a SPN in the dorsal striatum of a Slc6a3-ires-Cre mouse previously injected in the SNc with an AAV encoding Cre-dependent ChR2-mCherry. The first trace obtained after break-in is in black and subsequent oIPSCs are shown in progressively lighter shades of gray. The magenta trace depicts the average waveform of the first five oIPSCs. Recordings were performed with NBQX (10 μM), R-CPP (10 μM), and CGP55845 (2 μM) in the perfusate. (B) As in (A) for a SPN recorded under control conditions in the dorsal striatum of a Slc6a3-ires-Cre;Ai32 mouse. (C) Plot of the amplitude of consecutive oIPSCs shown in (A; magenta) and (B; green) over time. (D) As in (C) for oIPSCs recorded in dorsal striatum SPNs from AAV-infected mice (n = 17; magenta), Ai32 mice (n = 8; green), or both (n = 25, black). Amplitude is normalized to the first oIPSC after break-in. Note how the amplitude of oIPSCs progressively decreases with each stimulus under control conditions, regardless of the method used for expressing ChR2. This decrement in oIPSC amplitude is specific to dopaminergic synapses, as oIPSCs recorded from the collaterals of iSPNs in Adora2a-Cre expressing ChR2-mCherry in the dorsal striatum remained maintained their amplitude for the duration of the recording (n = 8; gray). Data represent mean ± SEM. *p<0.001 vs black trace; Sidak's multiple comparison test. (E) Mean latency from flash onset to oIPSC onset in individual dorsal striatum SPNs recordings from AAV-infected (magenta) and Ai32 (green) mice. The difference in synaptic delay are likely due to differences in expression levels of ChR2. Mean (±SEM) shown in red. *p<0.001, Mann–Whitney test. (F) Mean standard deviation (SD) of the synaptic latency of oIPSCs in individual cells indicates little temporal jitter in both experimental models, in agreement with monosynaptic transmission. Mean (±SEM) shown in red. n.s., no significant difference between means (p=0.8; Mann–Whitney test). (G) Time course of oIPSC amplitude rundown starting at the time of drug application (or the 5th stimulus for control recordings in ACSF). The number of SPN recordings in each condition are: ACSF, 25; picrotoxin, 19; SR95531, 11; SKF 89976A, 9; SKF 89976A+SNAP-5114, 8. Changes in the decay kinetics of oIPSCs shown in Figure 2 were quantified 3–4 min after initiating the perfusion of SKF89976A, just as the effects of the GABAA receptor antagonists begin to significantly inhibit oIPSCs. Note that acute application of GAT antagonists does not immediately affect the amplitude of oIPSCs in SPNs. Data represent mean ± SEM. *p<0.01, picrotoxin or SR95531 vs black trace; Tukey's multiple comparison test.
Figure 2 with 2 supplements
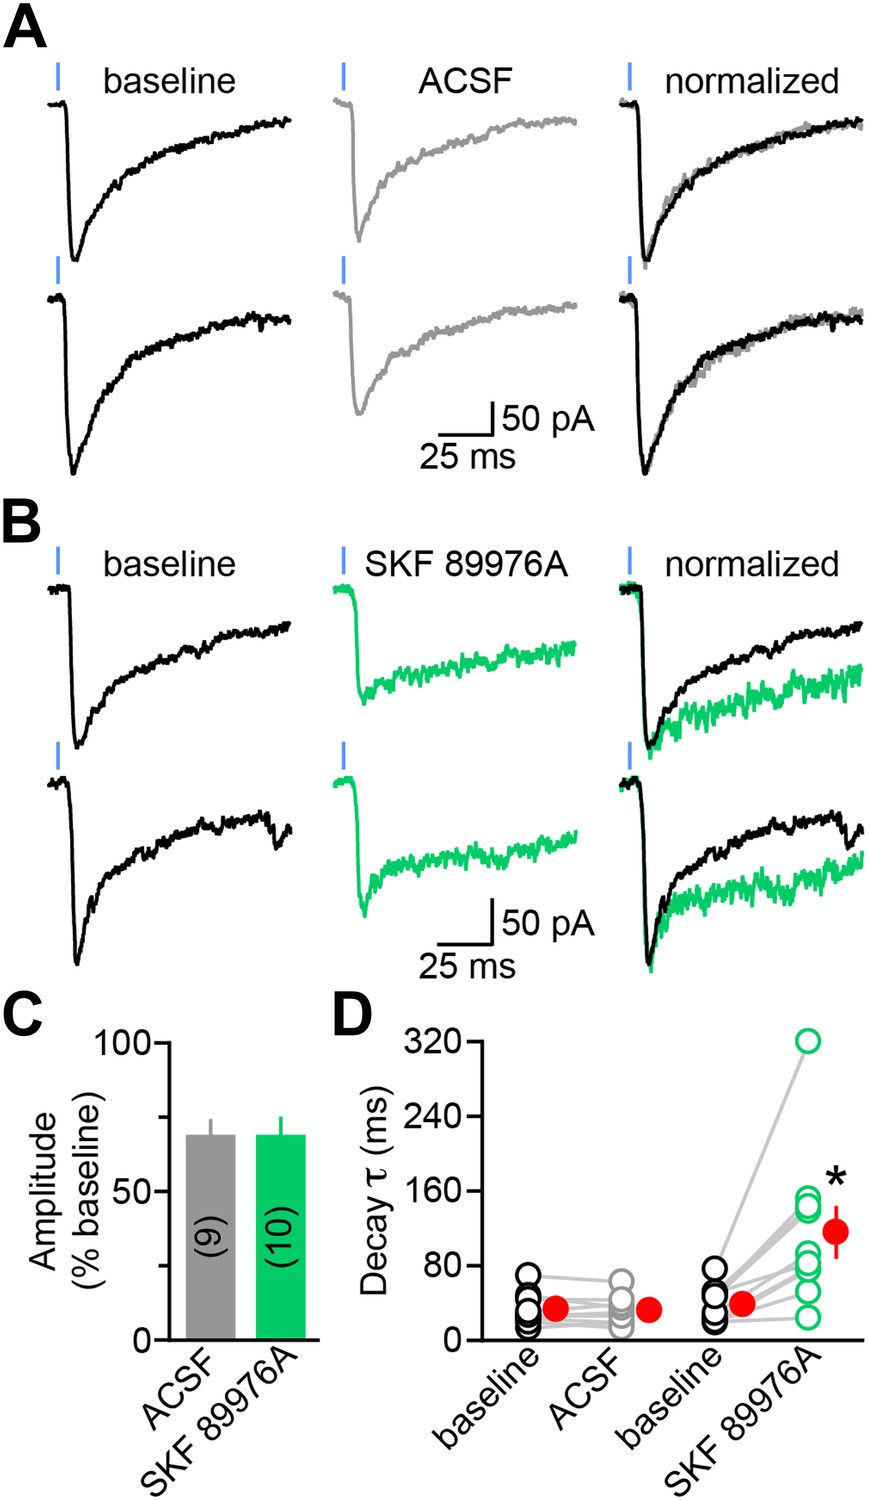
The decay kinetics of dopaminergic IPSCs are shaped by membrane GABA transporters.
(A) Two representative oIPSCs recorded in SPNs using sub-maximal ChR2 stimulation (1ms; 0.3–2 mW·mm−2; blue line) before (baseline, left black trace) and 3–4 min after (middle gray trace) bath application of control saline (ACSF). Right, overlay of peak-normalized oIPSCs showing identical decay kinetics. (B) As in (A) for oIPSCs recorded in SKF 89976A (10 μM, in green). (C) Histogram of mean (±SEM) peak oIPSC amplitude normalized to baseline for SPNs perfused in ACSF (gray) and SKF 89976A (green). Number of recordings indicated in parentheses. (D) Plot of individual oIPSC decay time constants before and after bath application of ACSF and SKF 89976A. Mean (±SEM) shown in red. *p=0.002 vs baseline, Wilcoxon signed-rank test.
Figure 2—figure supplement 1
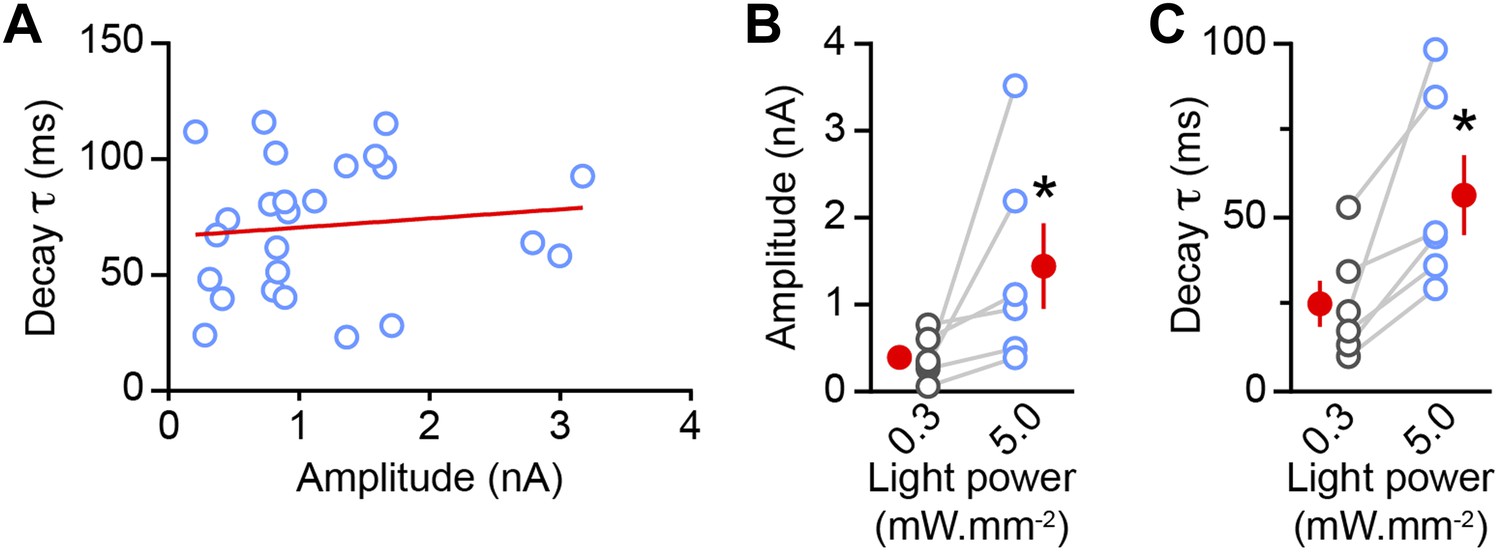
oIPSC decay time constant increases with stimulus strength.
(A) The decay time constant of oIPSCs evoked with maximal light intensity (5 mW·mm−2) does not correlate with oIPSC peak amplitude (n = 25 SPNs; R2 = 0.01, linear regression; red line). (B–C) In a subset of SPN recordings (n = 6), the amplitude (B) and decay time constant (C) of oIPSCs were measured at different light power densities (blue: 5 mW·mm−2; gray: 0.3 mW·mm−2). Maximal stimulation strength increased the mean amplitude and mean decay time constant of oIPSCs (red circles; p<0.04 for both, Wilcoxon signed-rank test), suggesting that the ability of GATs to limit pooling and/or spillover of GABA at dopaminergic synapses is compromised at high light stimulation intensities.
Figure 2—figure supplement 2
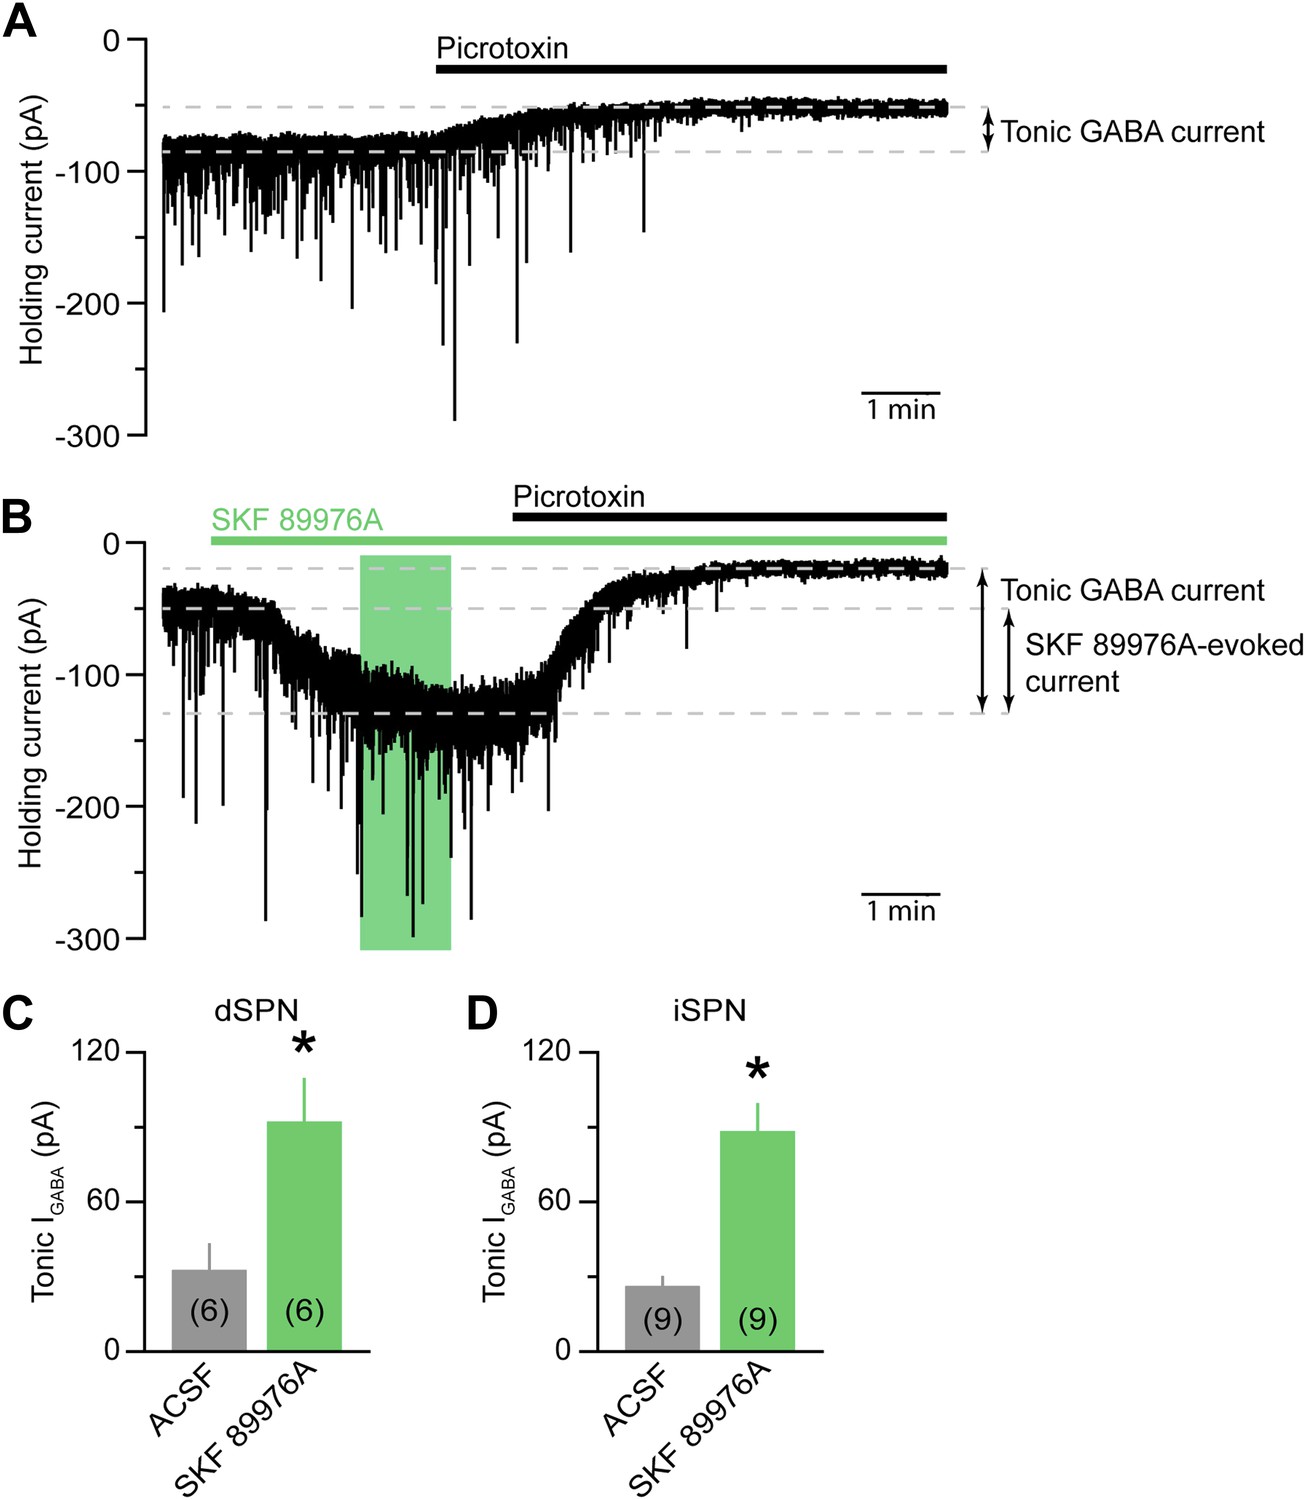
mGAT1 controls ambient levels of GABA in the striatum.
(A) Continuous whole-cell voltage-clamp recording (Vhold = −70 mV) from a direct pathway SPN (dSPN) upon bath application of the GABAA receptor antagonist picrotoxin (100 μM, black bar) in the presence of NBQX (10 μM), R-CPP (10 μM), and CGP55845 (5 μM). Downward deflections represent spontaneous IPSCs. The presence of a standing inward current mediated by extracellular GABA is revealed upon application of picrotoxin, which evokes a shift in baseline holding current. (B) As in (A) for an indirect pathway SPN (iSPN) upon bath application of SKF 89976A (10 μM) and picrotoxin (indicated by green and black bars, respectively). Green box indicates the 3–4 min window following the onset of SKF 89976A perfusion during which oIPSCs, eIPSCs, sIPSCs and SKF 89976A-evoked currents are quantified. (C) Histogram of picrotoxin-evoked shift in holding current recorded in dSPNs under control conditions (ACSF, gray) or upon acute inhibition of mGAT1 (SKF 89976A, green). Number of recordings is indicated in parentheses. *p<0.01, Mann–Whitney test. (D) As in (C) for iSPNs. Note that no differences in tonic GABAA-receptor-mediated currents were observed between iSPNs and dSPNs, either in ACSF or SKF 89976A.
Figure 3

The decay kinetics of electrically-evoked and spontaneous IPSCs are insensitive to mGAT1 inhibition.
(A) Representative electrically-evoked IPSC before (baseline, black trace) and 3–4 min after (green trace) bath application of SKF 89976A (10 μM). Inset, overlay of peak-normalized eIPSCs. (B) Plot of individual eIPSC decay time constants before (black) and after (green) SKF 89976A application. Mean (±SEM) shown in red. (C and D) As in (A and B) for spontaneous IPSCs. Note that sIPSCs have much faster kinetics compared to eIPSCs.
Figure 4
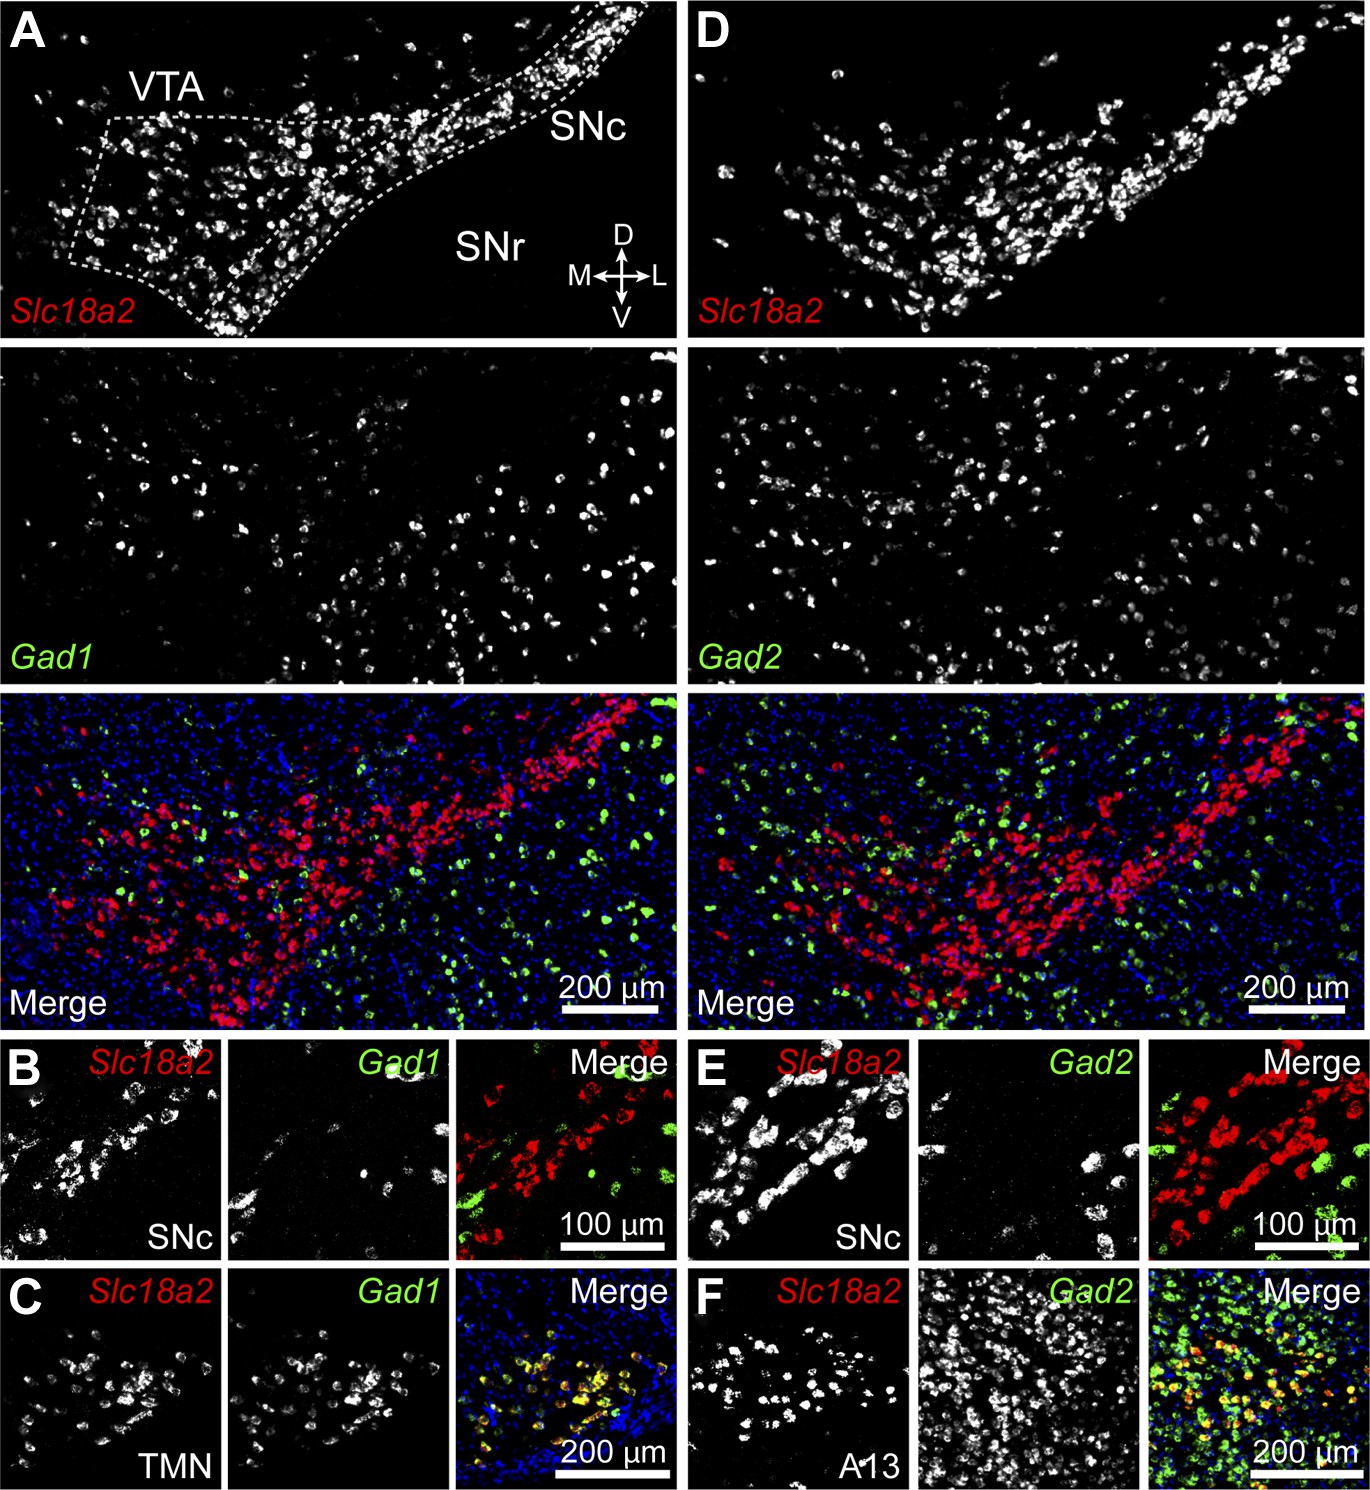
Midbrain DA neurons do not express Gad1 or Gad2.
(A) Two-color in situ hybridization of Slc18a2 (Vmat2; top, red) and Gad1 (middle, green) demonstrates the absence of co-labeled DA neurons (bottom) in a coronal section through lateral VTA and SNc (dashed outline). Nuclei are stained blue. SNr, substantia nigra pars reticulata; D, dorsal; V, ventral; M, medial; L, lateral. (B) Representative high magnification confocal image of Slc18a2 (red) and Gad1 (green) expression in SNc. (C) Double fluorescence in situ hybridization for Slc18a2 and Gad1 exhibits considerable overlap in the tuberomamillary nucleus (TMN). (D and E) As in (A and B) for Slc18a2 (Vmat2) and Gad2 expression. (F) Slc18a2 and Gad2 expression co-localize in the A13 dopaminergic cell group.
Figure 5
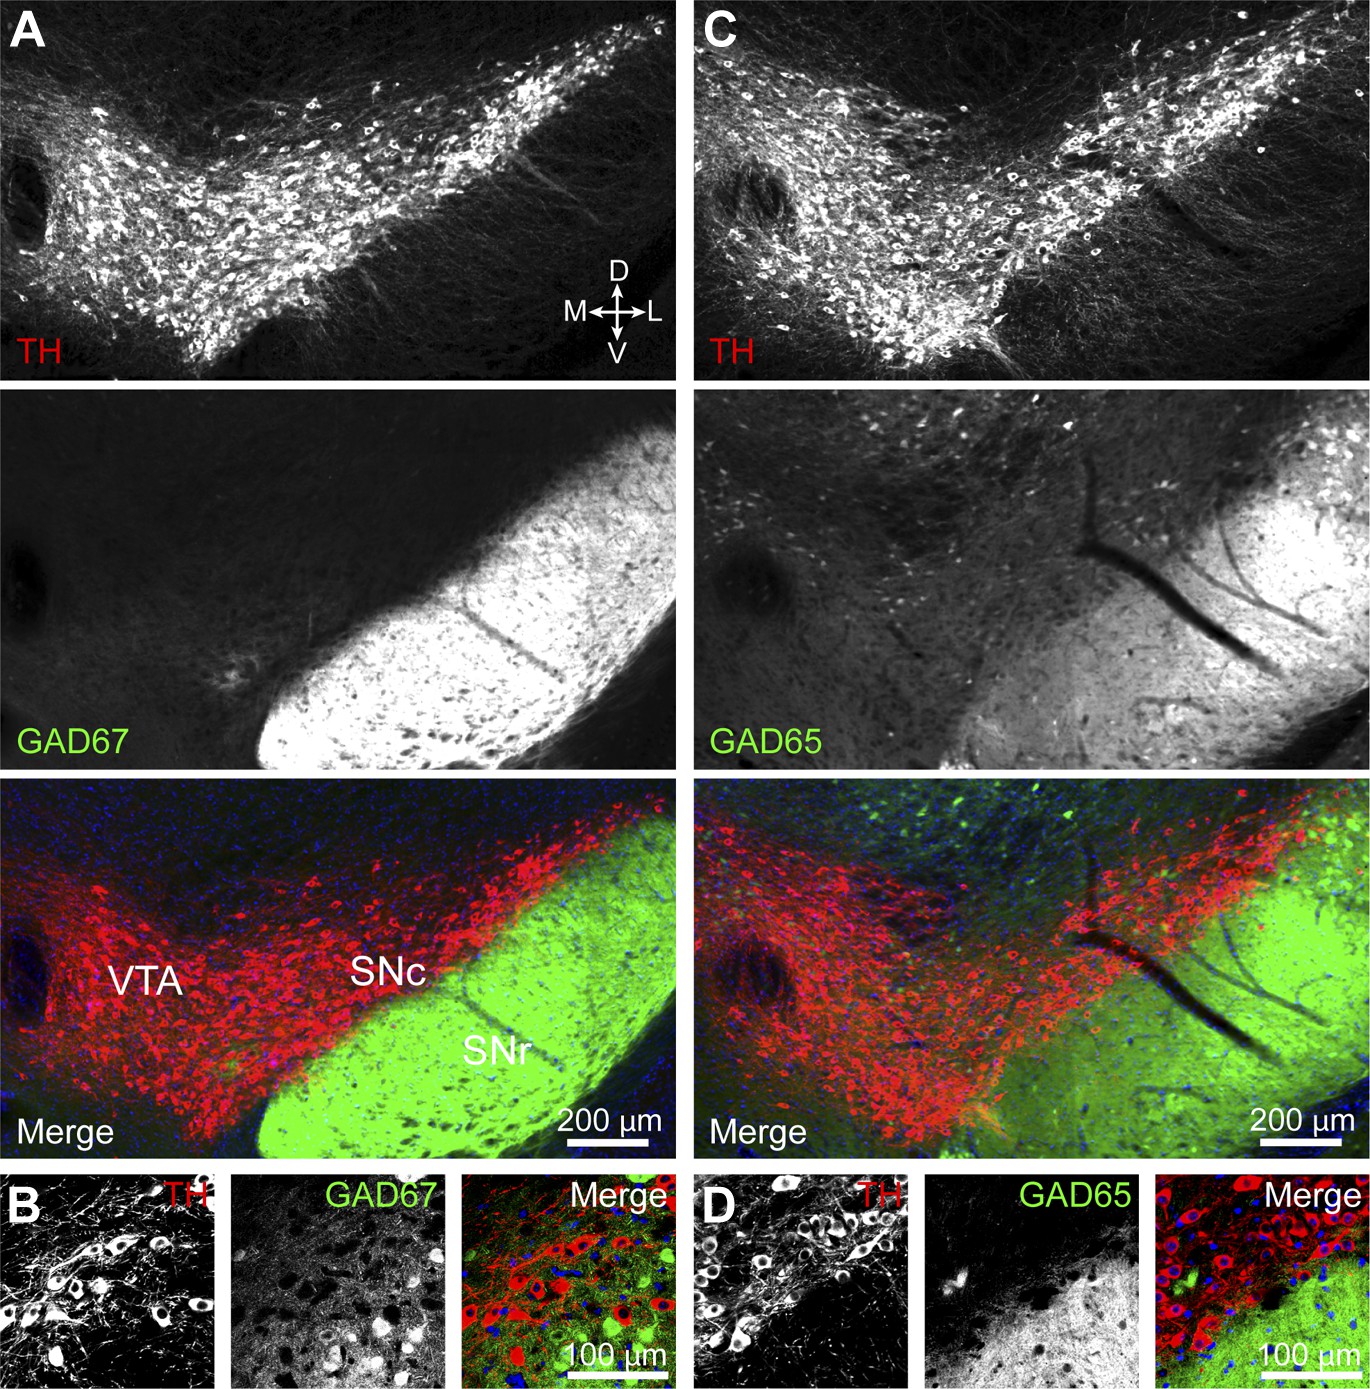
DA neurons in SNc/VTA do not express GAD65 or GAD67.
(A) Low magnification epifluorescence image of a coronal section through the ventral midbrain showing the absence of overlap between tyrosine hydroxylase (TH) immunofluorescence (red) and endogenous EGFP (green) in the SNc and lateral VTA of Gad1-Egfp knock-in mice. Blue, nuclear stain. D, dorsal; V, ventral; M, medial; L, lateral. (B) Representative high magnification confocal image of SNc in Gad1-Egfp mice showing mutually exclusive expression of EFGP and TH, confirming that GAD67 is not expressed in SNc DA neurons. (C and D) As in (A and B) for coronal brain sections from Gad2-ires-Cre knock-in mice expressing a fluorescence Cre reporter allele (Ai14). TH immunolabeling and Cre reporter fluorescence respectively depicted in red and green for consistency. The absence of overlap indicates that GAD65 is not expressed in DA neurons of the SNc and lateral VTA.
Figure 6
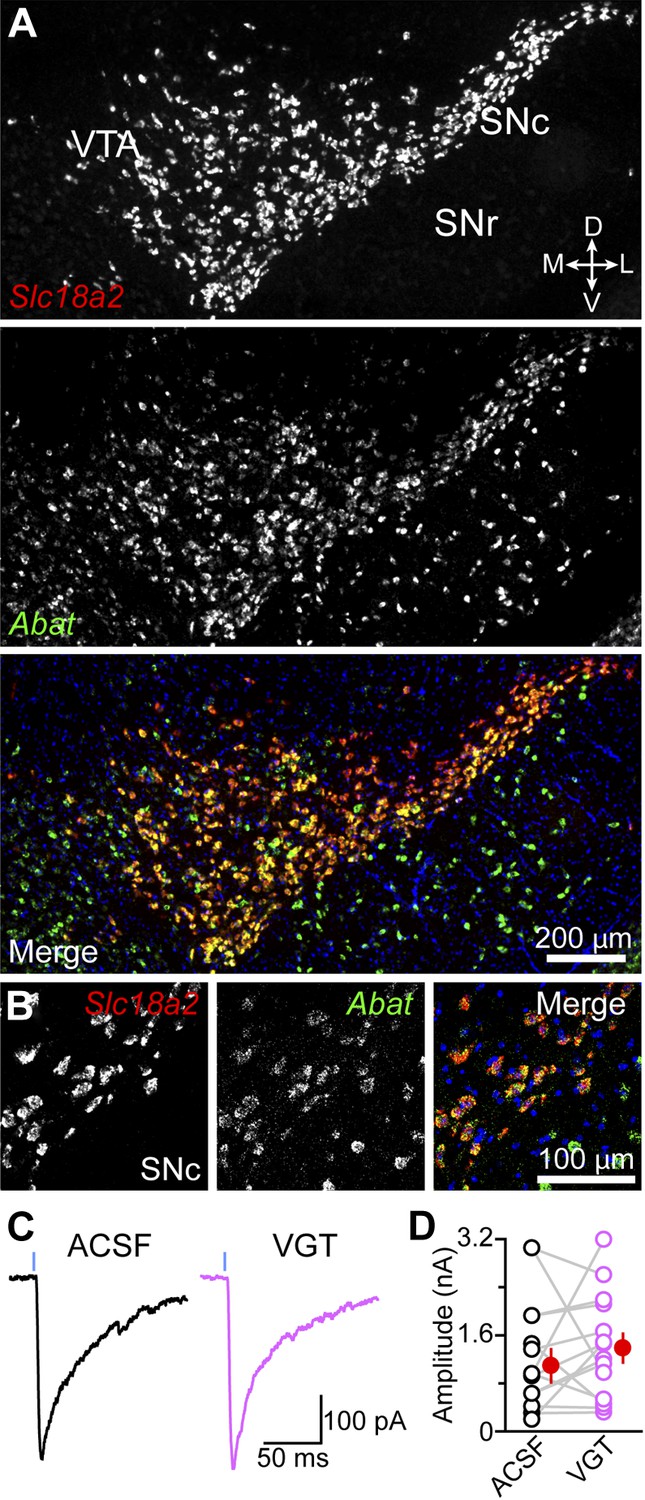
GABA transaminase is not required for GABA release by DA neurons.
(A) Double fluorescence in situ hybridization for Slc18a2 (Vmat2; red) and Abat (green) reveals that midbrain DA neurons overwhelmingly express GABA transaminase. Blue, nuclear stain. D, dorsal; V, ventral; M, medial; L, lateral. (B) High magnification confocal image of Slc18a2 (red) and Abat (green) mRNA distribution in SNc. (C) Light-evoked IPSCs recorded from SPNs upon strong ChR2 stimulation (1 ms, 5 mW·mm−2; blue line) after prolonged incubation in ACSF (black) or vigabatrin (VGT, 100 μM; magenta). (D) Plot of mean peak oIPSC amplitude in SPNs recorded in similar regions of dorsal striatum in adjacent slices (depicted by gray lines) incubated in either ACSF (black) or VGT (magenta). Mean (±SEM) values for each group shown in red.
Figure 7
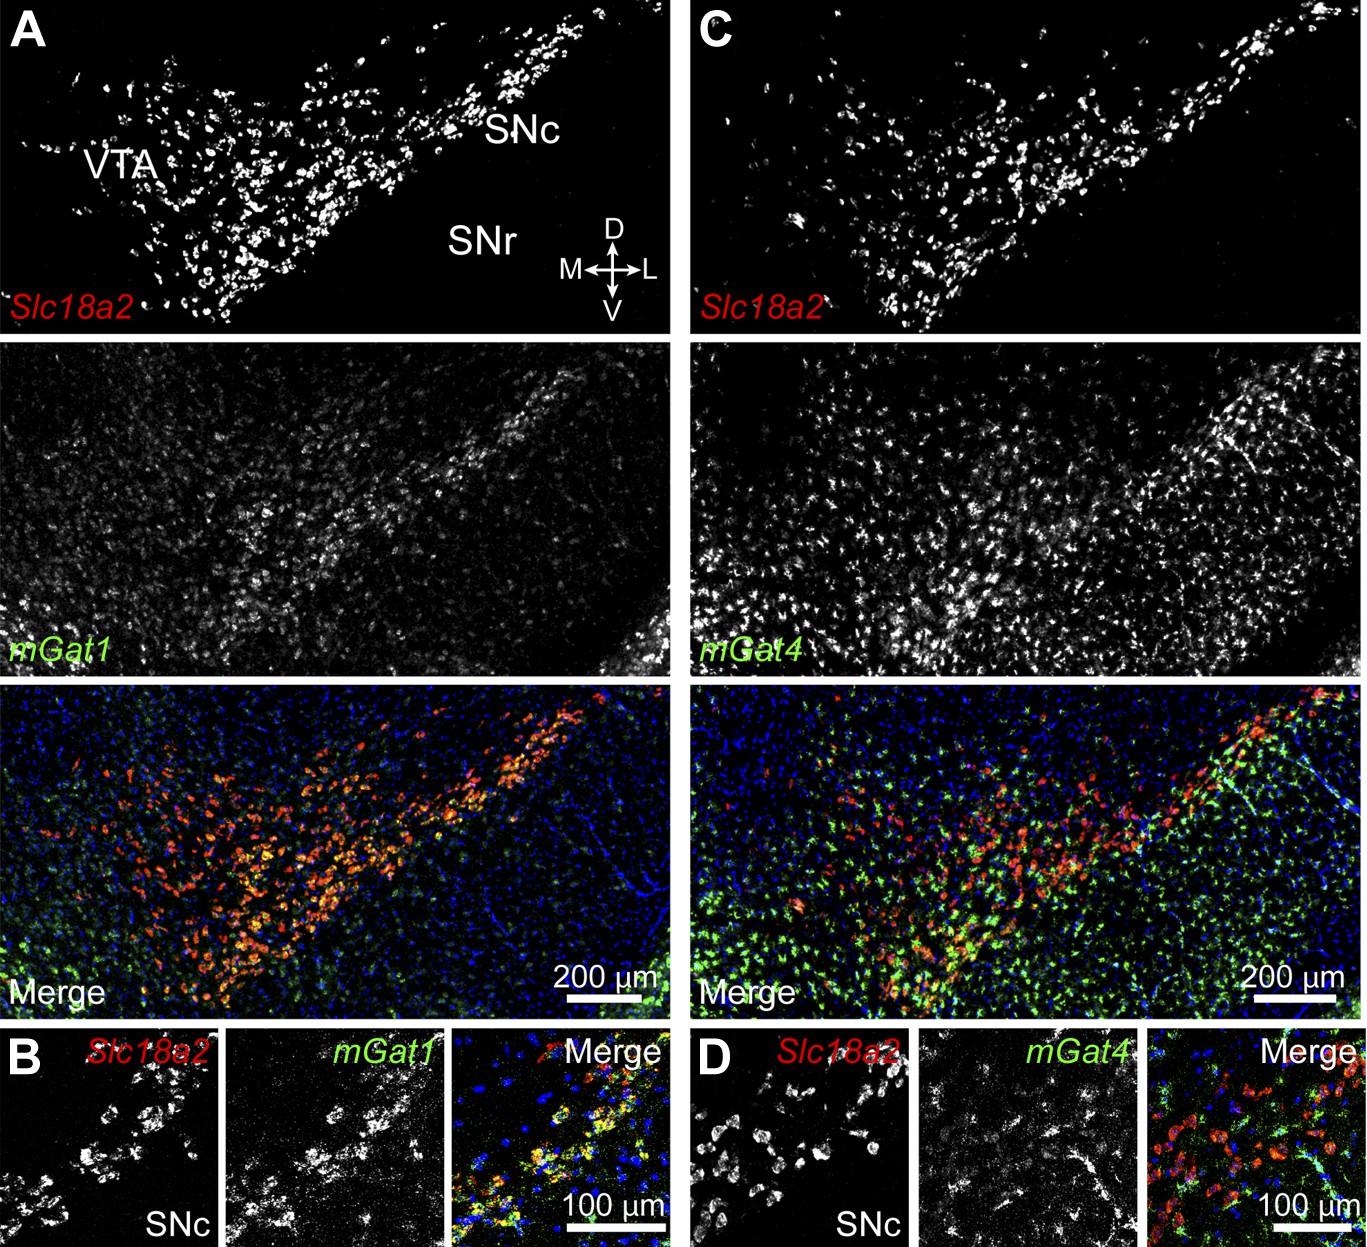
Midbrain DA neurons express plasma membrane GABA transporters.
(A) Two color in situ hybridization for Slc18a2 (Vmat2; top, red) and mGat1 (middle, green) shows considerable overlap in SNc and lateral VTA (bottom). Nuclei are stained blue. D, dorsal; V, ventral; M, medial; L, lateral. (B) Representative high magnification confocal image of Slc18a2 (red) and mGat1 (green) in SNc confirms that DA neurons express mRNA for mGAT1. (C) Same as (A) for Slc18a2 (top, red) and mGat4 (middle, green). Note that mGat4 is most strongly expressed in star-shaped glial cells. (D) Confocal image through SNc reveals strong expression of mGat4 mRNA in glial cells and weak labeling in DA neurons.
Figure 8 with 2 supplements
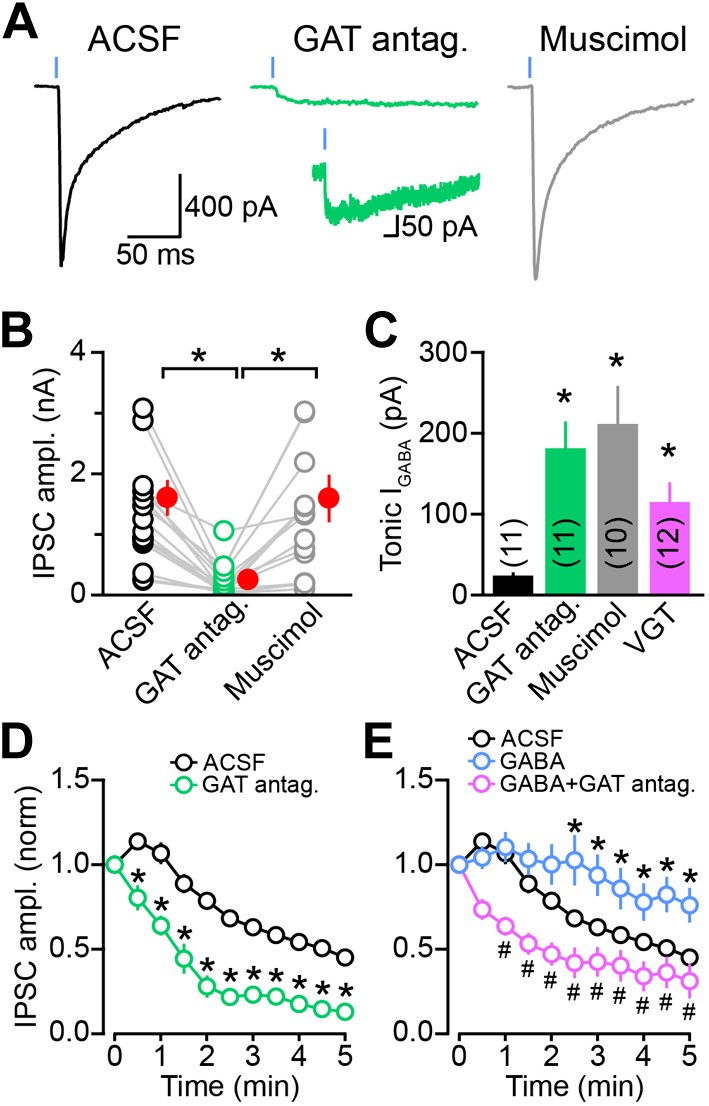
Sustained GABAergic signaling from DA neurons requires GAT function.
(A) Dopaminergic IPSCs evoked by strong ChR2 stimulation (1 ms, 5 mW·mm−2; blue line) in slices incubated for at least 30 min in control ACSF (left, black), muscimol (0.1 μM; right, gray) or a cocktail of mGAT1 and mGAT4 antagonists (10 μM SKF 89976A + 50 μM SNAP-5114, respectively; middle, green). Recordings were performed in the continued presence of each drug, in addition to the GABAB receptor antagonist CGP55845 (2–5 μM) and the glutamate receptor blockers NBQX (10 μM) and R-CPP (10 μM). Inset, oIPSC in GAT antagonists shown on longer time scale to illustrate slow kinetics. (B) Plot of peak oIPSC amplitudes recorded from individual SPNs in adjacent slices after prolonged incubation in ACSF (black), mGAT1 and mGAT4 inhibitors (green) and muscimol (gray). Mean (±SEM) indicated in red. *p<0.01 for indicated comparisons, Dunn's Multiple Comparison Test. (C) Histogram of tonic GABA current (IGABA) measured in SPNs as the reduction in holding current evoked by bath application of the GABAA receptor antagonist picrotoxin (100 μM) under control conditions (black), or after prolonged incubation in mGAT1 and mGAT4 blockers (10 μM SKF 89976A + 50 μM SNAP-5114; green), muscimol (0.1 μM; gray) or vigabatrin (100 μM; magenta). *p<0.01 vs ACSF, Dunn's Multiple Comparison Test. Number of recordings indicated in parentheses. (D) Plot of consecutive oIPSC amplitudes (normalized to the first light-evoked response) over time under control conditions (ACSF; black; n = 25) and after prolonged incubation in a cocktail of GAT antagonists (10 μM SKF 89976A + 50 μM SNAP-5114; green; n = 11). *p<0.001 vs ACSF, Sidak's multiple comparison test. (E) As in (D) for slices supplied with exogenous GABA (100 μM) for 5–10 min before obtaining oIPSCs from SPNs in dorsal striatum (blue; n = 10), and slices supplied with exogenous GABA after prolonged inhibition of GATs with 10 μM SKF 89976A + 50 μM SNAP-5114 (magenta; n = 12). *p<0.05 vs ACSF, #p<0.005 vs GABA, Tukey's multiple comparison test. Control traces in (D) and (E) are the same as in Figure 1—figure supplement 1D.
Figure 8—figure supplement 1

Chronic GAT block does not non-specifically affect synaptic transmission at GABAergic and dopaminergic synapses.
(A) Example traces of light-evoked (1 ms, 5 mW·mm−2; blue line) IPSCs recorded from neurons in the external segment of the globus pallidus (GPe; Vhold = −70 mV) in Adora2a-Cre;Ai32 mice, which express ChR2-EYFP in indirect-pathway SPNs. GPe boundaries were identified using the strong EYFP fluorescence of iSPN axonal terminals. Slices were incubated for at least 30 min in ACSF (left, black) or in a cocktail of 10 μM SKF 89976A and 50 μM SNAP-5114 (right, green). Pre-incubations and recordings were performed in the continued presence of each drug, in addition to CGP55845 (5 μM), NBQX (10 μM) and R-CPP (10 μM). (B) Amplitude normalized traces from (A) shown on an expanded time scale to reveal the slow decay kinetics of IPSCs in the presence of GAT antagonists. (C) The peak amplitude of striatopallidal oIPSCs did not significantly differ (p=0.7; Mann–Whitney test) between slices bathed in ACSF (black; n = 11 GPe neurons) and slices chronically incubated in GAT blockers (green; n = 16 GPe neurons), indicating that this pharmacological manipulation does not inhibit synaptic transmission at ‘classical’ GABAergic synapses. Mean (±SEM) shown in red. (D) Representative traces of light-evoked (1 ms, 5 mW·mm−2; blue lines) DA release in the dorsal striatum of Slc6a3-ires-Cre;Ai32 measured by carbon-fiber amperometry. Pharmacological conditions are identical to those in (A–C). Stimulation artifacts are blanked for clarity. (E) Peak extracellular DA concentration measured in dorsal striatum slices incubated in ACSF (black; n = 9 slices) or in GAT antagonists (green; n = 14 slices). Population means (±SEM in red) did not differ significantly (p=0.09; Mann–Whitney test).
Figure 8—figure supplement 2

oIPSC rundown is activity dependent.
(A) The peak amplitude of the first oIPSC recorded in dorsal striatum SPNs within the first 1.5 hr after slicing (black) was comparable to that recorded during the next 1.5 hr (gray), indicating that oIPSCs do not rundown with time in the absence of stimulation. Data in this and subsequent panels represent mean ± SEM. The number of SPNs recorded is indicated in parentheses. (B) The time course of synaptic transmission rundown by consecutive light stimuli was similar in the two groups of slices, confirming that recording conditions in the first and second halves of recording sessions are comparable, and that synaptic rundown of DA neuron oIPSCs is dependent on activity. (C–D) As in (A–B) for slices chronically incubated for 0.5–1.0 hr (dark green) or 1.1–2.0 hr (light green) in SKF 89976A (10 μM) + SNAP-5114 (50 μM). The effect of GAT inhibition on oIPSC amplitude does not vary with pre-incubation duration (C), indicating that our pharmacological manipulation depletes synaptic GABA levels within 30 min. Importantly, stimulation-evoked rundown in GAT blockers is accelerated (contrast panels B and D), consistent with activity dependent depletion of vesicular GABA when cytoplasmic GABA levels are not replenished by GATs.
Download links
A two-part list of links to download the article, or parts of the article, in various formats.
Downloads (link to download the article as PDF)
Open citations (links to open the citations from this article in various online reference manager services)
Cite this article (links to download the citations from this article in formats compatible with various reference manager tools)
Midbrain dopamine neurons sustain inhibitory transmission using plasma membrane uptake of GABA, not synthesis
eLife 3:e01936.
https://doi.org/10.7554/eLife.01936


