Fine grained compositional analysis of Port Everglades Inlet microbiome using high throughput DNA sequencing
- Published
- Accepted
- Subject Areas
- Environmental Sciences, Genomics, Marine Biology, Microbiology
- Keywords
- Microbiome, 16S, Port Everglades Inlet, Bacterioplankton, MiSeq
- Copyright
- © 2017 O'Connell et al.
- Licence
- This is an open access article distributed under the terms of the Creative Commons Attribution License, which permits unrestricted use, distribution, reproduction and adaptation in any medium and for any purpose provided that it is properly attributed. For attribution, the original author(s), title, publication source (PeerJ Preprints) and either DOI or URL of the article must be cited.
- Cite this article
- 2017. Fine grained compositional analysis of Port Everglades Inlet microbiome using high throughput DNA sequencing. PeerJ Preprints 5:e3369v1 https://doi.org/10.7287/peerj.preprints.3369v1
Abstract
Similar to natural rivers, manmade inlets connect inland runoff to the ocean. Port Everglades Inlet (PEI) is a busy cargo and cruise ship port in South Florida, which can act as a source of pollution and nutrients to surrounding beaches and offshore coral reefs. Understanding the composition and fluctuations of bacterioplankton communities (“microbiomes”) in major port inlets is important due to their impacts on surrounding marine environments. We hypothesize annual microbial fluctuations based on seasons (wet vs dry), assessed by high throughput 16S rRNA amplicon library sequencing. Surface water samples were collected weekly for one year, creating a high sampling frequency and fine sampling scale. Over 1.4 million 16S rRNA V4 reads generated a total of 16,384 Operational Taxonomic Units (OTUs) from the PEI habitat. We observed Proteobacteria, Cyanobacteria, Bacteroidetes, and Actinobacteria as the most dominant phyla. Analysis of potentially pathogenic genera show the presence of Staphylococcus and Bacillus, albeit at lower relative abundances during peak shipping and tourist months (November –April), thus underscoring their relatively low presence. Statistical analyses indicated significant alpha diversity differences when comparing microbial communities with respect to time. This observation probably stems from the low community richness and abundance in August, which had lower than average rainfall levels for Florida’s wet season. The lower rainfall levels may have contributed to less runoff, and subsequently fewer bacterial groups being introduced into the port surface waters. Bacterioplankton beta diversity differed significantly by month and season. The 2013-2014 dry season (October-April), was warmer and wetter than historical averages, which may have driven the significant differences in beta diversity. Increased nitrogen and phosphorous concentrations were also observed in these months, possibly creating favorable bacterial growth conditions. To our knowledge, this study represents the first to sample a large port at this fine sampling scale. These data can help establish underlying inlet microbial community baselines, and supplement the vital monitoring of local marine and recreational environments, which appears more poignant in the context of local reef disease outbreaks and worldwide coral reef collapses in the wake of a harsh 2015-16 El Nino event.
Author Comment
This is a submission to PeerJ for review.
Supplemental Information
Table of Adonis test results
The Adonis (PERMANOVA) results calculated using Bray-Curtis dissimilarity index
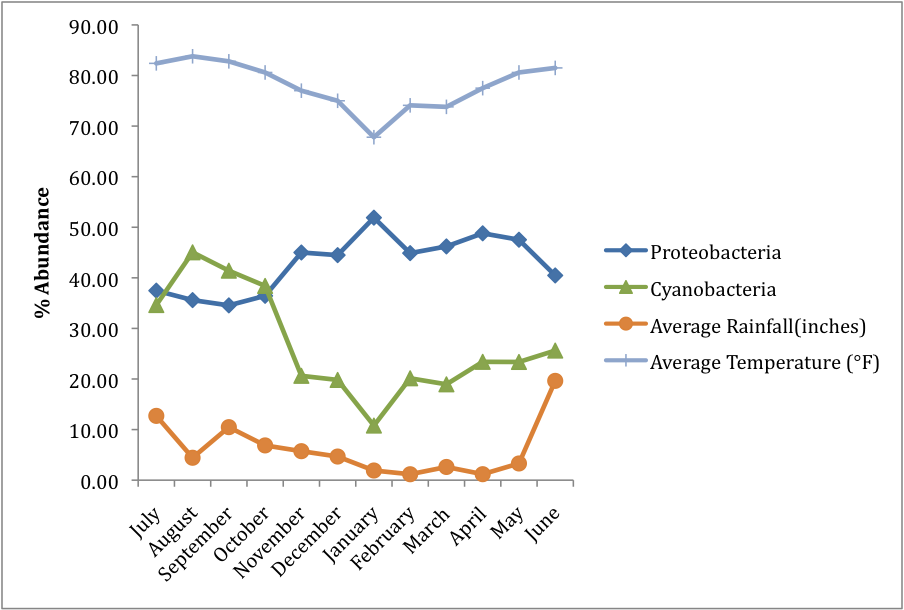
Percent abundance values and rainfall and temperature metadata values over time
Shows an interesting inverse trend in percent abundance levels of Cyanobacteria and Proteobacteria across a 1-year timespan in relation to one another and to rainfall and temperature data.
Classification of the top 50 OTUs from rank abundance curve
This spreadsheet contains the remaining 40 classifications of the OTUs depicted in Figure 1
Mapping file containing metadata for samples
The mapping file used to link the metadata with sample. This file is necessary for downstream bioinformatic analysis of sequence data
Linear regression analysis raw data
Excel spreadsheet containing the raw data used for the linear regression analysis in SAS.
Raw alpha diversity metrics
Contains the raw data of the alpha diversity metrics obtained using the Phyloseq package in R