Articles

Article Tools
 View Full Text View Full Text |
 Abstract Abstract |
 Article as PDF Article as PDF |
 Print this Article Print this Article |
 Pubmed Pubmed |
 PMC PMC |
 PubReader PubReader |
 Export to Citation Export to Citation |
 Email Alerts Email Alerts |
 Open Access Open Access |
Supplementary
Share this article on :


Stats or Metrics
Article
Original Article
Exp Neurobiol 2019; 28(6): 709-719
Published online December 31, 2019
https://doi.org/10.5607/en.2019.28.6.709
© The Korean Society for Brain and Neural Sciences
Three-Dimensional Analysis of Mouse Habenula Subnuclei Reveals Reduced Volume and Gene Expression in the Lipopolysaccharide-mediated Depression Model
Esther Yang†, Jin Yong Kim†, Soo Hyun Yang, Eunsoo Lee, Woong Sun, Hyun Woo Lee* and Hyun Kim*
Department of Anatomy, College of Medicine, Korea University, Seoul 02841, Korea
Correspondence to: *To whom correspondence should be addressed.
Hyun Woo Lee, TEL: 82-2-2286-1385, FAX: 82-2-929-5696
e-mail: biocais@korea.ac.kr
Hyun Kim, TEL: 82-2-2286-1153, FAX: 82-2-929-5696
e-mail: kimhyun@korea.ac.kr
†These authors contributed equally to this work.
This is an Open Access article distributed under the terms of the Creative Commons Attribution Non-Commercial License
(http://creativecommons.org/licenses/by-nc/4.0) which permits unrestricted non-commercial use, distribution, and
reproduction in any medium, provided the original work is properly cited.
Abstract
The habenula (Hb) is small but important brain structure, anatomically and functionally links the forebrain with the midbrain to modulate various neuropsychiatric functions associated with drug addiction and emotion-associated dysfunctions. Several reports suggested that the dysfunction of Hb-related functions affected the Hb structurally and functionally. However, the technical limitation has awaited the solid conclusion of whether Hb change due to depression is likely to occur in certain subnuclei of the Hb. To probe this possibility, we developed 3-dimensional reconstruction methods for the high-resolution volumetric analysis of Hb and the mRNA levels at the given volume in normal or lipopolysaccharide (LPS)-mediated mouse model of depression. Notably, we discovered that the volume reduction was prominent in medial Hb but not in lateral Hb after LPS treatments. On the other hand, the RNA expression levels of known Hb regional markers such as Tac1 (dorsal part of medial Hb), ChAT (ventral part of medial Hb), and Tacr1 (medial and lateral Hb) were all decreased in all Hb subnuclei in LPS-injected mice. Accordingly, accurate volumetry with marker labeling was not feasible. Collectively, these established 3D analyses of mouse Hb successfully and precisely determine the volume-based changes of small brain structure, which should be applicable in a wider range of mouse models or pathological specimens.
Graphical Abstract
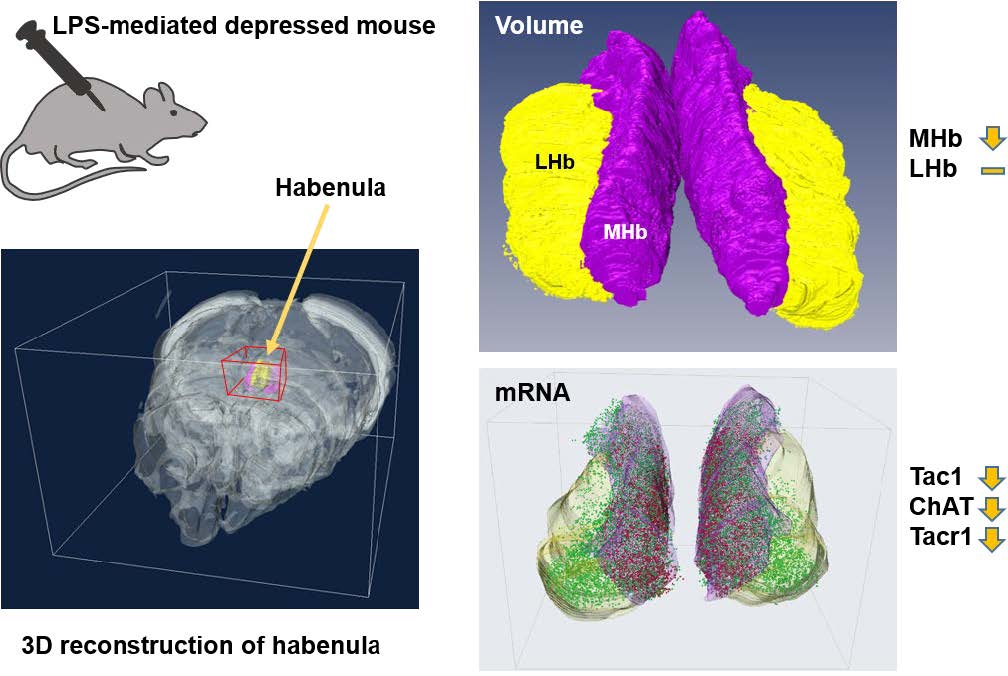
Keywords: 3-dimensional structure, Gene expression, Depression, Habenula
INTRODUCTION
The habenula (Hb) is part of the epithalamus and is associated with various psychiatric disorders including depression, bipolar disorder, schizophrenia and drug addiction [1]. The Hb has several subdivisions; however, it has its medial (MHb) and lateral (LHb) portions, which are in turn divided into dorsal and ventral regions that can be recognized anatomically or by their cell-type or their molecular signatures [2–5]. For instance, the ventral part of MHb (MHbV) contains cholinergic neurons that are choline acetyltransferase (ChAT) positive. At the same time, the dorsal part of MHb (MHbD) expresses tachykinin 1 (Tac1) and tachykinin neuropeptides substance P (SP) and neurokinin A (NKA) [2, 6]. In turn, the LHb region is composed of glutamatergic neurons with some neuronal populations becoming activated in response to external aversive stimuli [7, 8]. Recent transcriptomic analysis suggests that LHb has also a high molecular heterogeneity for its neurons [9].
On the assumption that the functional activity of each brain region is loosely correlated with its volume, several attempts have been made on whether Hb-related brain pathological conditions also affect the size of Hb. Indeed, an analysis of Hb volume and cell number from formaldehyde-fixed samples of post-mortem brains of patients with depression showed that both medial and lateral Hb volumes and cell numbers were significantly decreased in depressive patients compared to normal controls [10]. Jacinto et al. also found that rats exposed to chronic, unpredictable stress had reduced volumes of MHb and LHb in both hemispheres and had lower number of cells in their right MHb and bilateral LHb areas [11]. However, functional magnetic resonance imaging (fMRI) studies have failed to identify significant differences for major depressive disorder (MDD) and healthy control groups [12–14]; meanwhile, analysis of schizophrenia patients showed atrophy of their Hb volume compared with controls [15]. Such differences might be due to the insufficient resolution of the imaging methods used and/or inaccurate measurement of the volumes post tissue processing and 3D reconstitution of the volumes.
The close relationship between inflammation and depression has been well studied and several inflammation-induced depression models have been invented [16, 17]. Among them, the LPS-mediated depression model has been extensively studied and demonstrates many depression-related behaviors such as increased immobility time in the tail suspension test (TST) and forced swim test (FST) [16, 18, 19]. Therefore, we adopted the LPS-mediated depression model in mouse.
In this respect, the advent of a new technique allowing for accurate quantification of small brain structures/volumes, having cellular resolutions, is important. In this regard, tissue clearing-based imaging techniques offer a reliable method for this purpose, although they also require minimal physical sectioning of the brain; coupled with confocal imaging of the transparent tissues, these methods provide cellular resolution information. The isotropic nature of these techniques also allows for precise volumetric evaluation of small brain regions. To this end, we have employed the protocol, active clarity technique (ACT), which we recently established by the optimization of the original CLARITY method [20]. Our experimental procedure reported here is easy and rapid and was sufficient to document a significant shrinkage of the Hb volume in the LPS-induced mouse model of depression. This work also indicated the small brain subnuclei could be recognized and measured by our protocol, and the protocol may also be used for a wide variety of purposes requiring precise volume measurements.
MATERIALS AND METHODS
Ethics statement
The research described here was approved by the Korea University Institutional Animal Care and Use Committee (IACUC) (KOREA-2017-0140) and was carried out in accordance with the Korea University guidelines.
Animals and LPS-induced model of depression
Male C57BL/6 mice (purchased from Japan SLC, Inc. Shizuoka, Japan) were used. The mice were individually housed per cage under a 12-h light-dark cycle (light on 8:00 am) and given
Active clarity technique (ACT) for tissue processing
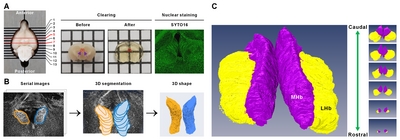
The detailed tissue processing used here for ACT protocol was based on previously published procedures [20]. Briefly, LPS-induced depressive mice (LPS; n=8) and PBS-injected control mice (PBS; n=8) were used for whole-habenula clearing. The mice were first perfused with 0.9% saline, followed by 4% paraformaldehyde (PFA). Each brain was removed from the skull and then post-fixed in 4% PFA overnight at 4°C. The fixed brains were then cut into 2-mm thick coronal sections. The sections containing the entire habenula were incubated in the A4P0 hydrogel monomer solution (4% acrylamide in 0.1× PBS), supplemented with VA-044 initiator, overnight at 4°C. Hydrogel-infused brains were then polymerized for 2 h at 37°C and then washed with 1× PBS three times for 10 min each at room temperature. The sections were then placed in a chamber containing sodium borate buffer (200 mM, pH 8.5) containing 4% SDS for clearing and run in electrophoretic tissue clearing (ETC) conditions (60V/37°C/1.5A/3 h; Logos Biosystems, Korea). After ETC, brain slices were incubated with PBS to remove residual SDS.
3D staining of habenula
The cleared brain sections were incubated in permeabilization solution (0.2% Triton X-100, 0.3 M glycine, and 20% DMSO in PBS) in an incubator shaker overnight at 37°C and then washed with PBS three times for 10 min each at room temperature. The sections were incubated for 2 days at 37°C with SYTO16 diluted solution (1:1000, in 1× PBS containing 3% bovine serum albumin, 0.2% Triton X-100, and 0.01% sodium azide) for nuclear staining. The stained brains were washed several times with PBS and immersed in CUBIC-mount solution (50% sucrose, 25% urea, 25% N,N,N’,N’-tetrakis (2-hydroxylpropyl) ethylenediamine) [20].
Image acquisition
Cleared tissue samples were mounted in CUBIC-mount solution on 35-mm glass-bottom dishes (101350; SPL Lifesciences Inc., Seoul, Korea). Cover-slipped samples were viewed and photographed using TCS SP8 Dichroic/CS (Leica). Immunofluorescent images were acquired using the 10× objective. To reconstruct the whole 3D habenula, images were obtained with a z-stack covering the entire Hb with an interval of 2.41 μm.
3D reconstruction of habenula
Fluorescent images were visualized and analyzed by Amira software (ver. 5.5.3, Visage Imaging, Berlin, Germany). The 3D morphology of the labeled habenula was computationally reconstructed with Amira software. The demarcation of MHb and LHb was based on anatomical features [5] with the densely packed MHb displaying a sharp border with LHb. Although the lateral border of LHb is inconspicuous, the abdominal border is sufficiently distinguishable from the surrounding structures such as stria medullaris, fasciculus retroflexus, and thalamus. Each habenula structure was manually delimited using regions of interest (ROI) drawn for every slice on the coronal orientation of the 3D images.
Analysis of brain volumes and shapes
The 3D reconstructed habenula was analyzed using the functions of surface volumetric and shape analysis in Amira software. The volume and shape of habenula between groups of control and LPS-mediated depressive mice were compared using the function in Amira software.
In situ hybridization
Frozen sections of 14-μm thick were serially and coronally cut through the habenula formation. Sections were thaw-mounted onto Superfrost Plus Microscope Slides (Fisher Scientific #12-550-15). The sections were fixed in 4% PFA for 10 min, dehydrated in increasing concentrations of ethanol for 5 min, and finally airdried. Tissues were then pretreated for protease digestion for 10 min at room temperature. Probe hybridization and amplification were performed at 40°C using HybEZ hybridization oven (Advanced Cell Diagnostics, Hayward, CA). The probes used in this study were three synthetic oligonucleotides complementary to the nucleotide sequence 845–1755 of Mm Tacr1, 1090–1952 of ChAT-C2, and 20–1034 of Tac1-C3 (Advanced Cell Diagnostics, Hayward, CA). The labeled probes were conjugated to Alexa Fluor 488, Atto 550, and Atto 647. The sections were then hybridized with the labeled probe mixture at 40°C for 2 h per slide. Unbound hybridization probes were removed by washing the sections three times with 1× wash buffer at room temperature for 2 min. Following steps for signal amplification included incubations at 40°C with Amplifier 1-FL for 30 min, with Amplifier 2-FL for 15 min, with Amplifier 3-FL for 30 min, and with Amplifier 4 Alt B-FL for 15 min. Each amplifier solution was removed by washing with 1× wash buffer at room temperature for 2 min. The slides were viewed, analyzed, and photographed using TCS SP8 Dichroic/CS (Leica), and the Image J program (NIH) was used for image analysis.
Statistical analysis
Statistical analysis was conducted using GraphPad prism5 software (GraphPad, San Diego, CA, USA). Unpaired Student’s
RESULTS
Assessment of habenula structural changes using 3D reconstruction
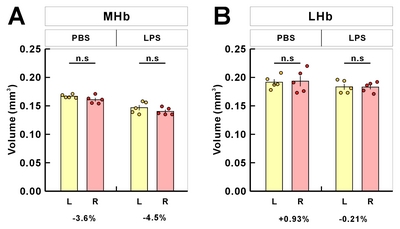
To assess the Hb volume, brain slices containing the whole Hb were isolated and cleared using the previously confirmed tissueclearing method, ACT [23]. The cleared brain sections including whole habenula were counterstained with the green-fluorescent nuclei acid stain SYTO16 to visualize the cell nuclei, imaged by confocal microscopy (Fig. 1A), and the volume images were reconstructed using the Amira software (Fig. 1B). Although this or related polymer-based tissue clearing methods cause transient tissue expansion during the processing, the final volume obtained in the CUBIC-mount solution is known to be identical to the original tissue volume [20], allowing the precise volumetry. Consistent with the previous report and through the two-dimensional morphology of the immunolabeled habenula [5], we were able to measure the different shaped contours of MHb and LHb from rostral to caudal habenula (Fig. 1C and Supplementary Movie S1). The habenula volumes in albino rat, chronic stressed rat, albino mouse, and humans have been reported to be asymmetric [11, 24–26]. In albino rats, Hb size asymmetry was reported with the left MHb being lightly larger than the one in the right one by 5%. In mice, there were no significant differences in left and right volume of LHb, but the left MHb was 3.6% (PBS-injected mice) and 4.5% (LPS-injected mice) larger than the right MHb (Fig. 2 and Table 1).
Habenula volume changes in the LPS-injected mouse
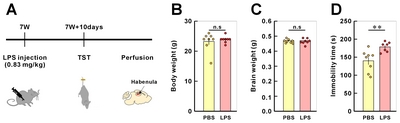
After PBS or LPS injection of 8-week-old mice, depressive like behavior of injected mice was assessed by tail-suspension test (TST) at 10-day post injection. Compared to PBS-injected mice, LPS-injected mice showed a significant increase in the immobile tile of TST (Fig. 3). We developed a standard protocol which includes image acquisition and 3D reconstruction and is briefly described and illustrated in Fig. 1.
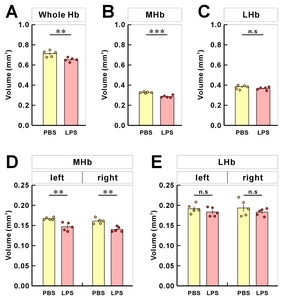
After the 3D reconstruction, we compared the volume and shape of habenula between PBS- and LPS-injected mice by demarking the habenula by MHb and LHb regions. The total volume of habenula was reduced by 8.3% (Fig. 4A) and the volume of MHb by 12.4% (Fig. 4B) in LPS-injected mice compared to PBS-injected mice. On the other hand, we found no significant difference in LHb volume between the PBS- and LPS-injected groups (Fig. 4C). This MHb atrophy was accompanied by a decrease in volume of both the right and left MHb (Fig. 4D). For LHb, there was a volume reduction in both right and left LHb but no statistical significances were observed between PBS- and LPS-injected mice (Fig. 4E).
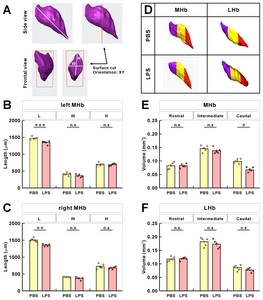
To further analyze the changes in the two-dimensional units that make up the 3D structure and contributing to volume reduction, we divided the Hb structure into three units: “L” being the longest diagonal line at both ends in the Hb structure, and “W” and “H” being the width and height in the widest Hb section, respectively (Fig. 5A). The “L” of habenula was shorter in the LPS-injected mice than that of PBS-injected mice (Fig. 5B and 5C). “W” and “H” in the widest section tended to be less in the LPS-injected mice, but that was not significant. Although length (“L”) of MHb changes were statistically significant, decreases at other indices seemed to contribute to volume reduction seen in the LPS-injected mice. To further investigate the extent of volume reduction in the regional position, we divided the number of whole brain sections of MHb and LHb into three equal parts of rostral, middle, and caudal regions, and compared the volume changes for each (Fig. 5D). Interestingly, analysis indicated that the volume changes of MHb decreased remarkably in the caudal region for the LPS-injected mice compared to rostral and middle regions (Fig. 5E). For the regional volume changes of LHb, however, there were no significant differences with respect to the rostral, intermediate, and caudal regions (Fig. 5F).
Distribution and gene expression changes of Tac1, ChAT, and Tacr1
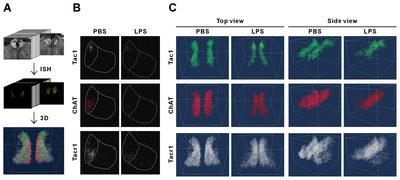
As the identification of subregions in MHb or LHb is not available with SYTO16 staining, we next observed the distribution and expressional changes of specific subregion marker genes in the habenula. Based on the results of Aizawa et al. [2], and those in Allen Brain Atlas (
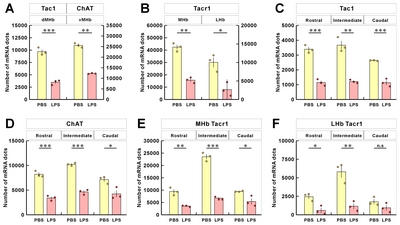
The mRNA signals from these three genes were, however, reduced for LPS-injected mice compared to PBS-injected mice (Fig. 6B and 6C; Supplementary Movie S2~S5, left and right panels are PBS and LPS groups, respectively). To determine whether the changes in mRNA expression was regionally different in the rostral, middle, and caudal parts of habenula, we quantitated and compared the mRNA expression by region. We have previously reported a decrease in the ChAT gene in habenula of chronic restrain stress rats and MDD suicide patients [27]; this was also reduced in the LPS-injected depressive mouse model. The total expressions of the other two genes, Tac1 and ChAT, were significantly decreased in LPS-injected mice compared with PBS-injected mice (Fig. 7A). The decreased expression of the Tacr1 was observed in both subnuclei (Fig. 7B). For the subdivisions of the habenula mentioned above, Tac1 was evenly reduced, and that of ChAT was decreased less so in the caudal region (Fig 7C and 7D). Similarly, Tacr1 expression was also decreased to a lesser degree in the caudal region of MHb as was the case for ChAT (Fig. 7E). No statistical significance (designated as “n.s”) was shown for changes seen in the caudal region of LHb for Tacr1 (Fig. 7F).
DISCUSSION
In this study, we successfully applied tissue clearing-based volumetry method to document the shrinkage of Hb regions in the mouse model of depression. Until recently, neuroimaging studies for assessing functional responses in human habenula have utilized high-resolution MRI. However, currently, an MRI analysis has insufficient resolution to discriminate the volume changes of small brain regions with the total habenula volume being estimated in humans to be ~31 mm3 on the left and ~33 mm3 on the right side [10]. The habenula volume suggested in rats for a depression model is around ~0.55 mm3 [11], and our current study estimates the habenula volume of mice to be approximately ~0.35 mm3. Considering the volume of rat habenula reported by Jacinto et al. was 0.55 mm3 [11], mouse habenula appeared to be about 100- and 1.6-fold smaller than in human and rat, respectively. We believe that our current method with tissue clearing offers a rapid and accurate means of precise measurement for small volumes.
In the LPS-induced mice model of depression, the volume reductions documented here were more pronounced in the caudal region and in the posterior rather than the anterior region of MHb (Fig. 5E). Our results demonstrate that only the MHb volume was reduced. As the MHb volume is smaller than that for LHb, it is conceivable that documenting such volume changes for Hb would be difficult in human MDD patients and without proper resolution. Unlike our results for selective MHb volume reduction, Wistar-Hans rats exposed to chronic unpredictable stress showed a volume reduction in LHb as well as MHb [11]. Whereas LHb has diverse neural connectivity receiving inputs from various brain regions, including globus pallidus, diagonal band nuclei, medial prefrontal cortex, ventral pallidum, nucleus accumbens, lateral hypothalamic area, and lateral preoptic area, MHb primarily receives inputs from the posterior septum [28, 29]. Unlike the LHb region which is primarily glutamatergic, MHb consists of substance Pergic and cholinergic neurons co-releasing glutamate in the dorsal and ventral parts, respectively [2]. In addition, MHb and LHb show significant differences in the chemical properties and morphology of associated astrocytes. Compared with LHb, MHb astrocytes have long and larminar processes around the neuron cell bodies and axons and express higher levels of glial fibrillary acidic protein (GFAP), a well-known astrocyte marker. MHb astrocytes are also peculiar in that they predominantly express ectonucleotidase NTPDase2 hydrolyzing adenosine triphosphate (ATP) [30, 31]. Presence of this enzyme supports the observation that in MHb, axons from the septal nucleus release ATP which acts as a fast neurotransmitter [32]. On the other hand, astrocytes from LHb have stellate morphology and predominantly express glutamate transporters GLT-1 as well as GLAST which modulate neuronal activity in LHb by reuptake of extracellular glutamate [30, 31]. Systemic LPS administration activates microglia and astrocytes and induces cytokine and chemokine production in the brain, including TNFα and interleukin-4; this results in brain inflammation and chronic neurodegeneration [33, 34]. During neurodegeneration, there is a variety of progressive loss of neuronal structure or function such as subtle changes of dendritic spine morphology and arborization and also death of neurons. LPS administration is known to alter expression of GFAP [35], which plays a role in astrocyte-neuron interactions. Astrocytes provide a connection between blood vessels and neurons that carry glucose and other substances out of the bloodstream [36–38]. The reason why GFAP-expressing astrocytes are concentrated in MHb is probably because of the stable support of energy and various substances required by MHb neurons. For this reason, various inflammation-related cytokines from LPS appear to be concentrated in MHb rather than LHb. As such, the selective MHb volume reduction in LPS-induced depressed mice may be due to differences in responsiveness to depressive factors, intrinsic cell properties, and distinct neuronal circuits implicated in depression caused by LPS-induced inflammation. Because there have been no reports of neuronal heterogeneity and input-output neural circuits throughout the rostro-caudal axis of Hb, the significant decrease in volume in the caudal part of MHb in LPS-treated mice suggests that the anatomical and functional characteristics at the rostral-caudal level of MHb subnuclei should be further studied.
For identifying the subregions of Hb, marker genes have often been utilized [39, 40]. Similarly, for assessing the subregions of Hb, we selected three genes that are regional markers of Hb. We found that the expressions of these genes were markedly affected in LPS-treated mice, potentially affecting the demarking the subregion boundaries and causing biased measurements. Thus, we propose that these markers should be used with caution when assessing volume changes. Instead of a direct estimation of volume from ISH data, we analyzed changes in the local density of the ISH signals, the absolute number of ISH signals, and a normalized number based on our volumetric data. In this way, we believe that we could achieve a more accurate interpretation of the changes observed.
With normalization, it was clear that there were significant reductions in these marker genes in LPS-treated mice compared with control. These three markers are also known to be functionally related to changes in behavior. We previously reported that MHb-specific ChAT knockdown induced anhedonia-like behavior in rats [27]. Tac1 and Tacr1 are also known to be associated with various affective disorders in human patients and animal models [41–44]. Antagonism between substance P expressed from Tac1 gene and its receptor Tacr1 have been shown to produce antidepressant or antianxiety-like effects [41, 45, 46]. In addition, either chronic restraint stress or pain has been known to down-regulate hippocampal Tacr1 expression in Sprague-Dawley rats despite an increased volume of hippocampus [47]. However, along with a volume reduction in MHb, reduced Tacr1 mRNA expression in MHb was also observed in LPS-mediated depressive mice (Fig. 7B and 7E). Although there were no documented changes in LHb volume (Fig. 4C and 5F), the mRNA levels of Tacr1 gene expressed in LHb were reduced, and these decreases were statistically significant in the rostral and intermediate regions, but not in the caudal region of LHb (Fig. 7F). Since there were no volume decreases in LHb, this suggests that the reduction of Tacr1 expression in LHb may simply be independent of changes in cell density. These results also suggest that LHb neurons structurally differ in the anterior and posterior regions and form neural connections that include distinct neuronal properties in the longitudinal direction.
In summary, we established a subnucleus-specific 3-dimenstional (3D) analysis of the whole Hb brain with ACT method without thin sectioning and have provided the information on supplemental changes for mRNA expression in the Hb subregions with respect to specific marker genes. Furthermore, our analysis platform may be applicable to various other emotional mouse models in addition to LPS-injected mice.
Supplementary Material
ACKNOWLEDGEMENTS
This work was supported by the Brain Program through the National Research Foundation of Korea (NRF), funded by the Ministry of Science, ICT & Future Planning [NRF-2017M3C7A1079692 to H. Kim; NRF-2017R1D1AB06032730 to H.W.Lee].
Figures
Tables
Table 1 Mean volumes and left-right differences from volumetric analysis of habenula in mouse samples
| Region | Volume (mm3) | Symmetry | ||||
|---|---|---|---|---|---|---|
| PBS | LPS | PBS | LPS | |||
| L | R | L | R | L-R (mm3) | ||
| Hb | 0.3584±0.0045 | 0.3542±0.0031 | 0.3302±0.0116 | 0.3232±0.0064 | 0.0042 | 0.0070 |
| MHb | 0.1668±0.0014 | 0.1608±0.0031 | 0.1468±0.0045 | 0.1402±0.0029 | 0.0060 | 0.0066 |
| LHb | 0.1916±0.0051 | 0.1934±0.0090 | 0.1834±0.0050 | 0.1830±0.0039 | −0.0018 | 0.0004 |
Hb, habenular complex; MHb, medial habenula; LHb, lateral habenula; R, right; L, left.
References
- Fakhoury M (2017) The habenula in psychiatric disorders:more than three decades of translational investigation. Neurosci Biobehav Rev 83:721-735.


- Aizawa H, Kobayashi M, Tanaka S, Fukai T, Okamoto H (2012) Molecular characterization of the subnuclei in rat habenula. J Comp Neurol 520:4051-4066.
- Geisler S, Andres KH, Veh RW (2003) Morphologic and cytochemical criteria for the identification and delineation of individual subnuclei within the lateral habenular complex of the rat. J Comp Neurol 458:78-97.
- Díaz E, Bravo D, Rojas X, Concha ML (2011) Morphologic and immunohistochemical organization of the human habenular complex. J Comp Neurol 519:3727-3747.
- Andres KH, von Düring M, Veh RW (1999) Subnuclear organization of the rat habenular complexes. J Comp Neurol 407:130-150.
- Mormède C, Palin K, Kelley KW, Castanon N, Dantzer R (2004) Conditioned taste aversion with lipopolysaccharide and peptidoglycan does not activate cytokine gene expression in the spleen and hypothalamus of mice. Brain Behav Immun 18:186-200.
- Brischoux F, Chakraborty S, Brierley DI, Ungless MA (2009) Phasic excitation of dopamine neurons in ventral VTA by noxious stimuli. Proc Natl Acad Sci U S A 106:4894-4899.

- Tan KR, Yvon C, Turiault M, Mirzabekov JJ, Doehner J, Labouèbe G, Deisseroth K, Tye KM, Lüscher C (2012) GABA neurons of the VTA drive conditioned place aversion. Neuron 73:1173-1183.
- Wagner F, French L, Veh RW (2016) Transcriptomic-anatomic analysis of the mouse habenula uncovers a high molecular heterogeneity among neurons in the lateral complex, while gene expression in the medial complex largely obeys subnuclear boundaries. Brain Struct Funct 221:39-58.
- Ranft K, Dobrowolny H, Krell D, Bielau H, Bogerts B, Bernstein HG (2010) Evidence for structural abnormalities of the human habenular complex in affective disorders but not in schizophrenia. Psychol Med 40:557-567.
- Jacinto LR, Mata R, Novais A, Marques F, Sousa N (2017) The habenula as a critical node in chronic stress-related anxiety. Exp Neurol 289:46-54.
- Savitz JB, Nugent AC, Bogers W, Roiser JP, Bain EE, Neumeister A, Zarate CA Jr, Manji HK, Cannon DM, Marrett S, Henn F, Charney DS, Drevets WC (2011) Habenula volume in bipolar disorder and major depressive disorder: a high-resolution magnetic resonance imaging study. Biol Psychiatry 69:336343.
- Schmidt FM, Schindler S, Adamidis M, Strauß M, Tränkner A, Trampel R, Walter M, Hegerl U, Turner R, Geyer S, Schönknecht P (2017) Habenula volume increases with disease severity in unmedicated major depressive disorder as revealed by 7T MRI. Eur Arch Psychiatry Clin Neurosci 267:107-115.
- Carceller-Sindreu M, de Diego-Adeliño J, Serra-Blasco M, Vives-Gilabert Y, Martín-Blanco A, Puigdemont D, Álvarez E, Pérez V, Portella MJ (2015) Volumetric MRI study of the habenula in first episode, recurrent and chronic major depression. Eur Neuropsychopharmacol 25:2015-2021.
- Zhang L, Wang H, Luan S, Yang S, Wang Z, Wang J, Zhao H (2017) Altered volume and functional connectivity of the habenula in schizophrenia. Front Hum Neurosci 11:636.
- Remus JL, Dantzer R (2016) Inflammation models of depression in rodents: relevance to psychotropic drug discovery. Int J Neuropsychopharmacol 19:pyw028.
- Lee S, Kim HB, Hwang ES, Kim ES, Kim SS, Jeon TD, Song MC, Lee JS, Chung MC, Maeng S, Park JH (2018) Antidepressantlike effects of p-Coumaric acid on LPS-induced depressive and inflammatory changes in rats. Exp Neurobiol 27:189-199.
- Sulakhiya K, Keshavlal GP, Bezbaruah BB, Dwivedi S, Gurjar SS, Munde N, Jangra A, Lahkar M, Gogoi R (2016) Lipopolysaccharide induced anxiety- and depressive-like behaviour in mice are prevented by chronic pre-treatment of esculetin. Neurosci Lett 611:106-111.
- O'Connor JC, Lawson MA, André C, Moreau M, Lestage J, Castanon N, Kelley KW, Dantzer R (2009) Lipopolysaccharideinduced depressive-like behavior is mediated by indoleamine 2,3-dioxygenase activation in mice. Mol Psychiatry 14:511-522.
- Lee E, Choi J, Jo Y, Kim JY, Jang YJ, Lee HM, Kim SY, Lee HJ, Cho K, Jung N, Hur EM, Jeong SJ, Moon C, Choe Y, Rhyu IJ, Kim H, Sun W (2016) ACT-PRESTO: rapid and consistent tissue clearing and labeling method for 3-dimensional (3D) imaging. Sci Rep 6:18631.
- Painsipp E, Köfer MJ, Sinner F, Holzer P (2011) Prolonged depression-like behavior caused by immune challenge: influence of mouse strain and social environment. PLoS One 6:e20719.
- Walker AK, Kavelaars A, Heijnen CJ, Dantzer R (2013) Neuroinflammation and comorbidity of pain and depression. Pharmacol Rev 66:80-101.
- Chung K, Deisseroth K (2013) CLARITY for mapping the nervous system. Nat Methods 10:508-513.
- Wree A, Zilles K, Schleicher A (1981) Growth of fresh volumes and spontaneous cell death in the nuclei habenulae of albino rats during ontogenesis. Anat Embryol (Berl) 161:419431.
- Concha ML, Wilson SW (2001) Asymmetry in the epithalamus of vertebrates. J Anat 199:63-84.
- Ahumada-Galleguillos P, Lemus CG, Díaz E, Osorio-Reich M, Härtel S, Concha ML (2017) Directional asymmetry in the volume of the human habenula. Brain Struct Funct 222:10871092.
- Han S, Yang SH, Kim JY, Mo S, Yang E, Song KM, Ham BJ, Mechawar N, Turecki G, Lee HW, Kim H (2017) Downregulation of cholinergic signaling in the habenula induces anhedonia-like behavior. Sci Rep 7:900.
- Aizawa H, Zhu M (2019) Toward an understanding of the habenula's various roles in human depression. Psychiatry Clin Neurosci 73:607-612.
- Yang Y, Wang H, Hu J, Hu H (2018) Lateral habenula in the pathophysiology of depression. Curr Opin Neurobiol 48:9096.
- Gampe K, Hammer K, Kittel Á, Zimmermann H (2012) The medial habenula contains a specific nonstellate subtype of astrocyte expressing the ectonucleotidase NTPDase2. Glia 60:1860-1870.
- Cui W, Mizukami H, Yanagisawa M, Aida T, Nomura M, Isomura Y, Takayanagi R, Ozawa K, Tanaka K, Aizawa H (2014) Glial dysfunction in the mouse habenula causes depressivelike behaviors and sleep disturbance. J Neurosci 34:1627316285.
- Sperlágh B, Kittel A, Lajtha A, Vizi ES (1995) ATP acts as fast neurotransmitter in rat habenula: neurochemical and enzymecytochemical evidence. Neuroscience 66:915-920.
- Lull ME, Block ML (2010) Microglial activation and chronic neurodegeneration. Neurotherapeutics 7:354-365.
- Bok E, Cho EJ, Chung ES, Shin WH, Jin BK (2018) Interleukin4 contributes to degeneration of dopamine neurons in the lipopolysaccharide-treated substantia nigra in vivo . Exp Neurobiol 27:309-319.
- Yang Z, Wang KK (2015) Glial fibrillary acidic protein: from intermediate filament assembly and gliosis to neurobiomarker. Trends Neurosci 38:364-374.
- Tsacopoulos M, Magistretti PJ (1996) Metabolic coupling between glia and neurons. J Neurosci 16:877-885.
- Magistretti PJ, Pellerin L (1999) Astrocytes couple synaptic activity to glucose utilization in the brain. News Physiol Sci 14:177-182.
- Joe EH, Choi DJ, An J, Eun JH, Jou I, Park S (2018) Astrocytes, microglia, and Parkinson's disease. Exp Neurobiol 27:77-87.
- Quina LA, Wang S, Ng L, Turner EE (2009) Brn3a and Nurr1 mediate a gene regulatory pathway for habenula development. J Neurosci 29:14309-14322.
- Wagner F, Bernard R, Derst C, French L, Veh RW (2016) Microarray analysis of transcripts with elevated expressions in the rat medial or lateral habenula suggest fast GABAergic excitation in the medial habenula and habenular involvement in the regulation of feeding and energy balance. Brain Struct Funct 221:4663-4689.
- Holmes A, Heilig M, Rupniak NM, Steckler T, Griebel G (2003) Neuropeptide systems as novel therapeutic targets for depression and anxiety disorders. Trends Pharmacol Sci 24:580-588.
- Sharp SI, McQuillin A, Marks M, Hunt SP, Stanford SC, Lydall GJ, Morgan MY, Asherson P, Curtis D, Gurling HM (2014) Genetic association of the tachykinin receptor 1 TACR1 gene in bipolar disorder, attention deficit hyperactivity disorder, and the alcohol dependence syndrome. Am J Med Genet B Neuropsychiatr Genet 165B:373-380.
- Rupniak NM, Carlson EJ, Webb JK, Harrison T, Porsolt RD, Roux S, de Felipe C, Hunt SP, Oates B, Wheeldon A (2001) Comparison of the phenotype of NK1R-/- mice with pharmacological blockade of the substance P (NK1 ) receptor in assays for antidepressant and anxiolytic drugs. Behav Pharmacol 12:497-508.
- Santarelli L, Gobbi G, Debs PC, Sibille ET, Blier P, Hen R, Heath MJ (2001) Genetic and pharmacological disruption of neurokinin 1 receptor function decreases anxiety-related behaviors and increases serotonergic function. Proc Natl Acad Sci U S A 98:1912-1917.
- Papp M, Vassout A, Gentsch C (2000) The NK1-receptor antagonist NKP608 has an antidepressant-like effect in the chronic mild stress model of depression in rats. Behav Brain Res 115:19-23.
- Kramer MS, Cutler N, Feighner J, Shrivastava R, Carman J, Sramek JJ, Reines SA, Liu G, Snavely D, Wyatt-Knowles E, Hale JJ, Mills SG, MacCoss M, Swain CJ, Harrison T, Hill RG, Hefti F, Scolnick EM, Cascieri MA, Chicchi GG, Sadowski S, Williams AR, Hewson L, Smith D, Carlson EJ, Hargreaves RJ, Rupniak NM (1998) Distinct mechanism for antidepressant activity by blockade of central substance P receptors. Science 281:1640-1645.
- Duric V, McCarson KE (2005) Hippocampal neurokinin-1 receptor and brain-derived neurotrophic factor gene expression is decreased in rat models of pain and stress. Neuroscience 133:999-1006.