the Creative Commons Attribution 4.0 License.
the Creative Commons Attribution 4.0 License.
 | 10 Sep 2021
Holocene sea-ice dynamics in Petermann Fjord in relation to ice tongue stability and Nares Strait ice arch formation
Henrieka Detlef
Brendan Reilly
Anne Jennings
Mads Mørk Jensen
Matt O'Regan
Marianne Glasius
Jesper Olsen
Martin Jakobsson
Christof Pearce
The Petermann 2015 expedition to Petermann Fjord and adjacent Hall Basin recovered a transect of cores, extending from Nares Strait to underneath the 48 km long ice tongue of Petermann glacier, offering a unique opportunity to study ice–ocean–sea ice interactions at the interface of these realms. First results suggest that no ice tongue existed in Petermann Fjord for large parts of the Holocene, raising the question of the role of the ocean and the marine cryosphere in the collapse and re-establishment of the ice tongue. Here we use a multi-proxy approach (sea-ice-related biomarkers, total organic carbon and its carbon isotopic composition, and benthic and planktonic foraminiferal abundances) to explore Holocene sea ice dynamics at OD1507-03TC-41GC-03PC in outer Petermann Fjord. Our results are in line with a tight coupling of the marine and terrestrial cryosphere in this region and, in connection with other regional sea ice reconstructions, give insights into the Holocene evolution of ice arches and associated landfast ice in Nares Strait.
The late stages of the regional Holocene Thermal Maximum (6900–5500 cal yr BP) were marked by reduced seasonal sea ice concentrations in Nares Strait and the lack of ice arch formation. This was followed by a transitional period towards Neoglacial cooling from 5500–3500 cal yr BP, where a southern ice arch might have formed, but an early seasonal breakup and late formation likely caused a prolonged open water season and enhanced pelagic productivity in Nares Strait. Between 3500 and 1400 cal yr BP, regional records suggest the formation of a stable northern ice arch only, with a short period from 2500–2100 cal yr BP where a southern ice arch might have formed intermittently in response to atmospheric cooling spikes. A stable southern ice arch, or even double arching, is also inferred for the period after 1400 cal yr BP. Thus, both the inception of a small Petermann ice tongue at ∼ 2200 cal yr BP and its rapid expansion at ∼ 600 cal yr BP are preceded by a transition towards a southern ice arch regime with landfast ice formation in Nares Strait, suggesting a stabilizing effect of landfast sea ice on Petermann Glacier.
- Article
(7716 KB) -
Supplement
(2009 KB) - BibTeX
- EndNote


Nares Strait, connecting the Lincoln Sea to the northern Baffin Bay, is an important conduit for sea ice, freshwater, and heat between the Arctic Ocean and the western North Atlantic. The annual flux of freshwater through Nares Strait, in liquid and solid form, heavily depends on the seasonal formation of ice arches (Kwok et al., 2010; Münchow, 2016; Rasmussen et al., 2010). Ice arches form when drift ice converges in a narrow passage between two landmasses. In Nares Strait their formation depends primarily on the sea ice thickness, local wind stresses, and atmospheric temperatures (Barber et al., 2001; Kwok et al., 2010; Samelson et al., 2006). Ice arching inhibits sea ice export from the Arctic Ocean and allows the formation of landfast ice in Nares Strait, consisting of a mixture of multi-year drift ice, originating from the Arctic Ocean, and locally formed first-year ice (Kwok, 2005; Kwok et al., 2010). Historically, the formation of a northern and southern arch has been observed in Robeson Channel and Smith Sound, respectively (Fig. 1) (Vincent, 2019). In recent decades, however, changes in the ice arch configuration suggest a transition in Nares Strait sea ice dynamics. Between 1979 and 2019, Nares Strait was blocked for sea ice passage on average 161 d per season with a consistent decrease of 2.1 d yr−1 throughout this period (Vincent, 2019). This is associated with a shift from a prominent southern ice arch towards increased importance of the northern arch (Vincent, 2019). In the winter of 2006/2007 both ice arches failed to form for the first time in recorded history, causing sea ice to remain mobile in Nares Strait year-round (Kwok et al., 2010; Vincent, 2019) (Fig. 2, Supplement Fig. S1). The observed changes in Nares Strait sea ice dynamics likely have significant consequences for the export of multi-year sea ice from the Lincoln Sea and long-term Arctic sea ice loss (Kwok et al., 2010; Moore et al., 2021; Vincent, 2019) (Fig. 2). Additionally, the formation of the southern ice arch in Smith Sound is crucial for the annual opening of the North Water Polynya (NOW) (Fig. 1) and the formation of landfast sea ice in Nares Strait (Barber et al., 2001).

Figure 1Map of the study area. (a) Map of the North Atlantic, including major surface currents (AW: modified Atlantic Water; BC: Baffin Current; BG: Beaufort Gyre; EGC: East Greenland Current; IC: Irminger Current; ILC: Inner Labrador Current; NAC: North Atlantic Current; NC: Norwegian Current; OLC: Outer Labrador Current; TPD: Transpolar Drift; WGC: West Greenland Current; WSC: West Spitsbergen Current), median August (dashed, pink) and March (dashed, yellow) sea ice extent from 1981–2010 (Fetterer et al., 2017), the velocity of the Greenland Ice Sheet (GrIS) 2016/2017 (Nagler et al., 2015), and the location of Disraeli Fiord (Ellesmere Island). The approximate extent of the NOW polynya (mean extent in May 1954–1968) (Dunbar, 1969) is indicated with a black dashed line. (b) Close-up of Nares Strait, connecting Lincoln Sea to northern Baffin Bay, consisting of Robeson Channel (RC), Hall Basin (HB), Kennedy Channel (KC), Kane Basin (KB), and Smith Sound. The red stars indicate additional sediment cores discussed in this paper. These are AMD14-Kane2b (Kane Basin; Georgiadis et al., 2020), CASQ1 (central NOW; Jackson et al., 2021), and 91-039-008P (central NOW; Knudsen et al., 2008). (c) Close up of the Petermann Fjord and Petermann glacier (satellite image from “NASA Worldview” https://worldview.earthdata.nasa.gov/, last access: 19 February 2020) including the location of Clements Markham Inlet (CMI), the Hall Basin and Petermann Fjord bathymetry (Jakobsson et al., 2018), the velocity of the Greenland Ice Sheet (GrIS) 2016/2017 (Nagler et al., 2015), the grounding zone location of Petermann glacier (black, dashed), and the ice tongue extent in July 2010 (orange, dashed) and 2012 (red, dashed). The core location of OD1507-03TC-41GC-03PC is indicated with a yellow star, and the black dots show additional core sites from the Petermann 2015 expedition used in Reilly et al. (2019) to reconstruct the Holocene extent of the PG ice tongue.
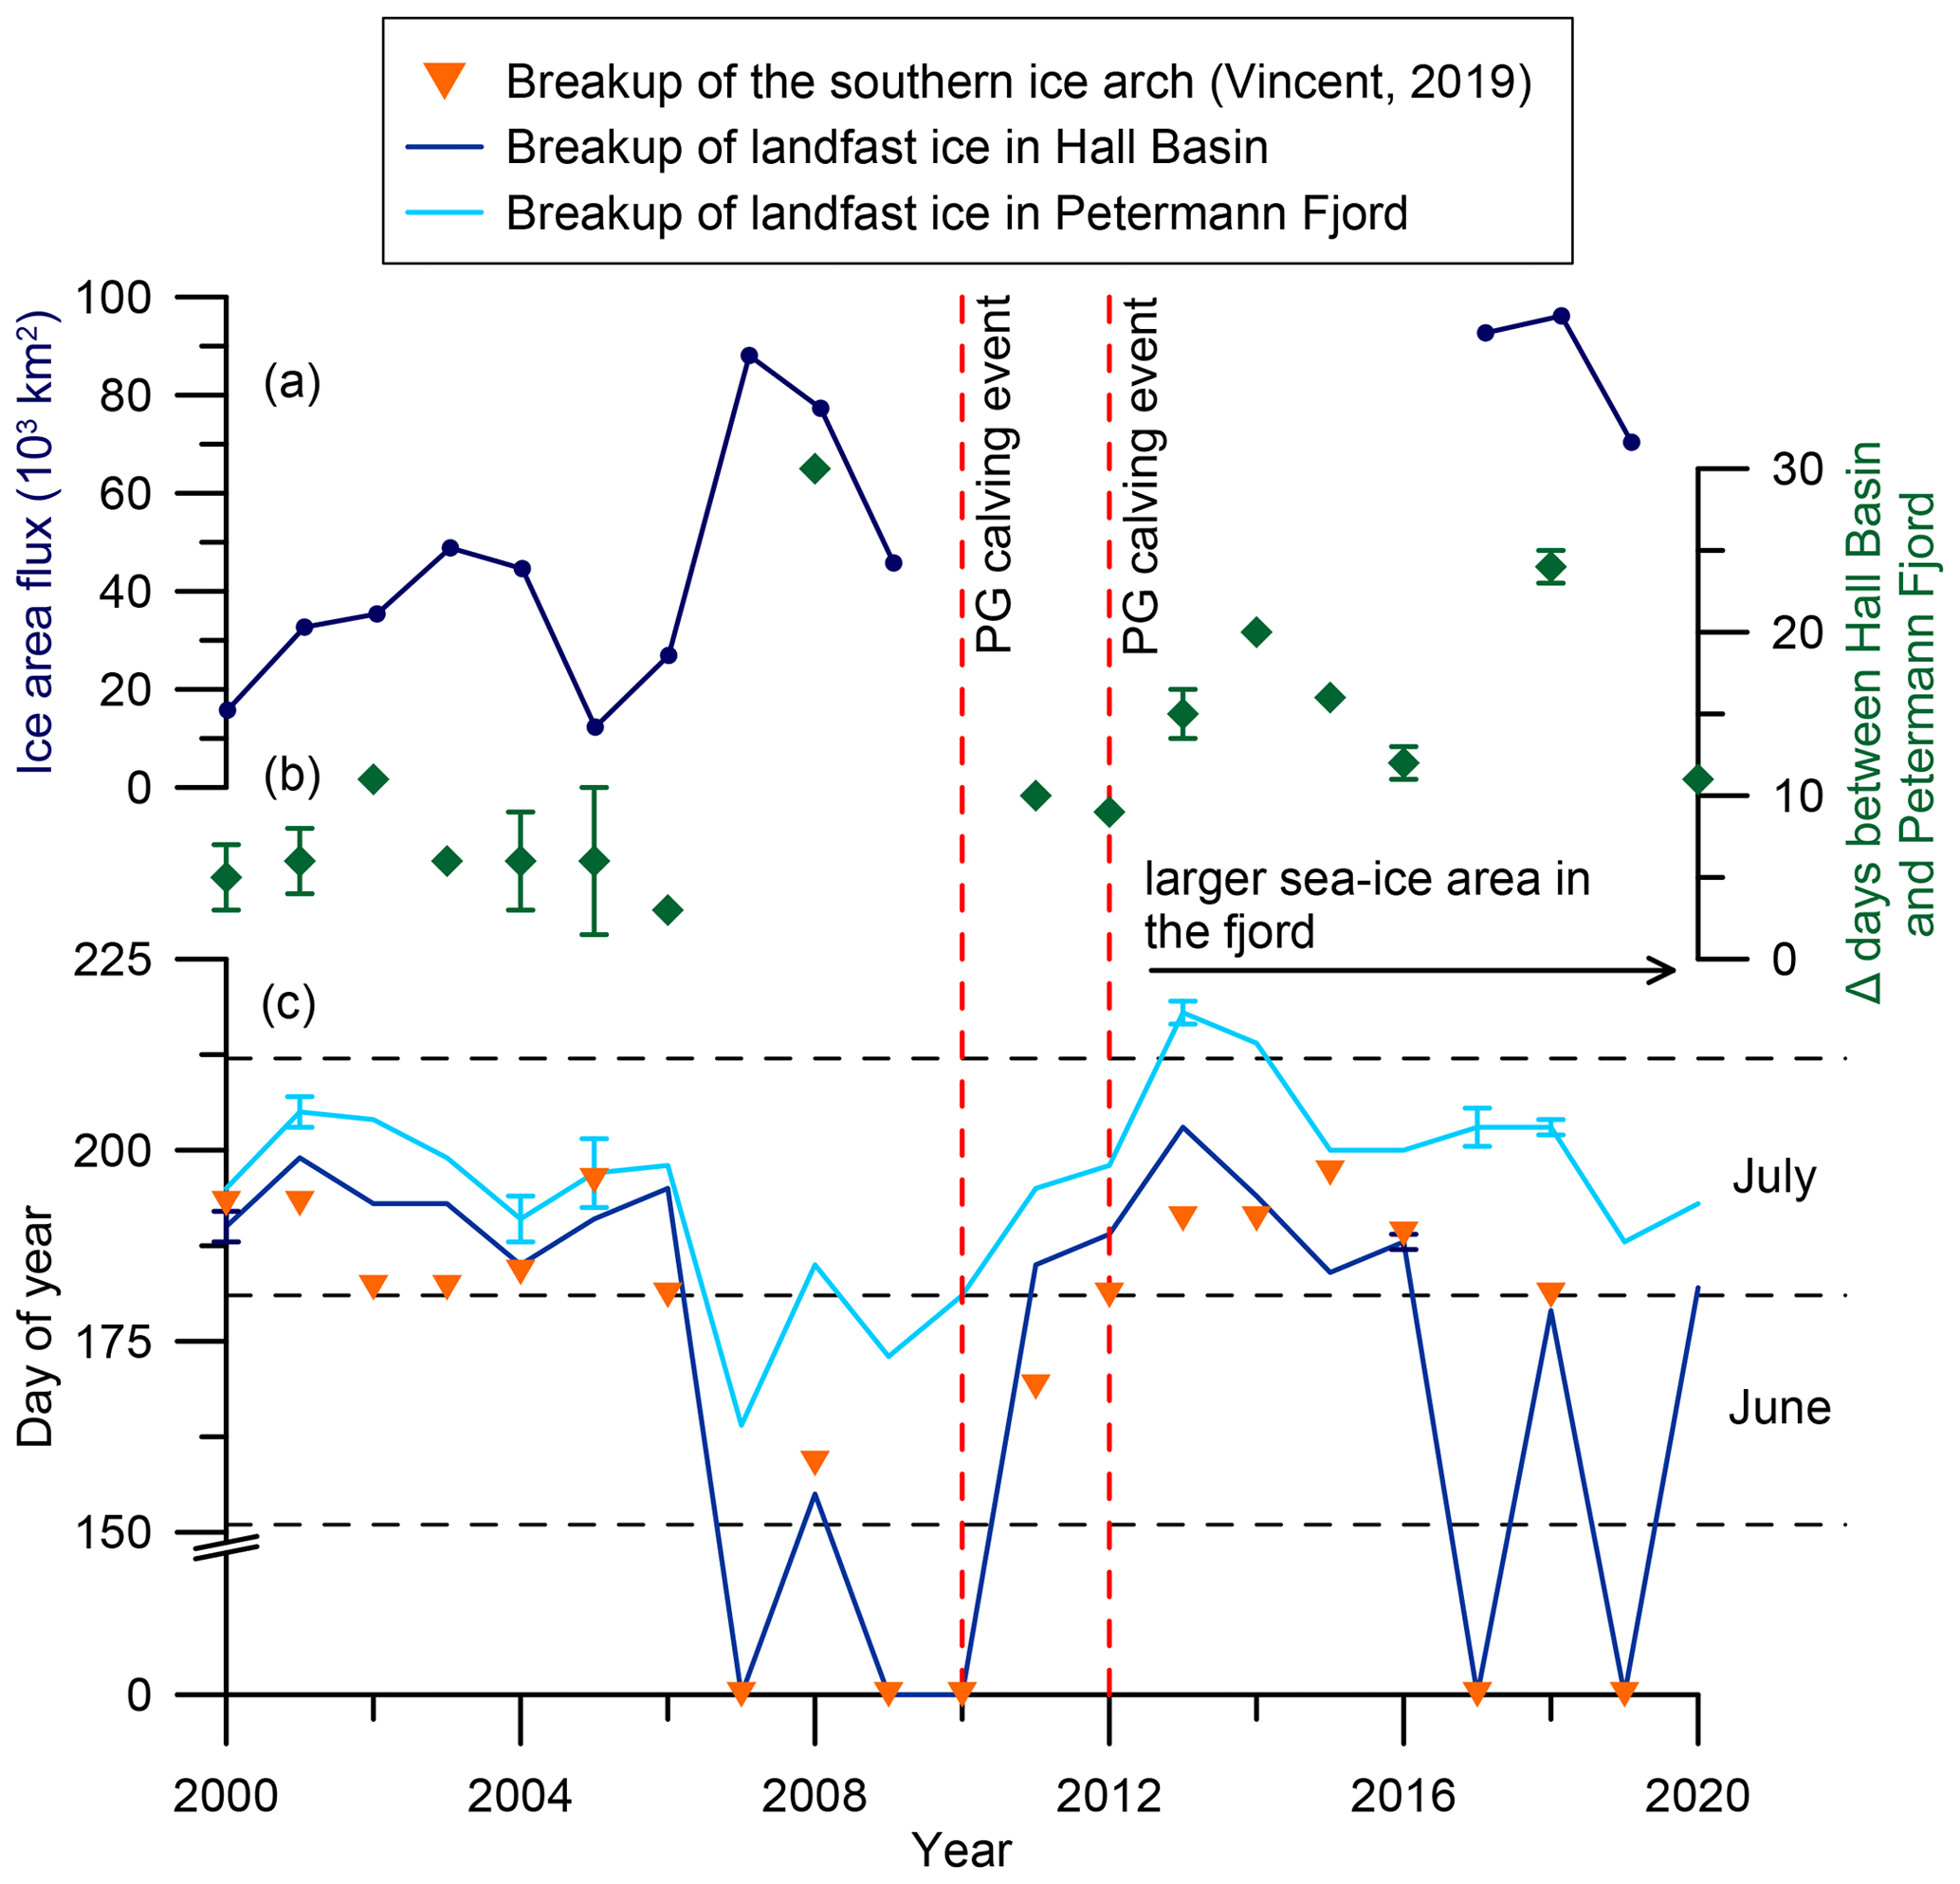
Figure 2Modern ice arch dynamics in Nares Strait. (a) Annual mean ice area flux through southern Lincoln Sea flux gate (2000–2009, Kwok et al., 2010; 2017–2019, Moore et al., 2021). (b) Difference between ice breakup in Hall Basin and Petermann Fjord in days. After 2010/2012 the differences increase due to the larger sea ice area in Petermann Fjord following the retreat of the ice tongue. (c) Time series of approximate landfast sea ice breakup in Petermann Fjord (light blue) and Hall Basin (dark blue) from 2000–2020 estimated from https://worldview.earthdata.nasa.gov/. The orange triangles represent the day of year when the southern ice arch collapsed (Vincent, 2019). Where the Hall Basin and ice arch breakup record have a day of year of zero, landfast sea ice did not form in Nares Strait throughout the entire year. Where cloud cover inhibited the exact determination of the day of landfast sea ice breakup, the average between the last clear day with landfast ice and the first clear day following ice breakup was used (Hall Basin: 2000, 2016; Petermann Fjord: 2001, 2004, 2005, 2013, 2017, 2018). Error bars indicate the time span where cloud cover inhibited clear determination of the sea ice state. The dashed vertical lines indicate years of substantial ice tongue calving in Petermann Fjord.
The water column in Nares Strait is characterized by cold and fresh Polar Water (PW) in the upper 50–100 m with warmer and more saline modified Atlantic Water (AW) below, separated by a strong halocline (Johnson et al., 2011; Münchow et al., 2014). Under landfast sea ice conditions, Ekman transport causes eastward displacement of cold and fresh PW towards the Greenland coast (Rabe et al., 2012; Shroyer et al., 2015, 2017). Conversely, mobile sea ice leads to westward Ekman transport of PW and upwelling of AW in the east, increasing the oceanic heat flux to fjord systems along the Greenland coast of Nares Strait (Münchow et al., 2007; Shroyer et al., 2017). Outlet glaciers draining into fjords in the north and northeast of Greenland commonly terminate in a floating ice tongue of variable length, with three glaciers terminating in an ice tongue > 10 km (Hill et al., 2017). One such glacier is Petermann Glacier (PG), draining about 4 % of the Greenland Ice Sheet (GrIS) (based on area of the drainage basin; Rignot and Kanagaratnam, 2006) into Hall Basin in Nares Strait (Fig. 1). Large calving events of the PG floating ice tongue in 2010 and 2012 (Johannessen et al., 2013; Rückamp et al., 2019) were associated with a 10 % acceleration of the glacier (Rückamp et al., 2019). Interestingly, the 2010 calving event occurred at the end of a 4-year period with no or little landfast ice in Nares Strait, which was associated with earlier breakup of landfast ice (Fig. 2). The smaller calving event in 2012, on the other hand, followed the re-establishment of extensive landfast ice in Nares Strait in 2011 (Fig. 2). Although the calving events have attracted considerable attention, submarine melting of the ice tongue accounts for 80 % of the mass loss at PG, making it particularly sensitive to ice–ocean interactions (Cai et al., 2017; Münchow et al., 2014; Rignot and Steffen, 2008; Rückamp et al., 2019).
Submarine melt rates depend on the turbulent heat flux reaching the ice tongue–ocean interface. This is a function of the oceanic heat content, determined by the inflow of AW to Petermann Fjord, and turbulent mixing underneath the ice tongue, promoted by subglacial meltwater discharge (Cai et al., 2017; Washam et al., 2018). Thus, changes in Nares Strait sea ice dynamics, which modify AW inflow to Petermann Fjord, may affect the ice tongue stability on long timescales. Additionally, earlier work has identified landfast sea ice in fjords around Greenland as an important mechanism stabilizing the calving front of marine-terminating outlet glaciers, with the loss of landfast ice prolonging the calving season (Amundson et al., 2010; Carr et al., 2015; Robel, 2017; Todd and Christoffersen, 2014). Hence, in light of the recent doubling of mass loss from the GrIS (Shepherd et al., 2012) a detailed understanding of ocean–sea ice–glacier interactions on longer timescales is essential to improve projections for the contribution of the GrIS to future sea level rise (Fürst et al., 2015; Stocker et al., 2013).
In 2015, the Swedish Icebreaker Oden set out for the Petermann 2015 expedition to improve our understanding of the processes involved in ocean–sea ice–glacier interactions and the sensitivity of the PG floating ice tongue to Holocene climate change. A transect of sediment cores, extending from Hall Basin to underneath the Petermann ice tongue, was recovered (Reilly et al., 2019). Spatial differences in sediment facies associated with the presence or absence of the ice tongue allowed the reconstruction of the extent of the Petermann ice tongue over the last ∼ 7000 cal yr BP (Reilly et al., 2019). Reilly et al. (2019) demonstrate that after the deglacial breakup of the ice tongue at ∼ 6900 cal yr BP, no stable ice tongue existed in Petermann Fjord for the largest part of the mid-Holocene, with a small ice tongue re-emerging at ∼ 2200 cal yr BP, which advanced to its modern limits around 600 years ago.
Here, we focus on the Holocene evolution of sea ice conditions in Petermann Fjord. The spliced sediment core OD1507-03TC-41GC-03PC (81.192∘ N, −62.023∘ E; 976 m water depth) located in outer Petermann Fjord (Fig. 1) offers a unique opportunity to study Nares Strait and local sea ice dynamics and their influence on the stability of PG. Sea ice reconstructions are based on source-specific Arctic sea ice biomarkers (Belt, 2018). Measurements of total organic carbon (TOC), the carbon isotopic composition of TOC, sterol biomarkers, and the benthic and planktonic foraminiferal abundance provide information with regard to marine primary productivity and terrestrial organic carbon input to Petermann Fjord across the Holocene. In combination with existing studies (e.g., England et al., 2008; Funder et al., 2011; Georgiadis et al., 2020), our results offer insights into the Holocene development of ice arches in Nares Strait. Importantly, this study demonstrates that the development of more severe sea ice conditions in Petermann Fjord preceded major advances of the ice tongue, indicating a stabilizing effect on PG.
At the northern end of Nares Strait, Robeson Channel connects Hall Basin to the Lincoln Sea (Fig. 1) with water mass exchange controlled by a 290 m deep sill (Münchow et al., 2011a; Washam et al., 2018). In the upper 50 m (off Greenland) to 100 m (off Ellesmere Island) (Jones and Eert, 2004; Münchow et al., 2007), Nares Strait is characterized by relatively fresh and nutrient-rich PW. Geochemical tracers suggest that these waters are primarily of North Pacific origin, entering the Arctic Ocean via the Bering Strait, modified by river runoff and sea ice melt (Jones and Eert, 2004; Münchow et al., 2007). Below (> 300 m in Hall Basin), the water column is characterized by AW (0.28–0.31 ∘C Washam et al., 2018). Hydrographic surveys have shown that the AW in Nares Strait has warmed by 0.023±0.015 ∘C yr−1 between 2003 and 2009 (Münchow et al., 2011b). At its shallowest, at the northern end of Kane Basin, Nares Strait is 220 m deep (Münchow and Melling, 2008). This sill impedes the southward flow of AW, suggesting that Atlantic Water at the southern end of Nares Strait is predominantly derived from the north-flowing West Greenland Current (Fig. 1) (Melling et al., 2001). The circulation in Nares Strait is dominated by a southward surface jet controlled by winds and along-channel pressure gradients between the Lincoln Sea and northern Baffin Bay (Rabe et al., 2010, 2012). The hydrographic structure in Nares Strait varies according to the predominant sea ice state (Rabe et al., 2012; Shroyer et al., 2015, 2017). Modeling studies show that this is a response to surface stresses (Shroyer et al., 2015, 2017). Landfast sea ice exerts a northward drag at the ocean surface, resulting in eastward Ekman transport of cool and fresh PW and a westward shift of the main surface jet towards Ellesmere Island (Rabe et al., 2012; Shroyer et al., 2015, 2017). During the mobile sea ice season, southward wind stress and associated westward Ekman surface transport cause a displacement of cool and fresh surface waters towards Ellesmere Island and upwelling of relatively warm and salty waters along the Greenland coast, while the main southward flow is concentrated in the center of the channel (Münchow et al., 2007; Shroyer et al., 2017). Nares Strait is covered by sea ice for around 10–11 months yr−1, with a 95 % ice cover during winter months (Rasmussen et al., 2010). Summer breakup occurs in June–July, with renewed freezeup in late September–October. The flow of sea ice through Nares Strait is highest during fall and early winter (Kwok et al., 2010), with large interannual variability depending on the formation and duration of the northern and southern ice arches. While the formation of either arch will block the export of Arctic sea ice through Nares Strait, only the formation of the southern arch leads to the opening of the NOW (Barber et al., 2001) and a complete freezeup of Nares Strait (Kwok, 2005; Kwok et al., 2010).
Petermann Fjord, connected to Nares Strait (Hall Basin) via a 350–450 m deep sill, is up to 1100 m deep and ∼ 20 km wide (Jakobsson et al., 2018). It hosts a floating ice tongue, approximately 48 km long (from the grounding zone) with an average width of 16.6 km and a thickness of 600 m at the grounding zone to 200 m at the terminus (Heuzé et al., 2017; Johannessen et al., 2013). The ice tongue flows at a speed of 1250±90 m yr−1 over the grounding zone, resulting in a calculated net glacial freshwater flux of 0.26 mSv (Heuzé et al., 2017). The formation of landfast ice in Petermann Fjord is somewhat independent of the formation of landfast ice in Nares Strait. Landfast ice in Petermann Fjord will also form when sea ice in Nares Strait remains mobile throughout the winter (e.g., 2007, 2009, 2010; Fig. 2), although the sea ice state in Nares Strait likely influences the timing of sea ice breakup in Petermann Fjord in spring (summer), with earlier (later) breakup during years without (with) landfast sea ice in Nares Strait (Figs. 2, S1). Additionally, we propose that the sea ice dynamics in Nares Strait likely have important implications for the primary productivity regime in Petermann Fjord. During years with mobile sea ice in Nares Strait (e.g., 2007 and 2009; Fig. S1), an ice edge exists within/at the mouth of Petermann Fjord during spring–early summer, while under landfast ice conditions the spring–early summer ice edge is situated several hundred kilometers to the southwest in Kane Basin–Smith Sound (e.g., 2013 and 2014; Fig. S1). Since the spring ice edge is a highly productive system, especially important for the sympagic algal bloom (Ardyna and Arrigo, 2020; Leu et al., 2015; Wassmann and Reigstad, 2011), the position of the Nares Strait ice edge is likely to play a role in the local primary productivity.
The hydrographic structure in Petermann Fjord is closely linked to that in Nares Strait, with colder, fresher PW overlaying AW (Johnson et al., 2011; Münchow et al., 2014). Bottom waters in Petermann Fjord are renewed by episodic spillover of AW from Hall Basin, with bottom water properties in Petermann Fjord resembling those at ∼ 380 m water depth in Hall Basin (effective sill depth) (Johnson et al., 2011). In general, the circulation in Petermann Fjord resembles an estuarine model, with outflow of buoyant, meltwater-enriched surface waters along the northeast side of the fjord and inflow of AW below, concentrated along the southwestern side of the fjord mouth (Heuzé et al., 2017; Johnson et al., 2011; Washam et al., 2018). In the fjord mouth, eddy structures can enhance the exchange between Hall Basin and Petermann Fjord. Eddies are stronger and more stable during summer, when sea ice in Nares Strait is mobile (Johnson et al., 2011; Shroyer et al., 2017). Modeling studies suggest that the displacement of water masses in Nares Strait in response to the prevailing sea ice regime also affects Petermann Fjord, with enhanced inflow of warmer, saltier AW during times of mobile sea ice (Shroyer et al., 2017). Additionally, a stronger circulation in the fjord, driven by enhanced subglacial runoff during summer months, increases the transport of AW to the ice tongue cavity and the turbulent mixing of AW toward the base of the ice tongue (Cai et al., 2017; Washam et al., 2018). In response to warming of AW in Nares Strait (Münchow et al., 2011b), a 0.2 ∘C warming of AW in Petermann Fjord has been observed from 2002 to 2016 (Washam et al., 2018). In combination, the greater oceanic heat flux and strengthened under-ice currents cause enhanced submarine melting and non-steady-state thinning of the ice tongue (Cai et al., 2017; Washam et al., 2018, 2019).
3.1 Sediment core OD1507-03TC-41GC-03PC
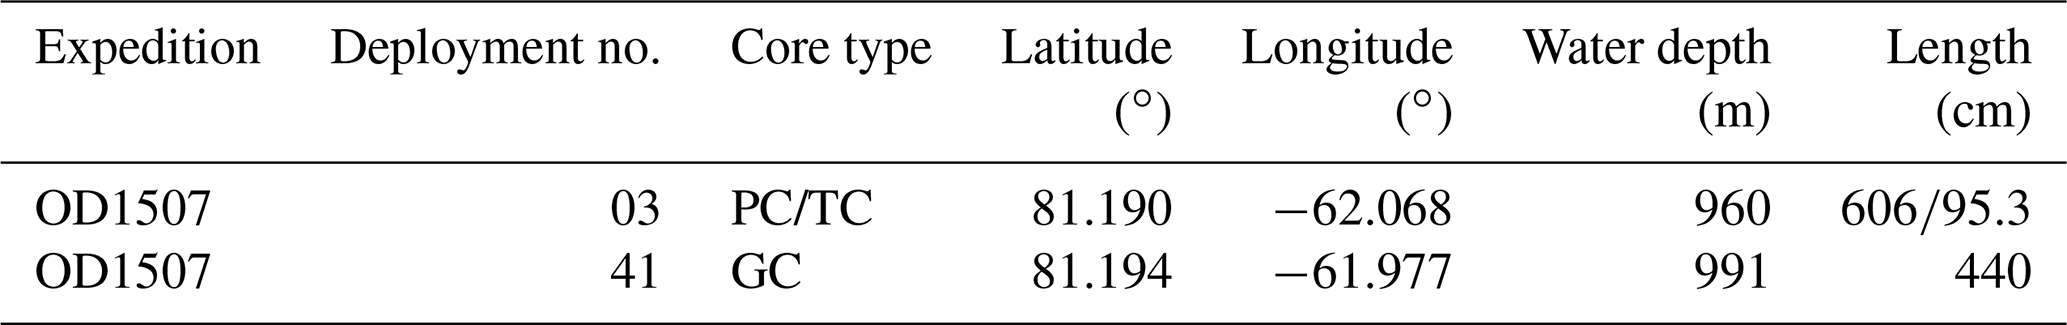
Sediment core OD1507-03TC-41GC-03PC is stored at the Oregon State University Marine and Geology Repository at 2.8 ∘C. Samples were taken approximately every 5 cm for the analysis of different organic constituents and approximately every 10 cm for benthic and planktonic foraminiferal analyses. The core represents a spliced record of a trigger core (TC), a gravity core (GC), and a piston core (PC) recovered in outer Petermann Fjord as part of the Petermann 2015 expedition (Fig. 1) (Table 1). The splice has a total length of 556 cm and was recovered 80 km from the 2015 PG grounding zone at an average water depth of 976 m (Reilly et al., 2019). Based on computed tomography (CT) scans, continuous sections with minimal disturbance were chosen for the splice, and correlation was performed using X-ray fluorescence (XRF) Ti Ca ratios, CT slice images, and CT numbers (Reilly et al., 2019) (Supplement Table S1). Three sedimentary units are distinguished in OD1506-03TC-41GC-03PC, based on physical properties and XRF elemental data (Reilly et al., 2019). Sedimentary unit 3 (ca. 518–555 cm) is a massive diamict composed of a sandy mud with abundant coarse clasts and XRF Ti Ca ratios around 0.05 (Reilly et al., 2019). The clasts found in this unit likely do not represent ice-rafted debris (IRD) but instead are related to proximity of the grounding zone (Reilly et al., 2019). Unit 2, a clayey laminated mud with no or very low concentrations of coarser material (IRD), is found between ca. 398–518 cm (Reilly et al., 2019). The topmost lithofacies, unit 1 (0–398 cm), is a bioturbated clayey mud with isolated sand and coarser particles (Reilly et al., 2019). Based on the XRF Ti Ca ratios and the abundance of coarse material, unit 1 has been divided into three subsections (A (0–53 cm), B (53–164 cm), C (164–398 cm)) (Reilly et al., 2019). Subunit 1C is marked by a decreasing trend from high to intermediate IRD occurrence, with intermediate IRD abundances continuing during subunit 1B, followed by low IRD abundance during subunit 1A (Reilly et al., 2019).
The age model for OD1507-03TC-41GC-03PC, established by Reilly et al. (2019), is based on radiocarbon (14C) dating of benthic and planktonic foraminifera and calibration of radiocarbon ages using the Marine13 curve (Reimer et al., 2013) and MatCal MATLAB tools (Lougheed and Obrochta, 2016). The ΔR value was constrained using paleosecular variation (PSV) stratigraphy, with the best fit determined for a constant ΔR choice of 770 years (Reilly et al., 2019). No ages were determined for the interval between 408 and 556 cm, due to lack of radiocarbon dates. Regional constraints, however, suggest that these sediments are younger than 7600 years, corresponding to the timing of the retreat of PG into the fjord (Jakobsson et al., 2018).
Table 1Metadata of sediment cores used with the OD1507-03TC-41GC-03PC splice (Reilly et al., 2019).
3.2 Sea ice biomarker methodology
Reconstructions of past sea ice conditions in Petermann Fjord rely on the identification of source-specific Arctic sea ice biomarkers, together with the identification of common sterol biomarkers, TOC, and planktonic and benthic foraminiferal abundances. This is a qualitative method to determine past sea ice dynamics. For clarity, we will describe past sea ice conditions using the following categories in order of increasing average sea ice concentration: ice free, reduced seasonal sea ice, enhanced seasonal sea ice, and near-perennial.
Source-specific sea ice biomarkers include a mono- and a di-unsaturated highly branched isoprenoid (HBI), termed IP25 (ice proxy with 25 carbon atoms), and HBI II (Belt, 2018; Belt et al., 2007). IP25 is produced by a number of spring sea ice dwelling diatoms, including Haslea spicula, H. kjellmanii, and Pleurosigma stuxbergii var. rhomboides (Brown et al., 2014). Thus, its presence in Arctic marine sediments provides evidence for past seasonal sea ice occurrence, while the absence of IP25 occurs in year-round ice-free environments as well as under perennial sea ice cover (Belt, 2018; Belt et al., 2007; Brown et al., 2014; Navarro-Rodriguez et al., 2013; Xiao et al., 2015). Salinity changes might exert an additional control on IP25 production, with Ribeiro et al. (2017) showing that its production appears to be suppressed by meltwater in fjords of northeastern Greenland. Given its co-production in H. spicula, H. kjellmanii, and Pleurosigma stuxbergii var. rhomboides (Brown et al., 2014), HBI II co-varies with IP25 in the Arctic realm. Thus, the typically higher HBI II concentrations can provide additional information during times of low/absent sedimentary IP25.
In recent years, biomarker-based reconstructions of past sea ice dynamics have also commonly reported a tri-unsaturated HBI (HBI III), produced by diatoms characteristic of the spring sea ice edge bloom in the marginal ice zone (MIZ) (Belt et al., 2015, 2017; Smik et al., 2016). In Petermann Fjord, however, the identification of the HBI III peak in gas chromatography–mass spectrometry (GC–MS) chromatograms was compromised due to interference with a neighboring peak (Fig. S2). This is specific to sediment samples from Petermann Fjord, as HBI III could be identified in reference sediment from Young Sound extracted alongside the samples from Petermann Fjord (see Sect. 3.3.2). Instead, we use a range of sterol biomarkers (campesterol, cholesterol, brassicasterol, dinosterol, and β-sitosterol) and the abundance of benthic and planktonic foraminifera to gain insights into the regional primary productivity regime and the addition of terrestrial organic carbon to Petermann Fjord. Sterols are common compounds in eukaryotic cell membranes, abundant in both marine and terrestrial organic carbon. This complicates their use as unambiguous tracers of a specific organism and/or environmental regime (Belt and Müller, 2013; Rontani et al., 2014; Volkman, 1986). Nonetheless, the relative abundance of certain sterols can vary according to the predominant organic carbon source (Rontani et al., 2014; Volkman, 1986; Yunker et al., 1995) (Table 2).
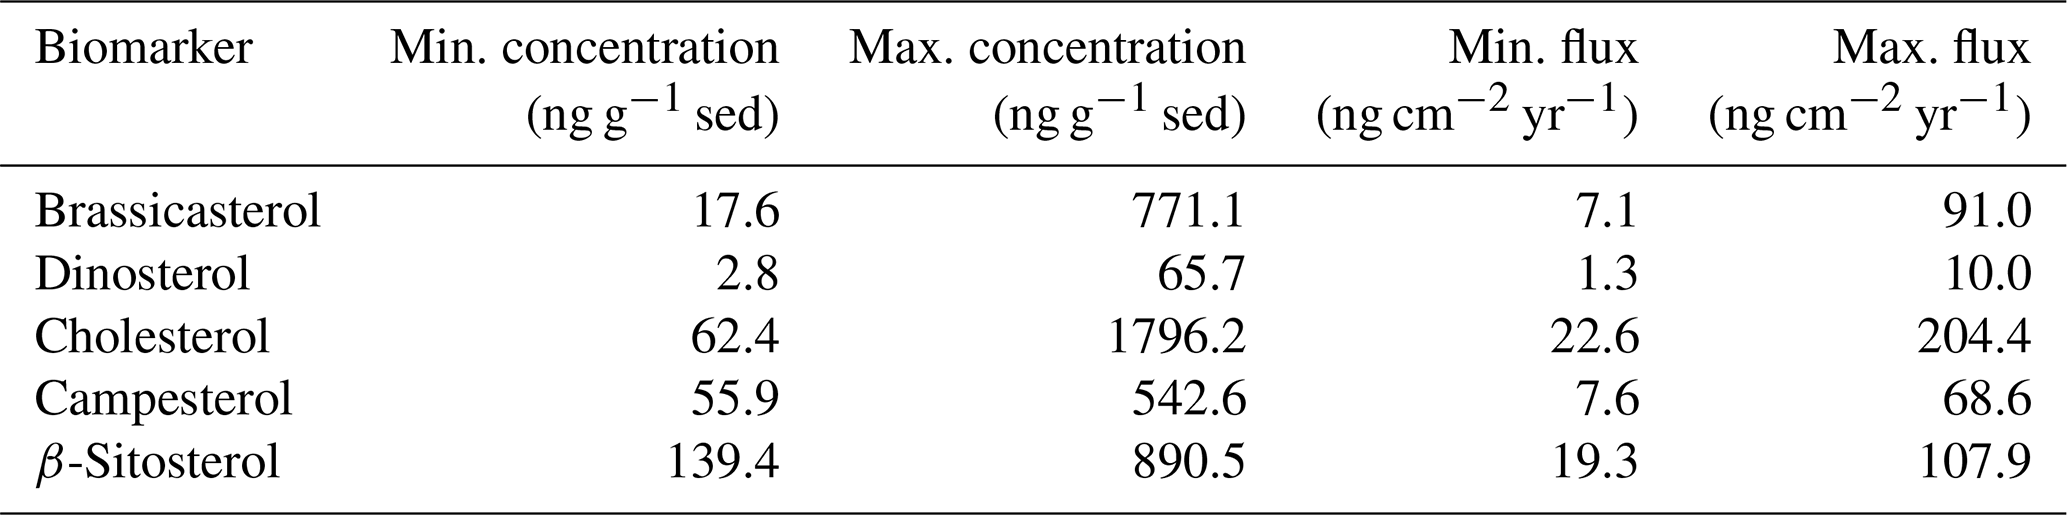
Table 2Overview of the dominant sources of different sterol biomarkers measured in this study.
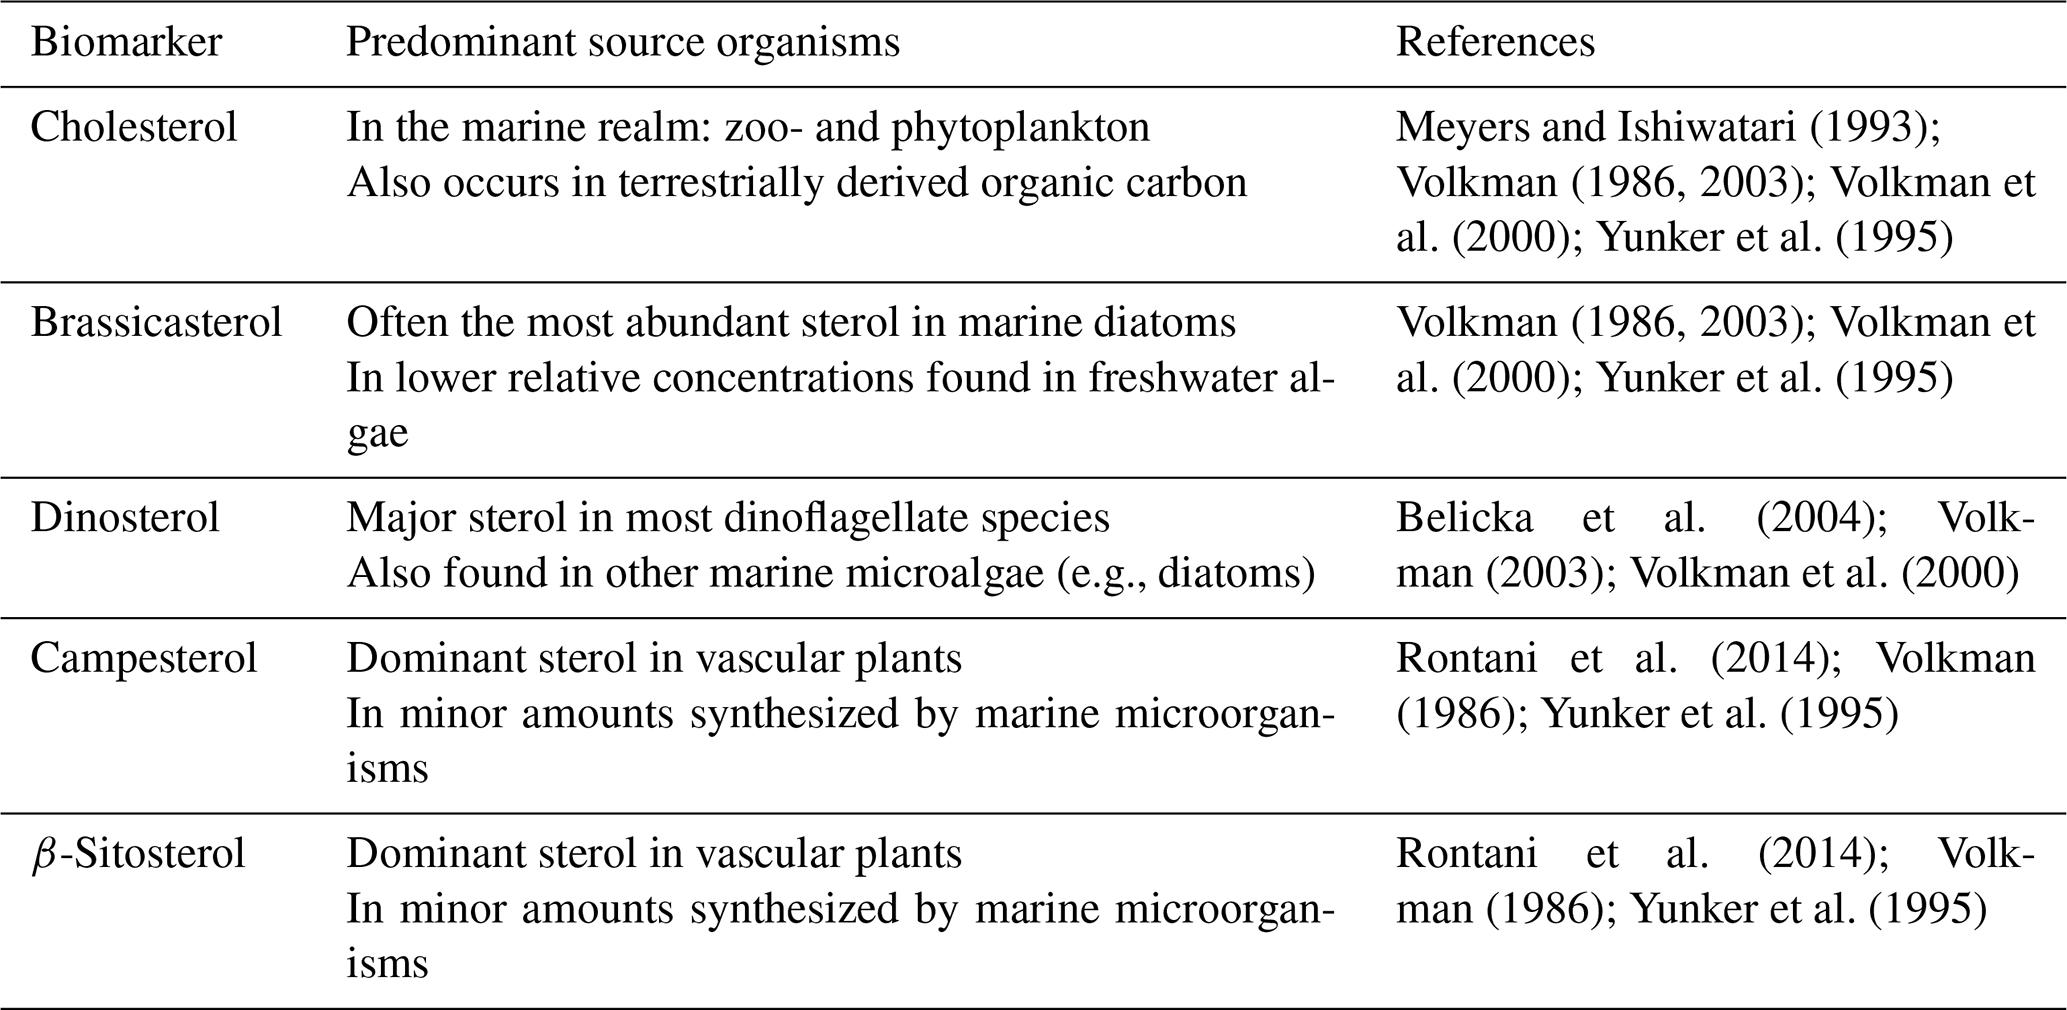
Depending on the predominant primary producers, high concentrations of brassicasterol and dinosterol are reported from ice-free regions, the MIZ, and under varying concentrations of seasonal sea ice (Xiao et al., 2015). In general sterol concentrations are low under perennial sea ice in the Arctic Ocean, where all primary productivity is impeded due to limited light availability (Xiao et al., 2015).
Here we use brassicasterol, dinosterol, and cholesterol to represent phytoplankton primary productivity in Petermann Fjord, with different relative concentrations, potentially indicating changes in the ecosystem composition. Campesterol and β-sitosterol, on the other hand, are used to gain insight into terrestrial organic carbon input. The multiproxy study of IP25, HBI II, sterol biomarkers, and the benthic and planktonic foraminiferal abundance (see Sect. 3.4) thus allows interpretations of past sea ice dynamics and terrestrial versus marine organic carbon input to Petermann Fjord.
3.3 Analysis of total organic carbon (TOC), carbon isotopic composition of TOC (δ13Corg), and sea-ice-related biomarkers in sediments from OD1507-03TC-41GC-03PC
Prior to the analysis of organic constituents, the samples were freeze-dried (−45 ∘C; 0.2 mbar; 48 h) at Aarhus University using a Christ Alpha 1-4 LSC freeze drier. The dried samples were weighed, and dry bulk densities (DBDs) were determined from the samples' respective volume and dry weight. Subsequently, the samples were homogenized with a dichloromethane (DCM) cleaned pestle and mortar.
3.3.1 Total organic carbon (TOC) quantification and analysis of carbon isotopic composition of TOC (δ13Corg)
For TOC and δ13Corg, 10 mg of homogenized sample material was weighed into an Ag capsule (Elemental Microanalysis). Depending on available material, duplicates or triplicates were prepared to test for reproducibility. Additionally, a soil standard (10 mg; Elemental Microanalysis Soil Standard (Sandy) OAS 133506; 0.76 % TOC) and blanks were added every ∼ 15 samples. To remove the inorganic carbon, 35 % HCl was added one drop at a time until no further reaction was observed (approximately four drops per sample, standard, and blank). The samples were then dried on a hotplate (50 ∘C) overnight. The Ag capsules were folded and placed inside a Sn capsule (Elemental Microanalysis), which was packed tightly and stored in a desiccator until analysis.
The δ13Corg and wt % TOC were measured using a continuous-flow IsoPrime isotope ratio mass spectrometer (IRMS) coupled to an Elementar PYRO cube elemental analyzer at the Aarhus AMS Centre (AARAMS), Aarhus University, Denmark. δ13Corg is reported in ‰ versus Vienna Pee Dee Belemnite (VPDB). An in-house standard Gel-A was used as the primary standard, yielding ±0.2 ‰ and ±0.3 ‰ for carbon and nitrogen analysis, respectively. Further, secondary in-house and international standards were used to check the normalization to the VPDB. The mean reproducibility using 10 duplicate samples is ±0.03 % and ±0.4 ‰ for wt % TOC and δ13Corg, respectively. For both acid-pre-treated and non-acid-pre-treated Elemental Microanalysis Soil Standard (Sandy) OAS 133506 samples, the reproducibility of seven samples is ±0.02 wt % TOC. The δ13Corg reproducibility of non-acid-pre-treated Elemental Microanalysis Soil Standard (Sandy) OAS 133 506 samples is ±0.1 ‰, whereas acid-pre-treated samples show a mean reproducibility of ±0.5 ‰. TOC concentrations are reported in weight % (wt %), and TOC fluxes (µg cm−2 yr−1) are derived using the samples' individual DBD and linear sedimentation rates (LSRs), which were calculated using the datums from 14C analysis of benthic and planktonic foraminifera (Reilly et al., 2019).
3.3.2 Lipid biomarker extraction and analysis
Biomarkers were extracted from 6.00 ± 0.03 g freeze-dried sediment. A procedural blank and a reference sediment sample (∼ 3 g) with known biomarker concentrations were added to each extraction batch (n=12). 9-Octylheptadec-8-ene (9-OHD) and 5α-androst-16-en-3α-ol (0.1 µg) were added to each sample, reference sediment, and blank, as internal standards for HBI and sterol quantification, respectively. The samples were extracted using saponification (5 % potassium hydroxide (KOH) in methanol (MeOH) : H2O (9 : 1, ); 70 ∘C, 1 h) followed by extraction of the non-saponifiable lipids into hexane (3 × 2 mL). According to polarity, the different lipid classes were separated using silica column chromatography. Nonpolar lipids, such as IP25 and HBI II were eluted with hexane, while the more polar sterols were eluted with DCM:MeOH (1 : 1, ) (∼ 7 mL, each). Hexane fractions were further purified using silver nitrate silica column chromatography (AgNO3 on SiO2, ∼ 10 wt % of labeling), where the saturated hydrocarbons were eluted with hexane (2 mL), and the unsaturated compounds, including the HBIs, were eluted with acetone (7 mL), dried (N2; 25 ∘C), and transferred to GC–MS vials fitted with 300 µL inserts. The sterol fractions were derivatized using N,O- bis(trimethylsilyl)trifluoroacetamide (50 µL, 70 ∘C, 1 h) and transferred to 1.5 mL GC–MS vials.
All biomarker samples were analyzed at Aarhus University using an Agilent 7890B GC fitted with an HP-5ms Ultra Inert column (30 m × 250 µm × 0.25 µm) coupled to a 5977A series mass selective detector and equipped with a Gerstel multipurpose sampler (MPS). Prior to analysis, HBI and sterol extracts were diluted with 50 µL hexane (using the MPS system) and 0.500 mL DCM (manually), respectively. For GC–MS operating conditions see Table S2. Following Belt (2018) the identification of individual lipids is based on their characteristic retention indices and mass spectra. Quantification is achieved by comparing the integrated peak area (PA) of the selected ion for each biomarker (Table S2) to the PA of the respective internal standard (Belt et al., 2012) under consideration of an instrumental response factor (based on the reference sediment) and the mass or the TOC concentrations of the sediment extracted (Belt et al., 2012). Due to unknown concentrations of dinosterol in the reference sediment, an individual response factor could not be determined for this compound. Instead, the average response factor for brassicasterol and cholesterol was used. Thus, while the relative dinosterol concentrations and trends hold true, absolute concentrations might not be accurate. In addition to the biomarker concentrations in ng g−1 of dry sediment (ng g−1 sed) and µg g−1 TOC, biomarker fluxes were calculated using the samples' individual DBD and linear sedimentation rates (LSRs). Fluxes are reported in ng cm−2 yr−1 and are interpreted alongside biomarker concentrations to avoid bias related to jumps in the LSR.
3.4 Planktonic and benthic foraminiferal abundances
The OD1507-03TC-41GC-03PC benthic and planktonic foraminiferal abundances were determined on 58 samples. The benthic foraminiferal counts include both calcareous and agglutinated species. Where sufficient core material was available, the sample depths correspond to the TOC and biomarker samples. The foraminiferal samples were weighed and wet sieved at 63 µm. The > 63 µm fraction was counted wet and submerged in a “storage” solution of 70 % distilled water and 30 % ethanol with baking soda to preserve fragile calcareous and agglutinated tests. A wet splitter was used when necessary to achieve a count of at least 200–300 benthic foraminifera. Planktonic foraminifera were counted in the benthic split. Equivalent dry weights of the foraminiferal samples were calculated using the wet weights of the samples and the wet and dry weights of other samples from the same depths. That way, the numbers of benthic and planktonic foraminifera per gram of dry sediment could be calculated without drying the samples. Foraminiferal fluxes were calculated using the samples DBD and LSR and reported in specimens cm−2 yr−1. Where the depth of the biomarker and foraminiferal samples were not identical, the DBD was linearly interpolated between neighboring biomarker samples.
The results of organic constituents and foraminiferal abundances in OD1507-03TC-41GC-03PC are presented in terms of their depth within the core, to account for the fact that sediment ages are unconstrained in the bottom ca. 1.5 m of the core (Reilly et al., 2019). This also allows the comparison of the data to the sedimentary facies in OD1507-03TC-41GC-03PC, which are characteristic of the glacial dynamics in the fjord.
4.1 HBI biomarker concentrations
IP25 and HBI II were analyzed in 100 samples with an average depth resolution of 5.5 ± 1.8 cm and temporal resolution of 99 ± 45 years. Both biomarkers were present in all samples, with an overall range of 0.3–30.0 ng g−1 sed for IP25 and 0.6–83.0 ng g−1 of sediment for HBI II and fluxes of 0.2–3.0 and 0.3–8.0 ng cm−2 yr−1, respectively (Fig. 3f, g). HBI concentrations normalized to the amount of sediment follow the biomarker concentrations normalized to the TOC content of the samples (Fig. S3). A significant positive correlation was found for IP25 and HBI II (R2=0.95 [0.84; 0.97], n= 100), in line with co-production of these two biomarkers (Brown et al., 2014). Sedimentary unit 3 is marked by very low IP25 and HBI II concentrations (Fig. 3f, g). Both biomarker concentrations increase stepwise, with a first increase at 515 cm corresponding to the transition from sedimentary units 3 to 2 (Reilly et al., 2019). The second increase in biomarker concentrations at 405 cm precedes the sedimentary unit boundary (1C–2) by ∼ 5 cm and is followed by an interval of highly variable IP25 and HBI II concentrations and fluxes until 320 cm (Fig. 3f, g). From 260 cm, a steep increase in IP25 and HBI II concentrations and fluxes culminates in peak concentrations at 199 cm followed by peak fluxes at 189 cm (Fig. 3f, g). Subsequently a two-step decrease in all HBI concentrations and fluxes is observed between 199 and 154 cm, spanning the transition of sedimentary units 1C and 1B at ∼ 165 cm (Reilly et al., 2019) (Fig. 3f, g). At 154 cm, a sharp increase in IP25 marks the onset of a second interval with sustained high concentrations between 154 and 70 cm. IP25 fluxes increase simultaneously but decrease prior to the concentrations at 89 cm in connection with a decrease in the LSR (Fig. 3a, g). HBI II concentrations remain relatively low throughout lower sedimentary unit 1B, while the fluxes follow the IP25-flux trend (Fig. 3f, g). At 70 cm, however, IP25 and HBI II concentrations and fluxes drop simultaneously, preceding the transition from sedimentary units 1B to 1A by ∼ 7 cm (Fig. 3f, g). HBI biomarker concentrations and fluxes remain low throughout unit 1A, with a minor increase around 25 cm (Fig. 3f, g).
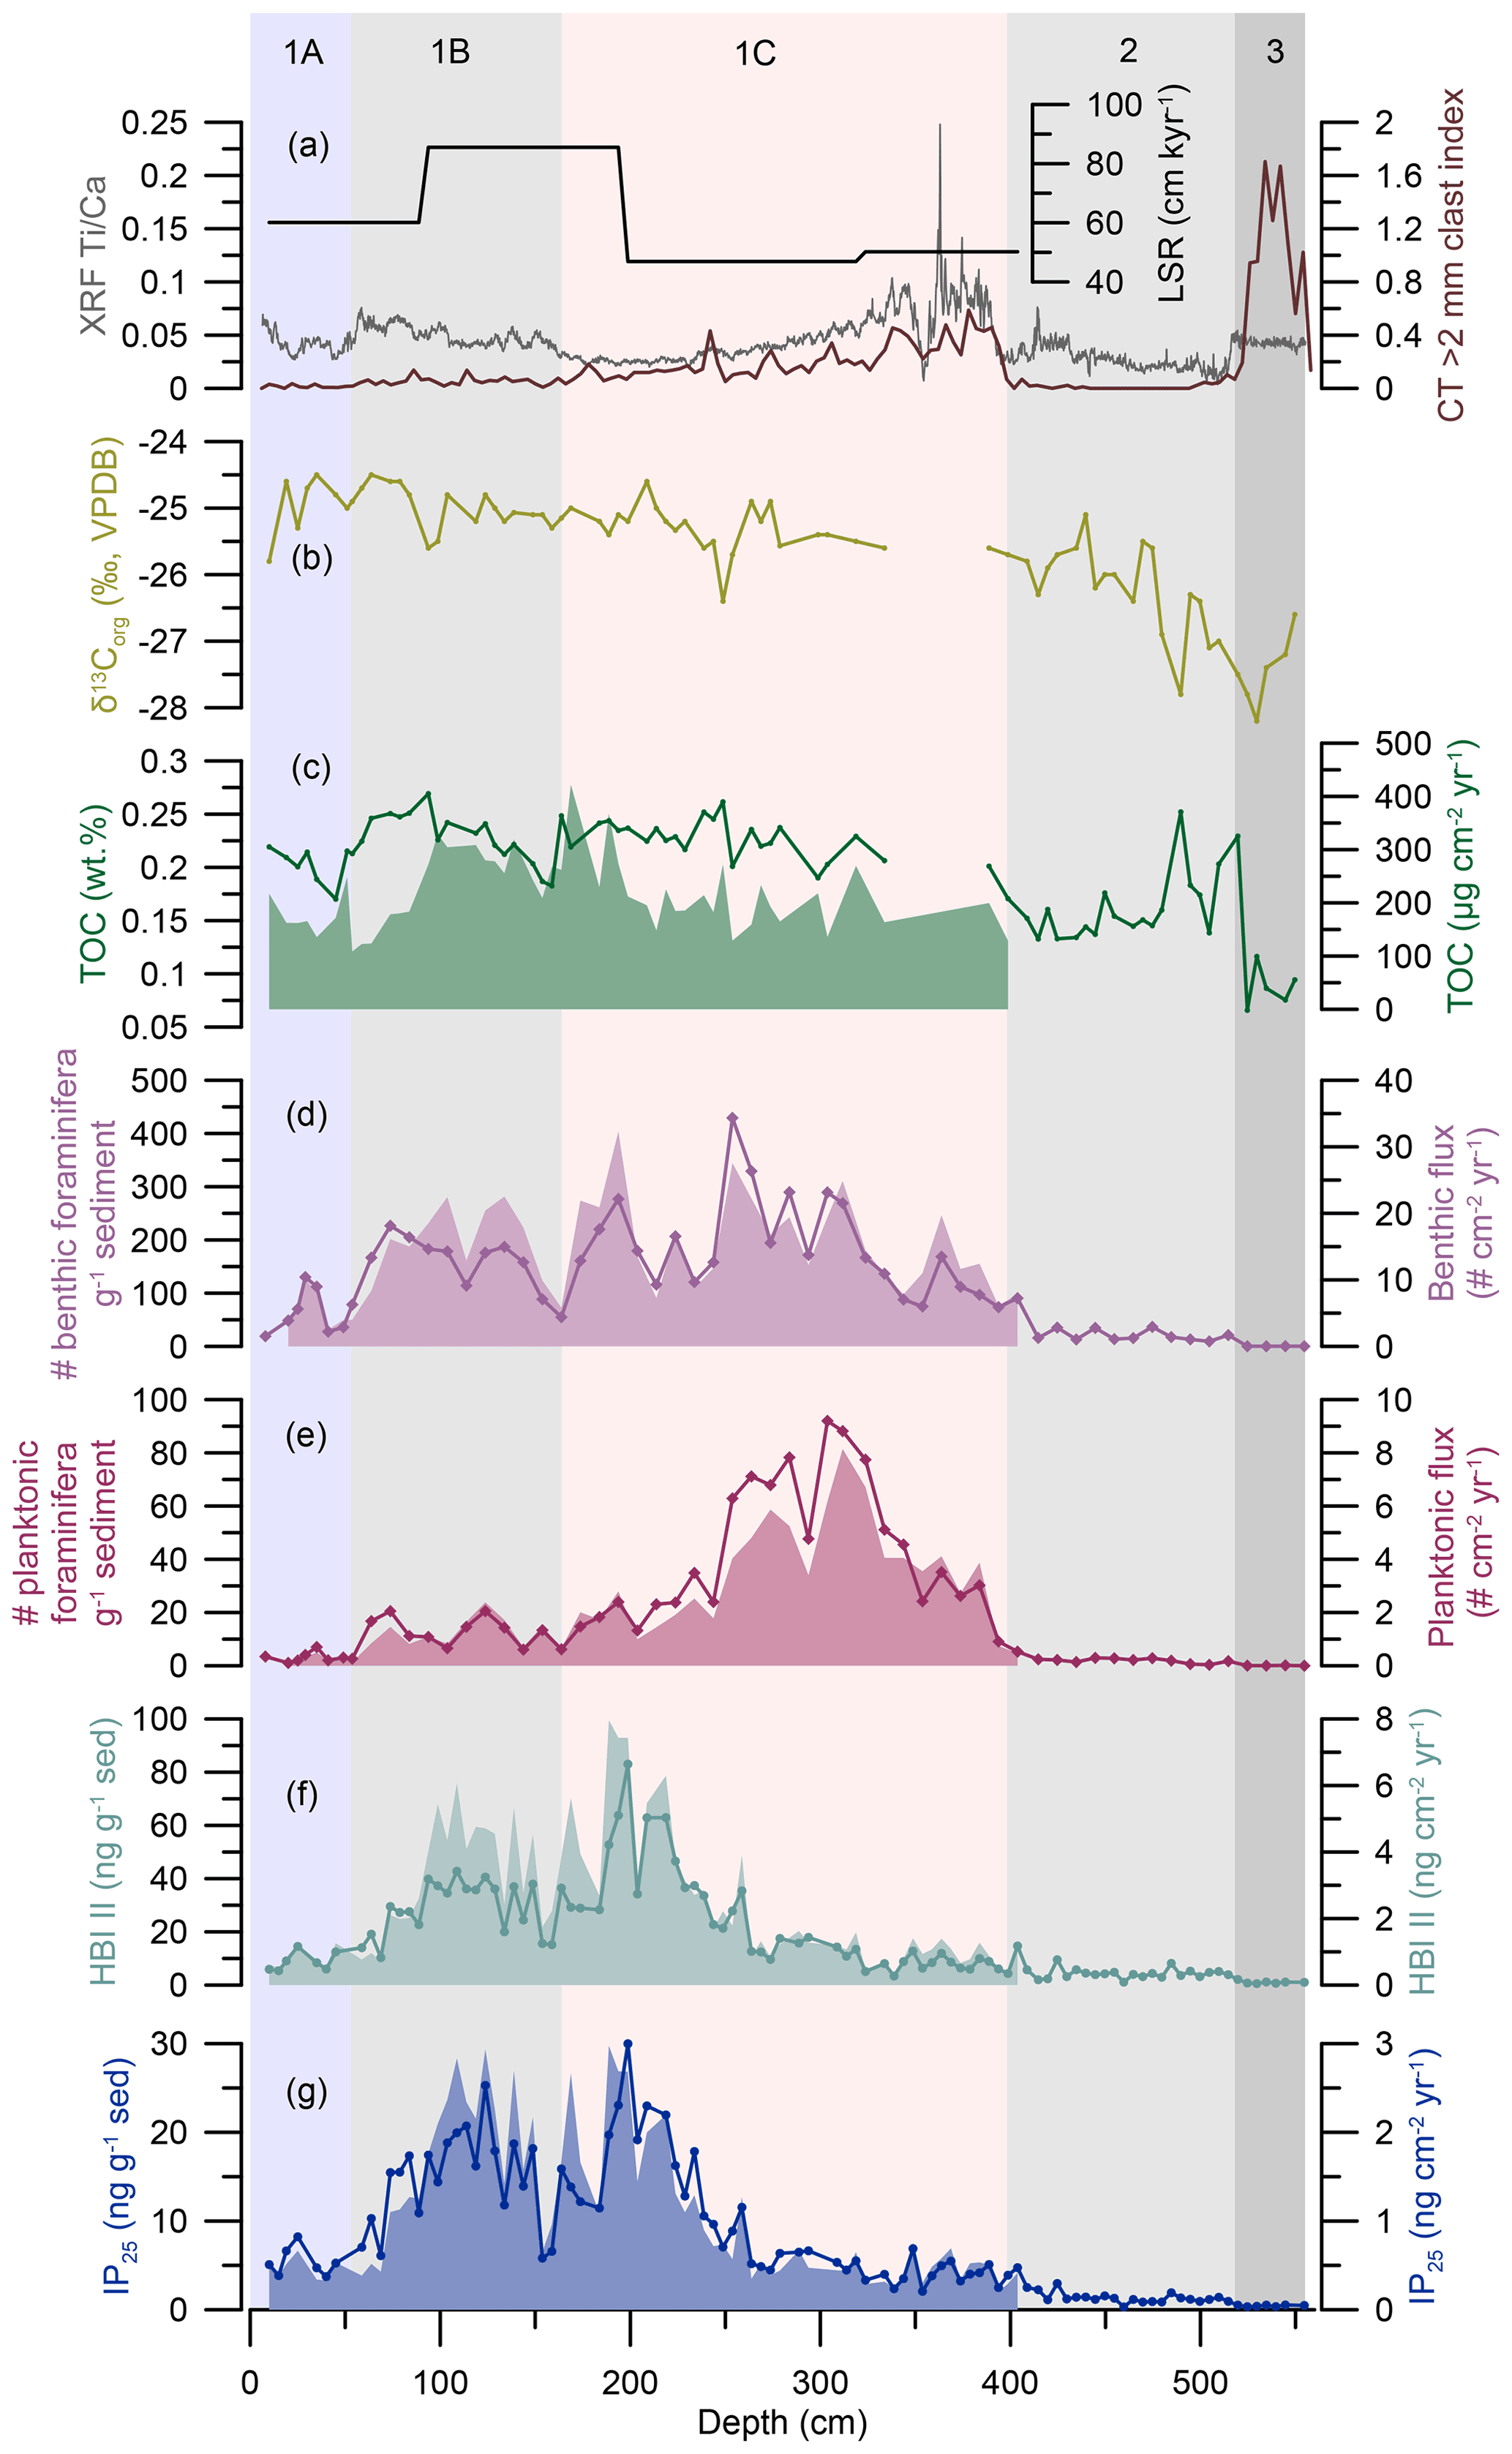
Figure 3HBI biomarker, TOC, and foraminiferal results from OD1507-03TC-41GC-03PC. From the top to the bottom: (a) linear sedimentation rates (LSR; black), the XRF Ti Ca ratio (grey), and the CT > 2 mm clast index (brown) (Reilly et al., 2019). (b) TOC carbon isotopic values (δ13Corg ‰, VPDB; light green). (c) TOC fluxes (green, filled-in area) and TOC concentrations (green line). (d) Benthic foraminiferal fluxes (purple, filled-in area) and benthic foraminiferal abundance in individuals per gram of sediment (purple line with diamonds). (e) Planktonic foraminiferal fluxes (crimson, filled-in area) and planktonic foraminiferal abundance in individuals per gram of sediment (crimson line with diamonds). (f) HBI II fluxes (turquoise, filled-in area) and absolute concentration (turquoise line with dots) normalized to the amount of extracted sediment (ng g−1 sed). (g) IP25 fluxes (blue, filled-in area) and absolute concentration (blue line with dots) normalized to the amount of extracted sediment (ng g−1 sed). Fluxes do not extend beyond ∼ 400 cm, as this depth corresponds to the lowermost available radiocarbon date (Reilly et al., 2019). The vertical background fill indicates the lithological units (1A–1C, 2, 3) at OD1507-03TC-41GC-03PC (Reilly et al., 2019).
The ratio of HBI II and IP25 (DIP25) has previously been used as an indicator for sea surface temperature (SST) and thus as a tracer of warmer water masses (Hörner et al., 2016; Xiao et al., 2013), in line with higher temperatures being more favorable for the synthesis of double bonds. Other studies, however, did not find a relationship between DIP25 and SST and propose instead that a steady DIP25 reflects stable sea ice conditions, while a variable DIP25 indicates more unstable sea ice conditions (Belt and Müller, 2013; Cabedo-Sanz et al., 2013). In outer Petermann Fjord, the DIP25 ratio is low throughout sedimentary unit 3 and rises before the unit 3–unit 2 boundary (Fig. S4). This is followed by the highest recorded DIP25 values between 520 and 430 cm in unit 2. At 430 cm a sharp decline in DIP25 values marks the onset of a 110 cm long section with relatively low but variable DIP25 values (σ2= 0.41). At 320 cm, a small increase in DIP25 is followed by a relatively steady decline throughout upper unit 1C, unit 1B, and unit 1A (Fig. S4). This coincides with reduced variance in the data (σ2= 0.26).
4.2 Sterol biomarker concentrations
Sterol biomarkers were determined on 94 samples with a depth and temporal resolution of 5.7 ± 2.3 cm and 102 ± 51 years, respectively. We measured brassicasterol, dinosterol, and cholesterol (hereinafter grouped as marine sterols) and campesterol and β-sitosterol (hereinafter grouped as terrestrial sterols). All sterols were present consistently throughout the core (Table 3). There are minor differences in the temporal evolution of sterol concentrations normalized to the amount of sediment extracted and to the TOC content of the samples (Fig. S3). These are especially apparent in the dinosterol, campesterol, and β-sitosterol concentrations. The differences are focused on the lower part of the record (500–400 cm), where Petermann Fjord is influenced by enhanced influx of terrestrial organic carbon (see Sect. 5.1). Thus, we use sterol concentrations normalized to the extracted sediment mass and the resulting fluxes to make inferences about past environmental changes. One sample at ∼ 319 cm has β-sitosterol concentrations 3 times higher than the average, while all other sterol concentrations fall within the reported range (Fig. S5). It is not clear why the β-sitosterol concentrations are so high in this specific sample. Thus, we have excluded this sample from all further analyses and interpretations. Cholesterol is significantly correlated with dinosterol (R2= 0.90 [0.64; 0.98], n= 93) and brassicasterol (R2= 0.93 [0.75; 0.98], n= 93), in line with a predominantly marine source of cholesterol in Petermann Fjord. Further, the marine sterols show a good correlation with the IP25 concentrations (IP25-brassicasterol: R2= 0.82 [0.62; 0.92], n= 93, IP25-cholesterol: R2= 0.89 [0.69; 0.96], n= 93, IP25-dinosterol: R2= 0.82 [0.56; 0.93], n= 93), suggesting an important role of sea ice in the regional marine primary productivity throughout the record.
Similar to the HBIs, the concentrations of all sterols increase at the transition from sedimentary units 3 to 2, with the most significant increase observed in β-sitosterol and campesterol (Fig. 4b, c). Both terrestrial sterols are characterized by a double peak throughout sedimentary unit 2, followed by a decline at the 1C–2 boundary, while the concentrations of marine sterols remain relatively stable throughout this interval (Fig. 4). Throughout unit 1C an increase in the cholesterol and dinosterol concentrations is observed from 350 cm, while their fluxes, alongside all other sterol concentrations, remain low until 260 cm (Fig. 4d, e). Peak concentrations are reached between 199 and 189 cm, followed by a slight decrease in all sterol concentrations and a recovery during lower sedimentary unit 1B (Fig. 4). Simultaneously, sterol fluxes are at their highest between 194 and 94 cm, corresponding to the interval of maximum LSR (Fig. 4). While the sterol fluxes decrease from 94 cm, concentrations peak from 84–74 cm, followed by a sharp decrease prior to the transition from sedimentary units 1B to 1C. Unit 1A is characterized by overall low sterol concentrations and fluxes (Fig. 4).

Figure 4Sterol biomarker results at OD1507-03TC-41GC-03PC. From the top to the bottom: (a) marine sterol index (sum of marine sterols divided by the sum of all sterols) (purple line). (b) β-Sitosterol fluxes (brown, filled-in area) and absolute concentration (brown line with dots) normalized to the amount of extracted sediment (ng g−1 sed). (c) Campesterol fluxes (light brown, filled-in area) and absolute concentration (light brown line with dots) normalized to the amount of extracted sediment (ng g−1 sed). (d) Cholesterol fluxes (orange-brown filled-in area) and absolute concentration (orange-brown line with dots) normalized to the amount of extracted sediment (ng g−1 sed). (e) Dinosterol fluxes (dark green, filled-in area) and absolute concentration (dark green line with dots) normalized to the amount of extracted sediment (ng g−1 sed). (f) Brassicasterol fluxes (light green, filled-in area) and absolute concentration (light green line with dots) normalized to the amount of extracted sediment (ng g−1 sed). Fluxes do not extend beyond ∼ 400 cm, as this depth corresponds to the lowermost radiocarbon date (Reilly et al., 2019). The vertical background fill indicates the lithological units (1A–C, 2, 3) at OD1507-03TC-41GC-03PC (Reilly et al., 2019).
For further insight into the environmental factors driving sterol variability, the marine sterol index (sum of marine sterols/sum of all sterols) was determined (Stein et al., 2017). This indicates that sedimentary units 3, 2, and the lowermost 1C have a higher relative concentration of terrestrial sterols, with a slight increase in the relative concentration of marine sterols just prior to the 2–1C boundary (Fig. 4a). The relative concentration of marine sterols increases between 314 and 59 cm, followed by a decrease at the boundary of sedimentary units 1A–1B (Fig. 4a).
Table 3Ranges of sterol biomarker concentrations and fluxes in OD1507-03TC-41GC-03PC.
4.3 Total organic carbon (TOC) concentration and TOC carbon isotopes (δ13Corg)
The overall amount of TOC in OD1507-03TC-41GC-03PC is very low, varying between 0.1 wt % and 0.3 wt % (Fig. 3c). Between 394–289 cm and at 109 cm, samples recorded high TOC (0.3 wt % –1.8 wt % ). Based on the available evidence, this suggests incomplete inorganic carbonate removal during sample processing. The interval between 394 cm and 289 cm is associated with high Ti Ca ratios and IRD delivery to the core site, indicating increased glacial sedimentation in outer Petermann Fjord (Reilly et al., 2019) (Fig. 3a), which might have been associated with input of detrital carbonates. Thus, these samples have been removed from the TOC and δ13Corg record (Fig. 3b and c).
The lowest TOC is encountered in sedimentary unit 3, followed by a sharp increase prior to the boundary of sedimentary units 3 and 2 at 520 cm depth. The lower unit 2 is characterized by large variability in the TOC content with two peaks at 520 and 490 cm, while the upper sediments of the same unit have a more stable TOC content around 0.15 wt % (Fig. 3c). From 409 cm a steady increase in TOC into sedimentary unit 1C is observed. The TOC content in sedimentary units 1C, 1B, and 1A varies between 0.17 wt % and 0.27 wt %, with local maxima around 250 and 94 cm and minima at 159 and 45 cm (Fig. 3c). TOC fluxes throughout these units vary between 109 and 422 µg cm−2 yr−1 with maximum fluxes from 194–94 cm, corresponding to the interval of maximum LSR. After 94 cm TOC fluxes decrease towards the boundary of sedimentary units 1B and 1A with minimum fluxes recorded at 54 cm and flux values similar to unit 1C throughout unit 1A (Fig. 3c).
The δ13Corg, measured on the same material as TOC, varies between −24.5 ‰ and −28.2 ‰. The lowest values are observed in sedimentary units 3 and 2 with minima at 530 and 490 cm and a relatively steady rise throughout the latter (Fig. 3b). Sedimentary units 1C, 1B, and 1A are marked by δ13Corg values between −26.4 ‰ and −24.5 ‰ with local minima at 249, 159, and 10 cm (Fig. 3b).
4.4 Planktonic and benthic foraminiferal abundances
The benthic and planktonic foraminiferal abundances vary between 0 and 429 specimens per gram of sediment and 0 and 92 specimens per gram of sediment, respectively (Fig. 3d, e). This corresponds to benthic and planktonic fluxes of 3–32 and 0–8 specimens cm−2 yr−1 (Fig. 3d, e). In sedimentary units 2 and 3, benthic and planktonic foraminiferal abundances are low. Both benthic and planktonic abundances increase near the unit 2–unit 1C boundary, at 404 and 384 cm depth, respectively. Unit 1C is characterized by the highest overall foraminiferal abundances and fluxes, with planktonic abundance and fluxes peaking between 312 and 304 cm prior to the benthic abundance, which peaks at 254 cm (Fig. 3d and e). Planktonic foraminifera abundances and fluxes decline from 250 cm in unit 1C and continue at low values through unit 1B and are nearly absent in unit 1A (Fig. 3e). Benthic foraminiferal abundances and fluxes are more variable but reach their lowest abundance in unit 1A (Fig. 3d).
5.1 Holocene variability in organic carbon sources and sea ice dynamics in Petermann Fjord
Organic carbon (Corg) in Petermann Fjord is derived from a variety of sources, including in situ pelagic and sympagic production, advection of marine organic matter, and input of both modern and ancient Corg from the surrounding landmasses. While HBI concentrations are only marginally influenced by the addition of terrestrial Corg, sterols are important constituents in both marine and terrestrial primary producers (Belicka et al., 2004; Rontani et al., 2014; Volkman, 1986, 2003; Volkman et al., 1993, 2000; Yunker et al., 1995) (Table 2). Thus, in combination with δ13Corg, they can provide information on the dominant Corg source.
Sedimentary unit 3 represents grounding zone proximal sedimentation, associated with the deglacial retreat of PG into the fjord (Jakobsson et al., 2018; Reilly et al., 2019). This is in line with very low biomarker and TOC concentrations and near absence of benthic and planktonic foraminifera (Fig. 5a–d), suggesting reduced primary productivity under an ice shelf or thick sea ice cover and/or high sedimentation rates close to the grounding zone diluting the concentrations of organic constituents and marine microfossils close to the margin of a retreating glacier. Both sedimentary units 3 and 2 are beyond the lowermost available radiocarbon age, which is why the influence of sedimentation rates on the biomarker and TOC concentrations cannot be assessed. The low marine sterol index throughout sedimentary unit 3 indicates that the Corg input was likely dominated by terrestrial sources, supported by low δ13Corg values, characteristic of terrestrial vegetation in high latitudes (−26 ‰ to −28 ‰) (Ruttenberg and Goñi, 1997) (Fig. 3b). Where Washington and Hall Land border Petermann Fjord they are characterized by sedimentary rocks of lower Paleozoic age, primarily composed of shallow marine carbonates and evaporites (Dawes et al., 2000; Harrison et al., 2011). These contain ancient biomass that can be traced in marine sediments. The thermal maturity of these rocks, however, indicates that fossil sterols will have been, to a large part, degraded to steranes (Parnell et al., 2007), not measured as part of this study. Thus, the increased abundance of terrestrial sterols in sedimentary unit 3 is most likely related to input of fresh terrestrial organic material. Campesterol and β-sitosterol are dominant in vascular plants (such as herbs) but are also found in mosses and lichens (Matsuo and Sato, 1991; Safe et al., 1975), common to the high Arctic tundra. The deglacial retreat of PG occurs relatively late during the deglaciation of northern Greenland (after 7600 cal yr BP) (Jakobsson et al., 2018), falling into the regional Holocene Thermal Maximum (HTM; ca. 11 000–5500 cal yr BP) (Kaufman et al., 2004) when adjacent Washington Land was already deglaciated (Ceperley et al., 2020) and pollen records from northern Greenland and Ellesmere Island suggest a more productive terrestrial Arctic ecosystem (Gajewski, 2015; Mode, 1996). This supports enhanced input of fresh terrestrial Corg to Petermann Fjord in response to glacial erosion and enhanced meltwater drainage of surrounding landmasses during the deglacial retreat of PG.

Figure 5Temporal changes in the environmental conditions in Petermann Fjord. From the top to the bottom: (a) benthic foraminiferal fluxes (purple, filled-in area) and benthic foraminiferal abundance in individuals per gram of sediment (purple line with diamonds). (b) Planktonic foraminiferal fluxes (crimson, filled-in area) and planktonic foraminiferal abundance in individuals per gram of sediment (crimson line with diamonds). (c) Brassicasterol fluxes (light green, filled-in area) and absolute concentration (light green line with dots) normalized to the amount of extracted sediment (ng g−1 sed). (d) IP25 fluxes (blue, filled-in area) and absolute concentration (blue line with dots) normalized to the amount of extracted sediment (ng g−1 sed). (e) Marine sterol index (sum of marine sterols divided by the sum of all sterols) (purple line). (f) TOC fluxes (green, filled-in area) and TOC concentrations (wt %, green line). (g) XRF Ti Ca ratios (grey) and the CT > 2 mm clast index (brown) (Reilly et al., 2019). (h) Reconstruction of the Holocene ice tongue extent (minimum extent in dark blue, maximum extent in light blue) in Petermann Fjord in kilometers from the grounding zone (Reilly et al., 2019). OD1507-03TC-41GC-03PC is located 80 km from the present-day grounding zone (black dashed line). Lithogenic units (1A–C, 2, 3) in sediment core OD1507-03TC-41GC-03PC are indicated with dashed vertical lines; grounding zone proximal sedimentation (unit 3) is indicated with a grey vertical bar. The red triangles on the x axes indicate the timing of the ice tongue breakup (∼ 6900 cal yr BP) and the late Holocene inception of a small ice tongue (∼ 2200 cal yr BP) (Reilly et al., 2019).
Mapped submarine landforms suggest that the retreat of PG into the fjord was rapid, driven by ice cliff instability and promoted by the retrograde slope of the outer fjord sill (Jakobsson et al., 2018). An inner sill (Tinto et al., 2015) ∼ 30 km seaward of the present-day grounding zone (Reilly et al., 2019) likely halted the retreat, allowing for the formation of an extensive ice tongue associated with the laminated, IRD-poor lithofacies of unit 2 (Reilly et al., 2019). The transition from units 3 to 2 is marked by an increase in all biomarkers, TOC, and benthic and planktonic foraminiferal abundances (Fig. 5), suggesting an overall increase in Corg input to outer Petermann Fjord and/or lower sedimentation rates in response to the larger distance of the core site from the grounding zone. The marine sterol index remains low, suggesting continued dominance of terrestrial versus marine sterols, while increasing δ13Corg values indicate enhanced importance of marine Corg sources to Petermann Fjord. Thus, compared to sedimentary unit 3, the organic matter in sedimentary unit 2 was likely derived from more varied sources, including in situ/advected marine Corg and terrestrial Corg. This supports a marginal/sub-ice tongue regime in outer Petermann Fjord with no or only intermittent sympagic and pelagic primary productivity in the fjord and low food supply to sustain benthic productivity (Jennings et al., 2020).
The early Holocene ice tongue of PG collapsed around 6900 cal yr BP (unit 2–unit 1C boundary), marked by the abrupt appearance of IRD clasts in sediments across Petermann Fjord (Reilly et al., 2019) (Fig. 5g). This is associated with an increase in the marine sterol index and TOC (Fig. 5), suggesting an increase in the Corg delivery to outer Petermann Fjord and relatively more input of marine versus terrestrial sterols compared to previous sedimentary units. A second, larger increase in the marine sterol index is evident at 5100 cal yr BP (Fig. 5e), contemporaneously with decreasing XRF Ti Ca ratios and IRD flux (Reilly et al., 2019). This indicates reduced glacial erosion and calving activity or a decrease in the delivery of erosional products to outer Petermann Fjord from 5100 cal yr BP and dominant input of marine over terrestrial Corg, supported by δ13Corg (Figs. 5, 3). The marine sterol index remains high until ∼ 600 cal yr BP, while δ13Corg is high throughout the rest of the core, suggesting primarily delivery of marine-derived organic matter to outer Petermann Fjord during the middle to late Holocene.
The breakup of the early Holocene ice tongue is also associated with a small increase in the sedimentary IP25 and HBI II concentrations, as well as an increase in the benthic and planktonic foraminiferal abundances. Between 6900 and 5500 cal yr BP, IP25 fluxes are low but variable, indicating an unstable/variable sea ice regime with predominantly reduced seasonal sea ice concentration during spring and low rates of sympagic productivity. An unstable sea ice regime is further supported by variable DIP25 values (Fig. S4). Alternatively, increased meltwater runoff related to the collapse of the ice tongue and associated retreat of PG might have caused low/variable IP25 fluxes by creating environmental conditions unfavorable for IP25-producing diatom species during times of increased freshwater discharge (Ribeiro et al., 2017). The simultaneous increase in TOC, benthic, and especially planktonic foraminiferal fluxes, however, supports a reduced seasonal sea ice cover and a shift from a regime marginal to or below an ice tongue towards ameliorated conditions with a prolonged open water season and enhanced pelagic primary productivity in the fjord, allowing planktonic foraminifera to thrive (Fig. 5b). A reduced seasonal sea ice cover is further supported by evidence of low sea ice concentrations in Hall Basin until at least 6000 cal yr BP (Jennings et al., 2011b). Regional records from northern Greenland and the western Canadian Arctic Archipelago (CAA) demonstrate a HTM between 11 000 and 5500 cal yr BP (Belt et al., 2010; Briner et al., 2016; England et al., 2008; Funder et al., 2011; Jennings et al., 2011b; Kaufman et al., 2004; Knudsen et al., 2008; Lecavalier et al., 2017; Ledu et al., 2010; Vare et al., 2009), associated with regional mean annual surface air temperatures 3 ± 1 ∘C higher than pre-industrial (1750 CE) (Lecavalier et al., 2017). Thus, reduced seasonal sea ice concentrations in Petermann Fjord between 6900 and 5500 cal yr BP likely represent the late stages of the HTM in the northern Nares Strait region.
From ca. 5800 cal yr BP the increase in planktonic and benthic foraminiferal fluxes steepens, associated with less variable but still low IP25 fluxes from 5500 cal yr BP (Fig. 5a, b, and d). While benthic foraminifera respond to sea ice changes via its influence on marine productivity and the resulting changes in food supply to the seafloor (Seidenkrantz, 2013), planktonic foraminiferal abundances have been shown to be highest in the open water region and along the ice margin, with only few individuals occurring under persistent sea ice (Carstens et al., 1997; Mayot et al., 2020; Pados and Spielhagen, 2014). In the modern environment of the northern Nares Strait and Petermann Fjord, planktonic foraminiferal abundances are very low in the fjord and much higher in the mobile sea ice regime of Nares Strait (Jennings et al., 2020), which is characterized by a shorter seasonal sea ice season than outer Petermann Fjord (Fig. 2). Thus, high planktonic foraminiferal fluxes between 5800 and 3600 cal yr BP suggest sustained periods of seasonally open waters during summer, while the continuously low IP25 fluxes are consistent with reduced seasonal sea ice concentrations and the absence of a sympagic spring bloom in outer Petermann Fjord (Fig. 5d). Alternatively, IP25 production might have been suppressed due to lasting meltwater discharge into the fjord, resulting from the influence of the retreating PG on the outer fjord environment. However, both the > 2 mm clast index and the XRF Ti Ca ratios decrease throughout this interval (Reilly et al., 2019), suggesting a gradual reduction of the influence of glacial activity on the outer fjord (Fig. 5g).
From 3900 cal yr BP, IP25 fluxes increase steeply, accompanied by an increase in all sterol fluxes (Figs. 4, 5d). This suggests a shift in the ecosystem in outer Petermann Fjord, associated with a transition from a regime dominated by pelagic primary productivity towards a regime characterized by enhanced sympagic productivity. Especially after 3600 cal yr BP, rapidly decreasing planktonic foraminiferal fluxes and steadily increasing IP25 fluxes indicate a progressively longer sea ice season and enhanced sympagic productivity in outer Petermann Fjord (Fig. 5b, d). This falls into a period of long-term declining regional atmospheric temperatures recorded at Agassiz ice cap (Lecavalier et al., 2017) and in lake records in NW Greenland (Axford et al., 2019; Lasher et al., 2017). Neoglacial cooling has been observed in numerous marine and terrestrial archives around Greenland and the wider North Atlantic region (e.g., England et al., 2008; Hansen et al., 2020; Jennings et al., 2011a; Limoges et al., 2020; Vare et al., 2009), as a response to decreasing Northern Hemisphere summer insolation (Marcott et al., 2013). Thus, enhanced seasonal sea ice conditions in Petermann Fjord from 3900 cal yr BP (Fig. 5d) likely record the onset of Neoglacial cooling in the northern Nares Strait region.
Peak IP25 fluxes around 2500 cal yr BP are associated with high fluxes of marine and terrestrial sterols as well as benthic foraminifera, while planktonic foraminiferal fluxes are low (Figs. 4, 5a, b, d), indicating a prolonged seasonal sea ice cover with only short periods of open water during summer. From 2500–2100 cal yr BP a two-stepped decrease in IP25 fluxes is observed, of which the second decline is accompanied by a decrease in the TOC and benthic foraminiferal flux and a small decrease in the (already low) planktonic foraminiferal flux (Fig. 5a, b, f). A contemporaneous decline in all productivity indicators and sea ice biomarkers suggests a restriction in the pelagic and sympagic primary productivity alike, most likely as a response to further lengthening of the sea ice season to near-perennial sea ice cover. This interval precedes the late Holocene inception of a small ice tongue in Petermann Fjord at 2200–2100 cal yr BP, inferred from Ti Ca ratios and the stacked > 2 mm clast index from four cores in Petermann Fjord (Reilly et al., 2019). After 2100 cal yr BP, sea ice biomarkers, TOC, and benthic foraminiferal fluxes recover, while the planktonic foraminiferal abundance remains low (Fig. 5a, d, f), indicating an ecosystem dominated by sympagic productivity and enhanced seasonal sea ice cover, similar to the interval 3600–2500 cal yr BP. Compared to the deglacial PG ice tongue, the late Holocene ice tongue (after 2100 cal yr BP) (Reilly et al., 2019) does not seem to be associated with increased input of terrestrial organic matter to outer Petermann Fjord (Fig. 5). A possible explanation could be lower atmospheric temperatures compared to the early Holocene (Lecavalier et al., 2017), which were associated with a less diverse and more sparse terrestrial flora in the high Arctic (Gajewski, 2015) and decreased meltwater input. Another reason could be increased distance of OD1507-03TC-41GC-03PC from the PG grounding zone during the late Holocene (Reilly et al., 2019), resulting in reduced delivery of meltwater-derived Corg.
Around 1300 cal yr BP a sharp decline in IP25, sterol, and TOC fluxes is observed, while the concentration of IP25 decreases more gradually, and the concentrations of sterols and TOC increase (Fig. 5). The sharp decrease in fluxes at this time coincides with a large drop in the LSR (Fig. 3a), which might be biasing the flux data. Instead, the decline in biomarker fluxes at 950 cal yr BP, accompanied by a decrease in the biomarker concentrations, seems to be a more reliable feature (Fig. 5). This is associated with declining benthic foraminiferal fluxes and followed by decreases in the planktonic foraminiferal and TOC fluxes at 700 cal yr BP (Fig. 5a, b, f), suggesting a return to near-perennial sea ice conditions with reduced pelagic and sympagic primary productivity, similar to the interval from 2500–2100 cal yr BP. At ca. 600 cal yr BP a rapid extension of the Petermann ice tongue to its modern limits (Reilly et al., 2019) resulted in (at least intermittent) cover of the core site, in line with low biomarker and foraminiferal fluxes between 600 cal yr BP and the top of the core (Fig. 5). The latter indicates low rates of primary productivity in a fjord, which is nearly completely covered by an ice tongue. This is further supported by a decrease in the marine sterol index between 600 cal yr BP and the top of the core, suggesting a relative decrease in the input of marine organic matter (Fig. 5e). However, while there is a small decrease in the TOC at this time, there is no corresponding decrease in the δ13Corg (Fig. 3b), suggesting that marine Corg was still the main source of TOC in outer Petermann Fjord.
5.2 Nares Strait sea ice dynamics over the last 7000 cal yr BP
Thus far, only one other biomarker-based sea ice reconstruction, from station Kane2b in northwestern Kane Basin, exists in Nares Strait for comparison with our records (Fig. 1) (Georgiadis et al., 2020). We propose that depending on the ice arch configuration in Nares Strait, Kane Basin and outer Petermann Fjord likely experience opposing conditions related to the proximity of the ice edge during spring–early summer (Fig. S1), which is the dominant productivity season of sea ice biomarkers. Kane2b is located near/under the southern ice arch in Nares Strait. Thus high sympagic productivity and IP25 fluxes occur during times of a stable ice arch in Smith Sound, and sea ice edge conditions exist during spring–summer (Georgiadis et al., 2020) (Fig. 6b, d). Georgiadis et al. (2020) interpret HBI III as generally indicating ice-laden/fresh surface waters, which can occur following the breakup of the southern ice arch and during times of mobile sea ice in Nares Strait. Thus, the southern ice arch scenario is likely associated with variable HBI III fluxes at Kane2b, depending on the seasonal timing of ice arch breakup. During the southern ice arch scenario, sea ice in Petermann Fjord does not break up until late summer–early fall (Fig. 2), likely hindering a pronounced in-ice bloom related to MIZ conditions during spring–summer, resulting in relatively low sea ice and phytoplankton biomarker concentrations (Fig. 6b, d). In years when only the northern ice arch forms, sea ice formed locally in Nares Strait either remains mobile throughout the winter or breaks up during early spring. Under these conditions HBI III fluxes at Kane2b can be relatively high depending on the sea ice flux through Nares Strait during spring–summer, but no pronounced sympagic spring bloom occurs in Kane Basin (Fig. 6c). Instead, outer Petermann Fjord experiences spring MIZ conditions, as the formation of landfast ice in Petermann Fjord is independent of the formation of landfast ice in Nares Strait (Figs. 2, S1). This is likely associated with a significant spring sympagic bloom in outer Petermann Fjord and enhanced primary productivity related to the vicinity of the ice edge, resulting in increased concentrations of sea ice and primary productivity biomarkers in outer Petermann Fjord (Fig. 6c). Periods with contemporaneously low concentrations of sea ice and primary productivity biomarkers in Kane Basin and Petermann Fjord point towards low spring sea ice concentration in the entire Nares Strait, likely associated with a failure of both ice arches (Fig. 6a). In addition to the Kane Basin record, sea ice dynamics around Ellesmere Island and NE Greenland have been inferred from records of driftwood delivery and beach ridge formation (England et al., 2008; Funder et al., 2011), providing context with respect to Holocene sea ice conditions in the Arctic Ocean and Lincoln Sea. Driftwood is transported with Arctic multiyear ice and is deposited along the coastlines of northern Greenland and Ellesmere Island when landfast ice breaks up during summer (Funder et al., 2011). The formation of beach ridges also depends on sufficient wave action and open water along the coast. Thus, abundant driftwood delivery to Ellesmere Island and northeastern Greenland together with abundant formation of beach ridges is indicative of seasonally open waters along the coast (Fig. 6a). Sea ice conditions with year-round landfast ice along the coast, on the other hand, will result in little or no driftwood landings and reduced formation of beach ridges (Fig. 6d). Lastly, variable ice conditions in Lincoln Sea result in occasional/little driftwood landings and reduced/variable formation of beach ridges (Fig. 6b, c).
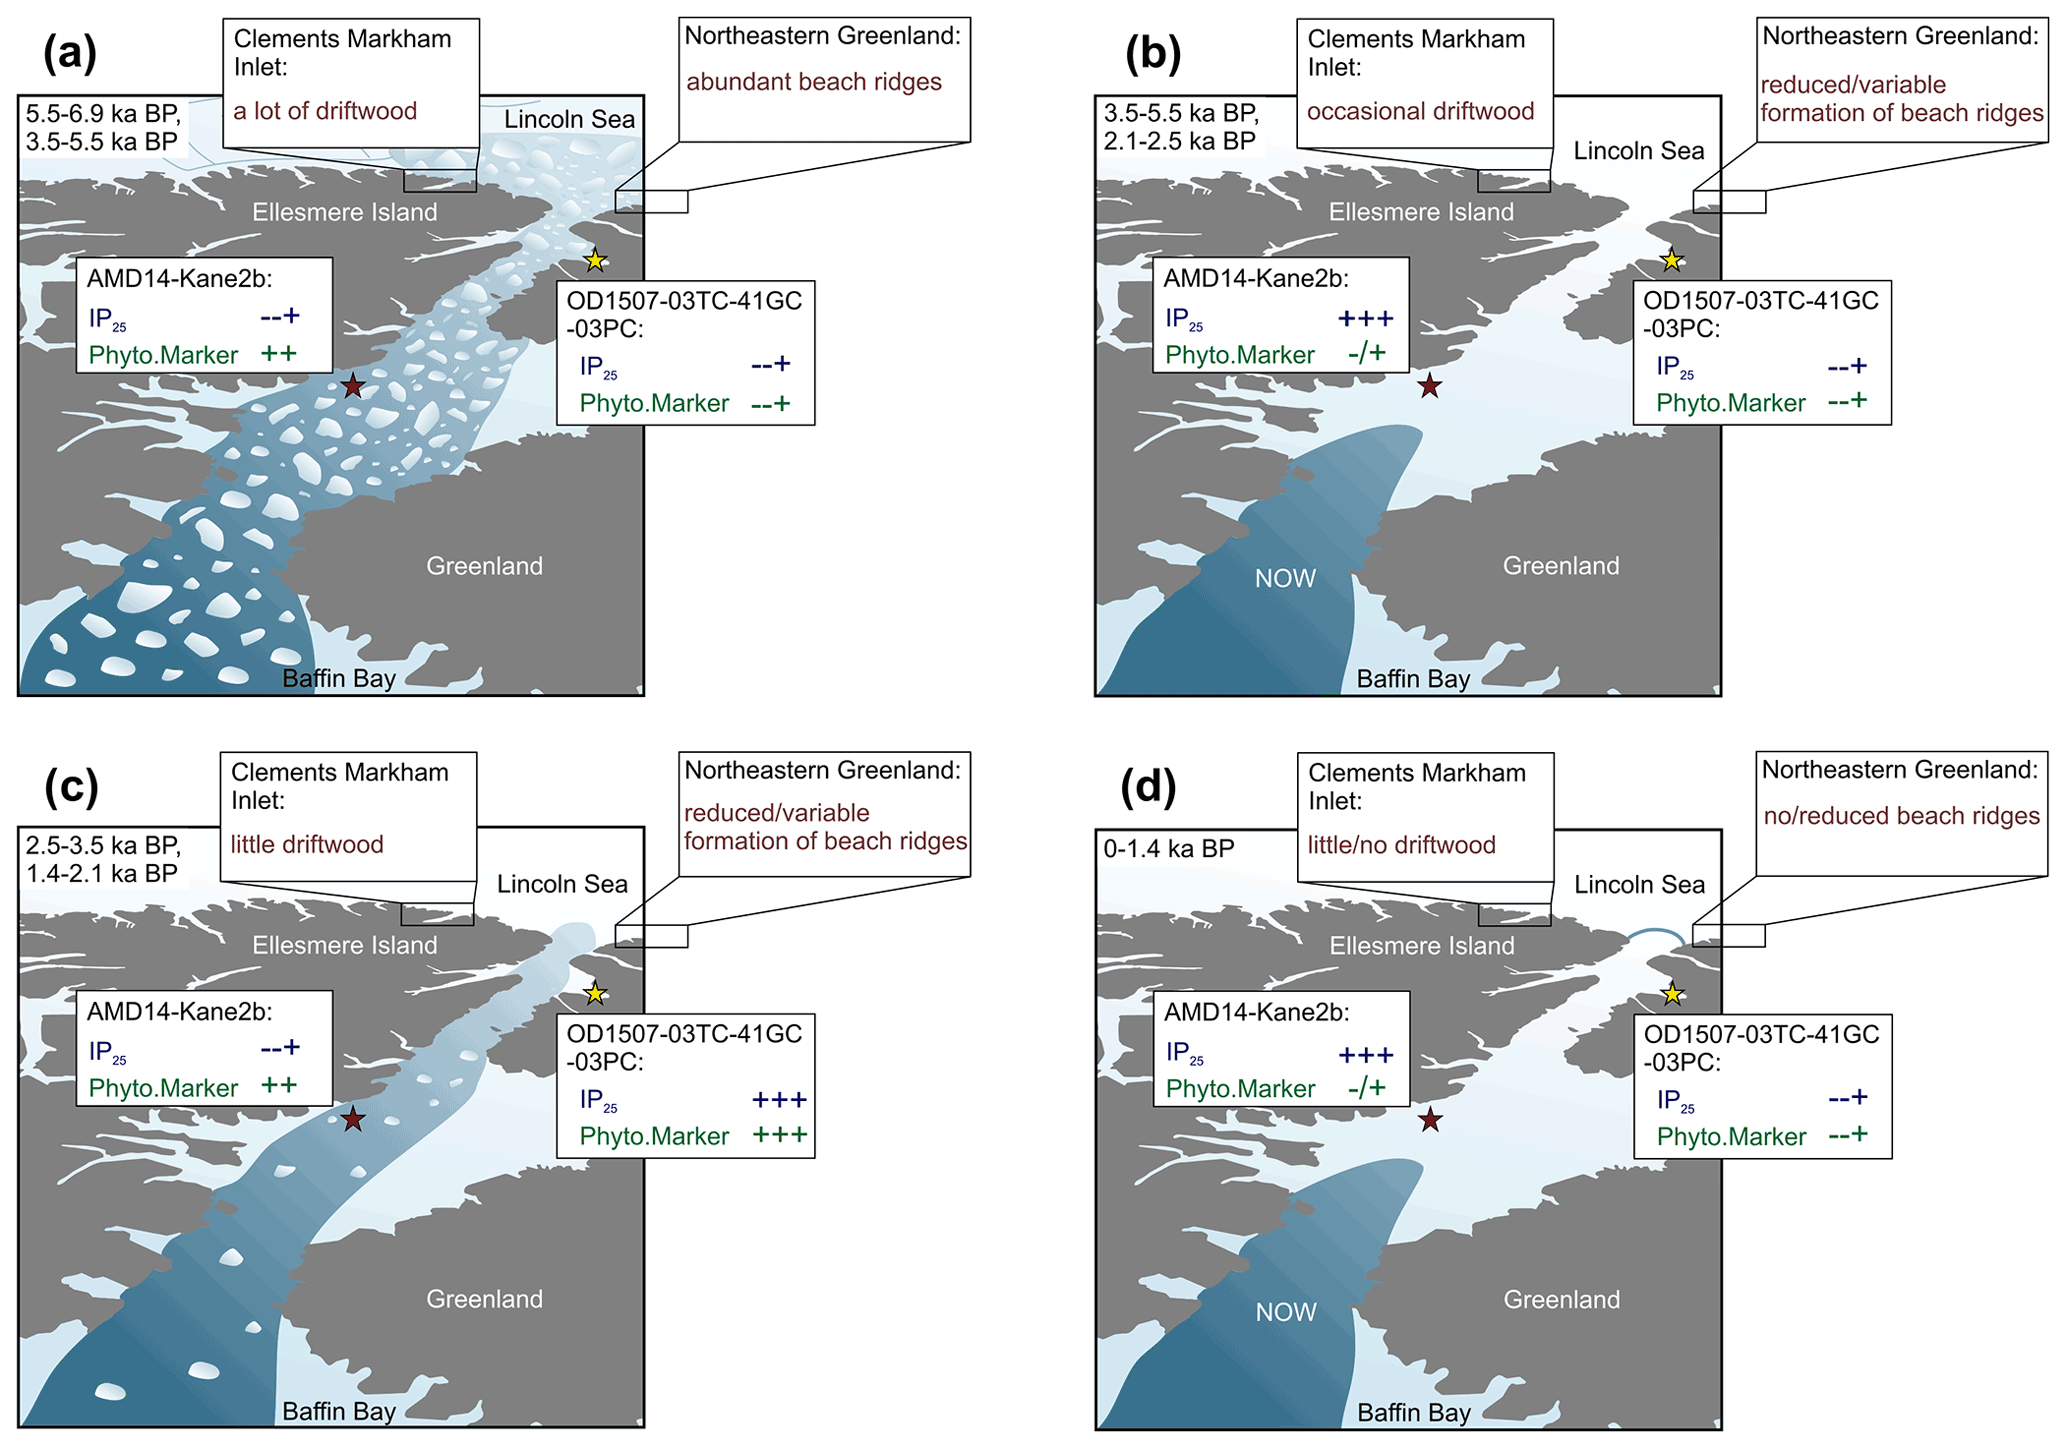
Figure 6Schematic of different ice arch scenarios in Nares Strait and the resulting spring sea ice conditions and sea ice biomarker (IP25) and primary productivity indicator (Phyto.Marker: HBI III at Kane2b, sterols at OD1507-03TC-41GC-03PC) sedimentation patterns at OD1507-03TC-41GC-03PC (yellow star) and AMD14-Kane2b (red star). Biomarker concentrations are illustrated as relative changes (in order of increasing concentrations: , , ; indicates variable concentrations). Further, relative changes in the driftwood delivery to CMI and beach ridge formation along the coast of northeastern Greenland are illustrated, based on the different ice arch scenarios. In addition to the access to the coast, driftwood delivery also depends on the multiyear ice conditions in the Arctic Ocean; this is not considered in this simplified schematic. (a) No ice arch formation in Nares Strait resulting in year-round mobile sea ice. (b) Recurrent southern ice arch with landfast sea ice in Nares Strait and an open NOW. (c) Recurrent northern ice arch with locally formed sea ice remaining mobile in Nares Strait year-round. (d) Recurrent northern and southern ice arch with landfast sea ice in Nares Strait and a stable NOW. The time periods in the top left corner of each panel correspond to the proposed Holocene interval that experienced the respective conditions.
While the sediment core from station Kane2b covers the last 9000 cal yr BP (Georgiadis et al., 2020) (Fig. 1), Petermann Fjord did not deglaciate until ∼ 7600 cal yr BP (Jakobsson et al., 2018), and the age model for OD1507-03TC-41GC-03PC is only constrained for the last 7000 cal yr BP. Thus, we focus on the interval from 6900 cal yr BP to the present. Between 6900 and 5500 cal yr BP, corresponding to the late stages of the regional HTM (Kaufman et al., 2004), sea ice biomarker and foraminiferal fluxes in Petermann Fjord and Kane Basin (Georgiadis et al., 2020) indicate reduced seasonal sea ice occurrence (Fig. 7f, g). This corresponds to sparse driftwood delivery but abundant beach ridge formation around NE Greenland from 8500–6000 cal yr BP, suggesting a minimum in Arctic multi-year ice and seasonally open water along the coast (Funder et al., 2011; Möller et al., 2010). Seasonally open water is further supported by maximum driftwood delivery to Disraeli Fiord and Clements Markham Inlet (CMI) on Ellesmere Island (England et al., 2008) (Figs. 1, 7e). This is in line with reduced seasonal sea ice occurrence in Nares Strait, suggesting predominantly mobile sea ice with no or only occasional ice arch formation and export of Arctic sea ice through Nares Strait (Fig. 6a) (Georgiadis et al., 2020).
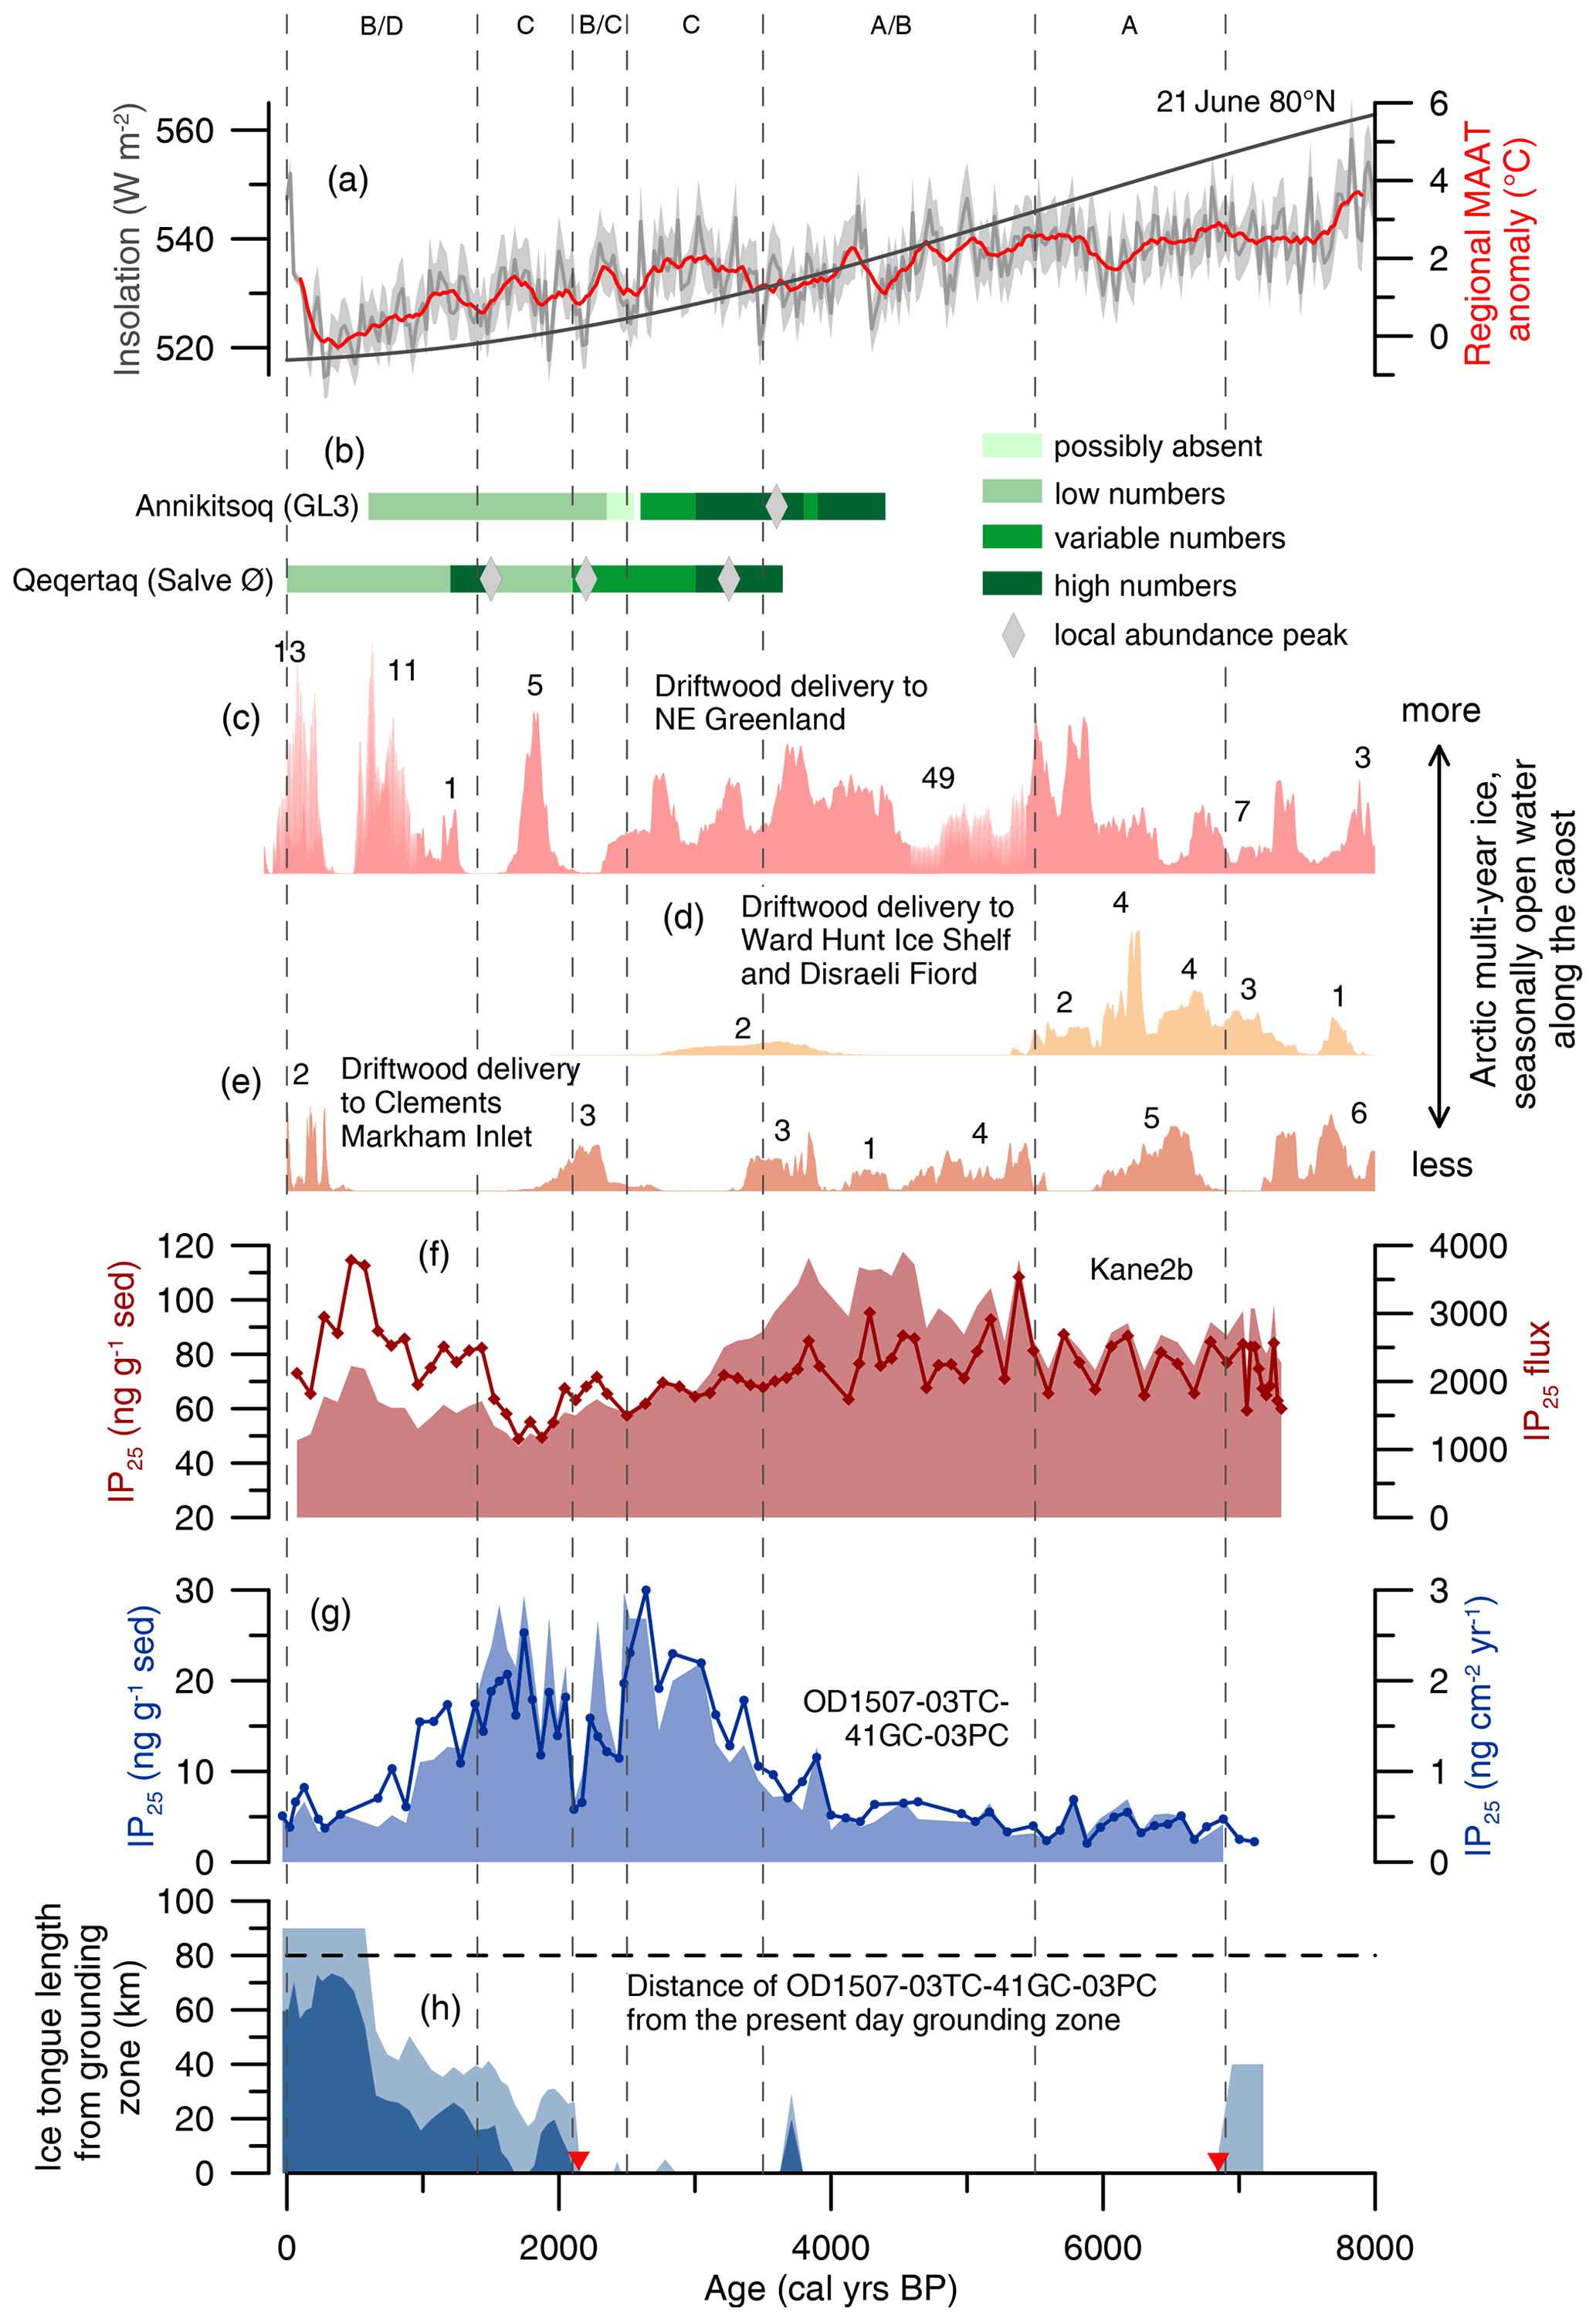
Figure 7Holocene environmental changes in the wider Nares Strait region. From the top to the bottom: (a) regional mean annual air temperature (MAAT) anomaly based on δ18O at Agassiz ice cap at 25-year resolution (Lecavalier et al., 2017) (grey line) including a 2σ uncertainty envelope (light grey filled-in area) and a 5 pt running mean (red line), together with the 21 June insolation at 80∘ N (dark grey). (b) Inferred variability in little auk numbers in seabird colonies at Annikitsoq and Qeqertaq (Davidson et al., 2018). (c) Cumulative probability distribution of calibrated 14C ages of driftwood in NE Greenland north of 80∘ N (pink filled-in area) (Funder et al., 2011). The numbers above the shaded area indicate the number of ages contributing to each block. (d) Cumulative probability distribution of calibrated 14C ages of driftwood at Ward Hunt Ice Shelf and in Disraeli Fiord (yellow filled-in area) (England et al., 2008). The numbers above the shaded area indicate the number of ages contributing to each block. (e) Cumulative probability distribution of calibrated 14C ages of driftwood in Clements Markham Inlet (yellow filled-in area) (England et al., 2008). The numbers above the shaded area indicate the number of ages contributing to each block. (f) IP25 fluxes (red, filled-in area) and absolute concentrations (red line with diamonds) normalized to the amount of sediment extracted at AMD14-Kane2b (Georgiadis et al., 2020). (g) IP25 fluxes (blue, filled-in area) and absolute concentrations (blue line with dots) normalized to the amount of sediment extracted at OD1507-03TC-41GC-03PC. (h) Reconstruction of the Holocene ice tongue extent (minimum extent in dark blue, maximum extent in light blue) in Petermann Fjord in kilometers from the grounding zone (Reilly et al., 2019). OD1507-03TC-41GC-03PC is located 80 km from the present-day grounding zone (black dashed line). Corresponding to Fig. 6, interpretations of past ice arch dynamics in Nares Strait are marked with dashed vertical lines. The letters at the top correspond to the schematic scenarios in Fig. 6. The red triangles on the x axes indicate the timing of the ice tongue breakup (∼ 6900 cal yr BP) and the late Holocene inception of a small ice tongue (∼ 2200 cal yr BP) (Reilly et al., 2019).
At 5500 cal yr BP increasing sea ice biomarker fluxes in Kane Basin indicate a shift towards later sea ice retreat and ice edge productivity, interpreted to reflect recurrent formation of the southern ice arch in Smith Sound and Kane Basin between 5500 and 3000 cal yr BP (Georgiadis et al., 2020) (Fig. 7f). Studies of seabird colonies in the NOW region suggest the arrival of little auk colonies in NW Greenland at 4400 cal yr BP, supporting the opening of the NOW lee of the Smith Sound ice arch during spring–summer (Davidson et al., 2018; Ribeiro et al., 2021) (Fig. 7b). Little auk are zooplanktivore, feeding on the abundant copepod population of the NOW. Thus, large colonies of little auk in Greenland are only found in the vicinity of productive polynyas, where open water is available for foraging upon their arrival in spring (Davidson et al., 2018). Productive and strong NOW conditions from 4400 cal yr BP are also inferred based on foraminiferal assemblages from the central polynya region (Jackson et al., 2021). Simultaneously, landfast sea ice started to form in Disraeli Fiord on northern Ellesmere Island from ∼ 5500 cal yr BP, covering large parts of the coast by ∼ 3500 cal yr BP (England et al., 2008), and shorter periods of open water and restricted beach ridge formation occur around NE Greenland (Funder et al., 2011). Even though this suggests an intensification of landfast sea ice in the Lincoln Sea and the Arctic Ocean, open water along the NE Greenland coast was more abundant compared to today until at least 4500 cal yr BP (Funder et al., 2011). The period from 5500–3500 cal yr BP thus marks the transition from early Holocene warmth to Neoglacial cooling in the wider Nares Strait region. Compared to Kane2b, biomarker fluxes do not increase significantly at 5500 cal yr BP in outer Petermann Fjord (Fig. 7g). Instead, benthic and planktonic foraminiferal fluxes are at their highest between 5500 and 3500 cal yr BP (Fig. 6a, b), interpreted to reflect reduced seasonal sea ice concentrations, the absence of a sympagic spring bloom, prolonged periods of seasonally open waters during summer, and increased pelagic primary productivity. Alternatively, the continuous influence of the retreating PG during this interval, potentially associated with increased meltwater discharge into the fjord, might have caused low concentrations of sea ice biomarkers in outer Petermann Fjord (Ribeiro et al., 2017). Nonetheless, the high foraminiferal fluxes indicate conditions that differ from what would be expected in outer Petermann Fjord under a stable southern ice arch scenario (Fig. 6b). A possible reason for this could be enhanced seasonality, in particular enhanced winter cooling, due to the increasing sea ice extent in the Arctic Ocean (England et al., 2008; Funder et al., 2011), while summer insolation was still relatively high (though decreasing) compared to the late Holocene (Fig. 7). Modeling studies have shown that the loss of sea ice in the Arctic Ocean during the early Holocene counteracted the increased seasonality prescribed by insolation forcing, due to enhanced ocean–atmosphere heat flux during winter (Fischer and Jungclaus, 2011). The Arctic Ocean thus acted as a heat reservoir with increased latent and sensible heat flux during winter as a result of the reduced sea ice cover (Fischer and Jungclaus, 2011). Conversely, decreasing summer insolation and the associated increase in Arctic Ocean sea ice cover during the mid-Holocene (Fig. 7) strengthened the insulating effect of sea ice on the ocean and led to pronounced cooling during fall–winter (Fischer and Jungclaus, 2011). Enhanced seasonality could explain the observed proxy patterns in Nares Strait between 5500 and 3500 cal yr BP, with an early seasonal breakup of the southern ice arch, leading to increased pelagic primary productivity in northern Nares Strait. This way, the spring ice edge bloom might still have occurred in the southern Nares Strait, followed by a rapid sea ice retreat and open water conditions during summer–fall, as recorded in outer Petermann Fjord. An early seasonal breakup of the southern ice arch is also supported by high HBI III fluxes, especially between 4500 and 3500 cal yr BP (Georgiadis et al., 2020). Thus, we suggest that this interval represents the transition from reduced sea ice conditions and the lack of ice arches in Nares Strait during the late HTM towards more stable sea ice conditions associated with the seasonal formation of a recurrent southern ice arch from at least ∼ 4400 cal yr BP.
From 3900 cal yr BP, increasing IP25 fluxes in Petermann Fjord attest to a shift in the primary productivity regime from predominantly pelagic to MIZ and sympagic primary productivity at 3500 cal yr BP. A similar increase in IP25 concentrations from ∼ 4000 cal yr BP is also observed in the western CAA, in the Barrow, Victoria, and Dease straits (Belt et al., 2010; Vare et al., 2009), in line with enhanced seasonal sea ice formation and the onset of regional Neoglacial cooling. Conversely, IP25 fluxes in Kane Basin decrease from ∼ 4000 cal yr BP until 1400 cal yr BP (Fig. 7f), suggesting no stable southern ice arch in Smith Sound. Instead, the driftwood delivery to CMI ceases at 3500 cal yr BP (England et al., 2008). This likely indicates a regime shift in Nares Strait, with the northern ice arch becoming more prominent between 3500 and 1400 cal yr BP (Fig. 6c). In years where only the northern ice arch forms, along-strait winds in Nares Strait keep locally formed sea ice mobile year-round (Vincent, 2019), creating MIZ conditions in Petermann Fjord during spring–summer (Fig. S1) in line with high IP25 concentrations. Between 2500 and 2100 cal yr BP biomarker fluxes in outer Petermann Fjord suggest a shift towards near-perennial sea ice conditions (Fig. 7g). This coincides with some driftwood landings in CMI (England et al., 2008) and a period of no driftwood or beach ridge occurrences in NE Greenland, suggesting perennial landfast ice (Funder et al., 2011). The numbers of little auks at Qeqertaq (Salve Ø) are variable during this time period, with a local peak in abundance at ∼ 2200 cal yr BP (Davidson et al., 2018). In Kane Basin, IP25 fluxes are relatively low until ca. 1400 cal yr BP; however a minor peak (more pronounced in IP25 concentrations) can be observed between ca. 2300 and 2000 cal yr BP. This coincides with a period of low HBI III fluxes from ca. 2700–2100 cal yr BP at Kane2b (Georgiadis et al., 2020). Georgiadis et al. (2020) interpret HBI III as indicating ice-loaded fresh surface waters due to mobile sea ice/ice arch breakup in Nares Strait. A decrease in HBI III fluxes and concomitant small increase in IP25 could thus result from intermittent formation of the southern ice arch in Kane Basin and opening of the NOW, consistent with the local abundance peak of little auks and sea ice records from outer Petermann Fjord and northeastern Greenland. Foraminiferal assemblages from the central NOW region (91-039-008P, Fig. 1) demonstrate a shift towards increased bottom water ventilation around 2600 cal yr BP (Knudsen et al., 2008), which could point towards strengthened polynya conditions and intensified brine formation in the NOW region. Unfortunately, however, no sediments were recovered at site 91-039-008P between 2450 and 1100 cal yr BP (Knudsen et al., 2008). Increased bottom water ventilation is also inferred from measurements of total sulfur at CASQ1 (Fig. 1) (Jackson et al., 2021). Simultaneously, calcareous foraminiferal abundances are low between 2500–2000 cal yr BP at CASQ1 (Fig. 1) (Jackson et al., 2021). While this hinders unambiguous environmental interpretations, it could also be a sign of strong polynya conditions and formation of CO2-rich brines, causing dissolution of the calcareous foraminiferal test and preservation of agglutinated species only (Jackson et al., 2021). Georgiadis et al. (2020) suggest that the period of mobile sea ice in Nares Strait between 3500 and 1400 cal yr BP was driven by a change in the dominant phase of the Arctic Oscillation (AO). The shift towards a positive AO between 3000 and 1200 cal yr BP (Darby et al., 2012) might have been associated with stronger along-strait winds in Nares Strait. As ice arch formation in Nares Strait is a function of ice thickness, local wind stress, and atmospheric temperatures (Barber et al., 2001; Samelson et al., 2006), distinct atmospheric cooling spikes between ∼ 2500 and ∼ 1900 cal yr BP, recorded at Agassiz ice cap (Lecavalier et al., 2017), might have been responsible for the enhanced sea ice concentration and the formation of an intermittent southern ice arch in Nares Strait between 2500 and 2100 cal yr BP (Fig. 7a).
After 2100 cal yr BP and until 1400 cal yr BP, the combined biomarker records in Nares Strait support a return to a more northern ice-arch-dominated sea ice regime. This is supported by records from the central NOW region, suggesting weaker polynya conditions from ca. 2000–1200 cal yr BP (Jackson et al., 2021; Ribeiro et al., 2021). From 1400 cal yr BP onwards, IP25 fluxes in Kane Basin increase (Georgiadis et al., 2020), while they decline in Petermann Fjord (Fig. 7f, g) concomitant with high numbers of little auks at Qeqertaq (Salve Ø) (Davidson et al., 2018), suggesting a transition towards a more stable southern ice arch. These conditions are further consolidated from 950 cal yr BP, where the sudden drop in sea ice and primary productivity indicators in Petermann Fjord (Figs. 5, 7g) indicate near-perennial landfast sea ice in Nares Strait promoted by the recurrent formation of a southern ice arch, which was associated with stable NOW conditions from ∼ 800 cal yr BP (Ribeiro et al., 2021). Driftwood is absent in CMI from 2200–400 cal yr BP (England et al., 2008), suggesting that the northern arch might have been a stable feature as well (Figs. 7e, 6d). Periods of double ice arching in Nares Strait are particularly stable (Ryan and Münchow, 2017), in line with the coldest Holocene temperatures recorded at Agassiz ice cap throughout this interval (Lecavalier et al., 2017). At ∼ 600 cal yr BP a large jump in the extent of the late Holocene ice tongue in Petermann Fjord to its modern (pre-2010) limits, leads to a regime marginal to or under an ice tongue in outer Petermann Fjord (Reilly et al., 2019) (Fig. 7h). Thus, further interpretations of the sea ice environment in Nares Strait are hindered due to the influence of the ice tongue on primary productivity in Petermann Fjord.
5.3 Implications of sea ice for the formation and stability of the Petermann ice tongue
A recent study by Reilly et al. (2019) demonstrates that an extensive ice tongue in Petermann Fjord is a relatively recent feature compared to large parts of the Holocene. The final stage of the deglaciation in Petermann Fjord was characterized by the breakup of a deglacial ice tongue around 6900 cal yr BP, followed by a period of enhanced IRD and Ti Ca ratios in the fjord sediments (6900–3500 cal yr BP; Fig. 5g), indicating increased glacial sedimentation in outer Petermann Fjord. First at ∼ 2200 cal yr BP a small ice tongue re-emerged, followed by gradual growth and a rapid expansion to its modern extent around 600 cal yr BP (Reilly et al., 2019). Thus, the middle to late Holocene was marked by a ∼ 4700-year interval where no stable ice tongue existed in Petermann Fjord (Reilly et al., 2019). The presence of an ice tongue in Petermann Fjord is determined by the interplay of several factors, including the surface mass balance of PG, the loss of glacial ice by calving, and the basal melt rates. Local changes in sea ice dynamics have the potential to influence both the basal melt rates and the stability of the calving front at PG. The latter depends on the formation and seasonal duration of landfast sea ice in Petermann Fjord, creating an ice mélange that stabilizes the calving front and reduces the length of the calving season (Amundson et al., 2010; Carr et al., 2015; Robel, 2017; Todd and Christoffersen, 2014). Along with the increase in IP25 fluxes in outer Petermann Fjord, indicating a transition towards enhanced sea ice conditions, from at least 3500 cal yr BP, a cessation of the IRD flux is observed in OD1507-03TC-41GC-03PC (Fig. 5d, g) (Reilly et al., 2019). This suggests a gradual decrease in the calving of icebergs from PG during the mid-Holocene. We propose that this was partly in response to the formation of seasonal landfast ice in the fjord, shortening the calving season (Figs. 6, 7). Sea ice also has the ability to influence the oceanic heat transport to Petermann Fjord by regulating the wind stress at the atmosphere–ocean interface in Nares Strait, which in turn modifies the circulation-driven inflow of AW to the fjord (Shroyer et al., 2017). Under modern conditions, AW inflow is enhanced at times of mobile sea ice in Nares Strait, while landfast sea ice results in decreased oceanic heat flux to Petermann Fjord (Shroyer et al., 2017). In addition to Nares Strait sea ice conditions, subglacial runoff and glacial isostatic uplift of the outer fjord sill likely also influenced the inflow of AW to Petermann Fjord across the Holocene (Bennike, 2002; Cai et al., 2017; Washam et al., 2019). Recurrent formation of a southern ice arch and seasonal formation of landfast sea ice may have persisted in Nares Strait from 5500–3500 cal yr BP, 2500–2100 cal yr BP, and after 1400 cal yr BP, based on the assessment of regional sea ice records (England et al., 2008; Funder et al., 2011; Georgiadis et al., 2020; this study) (Fig. 6b, d). The interval from 5500–3500 cal yr BP marks the transition from the HTM to Neoglacial cooling in the Nares Strait region. While records from the southern Nares Strait region suggest an opening of the NOW and spring ice edge conditions in Kane Basin from at least 4400 cal yr BP (Davidson et al., 2018; Georgiadis et al., 2020; Jackson et al., 2021; Ribeiro et al., 2021), records from outer Petermann Fjord indicate low sympagic but high pelagic productivity, suggesting prolonged periods of open water during summer (Fig. 5a, b, d). Increased seasonality, with early breakup of the southern ice arch and late seasonal sea ice formation, might be able to explain the observed patterns (Sect. 5.3). Thus, unlike today, the formation of a southern ice arch between 5500 and 3500 cal yr BP is unlikely to have resulted in a prolonged landfast ice season in Nares Strait. Consequently, the longer mobile sea ice season in Nares Strait might have contributed to AW inflow to Petermann Fjord, preventing the formation of an ice tongue throughout this interval.
Between 2500 and 2100 cal yr BP regional records of sea ice (England et al., 2008; Georgiadis et al., 2020; this study), seabird colonies (Davidson et al., 2018) and NOW dynamics (Jackson et al., 2021) suggest intermittent formation of a southern ice arch in Nares Strait, likely in response to regional atmospheric cooling spikes (Lecavalier et al., 2017). This interval spans the inception of a small late Holocene ice tongue in Petermann Fjord (Fig. 7h), suggesting that increased formation of landfast ice in Nares Strait may have reduced the oceanic heat flux to Petermann Fjord and stabilized the glacier front. Together with atmospheric cooling, this likely aided the formation of a small ice tongue at ∼ 2200 cal yr BP (Reilly et al., 2019). Similar mechanisms might have been at play during the interval after 1400 cal yr BP spanning the rapid growth of the Petermann ice tongue to its modern limits at ca. 600 cal yr BP (Reilly et al., 2019). Regional sea ice records indicate the onset of a more recurrent southern arch from ∼ 1400 cal yr BP, with a further decrease in sea ice and primary productivity markers in Petermann Fjord and a concurrent increase in IP25 in Kane Basin at 950 cal yr BP implying the formation of more stable southern ice arch conditions and potentially even double ice arching. Thus, both the inception of the ice tongue in Petermann Fjord at ∼ 2200 cal yr BP and its rapid extension at 600 cal yr BP are preceded by a transition towards stable southern ice arch conditions in the Nares Strait by 300–350 years (Figs. 7, 6b, d). More severe sea ice, with longer periods of landfast ice in Nares Strait, thus likely promoted ice tongue growth in Petermann Fjord, either directly via stabilizing the calving front or indirectly via changes to the inflow in AW. In light of the recent changes in Nares Strait ice arch configuration (Vincent, 2019), our data suggest that the emerging dominance of the northern ice arch associated with year-round mobile sea ice in Nares Strait and a shorter landfast sea ice season in Petermann Fjord will likely contribute to the destabilization of the ice tongue. Thus, a future reduction in landfast sea ice in Nares Strait and adjacent fjords would likely contribute to enhanced mass loss from the GrIS.
During the deglaciation (before 6900 cal yr BP) outer Petermann Fjord experienced enhanced input of fresh terrestrial Corg, likely due to the late deglacial retreat of PG and increased glacial erosion during the early HTM, characterized by more productive Arctic tundra vegetation in northern Greenland and Ellesmere Island.
Following deglacial retreat of PG and breakup of the deglacial ice tongue in Petermann Fjord at 6900 cal yr BP, sea ice biomarkers and productivity indicators in outer Petermann Fjord suggest reduced seasonal sea ice occurrence and predominantly pelagic primary productivity until 5500 cal yr BP, corresponding to the late stages of the regional HTM. Together with other regional records, this suggests the lack of ice arches and export of sea ice from Lincoln Sea through Nares Strait.
The interval from 5500–3500 cal yr BP marks the transition from the late stages of the HTM to the onset of Neoglacial cooling. This was likely associated with a formation of a southern ice arch and the opening of the NOW from at least ∼ 4400 cal yr BP. However, an earlier seasonal breakup of the southern ice arch, compared to today, associated with a longer open water season, caused enhanced pelagic productivity in Nares Strait and driftwood landings in CMI and around NE Greenland, suggesting seasonally open waters along the coast.
Between 3500 and 1400 cal yr BP (excluding 2500–2100 cal yr BP) outer Petermann Fjord was marked by enhanced pelagic productivity, suggesting a marginal ice zone location during early spring–summer in response to the northern Nares Strait ice arch becoming more prominent and locally formed sea ice remaining mobile in Nares Strait year-round. A stable northern ice arch throughout this interval is supported by the cessation of driftwood delivery to CMI.
From 2500–2100 cal yr BP, declining sea ice biomarker fluxes alongside declining productivity indicators in outer Petermann Fjord suggest a restriction of all primary productivity, likely as a result of near-perennial sea ice cover. In combination with a small rise in the IP25 and a concomitant decrease in the HBI III fluxes in Kane Basin, strong NOW conditions, reappearance of driftwood at CMI, and a local abundance peak of little auk seabird colonies at Qeqertaq (Salve Ø), this suggests a transient return to a southern ice arch regime in Nares Strait. Georgiadis et al. (2020) suggest that a dominantly positive AO phase from 3000–1200 cal yr BP, associated with stronger along-strait winds in Nares Strait might have physically prevented the formation of ice arches. Since ice arch formation in Nares Strait also depends on atmospheric temperatures and sea ice thickness, distinct atmospheric cooling spikes between 2500 and 1900 cal yr BP, might have exerted a positive feedback on sea ice mechanics, counterbalancing the increased wind stress and enabling the formation of a southern ice arch.
The collective sea ice reconstructions in the Nares Strait and Lincoln Sea region indicate a return to a stable southern ice arch regime and potentially even double ice arching after 1400 cal yr BP.
Our data demonstrate that the formation of landfast sea ice in Petermann Fjord and Nares Strait preceded major growth events of the Petermann ice tongue. This suggests that sea ice promotes an environment favorable for ice tongue growth, either directly or indirectly via stabilizing the glacier calving front and possibly decreasing the inflow of AW to Petermann Fjord. Conversely, a reduction in the landfast sea ice season in Nares Strait and adjacent fjords, as observed during the last decade, will likely contribute to destabilizing local ice tongues, which might result in enhanced mass loss from the GrIS in the future.
The data presented as part of this paper are archived in the PANGAEA database and can be accessed via the following link https://doi.org/10.1594/PANGAEA.929918 (Detlef et al., 2021).
The supplement related to this article is available online at: https://doi.org/10.5194/tc-15-4357-2021-supplement.
The study was designed by HD and CP with help from BR and AJ. MJ led the Petermann expedition and collected the core together with BR and AJ. HD carried out the sample processing and analyses for sea ice biomarkers with help from MMJ. AJ carried out the processing and analyses for foraminiferal census counts. JO performed the TOC analyses. MJ, MG, and CP acquired funding for this study. HD prepared the manuscript with valuable contributions from all co-authors.
The authors declare that they have no conflict of interest.
Publisher’s note: Copernicus Publications remains neutral with regard to jurisdictional claims in published maps and institutional affiliations.
We would like to thank the captain and crew, as well as the scientific party, on the icebreaker Oden during the Petermann 2015 expedition. Thank you to the Oregon State University Marine Geology Repository (OSU-MGR) for core archiving and sampling of the core. Further, we would like to thank Simon Belt and Lukas Smik for providing biomarker laboratory standards and Trine Ravn-Jonsen and René Bjerregaard Madsen for laboratory support. We also thank the Swedish Polar Research Secretariat for supporting the Petermann 2015 expedition. Lastly, we would like to acknowledge the use of imagery from the NASA Worldview application (https://worldview.earthdata.nasa.gov/), part of the NASA Earth Observing System Data and Information System (EOSDIS).
This research has been supported by the Aarhus Universitets Forskningsfond (grant no. AUFF-E-17-7-22 to Christof Pearce), the National Science Foundation Office of Polar Programs (grant no. 1417784 to Anne Jennings), the National Science Foundation Division of Ocean Sciences (grant no. 1558679), and the Vetenskapsrådet (grant no. 2016-04021 to Martin Jakobsson).
This paper was edited by Pippa Whitehouse and reviewed by Audrey Limoges and two anonymous referees.
Amundson, J. M., Fahnestock, M., Truffer, M., Brown, J., Lüthi, M. P., and Motyka, R. J.: Ice mélange dynamics and implications for terminus stability, Jakobshavn Isbræ, Greenland, J. Geophys. Res., 115, F01005, https://doi.org/10.1029/2009JF001405, 2010.
Ardyna, M. and Arrigo, K. R.: Phytoplankton dynamics in a changing Arctic Ocean, Nat. Clim. Change, 10, 892–903, https://doi.org/10.1038/s41558-020-0905-y, 2020.
Axford, Y., Lasher, G. E., Kelly, M. A., Osterberg, E. C., Landis, J., Schellinger, G. C., Pfeiffer, A., Thompson, E., and Francis, D. R.: Holocene temperature history of northwest Greenland – With new ice cap constraints and chironomid assemblages from Deltasø, Quaternary Sci. Rev., 215, 160–172, https://doi.org/10.1016/j.quascirev.2019.05.011, 2019.
Barber, D. G., Hanesiak, J. M., Chan, W., and Piwowar, J.: Sea-ice and meteorological conditions in Northern Baffin Bay and the North Water polynya between 1979 and 1996, Atmos.-Ocean, 39, 343–359, https://doi.org/10.1080/07055900.2001.9649685, 2001.
Belicka, L. L., Macdonald, R. W., Yunker, M. B., and Harvey, H. R.: The role of depositional regime on carbon transport and preservation in Arctic Ocean sediments, Mar. Chem., 86, 65–88, https://doi.org/10.1016/j.marchem.2003.12.006, 2004.
Belt, S. T.: Source-specific biomarkers as proxies for Arctic and Antarctic sea ice, Org. Geochem., 125, 277–298, https://doi.org/10.1016/J.ORGGEOCHEM.2018.10.002, 2018.
Belt, S. T. and Müller, J.: The Arctic sea ice biomarker IP25: a review of current understanding, recommendations for future research and applications in palaeo sea ice reconstructions, Quaternary Sci. Rev., 79, 9–25, https://doi.org/10.1016/j.quascirev.2012.12.001, 2013.
Belt, S. T., Massé, G., Rowland, S. J., Poulin, M., Michel, C., and LeBlanc, B.: A novel chemical fossil of palaeo sea ice: IP25, Org. Geochem., 38, 16–27, https://doi.org/10.1016/J.ORGGEOCHEM.2006.09.013, 2007.
Belt, S. T., Vare, L. L., Massé, G., Manners, H. R., Price, J. C., MacLachlan, S. E., Andrews, J. T., and Schmidt, S.: Striking similarities in temporal changes to spring sea ice occurrence across the central Canadian Arctic Archipelago over the last 7000 years, Quaternary Sci. Rev., 29, 3489–3504, https://doi.org/10.1016/j.quascirev.2010.06.041, 2010.
Belt, S. T., Brown, T. A., Rodriguez, A. N., Sanz, P. C., Tonkin, A., and Ingle, R.: A reproducible method for the extraction, identification and quantification of the Arctic sea ice proxy IP25 from marine sediments, Anal. Methods, 4, 705, https://doi.org/10.1039/c2ay05728j, 2012.
Belt, S. T., Cabedo-Sanz, P., Smik, L., Navarro-Rodriguez, A., Berben, S. M. P., Knies, J., and Husum, K.: Identification of paleo Arctic winter sea ice limits and the marginal ice zone: Optimised biomarker-based reconstructions of late Quaternary Arctic sea ice, Earth Planet. Sc. Lett., 431, 127–139, https://doi.org/10.1016/J.EPSL.2015.09.020, 2015.
Belt, S. T., Brown, T. A., Smik, L., Tatarek, A., Wiktor, J., Stowasser, G., Assmy, P., Allen, C. S., and Husum, K.: Identification of C25 highly branched isoprenoid (HBI) alkenes in diatoms of the genus Rhizosolenia in polar and sub-polar marine phytoplankton, Org. Geochem., 110, 65–72, https://doi.org/10.1016/J.ORGGEOCHEM.2017.05.007, 2017.
Bennike, O.: Late Quaternary history of Washington Land, North Greenland, Boreas, 31, 260–272, https://doi.org/10.1111/j.1502-3885.2002.tb01072.x, 2002.
Briner, J. P., McKay, N. P., Axford, Y., Bennike, O., Bradley, R. S., de Vernal, A., Fisher, D., Francus, P., Fréchette, B., Gajewski, K., Jennings, A., Kaufman, D. S., Miller, G., Rouston, C., and Wagner, B.: Holocene climate change in Arctic Canada and Greenland, Quaternary Sci. Rev., 147, 340–364, https://doi.org/10.1016/j.quascirev.2016.02.010, 2016.
Brown, T. A., Belt, S. T., Tatarek, A., and Mundy, C. J.: Source identification of the Arctic sea ice proxy IP25, Nat. Commun., 5, 4197, https://doi.org/10.1038/ncomms5197, 2014.
Cabedo-Sanz, P., Belt, S. T., Knies, J., and Husum, K.: Identification of contrasting seasonal sea ice conditions during the Younger Dryas, Quaternary Sci. Rev., 79, 74–86, https://doi.org/10.1016/j.quascirev.2012.10.028, 2013.
Cai, C., Rignot, E., Menemenlis, D., and Nakayama, Y.: Observations and modeling of ocean-induced melt beneath Petermann Glacier Ice Shelf in northwestern Greenland, Geophys. Res. Lett., 44, 8396–8403, https://doi.org/10.1002/2017GL073711, 2017.
Carr, J. R., Vieli, A., Stokes, C. R., Jamieson, S. S. R., Palmer, S. J., Christoffersen, P., Dowdeswell, J. A., Nick, F. M., Blankenship, D. D., and Young, D. A.: Basal topographic controls on rapid retreat of Humboldt Glacier, northern Greenland, J. Glaciol., 61, 137–150, https://doi.org/10.3189/2015JoG14J128, 2015.
Carstens, J., Hebbeln, D., and Wefer, G.: Distribution of planktic foraminifera at the ice margin in the Arctic (Fram Strait), Mar. Micropaleontol., 29, 257–269, https://doi.org/10.1016/S0377-8398(96)00014-X, 1997.
Ceperley, E. G., Marcott, S. A., Reusche, M. M., Barth, A. M., Mix, A. C., Brook, E. J., and Caffee, M.: Widespread early Holocene deglaciation, Washington Land, northwest Greenland, Quaternary Sci. Rev., 231, 106181, https://doi.org/10.1016/j.quascirev.2020.106181, 2020.
Darby, D. A., Ortiz, J. D., Grosch, C. E., and Lund, S. P.: 1,500-year cycle in the Arctic Oscillation identified in Holocene Arctic sea-ice drift, Nat. Geosci., 5, 897–900, https://doi.org/10.1038/ngeo1629, 2012.
Davidson, T. A., Wetterich, S., Johansen, K. L., Grønnow, B., Windirsch, T., Jeppesen, E., Syväranta, J., Olsen, J., González-Bergonzoni, I., Strunk, A., Larsen, N. K., Meyer, H., Søndergaard, J., Dietz, R., Eulears, I., and Mosbech, A.: The history of seabird colonies and the North Water ecosystem: Contributions from palaeoecological and archaeological evidence, Ambio, 47, 175–192, https://doi.org/10.1007/s13280-018-1031-1, 2018.
Dawes, P., Frisch, T., Garde, A., Iannelli, T., Ineson JR, Monrad Jensen, S., Pirajno, F., Stemmerik, L., Stouge, S., and Thomassen, B.: Kane Basin 1999: mapping, stratigraphic studies and economic assessment of Precambrian and Lower Palaeozoic provinces in north-western Greenland, Geol. Greenl. Surv. Bull., 186, 11–28, https://doi.org/0.34194/GGUB.V186.5211, 2000.
Dunbar, M.: The Geographical Position of the North Water on JSTOR, Arctic, 22, 438–441, https://doi.org/10.14430/ARCTIC3235, 1969.
England, J. H., Lakeman, T. R., Lemmen, D. S., Bednarski, J. M., Stewart, T. G., and Evans, D. J. A.: A millennial-scale record of Arctic Ocean sea ice variability and the demise of the Ellesmere Island ice shelves, Geophys. Res. Lett., 35, L19502, https://doi.org/10.1029/2008GL034470, 2008.
Fetterer, F., Knowles, K., Meier, W. N., Savoie, M., and Windnagel, A. K.: Sea Ice Index, Version 3.0, National Snow & Ice Data Center (NSIDC) [data set], https://doi.org/10.7265/N5K072F8, 2017 (updated daily).
Fischer, N. and Jungclaus, J. H.: Evolution of the seasonal temperature cycle in a transient Holocene simulation: orbital forcing and sea-ice, Clim. Past, 7, 1139–1148, https://doi.org/10.5194/cp-7-1139-2011, 2011.
Funder, S., Goosse, H., Jepsen, H., Kaas, E., Kjær, K. H., Korsgaard, N. J., Larsen, N. K., Linderson, H., Lyså, A., Möller, P., Olsen, J., and Willerslev, E.: A 10,000-year record of Arctic Ocean Sea-ice variability – View from the beach, Science, 333, 747–750, https://doi.org/10.1126/science.1202760, 2011.
Fürst, J. J., Goelzer, H., and Huybrechts, P.: Ice-dynamic projections of the Greenland ice sheet in response to atmospheric and oceanic warming, The Cryosphere, 9, 1039–1062, https://doi.org/10.5194/tc-9-1039-2015, 2015.
Gajewski, K.: Impact of Holocene climate variability on Arctic vegetation, Global Planet. Change, 133, 272–287, https://doi.org/10.1016/j.gloplacha.2015.09.006, 2015.
Georgiadis, E., Giraudeau, J., Jennings, A., Limoges, A., Jackson, R., Ribeiro, S., and Massé, G.: Local and regional controls on Holocene sea ice dynamics and oceanography in Nares Strait, Northwest Greenland, Mar. Geol., 422, 106115, https://doi.org/10.1016/j.margeo.2020.106115, 2020.
Hansen, K. E., Giraudeau, J., Wacker, L., Pearce, C., and Seidenkrantz, M.-S.: Reconstruction of Holocene oceanographic conditions in eastern Baffin Bay, Clim. Past, 16, 1075–1095, https://doi.org/10.5194/cp-16-1075-2020, 2020.
Harrison, J. C., St-Onge, M. R., Petrov, O. V, Strelnikov, S. I., Lopatin, B. G., Wilson, F. H., Tella, S., Paul, D., Lynds, T., Shokalsky, S. P., Hults, C. K., Bergman, S., Jepsen, H. F., and Solli, A.: Geological map of the Arctic, Geol. Surv. Canada Open File 5816, 11, 743, https://doi.org/10.4095/287868, 2011.
Detlef, H., Reilly, B. T., Jennings, A. E., Mørk Jensen, M., O’Regan, M., Glasius, M., Olsen, J., Jakobsson, M., and Pearce, C.: Sea-ice biomarkers, benthic and planktonic foraminiferal abundance, and total organic carbon in Holocene sediments from outer Petermann Fjord, PANGAEA [data set], https://doi.org/10.1594/PANGAEA.929918, 2021.
Heuzé, C., Wåhlin, A., Johnson, H. L., and Münchow, A.: Pathways of Meltwater Export from Petermann Glacier, Greenland, J. Phys. Oceanogr., 47, 405–418, https://doi.org/10.1175/jpo-d-16-0161.1, 2017.
Hill, E. A., Carr, J. R., and Stokes, C. R.: A Review of Recent Changes in Major Marine-Terminating Outlet Glaciers in Northern Greenland, Front. Earth Sci., 4, 111, https://doi.org/10.3389/feart.2016.00111, 2017.
Hörner, T., Stein, R., Fahl, K., and Birgel, D.: Post-glacial variability of sea ice cover, river run-off and biological production in the western Laptev Sea (Arctic Ocean) – A high-resolution biomarker study, Quaternary Sci. Rev., 143, 133–149, https://doi.org/10.1016/J.QUASCIREV.2016.04.011, 2016.
Jackson, R., Kvorning, A. B., Limoges, A., Georgiadis, E., Olsen, S. M., Tallberg, P., Andersen, T. J., Mikkelsen, N., Giraudeau, J., Massé, G., Wacker, L., and Ribeiro, S.: Holocene polynya dynamics and their interaction with oceanic heat transport in northernmost Baffin Bay, Sci. Rep.-UK, 11, 10095, https://doi.org/10.1038/s41598-021-88517-9, 2021.
Jakobsson, M., Hogan, K. A., Mayer, L. A., Mix, A., Jennings, A., Stoner, J., Eriksson, B., Jerram, K., Mohammad, R., Pearce, C., Reilly, B., and Stranne, C.: The Holocene retreat dynamics and stability of Petermann Glacier in northwest Greenland, Nat. Commun., 9, 2104, https://doi.org/10.1038/s41467-018-04573-2, 2018.
Jennings, A., Andrews, J., and Wilson, L.: Holocene environmental evolution of the SE Greenland Shelf North and South of the Denmark Strait: Irminger and East Greenland current interactions, Quaternary Sci. Rev., 30, 980–998, https://doi.org/10.1016/j.quascirev.2011.01.016, 2011a.
Jennings, A., Sheldon, C., Cronin, T., Francus, P., Stoner, J., and Andrews, J.: The Holocene History of Nares Strait: Transition from Glacial Bay to Arctic-Atlantic Throughflow, Oceanography, 24, 26–41, https://doi.org/10.5670/oceanog.2011.52, 2011b.
Jennings, A., Andrews, J., Reilly, B., Walczak, M., Jakobsson, M., Mix, A., Stoner, J., Nicholls, K. W., and Cheseby, M.: Modern foraminiferal assemblages in northern Nares Strait, Petermann Fjord, and beneath Petermann ice tongue, NW Greenland, Arctic, Antarct. Alp. Res., 52, 491–511, https://doi.org/10.1080/15230430.2020.1806986, 2020.
Johannessen, O. M., Babiker, M., and Miles, M. W.: Unprecedented Retreat in a 50-Year Observational Record for Petermann Glacier, North Greenland, Atmos. Ocean. Sci. Lett., 6, 259–265, https://doi.org/10.3878/j.issn.1674-2834.13.0021, 2013.
Johnson, H. L., Münchow, A., Falkner, K. K., and Melling, H.: Ocean circulation and properties in Petermann Fjord, Greenland, J. Geophys. Res., 116, C01003, https://doi.org/10.1029/2010JC006519, 2011.
Jones, P. E. and Eert, J. A.: Waters of Nares Strait in 2001, Polarforschung, 74, 185–189, 2004.
Kaufman, D., Ager, T., Anderson, N., Anderson, P., Andrews, J., Bartlein, P., Brubaker, L., Coats, L., Cwynar, L., Duvall, M., Dyke, A., Edwards, M., Eisner, W., Gajewski, K., Geirsdóttir, A., Hu, F., Jennings, A., Kaplan, M., Kerwin, M., Lozhkin, A., MacDonald, G., Miller, G., Mock, C., Oswald, W., Otto-Bliesner, B., Porinchu, D., Rühland, K., Smol, J., Steig, E., and Wolfe, B.: Holocene thermal maximum in the western Arctic (0–180∘ W), Quaternary Sci. Rev., 23, 529–560, https://doi.org/10.1016/J.QUASCIREV.2003.09.007, 2004.
Knudsen, K. L., Stabell, B., Seidenkrantz, M.-S., Eiriksson, J., and Blake, W.: Deglacial and Holocene conditions in northernmost Baffin Bay: sediments, foraminifera, diatoms and stable isotopes, Boreas, 37, 346–376, https://doi.org/10.1111/j.1502-3885.2008.00035.x, 2008.
Kwok, R.: Variability of Nares Strait ice flux, Geophys. Res. Lett., 32, L24502, https://doi.org/10.1029/2005GL024768, 2005.
Kwok, R., Toudal Pedersen, L., Gudmandsen, P., and Pang, S. S.: Large sea ice outflow into the Nares Strait in 2007, Geophys. Res. Lett., 37, L03502, https://doi.org/10.1029/2009GL041872, 2010.
Lasher, G. E., Axford, Y., McFarlin, J. M., Kelly, M. A., Osterberg, E. C., and Berkelhammer, M. B.: Holocene temperatures and isotopes of precipitation in Northwest Greenland recorded in lacustrine organic materials, Quaternary Sci. Rev., 170, 45–55, https://doi.org/10.1016/j.quascirev.2017.06.016, 2017.
Lecavalier, B. S., Fisher, D. A., Milne, G. A., Vinther, B. M., Tarasov, L., Huybrechts, P., Lacelle, D., Main, B., Zheng, J., Bourgeois, J., and Dyke, A. S.: High Arctic Holocene temperature record from the Agassiz ice cap and Greenland ice sheet evolution, P. Natl. Acad. Sci. USA, 114, 5952–5957, https://doi.org/10.1073/pnas.1616287114, 2017.
Ledu, D., Rochon, A., de Vernal, A., and St-Onge, G.: Holocene paleoceanography of the northwest passage, Canadian Arctic Archipelago, Quaternary Sci. Rev., 29, 3468–3488, https://doi.org/10.1016/J.QUASCIREV.2010.06.018, 2010.
Leu, E., Mundy, C. J., Assmy, P., Campbell, K., Gabrielsen, T. M., Gosselin, M., Juul-Pedersen, T., and Gradinger, R.: Arctic spring awakening – Steering principles behind the phenology of vernal ice algal blooms, Prog. Oceanogr., 139, 151–170, https://doi.org/10.1016/j.pocean.2015.07.012, 2015.
Limoges, A., Weckström, K., Ribeiro, S., Georgiadis, E., Hansen, K. E., Martinez, P., Seidenkrantz, M., Giraudeau, J., Crosta, X., and Massé, G.: Learning from the past: impact of the Arctic Oscillation on sea ice and marine productivity off northwest Greenland over the last 9000 years, Glob. Change Biol., 26, 6767–6786, https://doi.org/10.1111/gcb.15334, 2020.
Lougheed, B. C. and Obrochta, S. P.: MatCal: Open Source Bayesian 14C Age Calibration in Matlab, J. Open Res. Softw., 4, p.e42, https://doi.org/10.5334/jors.130, 2016.
Marcott, S. A., Shakun, J. D., Clark, P. U., and Mix, A. C.: A reconstruction of regional and global temperature for the past 11,300 years, Science, 339, 1198–1201, https://doi.org/10.1126/science.1228026, 2013.
Matsuo, A. and Sato, A.: Sterols of mosses, Phytochemistry, 30, 2305–2306, https://doi.org/10.1016/0031-9422(91)83635-X, 1991.
Mayot, N., Matrai, P. A., Arjona, A., Bélanger, S., Marchese, C., Jaegler, T., Ardyna, M., and Steele, M.: Springtime Export of Arctic Sea Ice Influences Phytoplankton Production in the Greenland Sea, J. Geophys. Res.-Ocean., 125, e2019JC015799, https://doi.org/10.1029/2019JC015799, 2020.
Melling, H., Gratton, Y., and Ingram, G.: Ocean circulation within the North Water polynya of Baffin Bay, Atmos.-Ocean, 39, 301–325, https://doi.org/10.1080/07055900.2001.9649683, 2001.
Meyers, P. A. and Ishiwatari, R.: Lacustrine organic geochemistry-an overview of indicators of organic matter sources and diagenesis in lake sediments, Org. Geochem., 20, 867–900, https://doi.org/10.1016/0146-6380(93)90100-P, 1993.
Mode, W. N.: The Terrestrial Record of Postglacial Vegetation and Climate from the Arctic/Subarctic of Eastern Canada and West Greenland, Geosci. Canada, 23, 213–216, 1996.
Möller, P., Larsen, N. K., Kjær, K. H., Funder, S., Schomacker, A., Linge, H., and Fabel, D.: Early to middle Holocene valley glaciations on northernmost Greenland, Quaternary Sci. Rev., 29, 3379–3398, https://doi.org/10.1016/j.quascirev.2010.06.044, 2010.
Moore, G. W. K., Howell, S. E. L., Brady, M., Xu, X., and McNeil, K.: Anomalous collapses of Nares Strait ice arches leads to enhanced export of Arctic sea ice, Nat. Commun., 12, 1–8, https://doi.org/10.1038/s41467-020-20314-w, 2021.
Münchow, A.: Volume and Freshwater Flux Observations from Nares Strait to the West of Greenland at Daily Time Scales from 2003 to 2009, J. Phys. Oceanogr., 46, 141–157, https://doi.org/10.1175/JPO-D-15-0093.1, 2016.
Münchow, A. and Melling, H.: Ocean current observations from Nares Strait to the west of Greenland: Interannual to tidal variability and forcing, J. Mar. Res., 66, 801–833, https://doi.org/10.1357/002224008788064612, 2008.
Münchow, A., Falkner, K. K., and Melling, H.: Spatial continuity of measured seawater and tracer fluxes through Nares Strait, a dynamically wide channel bordering the Canadian Archipelago, J. Mar. Res., 65, 759–788, https://doi.org/10.1357/002224007784219048, 2007.
Münchow, A., Falkner, K., Melling, H., Rabe, B., and Johnson, H.: Ocean Warming of Nares Strait Bottom Waters off Northwest Greenland, 2003–2009, Oceanography, 24, 114–123, https://doi.org/10.5670/oceanog.2011.62, 2011.
Münchow, A., Padman, L., and Fricker, H. A.: Interannual changes of the floating ice shelf of Petermann Gletscher, North Greenland, from 2000 to 2012, J. Glaciol., 60, 489–499, https://doi.org/10.3189/2014JoG13J135, 2014.
Nagler, T., Rott, H., Hetzenecker, M., Wuite, J., and Potin, P.: The Sentinel-1 Mission: New Opportunities for Ice Sheet Observations, Remote Sens., 7, 9371–9389, https://doi.org/10.3390/rs70709371, 2015.
Navarro-Rodriguez, A., Belt, S. T., Knies, J., and Brown, T. A.: Mapping recent sea ice conditions in the Barents Sea using the proxy biomarker IP25: implications for palaeo sea ice reconstructions, Quaternary Sci. Rev., 79, 26–39, https://doi.org/10.1016/J.QUASCIREV.2012.11.025, 2013.
Pados, T. and Spielhagen, R. F.: Species distribution and depth habitat of recent planktic foraminifera in Fram Strait, Arctic Ocean, Polar Res., 33, 22483, https://doi.org/10.3402/polar.v33.22483, 2014.
Parnell, J., Bowden, S., Andrews, J. T., and Taylor, C.: Biomarker determination as a provenance tool for detrital carbonate events (Heinrich events?): Fingerprinting Quaternary glacial sources into Baffin Bay, Earth Planet. Sc. Lett., 257, 71–82, https://doi.org/10.1016/j.epsl.2007.02.021, 2007.
Rabe, B., Münchow, A., Johnson, H. L., and Melling, H.: Nares Strait hydrography and salinity field from a 3-year moored array, J. Geophys. Res., 115, C07010, https://doi.org/10.1029/2009JC005966, 2010.
Rabe, B., Johnson, H. L., Münchow, A., and Melling, H.: Geostrophic ocean currents and freshwater fluxes across the Canadian polar shelf via Nares Strait, J. Mar. Res., 70, 603–640, https://doi.org/10.1357/002224012805262725, 2012.
Rasmussen, T. A. S., Kliem, N., and Kaas, E.: Modelling the sea ice in the Nares Strait, Ocean Model., 35, 161–172, https://doi.org/10.1016/j.ocemod.2010.07.003, 2010.
Reilly, B. T., Stoner, J. S., Mix, A. C., Walczak, M. H., Jennings, A., Jakobsson, M., Dyke, L., Glueder, A., Nicholls, K., Hogan, K. A., Mayer, L. A., Hatfield, R. G., Albert, S., Marcott, S., Fallon, S., and Cheseby, M.: Holocene break-up and reestablishment of the Petermann Ice Tongue, Northwest Greenland, Quaternary Sci. Rev., 218, 322–342, https://doi.org/10.1016/j.quascirev.2019.06.023, 2019.
Reimer, P. J., Bard, E., Bayliss, A., Beck, J. W., Blackwell, P. G., Ramsey, C. B., Buck, C. E., Cheng, H., Edwards, R. L., Friedrich, M., Grootes, P. M., Guilderson, T. P., Haflidason, H., Hajdas, I., Hatté, C., Heaton, T. J., Hoffmann, D. L., Hogg, A. G., Hughen, K. A., Kaiser, K. F., Kromer, B., Manning, S. W., Niu, M., Reimer, R. W., Richards, D. A., Scott, E. M., Southon, J. R., Staff, R. A., Turney, C. S. M., and van der Plicht, J.: IntCal13 and Marine13 Radiocarbon Age Calibration Curves 0–50,000 Years cal BP, Radiocarbon, 55, 1869–1887, https://doi.org/10.2458/azu_js_rc.55.16947, 2013.
Ribeiro, S., Sejr, M. K., Limoges, A., Heikkilä, M., Andersen, T. J., Tallberg, P., Weckström, K., Husum, K., Forwick, M., Dalsgaard, T., Massé, G., Seidenkrantz, M.-S., and Rysgaard, S.: Sea ice and primary production proxies in surface sediments from a High Arctic Greenland fjord: Spatial distribution and implications for palaeoenvironmental studies, Ambio, 46, 106–118, https://doi.org/10.1007/s13280-016-0894-2, 2017.
Ribeiro, S., Limoges, A., Massé, G., Johansen, K. L., Colgan, W., Weckström, K., Jackson, R., Georgiadis, E., Mikkelsen, N., Kuijpers, A., Olsen, J., Olsen, S. M., Nissen, M., Andersen, T. J., Strunk, A., Wetterich, S., Syväranta, J., Henderson, A. C. G., Mackay, H., Taipale, S., Jeppesen, E., Larsen, N. K., Crosta, X., Giraudeau, J., Wengrat, S., Nuttall, M., Grønnow, B., Mosbech, A., and Davidson, T. A.: Vulnerability of the North Water ecosystem to climate change, Nat. Commun., 12, 4475, https://doi.org/10.1038/s41467-021-24742-0, 2021.
Rignot, E. and Kanagaratnam, P.: Changes in the Velocity Structure of the Greenland Ice Sheet, Science, 311, 986–990, https://doi.org/10.1126/science.1121381, 2006.
Rignot, E. and Steffen, K.: Channelized bottom melting and stability of floating ice shelves, Geophys. Res. Lett., 35, L02503, https://doi.org/10.1029/2007GL031765, 2008.
Robel, A. A.: Thinning sea ice weakens buttressing force of iceberg mélange and promotes calving, Nat. Commun., 8, 14596, https://doi.org/10.1038/ncomms14596, 2017.
Rontani, J. F., Charrière, B., Sempéré, R., Doxaran, D., Vaultier, F., Vonk, J. E., and Volkman, J. K.: Degradation of sterols and terrigenous organic matter in waters of the Mackenzie Shelf, Canadian Arctic, Org. Geochem., 75, 61–73, https://doi.org/10.1016/j.orggeochem.2014.06.002, 2014.
Rückamp, M., Neckel, N., Berger, S., Humbert, A., and Helm, V.: Calving Induced Speedup of Petermann Glacier, J. Geophys. Res.-Earth, 124, 216–228, https://doi.org/10.1029/2018JF004775, 2019.
Ruttenberg, K. C. and Goñi, M. A.: Phosphorus distribution, C:N:P ratios, and δ13C(OC) in arctic, temperate, and tropical coastal sediments: Tools for characterizing bulk sedimentary organic matter, Mar. Geol., 139, 123–145, https://doi.org/10.1016/S0025-3227(96)00107-7, 1997.
Ryan, P. A. and Münchow, A.: Sea ice draft observations in Nares Strait from 2003 to 2012, J. Geophys. Res.-Ocean., 122, 3057–3080, https://doi.org/10.1002/2016JC011966, 2017.
Safe, S., Safe, L. M., and Maass, W. S. G.: Sterols of three lichen species: Lobaria pulmonaria, Lobaria Scrobiculata and Usnea Longissima, Phytochemistry, 14, 1821–1823, https://doi.org/10.1016/0031-9422(75)85302-7, 1975.
Samelson, R. M., Agnew, T., Melling, H., and Münchow, A.: Evidence for atmospheric control of sea-ice motion through Nares Strait, Geophys. Res. Lett., 33, L02506, https://doi.org/10.1029/2005GL025016, 2006.
Seidenkrantz, M. S.: Benthic foraminifera as palaeo sea-ice indicators in the subarctic realm – examples from the Labrador Sea-Baffin Bay region, Quaternary Sci. Rev., 79, 135–144, https://doi.org/10.1016/j.quascirev.2013.03.014, 2013.
Shepherd, A., Ivins, E. R., Geruo, A., Barletta, V. R., Bentley, M. J., Bettadpur, S., Briggs, K. H., Bromwich, D. H., Forsberg, R., Galin, N., Horwath, M., Jacobs, S., Joughin, I., King, M. A., Lenaerts, J. T. M., Li, J., Ligtenberg, S. R. M., Luckman, A., Luthcke, S. B., McMillan, M., Meister, R., Milne, G., Mouginot, J., Muir, A., Nicolas, J. P., Paden, J., Payne, A. J., Pritchard, H., Rignot, E., Rott, H., Sørensen, L. S., Scambos, T. A., Scheuchl, B., Schrama, E. J. O., Smith, B., Sundal, A. V., Van Angelen, J. H., Van De Berg, W. J., Van Den Broeke, M. R., Vaughan, D. G., Velicogna, I., Wahr, J., Whitehouse, P. L., Wingham, D. J., Yi, D., Young, D., and Zwally, H. J.: A reconciled estimate of ice-sheet mass balance, Science, 338, 1183–1189, https://doi.org/10.1126/science.1228102, 2012.
Shroyer, E. L., Samelson, R. M., Padman, L., and Münchow, A.: Modeled ocean circulation in Nares Strait and its dependence on landfast-ice cover, J. Geophys. Res.-Ocean., 120, 7934–7959, https://doi.org/10.1002/2015JC011091, 2015.
Shroyer, E. L., Padman, L., Samelson, R. M., Münchow, A., and Stearns, L. A.: Seasonal control of Petermann Gletscher ice-shelf melt by the ocean's response to sea-ice cover in Nares Strait, J. Glaciol., 63, 324–330, https://doi.org/10.1017/jog.2016.140, 2017.
Smik, L., Cabedo-Sanz, P., and Belt, S. T.: Semi-quantitative estimates of paleo Arctic sea ice concentration based on source-specific highly branched isoprenoid alkenes: A further development of the PIP25 index, Org. Geochem., 92, 63–69, https://doi.org/10.1016/J.ORGGEOCHEM.2015.12.007, 2016.
Stein, R., Fahl, K., Schade, I., Manerung, A., Wassmuth, S., Niessen, F., and Nam, S.-I.: Holocene variability in sea ice cover, primary production, and Pacific-Water inflow and climate change in the Chukchi and East Siberian Seas (Arctic Ocean), J. Quaternary Sci., 32, 362–379, https://doi.org/10.1002/jqs.2929, 2017.
Stocker, T. F., Qin, D., Plattner, G.-K., Tignor, M. M. B., Allen, S. K., Boschung, J., Nauels, A., Xia, Y., Bex, V., and Midgley, P. M.: Climate Change 2013 The Physical Science Basis Working Group I Contribution to the Fifth Assessment Report of the Intergovernmental Panel on Climate Change, available at: https://www.cambridge.org/ (last access: 1 May 2020), 2013.
Tinto, K. J., Bell, R. E., Cochran, J. R., and Münchow, A.: Bathymetry in Petermann fjord from Operation IceBridge aerogravity, Earth Planet. Sc. Lett., 422, 58–66, https://doi.org/10.1016/j.epsl.2015.04.009, 2015.
Todd, J. and Christoffersen, P.: Are seasonal calving dynamics forced by buttressing from ice mélange or undercutting by melting? Outcomes from full-Stokes simulations of Store Glacier, West Greenland, The Cryosphere, 8, 2353–2365, https://doi.org/10.5194/tc-8-2353-2014, 2014.
Vare, L. L., Massé, G., Gregory, T. R., Smart, C. W., and Belt, S. T.: Sea ice variations in the central Canadian Arctic Archipelago during the Holocene, Quaternary Sci. Rev., 28, 1354–1366, https://doi.org/10.1016/j.quascirev.2009.01.013, 2009.
Vincent, R. F.: A Study of the North Water Polynya Ice Arch using Four Decades of Satellite Data, Sci. Rep.-UK, 9, 1–12, https://doi.org/10.1038/s41598-019-56780-6, 2019.
Volkman, J. K.: A review of sterol markers for marine and terrigenous organic matter, Org. Geochem., 9, 83–99, https://doi.org/10.1016/0146-6380(86)90089-6, 1986.
Volkman, J. K.: Sterols in microorganisms, Appl. Microbiol Biot., 60, 495–506, https://doi.org/10.1007/s00253-002-1172-8, 2003.
Volkman, J. K., Barrett, S. M., Dunstan, G. A., and Jeffrey, S. W.: Geochemical significance of the occurrence of dinosterol and other 4-methyl sterols in a marine diatom, Org. Geochem., 20, 7–15, https://doi.org/10.1016/0146-6380(93)90076-N, 1993.
Volkman, J. K., Rohjans, D., Rullkötter, J., Scholz-Böttcher, B. M., and Liebezeit, G.: Sources and diagenesis of organic matter in tidal flat sediments from the German Wadden Sea, Cont. Shelf Res., 20, 1139–1158, https://doi.org/10.1016/S0278-4343(00)00016-9, 2000.
Washam, P., Münchow, A., and Nicholls, K. W.: A Decade of Ocean Changes Impacting the Ice Shelf of Petermann Gletscher, Greenland, J. Phys. Oceanogr., 48, 2477–2493, https://doi.org/10.1175/JPO-D-17-0181.1, 2018.
Washam, P., Nicholls, K. W., Münchow, A., and Padman, L.: Summer surface melt thins Petermann Gletscher Ice Shelf by enhancing channelized basal melt, J. Glaciol., 65, 662–674, https://doi.org/10.1017/jog.2019.43, 2019.
Wassmann, P. and Reigstad, M.: Future Arctic Ocean seasonal ice zones and implications for pelagic-benthic coupling, Oceanography, 24, 220–231, https://doi.org/10.5670/oceanog.2011.74, 2011.
Xiao, X., Fahl, K., and Stein, R.: Biomarker distributions in surface sediments from the Kara and Laptev seas (Arctic Ocean): indicators for organic-carbon sources and sea-ice coverage, Quaternary Sci. Rev., 79, 40–52, https://doi.org/10.1016/J.QUASCIREV.2012.11.028, 2013.
Xiao, X., Fahl, K., Müller, J., and Stein, R.: Sea-ice distribution in the modern Arctic Ocean: Biomarker records from trans-Arctic Ocean surface sediments, Geochim. Cosmochim. Ac., 155, 16–29, https://doi.org/10.1016/J.GCA.2015.01.029, 2015.
Yunker, M. B., Macdonald, R. W., Veltkamp, D. J., and Cretney, W. J.: Terrestrial and marine biomarkers in a seasonally ice-covered Arctic estuary – integration of multivariate and biomarker approaches, Mar. Chem., 49, 1–50, https://doi.org/10.1016/0304-4203(94)00057-K, 1995.