the Creative Commons Attribution 4.0 License.
the Creative Commons Attribution 4.0 License.
 | 21 Nov 2023
Implementation and assessment of a model including mixotrophs and the carbonate cycle (Eco3M_MIX-CarbOx v1.0) in a highly dynamic Mediterranean coastal environment (Bay of Marseille, France) – Part 1: Evolution of ecosystem composition under limited light and nutrient conditions
Lucille Barré
Frédéric Diaz
Thibaut Wagener
France Van Wambeke
Camille Mazoyer
Christophe Yohia
Christel Pinazo
Many current biogeochemical models rely on an autotrophic versus heterotrophic food web representation. However, in recent years, an increasing number of studies have begun to challenge this approach. Several authors have highlighted the importance of protists capable of combining photoautotrophic and heterotrophic nutrition in a single cell. These mixotrophic protists are known to play an important role in the carbon cycle. Here, we present a new biogeochemical model that represents the food web using variable stoichiometry. It contains the classic compartments such as zooplankton, phytoplankton, and heterotrophic bacteria and a newly added compartment to represent two types of mixotrophic protists: non-constitutive mixotrophs (NCMs) and constitutive mixotrophs (CMs). We demonstrate that the model correctly reproduces the characteristics of NCMs and CMs and proceed to study the impact of light and nutrient limitation on planktonic ecosystem structure in a highly dynamic Mediterranean coastal area, namely the Bay of Marseille (BoM, France), paying special attention to the dynamics of mixotrophic protists in these limiting conditions. In addition, we investigate the carbon, nitrogen, and phosphorus fluxes associated with mixotrophic protists and showed the following: (i) the portion of the ecosystem in terms of the percentage of carbon biomass occupied by NCMs decreases when resources (nutrient and prey concentrations) decrease, although their mixotrophy allows them to maintain a carbon biomass almost as significant as the copepod one (129.8 and 148.7 mmol C m−3, respectively), as photosynthesis increases as a food source, and (ii) the portion of the ecosystem in terms of the percentage of carbon biomass occupied by CM increases when nutrient concentrations decrease due to their capability to ingest prey to supplement their N and P needs. In addition to providing new insights regarding the conditions that lead to the emergence of mixotrophs in the BoM, this work provides a new tool to perform long-term studies and predictions of mixotroph dynamics in coastal environments under different environmental forcings.
- Article
(2222 KB) - Full-text XML
-
Supplement
(937 KB) - BibTeX
- EndNote


Marine protists play a crucial role in biogeochemical cycles and food webs (Sherr et al., 2007) and are typically classified as either photoautotrophs, capable of (strict innate) photosynthesis for nutrition, or phago-heterotrophs which rely on (strict) phagocytose for nutrition. However, several studies have shown that this classification may be overly simplistic as various micro-organisms can be both autotrophic and heterotrophic, either simultaneously or alternately, depending on environmental conditions (Pratt and Cairns, 1985; Dolan, 1992, Stoecker, 1998).
This combination of photo-autotrophy and phago-heterotrophy among protists is one example of mixotrophy, which has been observed in most planktonic functional groups except diatoms (Flynn et al., 2012). Generally, mixotrophic protists are divided into two major subsets depending on the type of photosynthesis, namely into constitutive mixotrophs (CMs, innate photosynthesis) and non-constitutive mixotrophs (NCMs, acquired photosynthesis). CMs are photo-autotrophs capable of ingesting prey using phagocytose when environmental conditions are not favorable (e.g., when nutrients limit growth). This subset includes nanoflagellates and dinoflagellates such as Prymnesium parvum and Prorocentrum minimum, respectively (Stoecker, 1998; Stoecker et al., 2017). NCMs are phago-heterotrophs capable of photosynthesis to complement carbon uptake. NCMs temporarily acquire photosynthetic abilities either by ingesting photosynthetic prey and sequestering their chloroplasts (kleptoplastidy) or by maintaining algal endosymbionts. NCMs include ciliates and rhizaria such as Laboea strobila, Strombidium capitatum, and Collozoum spp. (Stoecker, 1998; Mitra et al., 2016).
Mixotrophic protists play an important role in the marine carbon cycle. Due to their adaptability, these organisms are crucial for the transfer of matter and energy to the highest trophic levels, thus impacting the structure of planktonic communities by favoring the development of larger organisms (Ptacnik et al., 2004). Moreover, by switching the biomass maximum to larger organisms, carbon export increases in the presence of mixotrophs. For instance, Ward and Follows (2016) compared the results from two food web models – only one accounted for mixotrophy – and showed that carbon export to depth increased by nearly 35 % when mixotrophic protists were considered. By showing the significant effect of mixotrophic protists on the food web, these studies motivated their addition to current food web models (Jost et al., 2004; Mitra and Flynn, 2010).
In addition, mixotrophic protists are ubiquitous and can be found in various types of environments (Flynn et al., 2012; Hartmann et al., 2012; Stoecker et al., 2017). Some studies investigated mixotrophy in nutrient-rich systems (eutrophized coastal or estuarine systems) in the context of harmful algal blooms (HABs; Burkholder et al., 2008; Glibert et al., 2018). Typically, mixotrophy is studied in oligotrophic systems (Zubkov and Tarran, 2008; Hartmann et al., 2012), including the Mediterranean Sea. It was shown that the Mediterranean Sea is highly oligotrophic, especially in its eastern basin (Yacobi et al., 1995). Accordingly, some studies which aimed to investigate mixotrophy in protists have been conducted in the Mediterranean Sea. Several authors observed mixotrophic protists in both the eastern and western basins, described their distribution (Pitta and Giannakourou, 2000; Bernard and Rassoulzadegan, 1994), and quantified their effect on the ecosystem (Christaki et al., 1999; Dolan and Perez, 2000). However, few studies considered the effects of variable environmental parameters (i.e., temperature, salinity, pH, light, and nutrients) on the spatial and temporal structuring of mixotrophic protists in the Mediterranean Sea.
Here we used a newly developed biogeochemical model (Eco3M_MIX-CarbOx, v1.0) to study the impact of light and nutrient limitations on the planktonic ecosystem structure in a Mediterranean coastal area, the Bay of Marseille (BoM), where we simulated a small volume of surface water (1 m3). Eco3M_MIX-CarbOx contains a newly developed planktonic ecosystem model in which we consider mixotrophy. The mixotrophic compartment allow us to represent two types of mixotrophic protists: CMs and NCMs. We assessed it based on Stoecker's (1998) conceptual models of mixotrophy. Eco3m_MIX-CarbOx uses variable cellular quotas which allowed us to determine the nutritional state of the cell by comparing it to a reference quota. We conducted three specific case studies: (i) phytoplankton composition under typical forcings (light and nutrient concentrations as observed in the BoM) and specific events which all affect nutrient concentrations (Rhône River intrusions, water discharges from a local wastewater treatment plant, and winter mixing); (ii) planktonic ecosystem composition under low light or nutrient conditions, paying special attention to the dynamics of mixotrophic protists; and (iii) a comparison of mixotrophic protists' C, N, and P fluxes under limiting and non-limiting nutrient conditions.
Eco3M_MIX-CarbOx contains both a mixotrophy compartment and a representation of the carbonate system. The model description is split into two parts: (i) a description of how the organisms and their dynamics are represented in the model, with a particular focus on mixotrophic organisms, and (ii) a more detailed description of the carbonate module and the associated dynamics. While (i) is presented here, (ii) has been presented in a companion paper (Barré et al., 2023b).
2.1 Study area
The BoM is located in the northwestern (NW) Mediterranean Sea, in the eastern part of the Gulf of Lion near Marseille (Fig. 1). Due to this proximity to urbanized areas (e.g., Fos-sur-Mer and Berre Lagoon to the west, Fig. 1), it receives significant quantities of anthropogenic nutrients (especially ammonium and phosphate), chemical products, and organic matter from terrestrial and riverine sources and through atmospheric deposition (Djaoudi et al., 2018; Millet et al., 2018). Usually, significant inputs occur near the Calanque de Cortiou, where waste waters are discharged into the sea. During flood events, riverine and terrestrial runoff lead to significant inputs (Oursel et al., 2014). The biogeochemistry of the bay is also affected by its proximity to the Rhône River delta, located 35 km to the west, as the Rhône River plume can be pushed eastwards under specific wind conditions, which increases local productivity (Gatti et al., 2006; Fraysse et al., 2013, 2014). Other relevant processes that affect the biogeochemical functioning of the bay and add to its complex dynamics include strong mistral events (Yohia, 2017), upwelling events (Millot, 1990), eddies (Schaeffer et al., 2011), and intrusions of oligotrophic water masses via the Northern Current (Barrier et al., 2016; Ross et al., 2016).
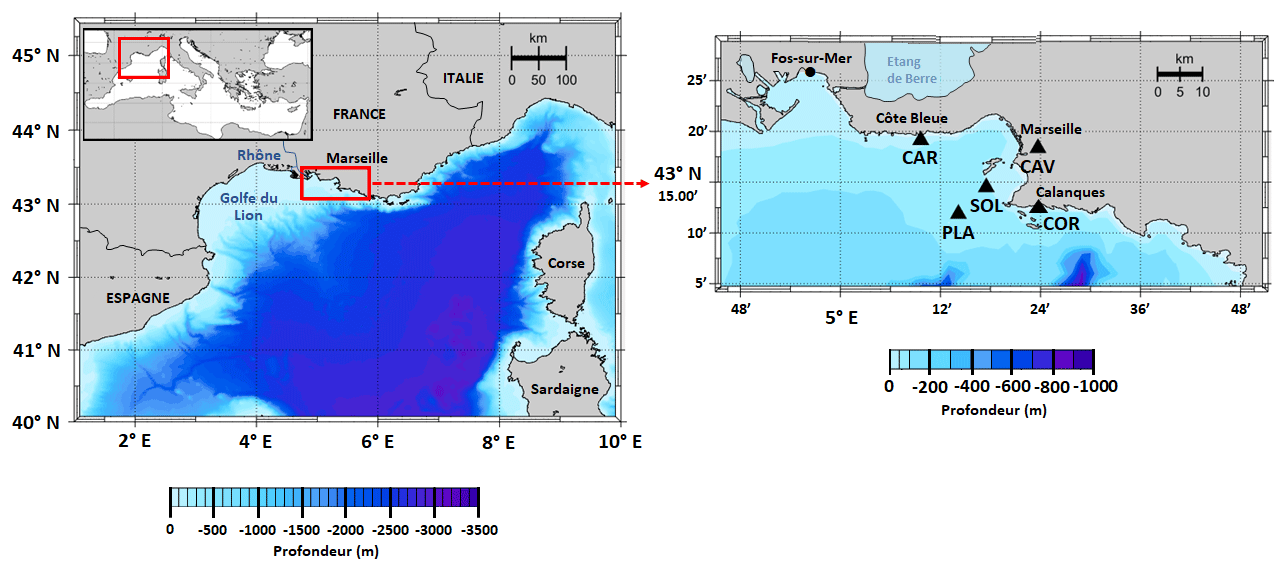
Figure 1Map of the study area showing the location of SOLEMIO station (SOL: 43∘14.30′ N, 5∘17.30′ E), Planier station (PLA: N, E), Carry buoy (CAR: N, E), Cinq Avenues station (CAV: N, E), and the Calanque de Cortiou (COR: N, E).
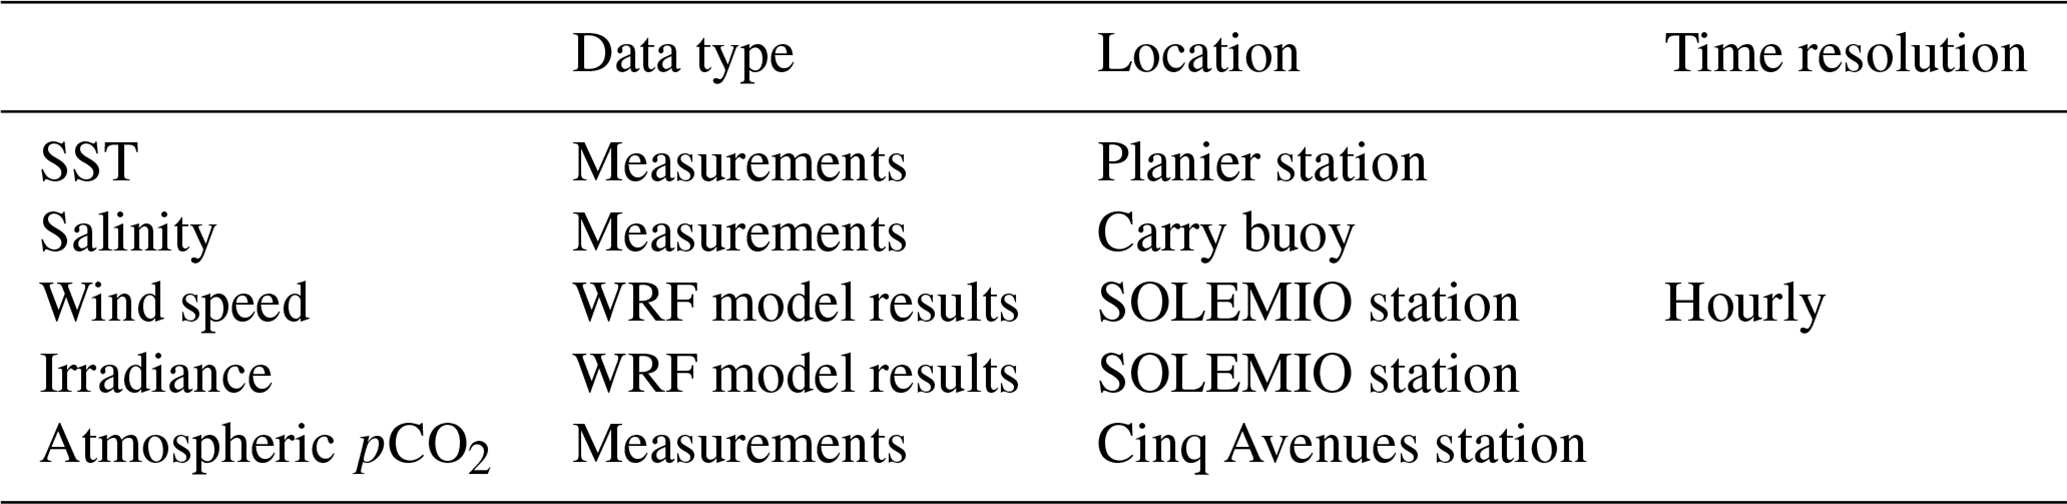
In our model, environmental forcings are provided by in situ measurements of sea surface temperature (SST), salinity, and atmospheric pCO2 in combination with simulation data of wind speed and solar irradiance (Table 1). SST data were collected at the Planier station (PLA, Fig. 1) by the regional temperature observation network T-MEDNet (https://www.t-mednet.org, last access: 14 February 2023). Salinity data are from the Carry buoy (CAR, Fig. 1) which forms part of the ROMARIN network (https://erddap.osupytheas.fr, last access: 14 February 2023). Atmospheric pCO2 is recorded at the terrestrial station of Cinq Avenues (CAV, Fig. 1) by the AtmoSud regional atmospheric survey network (https://www.atmosud.org, last access: 14 February 2023) and the AMC project (Aix-Marseille Carbon Pilot Study, https://www.otmed.fr/research-projects-and-results/result-2449, last access 14 February 2023). CAV station is located in the city of Marseille, and the recorded pCO2 values are representative of a highly urbanized environment, exhibiting strong maxima and large variations. Solar irradiance and wind speed were extracted from the Weather Research and Forecasting (WRF) meteorological model (Yohia, 2017) for SOLEMIO station (Fig. 1).
Table 1Data types and their sources used to drive the environmental forcing during the 2017 model run.
To evaluate our model results, we compared the modeled total chlorophyll concentration to in situ measurements by using a dataset from the Service d'Observation en Milieu LITtoral (SOMLIT, https://www.somlit.fr/, last access 14 February 2023) which includes fortnightly measurements of total surface chlorophyll concentrations at SOLEMIO station.
2.2 Model description
We used the Eco3M_MIX-CarbOx model (v1.0) to simulate the food web using variable stoichiometry to study the evolution of the BoM ecosystem composition under light- and nutrient-limited conditions. The Eco3M_MIX-CarbOx model is a dimensionless (0D) model: we consider a volume of 1 m3 of surface water at SOLEMIO station; at this volume, the state variables only vary over time as the model is not coupled with a hydrodynamic model. Eco3M_MIX-CarbOx was developed to represent the dynamics of both mixotrophic protists (henceforth referred to as mixotrophs) and the carbonate system in the BoM. To obtain the present version of the Eco3M_MIX-CarbOx model, we developed a planktonic ecosystem model which contains mixotrophs and added a modified version of the carbonate module from Lajaunie-Salla et al. (2021). The planktonic ecosystem model was developed using the Eco3M (Ecological Mechanistic and Molecular Modelling) platform (Baklouti et al., 2006a, b). The Eco3M platform allows the modeling of the first trophic levels by providing a process library used to build different model configurations. It was developed in Fortran 90/95, and we used an Euler method to solve the sink–source equation of each state variable. Based on the results of previous studies (Jost et al., 2004; Mitra et al., 2014; Ward and Follows, 2016), we decided to represent mixotrophy and the carbonate cycle in the same model, assuming that this would provide a more realistic representation of the carbonate cycle. In what follows, we provide a brief description of Eco3M_MIX-CarbOx, with a more detailed description of its mixotroph compartment. The carbonate system has been described in detail in a companion paper (Barré et al., 2023b).
Eco3M_MIX-CarbOx contains seven compartments, namely zooplankton, mixotrophs, phytoplankton, dissolved inorganic matter (DIM), labile dissolved organic matter (DOM), detrital particulate organic matter (POM), and heterotrophic bacteria, with a total of 37 variables (Fig. 2).
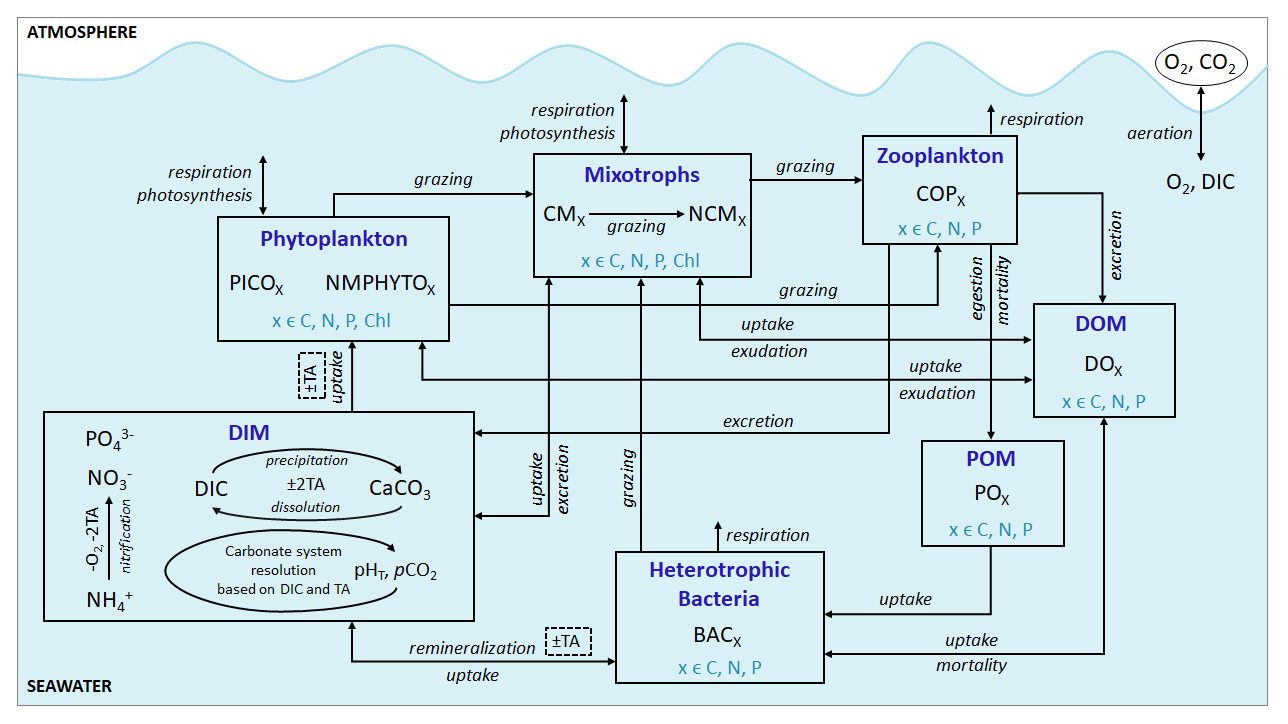
Figure 2Schematic representation of the Eco3M_MIX-CarbOx model. Each box represents a model compartment (DIM: dissolved inorganic matter, DOM: labile dissolved organic matter, POM: detrital particulate organic matter). State variables are indicated in black (COPs: copepods; PICO: picophytoplankton; NMPHYTO: nano- and micro-phytoplankton; O2: dissolved oxygen; CO2: dissolved carbon dioxide; DIC: dissolved inorganic carbon; TA: total alkalinity; pCO2: partial pressure of CO2; CaCO3: calcium carbonate). Elements for which a state variable is expressed with a variable stoichiometry are shown in blue (C: carbon; N: nitrogen; P: phosphorus; and Chl: chlorophyll). Arrows represent processes between two state variables.
2.2.1 Zooplankton
The zooplankton compartment represents copepod-type zooplankton (COPs, organisms larger than 200 µm, Fig. 3) whose biomass depends on prey ingestion, respiration, excretion, egestion (faecal pellets), and predation by higher trophic levels. Copepod prey ingestion is represented using the formulation by Auger et al. (2011). Copepods ingest smaller prey, and grazing rates depend on prey type preference, as well as on temperature and light due to their effect on prey abundance. Copepods feed with decreasing preference for NCMs, nano- and micro-phytoplankton (NMPHYTO), and CM (Verity and Paffenhofer, 1996) and release ammonium (), phosphate (), and dissolved organic carbon (DOC) through excretion, contributing to the POM compartment through egestion and mortality. Mortality due to predation by higher trophic levels represents a closure term (Fig. 2).
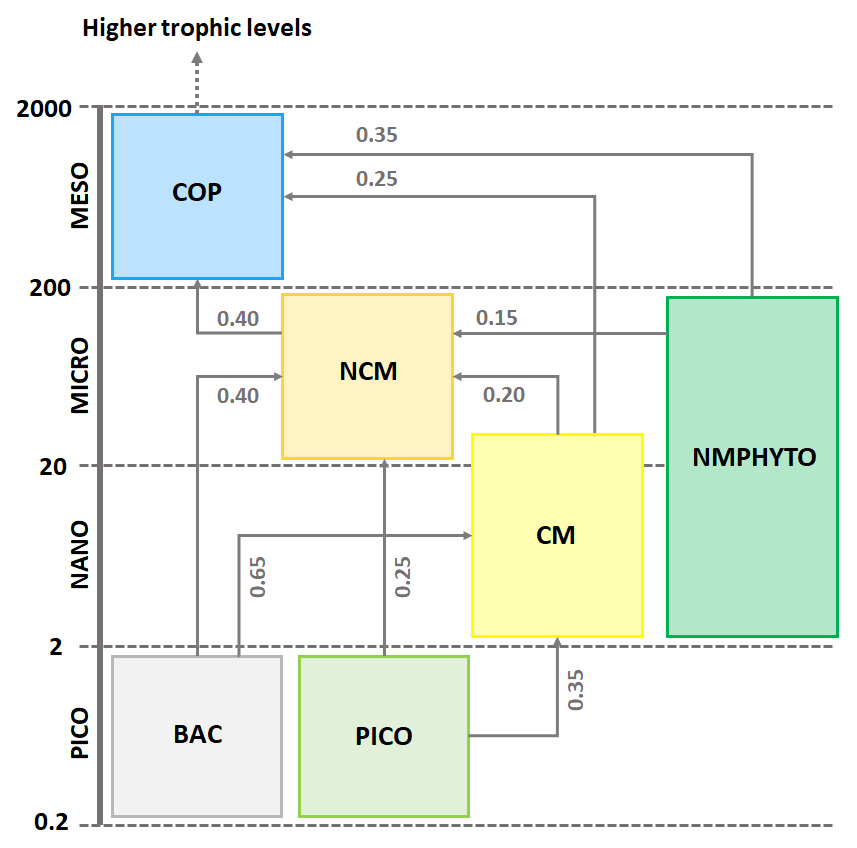
Figure 3Repartition of modeled organisms (COPs: copepods; PICO: picophytoplankton; NMPHYTO: nano- and micro-phytoplankton; and BAC: heterotrophic bacteria) in size classes and trophic interactions between them. Preference values are indicated in gray for copepods (Verity and Paffenhofer, 1996) and NCMs (Epstein, 1992; Price and Turner, 1992; Christaki et al., 2009) and CMs (Christaki et al., 2002; Zubkhov and Tarron, 2008; Millette et al., 2017; Livanou et al., 2019). Sizes are expressed in micrometers (µm).
2.2.2 Phytoplankton
We considered two types of phytoplankton based on size (Fig. 3): picophytoplankton (PICO) and nano- and micro-phytoplankton (NMPHYTO). PICO includes autotrophic prokaryotic organisms such as Prochlorococcus spp. and Synechococcus spp., which are ubiquitous in the Mediterranean (Mella-flores et al., 2011). NMPHYTO aims to represent phytoplankton larger than 2 µm and smaller than 200 µm. It mainly includes diatoms and autotrophic nanoflagellates. As diatoms are an important component of Mediterranean spring blooms (Margalef, 1978; Leblanc et al., 2018) and cover a wide size range, we decided to consider them to be representative of the NMPHYTO.
Both the NMPHYTO and PICO biomasses are affected by photosynthesis, respiration, nutrient uptake, exudation, and grazing. Photosynthesis depends on light, nutrients, and temperature (based on Geider et al.'s (1998) formulation). Respiration depends on photosynthesis (a constant fraction of photosynthetically produced carbon) and nutrient uptake. Nutrient uptake is temperature dependent. NMPHYTO and PICO both consume nitrate (), , and , while PICO also consume dissolved organic nitrogen (DON) and dissolved organic phosphorus (DOP) (Duhamel et al., 2018). The uptake of DON and DOP depends on temperature and the cell's nutritional state. If the cell is replete in N (P), then DON (DOP) uptake is null. Both phytoplankton groups exude DOC, DON, and DOP proportionally to their internal content of carbon (C), nitrogen (N), and phosphorus (P) (Fig. 2).
2.2.3 Heterotrophic bacteria
Heterotrophic bacterial biomass results from balancing growth and losses due to bacterial production, respiration, nutrient uptake, remineralization, predators grazing, and natural mortality (Kirchman and Gasol, 2018; Faure et al., 2010a, b). Bacterial production depends on DOC and particulate organic carbon (POC) and is limited by temperature and substrate availability. Heterotrophic bacteria consume particulate organic nitrogen (PON), particulate organic phosphorus (POP), DON, DOP, , and , which they remineralize to and . They contribute to the DOM pool through natural mortality, which depends on temperature (Fig. 2).
2.2.4 Dissolved inorganic matter
The DIM compartment consists of the nutrients , , and , as well as dissolved oxygen (O2) and the carbonate system variables (total alkalinity: TA, dissolved inorganic carbon: DIC, pHT, partial pressure of CO2: pCO2, and calcium carbonate: CaCO3). Nutrient concentrations are affected by heterotrophic bacterial remineralization, uptake, and excretion of organisms ( and only) and nitrification ( and only). Nitrification (i.e., production from ) is temperature and O2 dependent. O2 concentration is calculated from photosynthesis, respiration, nitrification, and air–sea exchanges. The other variables included in the DIM compartment are the carbonate system variables (see Barré et al., 2023b, for details).
2.2.5 Particulate and dissolved organic matter
In Eco3M_MIX-CarbOx, we only considered detrital POM and labile DOM. The POM and DOM compartments are affected by zooplankton, mixotrophs, phytoplankton, and heterotrophic bacteria (see above and Fig. 2).
The state equations, process formulations, and associated parameter values for all compartments can be found in Appendices B to E.
2.3 Implementation and assessment of mixotrophs
Mixotrophy is defined as the ability of an organism to combine photoautotrophic and heterotrophic modes of nutrition (Riemann et al., 1995). While this implies that several types of mixotrophy exist in the ocean, we focused on a specific type of mixotrophy, namely the capability of a single-celled organism to employ photo- and phagotrophy. Based on Stoecker's (1998) classification, we included two types of mixotrophs in the model: a type-IIIB non-constitutive mixotroph (NCM) and a type-IIA constitutive mixotroph (CM).
2.3.1 Implementation of NCMs
NCMs (type IIIB) are defined as photosynthetic protozoa; i.e., they are primarily phagotrophic but can complement their carbon uptake through photosynthesis (Stoecker, 1998). In Eco3M_MIX-CarbOx, the NCMs are based on ciliates and belong to microplankton (Esteban et al., 2010; Fig. 3). Their dynamics are governed by the following set of balance equations (see Appendix C for a more detailed description of each term):
Being primarily phagotrophic, NCM grazing is implemented in a similar way to zooplankton grazing in that they can ingest preferentially smaller prey items while having certain preferences for different prey types. From most to least preferred prey, NCMs feed on heterotrophic bacteria, picophytoplankton, CMs, and nano- and micro-phytoplankton (Epstein et al., 1992; Price and Turner, 1992; Christaki et al., 1999). By ingesting photosynthetic prey, NCMs acquire the capacity to photosynthesize by temporarily sequestering chloroplasts (Putt, 1990). This process is modeled as a grazing flux between the chlorophyll concentrations of photosynthetic prey and NCMs (Eq. 2). The NCMs' capacity to photosynthesize degrades over time unless fresh chloroplasts are sequestered (Eq. 3, based on Leles et al., 2018).
In the above equations, , GMAX, KNCM, Φ, and kMORT,Chl represent the maximum grazing rate, the grazing half-saturation constant, the NCM preference for a specific prey type, and the loss rate of captured photosystems, respectively (see Appendix E for details). NCMX and PREYX are the NCM and PREY concentrations of element X, respectively. and are in millimoles per cubic meter per second ().
As NCM photosynthesis depends on the sequestered chloroplasts from prey, we created a prey-dependent formulation to represent it (Eq. 4). We based our formulation on Geider et al. (1998), who provide a photosynthesis flux nutrient, temperature, and light dependence. In this formulation, a maximum photosynthetic rate is first calculated () based on the C-specific photosynthetic rate at a reference temperature of the photosynthetic organism (). This rate is nutrient and temperature dependent and is next multiplied by the light limitation function. We applied parameters of the prey except for the nutrient limitation, which is calculated based on NCM internal content in N and P as the process takes place inside the NCM cells, albeit using the prey's chloroplasts.
In the above equation, and are the maximum photosynthetic rate per second, and is the NCM photosynthetic flux associated with the chloroplast from the considered prey in millimoles per cubic meter per second (). is the C-specific photosynthetic rate at a reference temperature (see Appendix E for values for each prey). fT and limI are temperature and light limitation functions, respectively (see Appendix C for detailed formulations). is a nutrient limitation function which express the nutritional state of the cell and is based on the X ()-to-C ratio (i.e., NCMX to NCMC in this case).
is dimensionless. , , , and represent the minima and maxima of the X-to-C ratios (see Appendix E for values used for NCM). When the cellular C content is high relative to other elements, then the value approaches 0 and vice versa.
The photosynthetic fluxes from each prey type were weighted by NCM prey preference and summed according to
where and are the NCM photosynthetic flux in millimoles per cubic meter per second (), and Φ is the NCM prey type preference (values in Appendix E).
Finally, respiration, exudation, and excretion are based on grazing fluxes and nutrient limitations. Grazed C is consumed through respiration, and excess C is exuded as DOC. The amount of respired or exuded C is determined by the cell's nutritional state. Respiration and exudation fluxes are high when NCM C content is high relative to N or P and vice versa. We used the same reasoning for grazed N (P) which is exuded as DON (DOP) or excreted as () when NCM N (P) content is high (see Appendix C for details).
2.3.2 Implementation of CMs
CMs (type IIA) are defined as phagotrophic algae; i.e., they are primarily phototrophic but can ingest prey to obtain limiting nutrients (Stoecker, 1998). CMs are based on dinoflagellates which belong mainly to nanoplankton but can also be found in microplankton (Stoecker, 1999, Fig. 3). Their dynamics are governed by the following set of balance equations (see Appendix C for details):
CM photosynthesis is temperature, light, and nutrient dependent following Geider et al. (1998):
where is the maximum photosynthetic rate per second, is the CM photosynthetic flux in millimoles per cubic meter per second (), and is the C-specific photosynthetic rate at a reference temperature (see Appendix E for CM value). fT, , and limI are temperature, nutrient, and light limitation functions, respectively (see Appendix C for detailed formulations of fT and limI and Eq. (5) for the formulation of ).
Like picophytoplankton, CMs assimilate dissolved inorganic nutrients (, and ) and DOM (DON and DOP). Uptake fluxes are calculated by using a Michaelis–Menten equation and are limited by temperature. DOM uptake also depends on the nutritional state of the cell in that the higher the cell's N (P) content is, the lower the DON (DOP) uptake will be.
When DIN and/or DIP limits the growth, CMs can ingest smaller prey to supplement their N and/or P needs (Stoecker et al., 1997). CMs feed on heterotrophic bacteria (preferred) and picophytoplankton (less preferred; Christaki et al., 2002; Zubkhov and Tarron, 2008; Millette et al., 2017; Livanou et al., 2019), and the same grazing formulation as for zooplankton and NCMs is used, except that CM grazing is limited by DIN (DIP) concentration and light (Stoecker, 1997, 1998; Eq. 9).
In the above equations, and are in millimoles per cubic meter per second (). and are the (dimensionless) inhibitions of grazing by light and nutrients, respectively. GMAX, KCM, Φ, αChl, , and KNUT represent the maximum grazing rate, the grazing half-saturation constant, the CM prey preference, the chlorophyll-specific light absorption coefficient, the C-specific photosynthesis rate at a reference temperature, and the half-saturation constant for the considered nutrient (, , or ), respectively (values in Appendix E). is the chlorophyll-to-carbon ratio, and EPAR is the irradiance value. The grazing is also affected by CM internal content in N and P ( term, Eq. 5).
CMs ingest prey to supplement their needs in N and P only, exuding grazed C as DOC (Stoecker, 1998; Eq. 10). Hence, DOC is released through two metabolic pathways' exudation of carbon acquired via (i) photosynthesis and (ii) grazing.
In the above equation, and are in millimoles per cubic meter per second (). is the photosynthetic flux in millimoles per cubic meter per second () (Eq. 8), and is the grazing flux for the considered prey in millimoles per cubic meter per second (Eq. 9). fracresp represents the fraction of respired carbon from photosynthesis (values and units in Appendix E).
The formulations for DON and DOP exudation are similar. Exudation only occurs on the N and P obtained from nutrient uptake. In other words, neither N nor P obtained from grazing are released through exudation. When DIN (DIP) concentration is limiting, CMs will ingest prey in addition to the uptake of nutrient. As their internal content in N (P) is particularly low, exudation of DON (DOP) is not allowed (equal to 0). When DIN (DIP) concentration is high, CMs only perform nutrient uptake (no grazing as it only supplements N and P needs in limiting conditions). Then, all the N (P) from uptake is exuded as the cell is already loaded in N (P), and as no grazing is performed, no N (P) from grazing is exuded in these conditions. Respiration uses the same formulation as phytoplankton; i.e., a constant fraction of photosynthesis and nutrient uptake is respired (Sect. 2.2.2 and Appendix C).
2.4 Designing numerical experiments
2.4.1 Assessment of mixotrophs
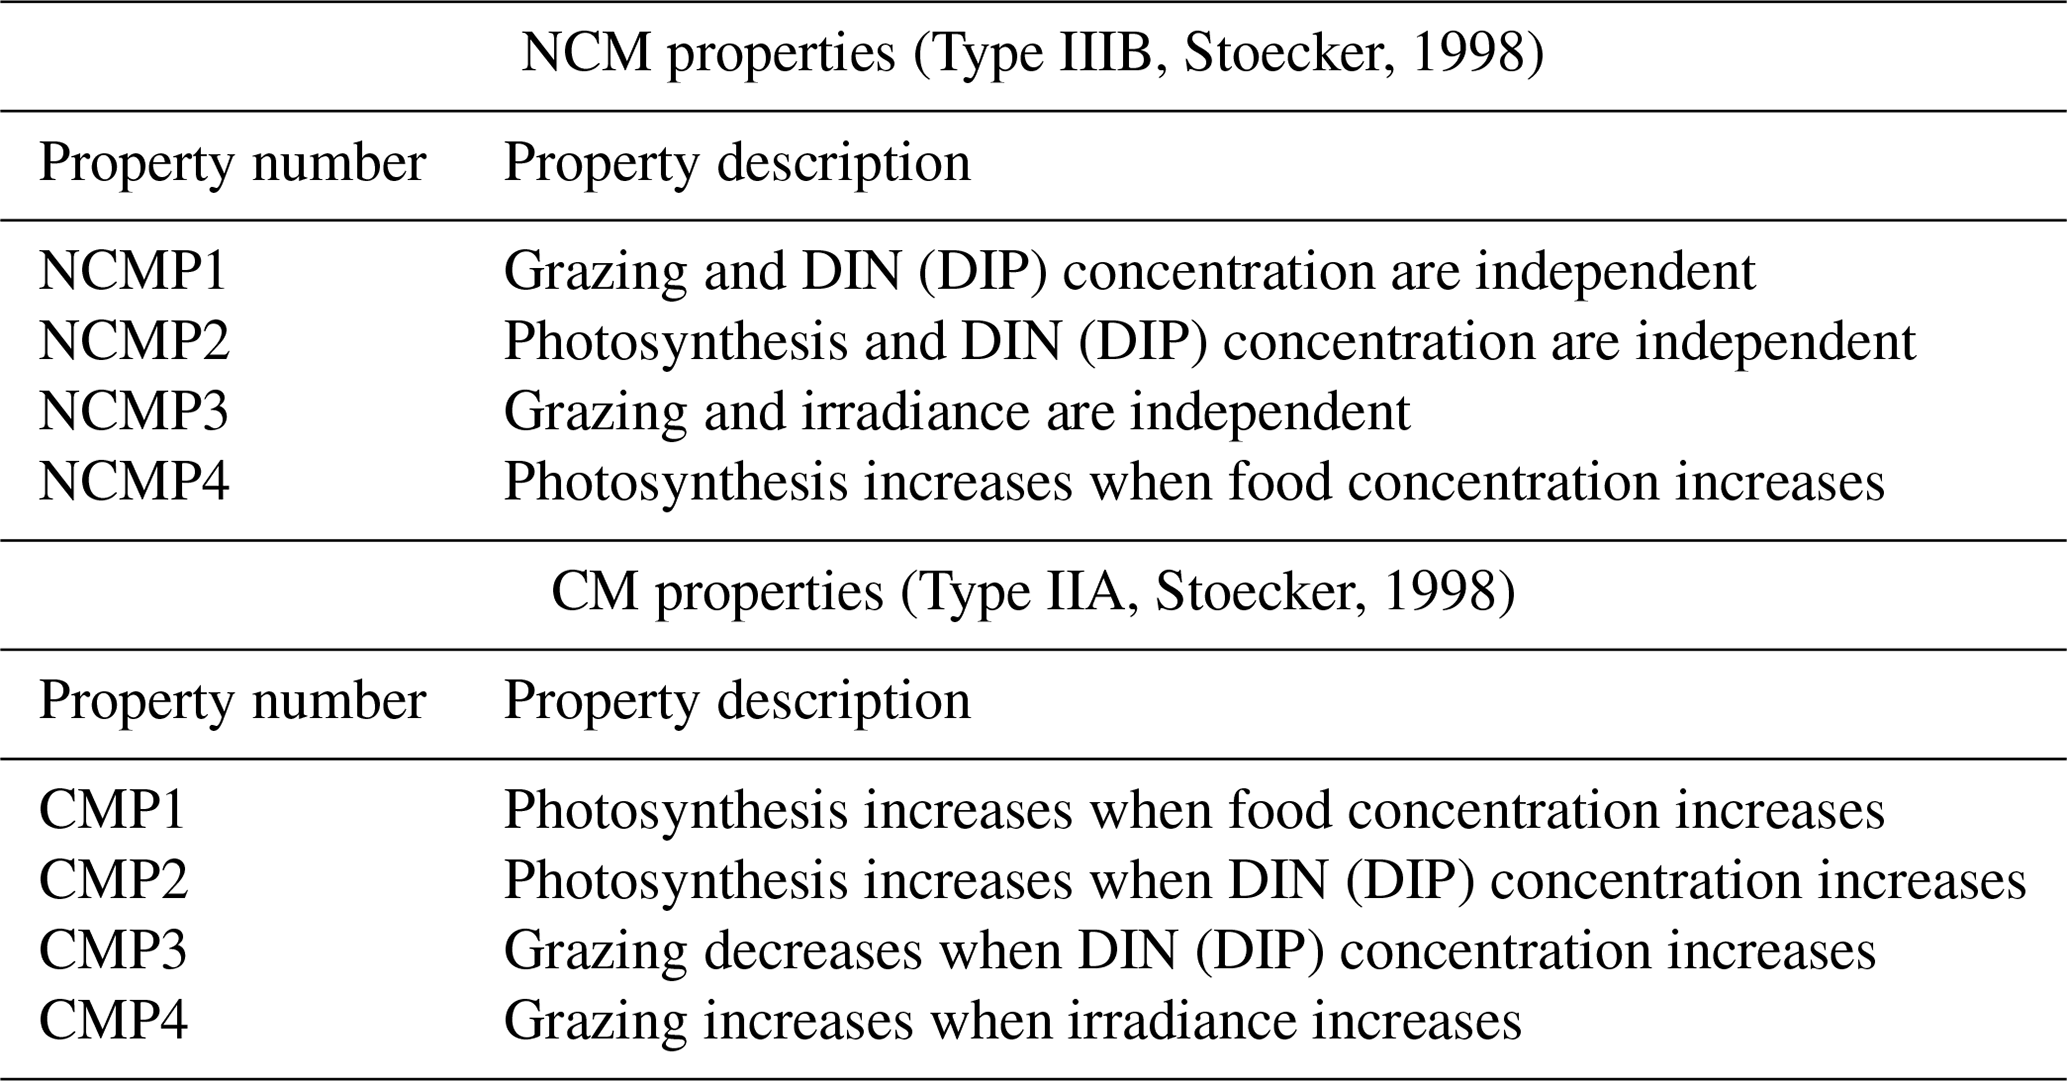
To be considered as correctly represented by the model, NCMs and CMs must fulfill the properties listed in Table 2. These properties have been stated by Stoecker (1998) to provide conceptual models to represent the different types of mixotrophs.
Table 2Summary of NCM and CM properties based on Stoecker (1998). DIN represents the sum of and , and DIP represents . Food is represented by prey concentration.
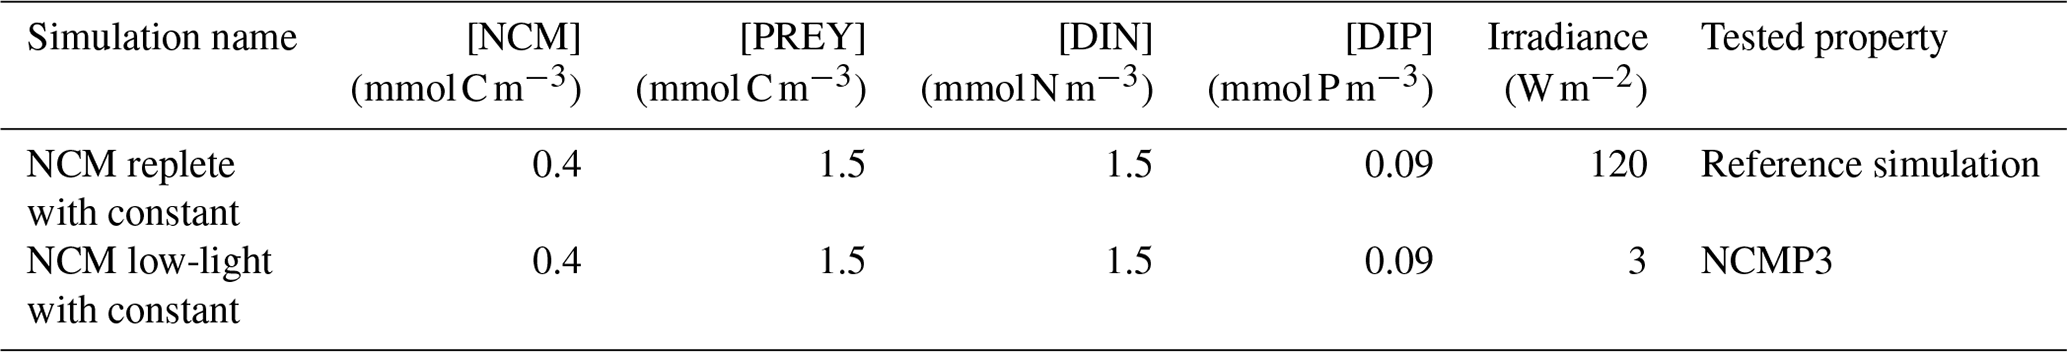
To verify these properties, we designed several numerical experiments (Tables 3 and 4) in which we modify one of the following features: prey biomass, DIN and DIP concentrations, or irradiance. We first ran a reference simulation (referred to as Replete in Table 3) in which we set all the previous features to a maximum value during the entire simulation. Maximum prey biomass was obtained by multiplying the initial condition by 2 (sum of the initial carbon prey biomass multiply by 2), maximum DIN and DIP concentrations were chosen based on high values observed at SOLEMIO (Pujo-Pay et al., 2011), and maximum irradiance corresponds to the mean value of simulated irradiance for the SOLEMIO station by the meteorological model WRF (Yohia, 2017). Next, we ran the low nutrients (low nutrient values observed at SOLEMIO multiplied by 0.1 – low-nut simulation in Table 3 for NCMs and CMs), low prey concentration (maximum prey concentration multiplied by 0.5 – low-food simulation in Table 3 for NCMs and CMs), and low light (maximum value multiplied by 0.05 – low-light simulation in Table 3 for CMs only). For NCMs, to verify the light-dependent property (NCMP3), it is also necessary to set the NCM concentration to a constant during the entire simulation; we performed another reference simulation and a low-light simulation in which the NCM concentration was constant (initial condition, NCM replete with constant and NCM low light with constant in Table 4, respectively). Finally, we compare the simulations to their associated reference simulation.
Table 3Summary of the simulations performed to check NCM and CM properties (excluding NCMP3). For NCMs, [PREY] stands for the sum of CMs, nano- and micro-phytoplankton, picophytoplankton, and heterotrophic bacterial biomasses. For CMs, [PREY] stands for the sum of picophytoplankton and heterotrophic bacterial biomasses.
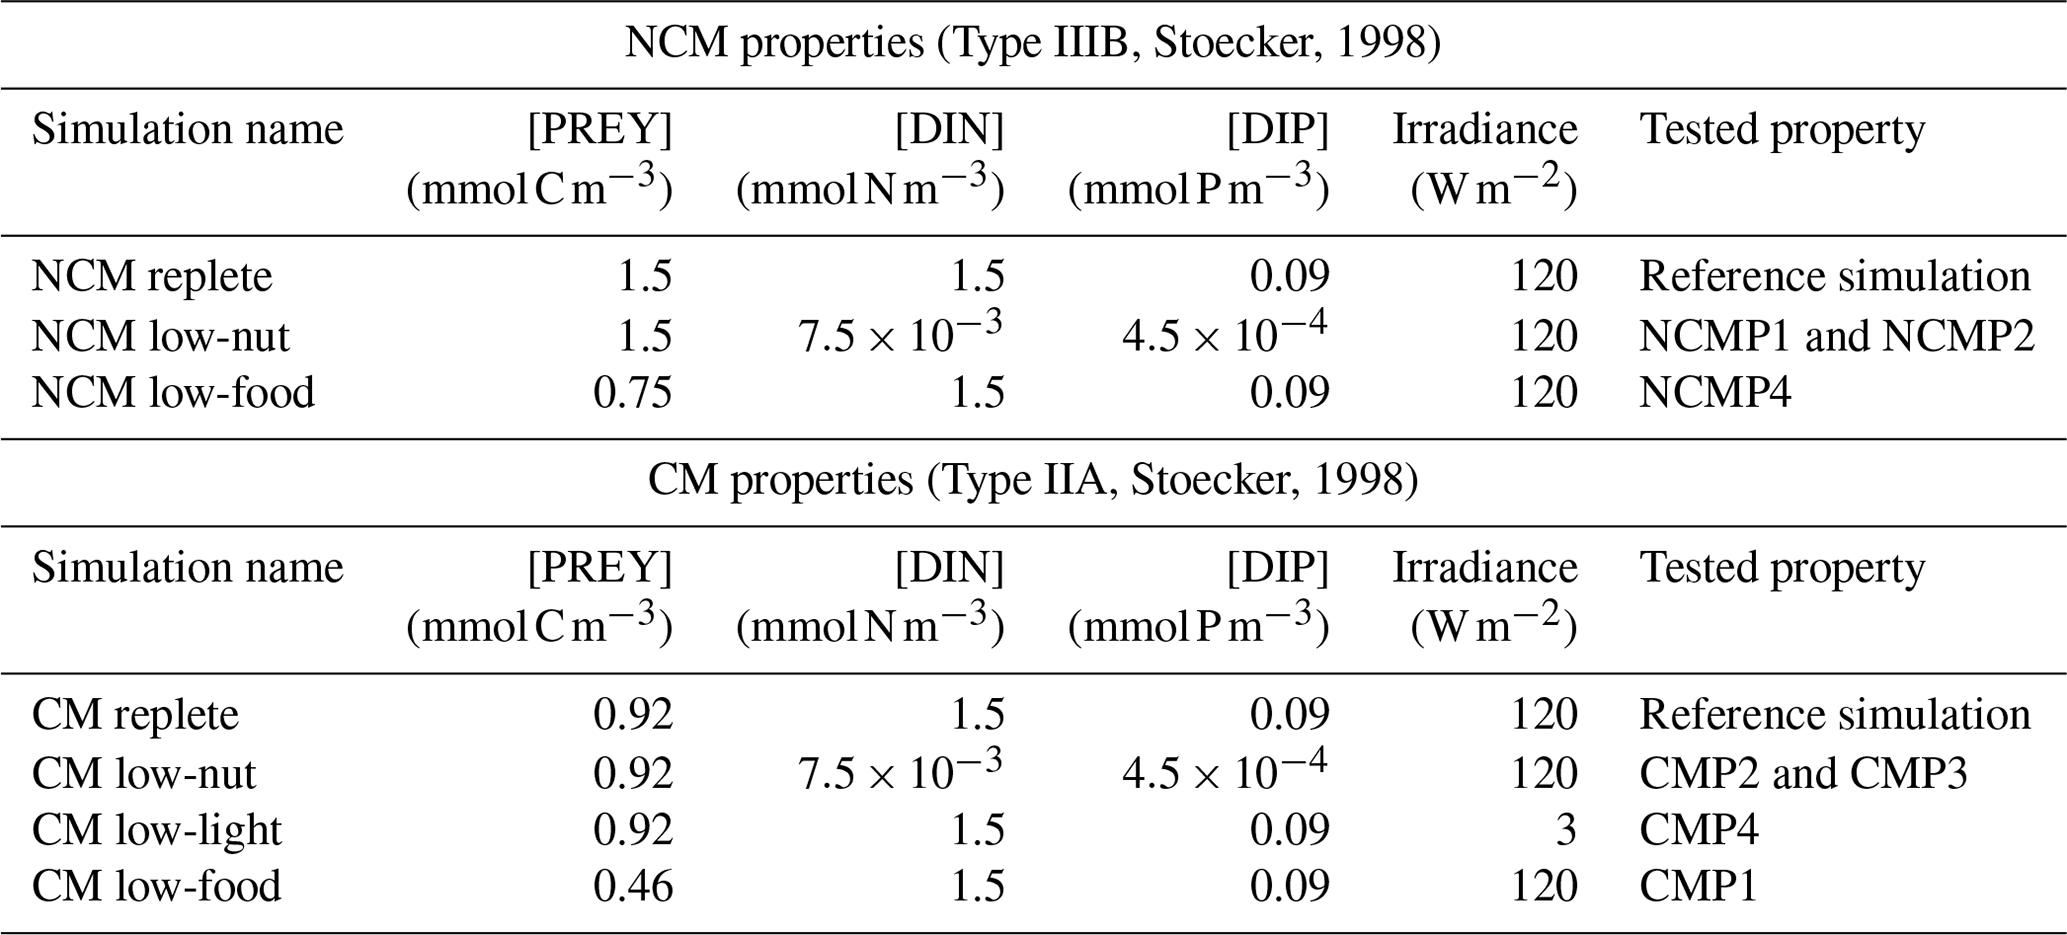
Table 4Summary of the simulations performed for NCMP3. [PREY] stands for the sum of CMs, nano- and micro-phytoplankton, picophytoplankton, and heterotrophic bacterial biomasses.
2.4.2 Typical vs. limited conditions
After verifying mixotroph properties, we simulated three types of light and nutrient regimes for the BoM: typical, nutrient limited, and light limited (Table 5). With these three regimes, we aim to reproduce typical and limited conditions (i.e., nutrient and light limited) in the BoM. Simulations are run for 2017 at SOLEMIO station. The Eco3M_MIX-CarbOx spin-up period is about 3 months. To avoid initial conditions impacting on our results, we ran 3 years of simulations (i.e., repetition of 2017 three times), and we present the results for the second year of simulation.
Table 5Summary of simulation properties. Configurations without mixotrophs are detailed in the Supplement.
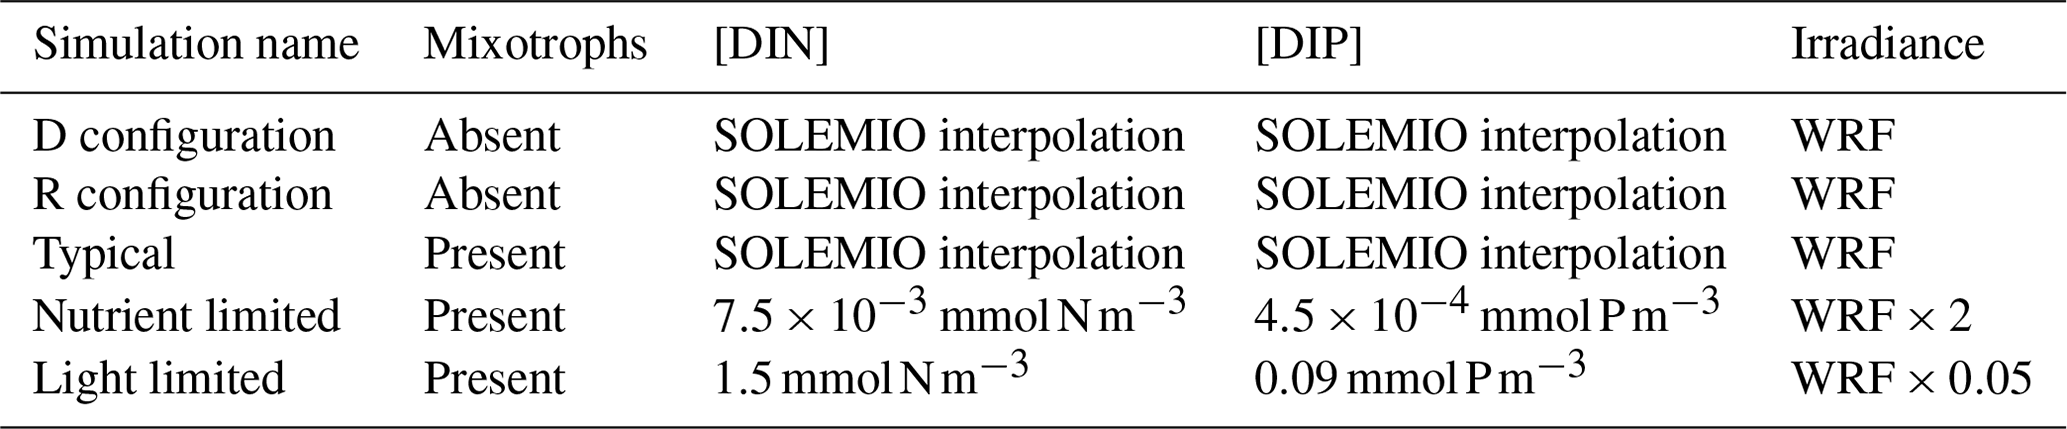
For the typical scenario, light was modeled using the solar irradiance from the WRF meteorological model for SOLEMIO station (Table 1), and , , and concentrations were based on in situ observations at SOLEMIO during 2017 (values from SOMLIT) using a linear interpolation between fortnightly data points (Fig. 4). In these conditions, we also performed two simulations without mixotrophs as control simulations. These simulations correspond to two configurations of Eco3M_MIX-CarbOx without mixotrophs: a first one in which mixotrophs and their associated biogeochemical processes are simply deleted (D configuration in Table 5) and a second one in which we replaced mixotrophs with organisms with strict diets (R configuration in Table 5). These configurations and their results are presented in the Supplement.
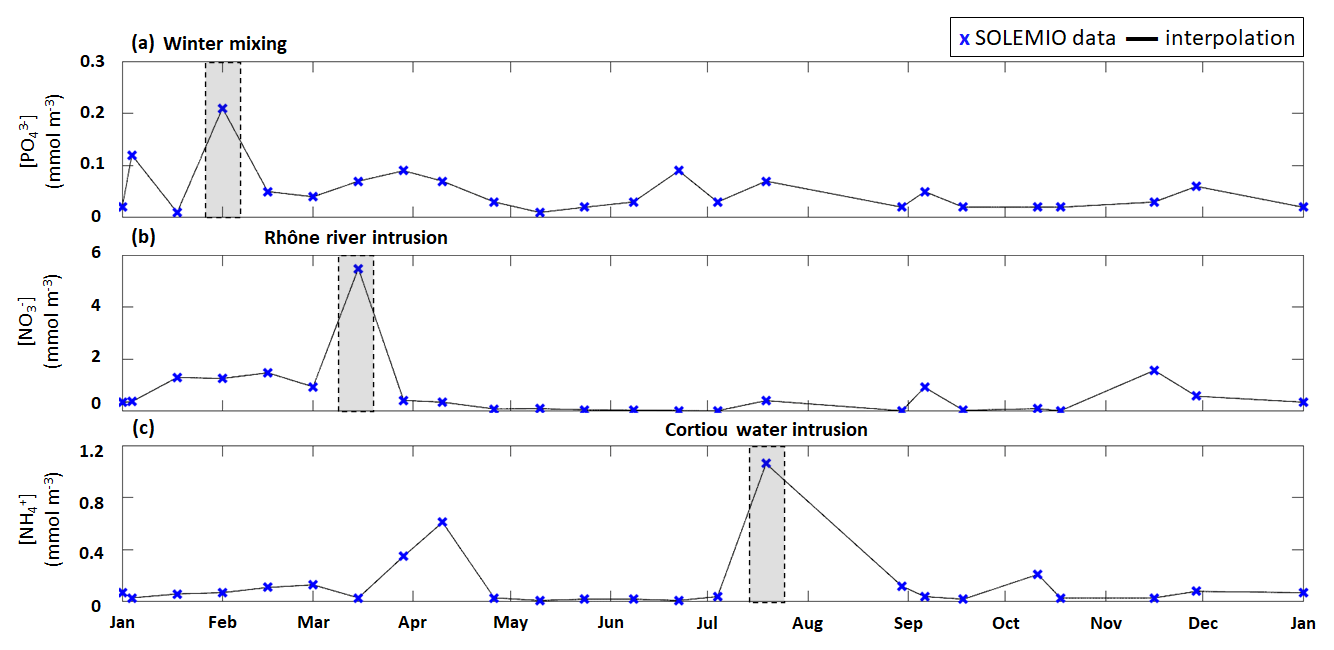
Figure 4Time series of interpolated surface (a) concentration, (b) concentration, and (c) concentration (lines) from fortnightly measurements with SOLEMIO data (markers) during 2017. The studied events are shaded in gray.
In the nutrient-limited scenario, the ecosystem is limited by DIN and DIP concentrations only, using values 10 times lower than the minima observed at SOLEMIO, keeping both DIN (sum of and , and mmol m−3, respectively) and DIP constant for the duration of the simulation. The Eco3M_MIX-CarbOx model was initially developed to be run with low nutrient concentrations, representative of the Mediterranean Sea (Morel and Andre, 1991). To ensure that organisms were not limited by light, we multiplied the typical irradiance by 2.
In the light-limited scenario, we only applied 5 % of the typical irradiance, while DIN ( mmol m−3, mmol m−3) and DIP concentrations were set to winter values at SOLEMIO.
For the three simulations, we used typical values of the BoM to represent temperature, salinity, wind speed, and atmospheric pCO2, as described in Table 1.
2.5 Ecosystem and phytoplankton composition
We used the total carbon biomass which is calculated by summing the daily average biomass of each organism to assess the ecosystem composition and its dynamics during different scenarios over a full year.
We used the total phytoplanktonic carbon biomass, which is calculated by summing the daily average carbon biomass of each phytoplanktonic organism, to assess the phytoplankton composition (given as percentages of nano- and micro-phytoplankton, picophytoplankton, and CMs). We chose to include CMs in phytoplankton composition since they are primarily phototrophic. The phytoplankton composition was examined for the typical scenario (see previous section) over a full year and during three specific events: (i) winter mixing, (ii) Rhône River intrusion, and (iii) Cortiou water intrusion (Fig. 4). Each of these events is associated with a nutrient maximum. The winter mixing event is associated with a peak in on 1 February (Fig. 4a), the Rhône River intrusion is associated with a maximum on 15 March (Fig. 4b), and the intrusion of Cortiou water is associated with a maximum (Fig. 4c). During these events, phytoplankton composition is calculated for a period of 11 d (day of the maximum and ±5 d).
3.1 Representation of mixotrophs
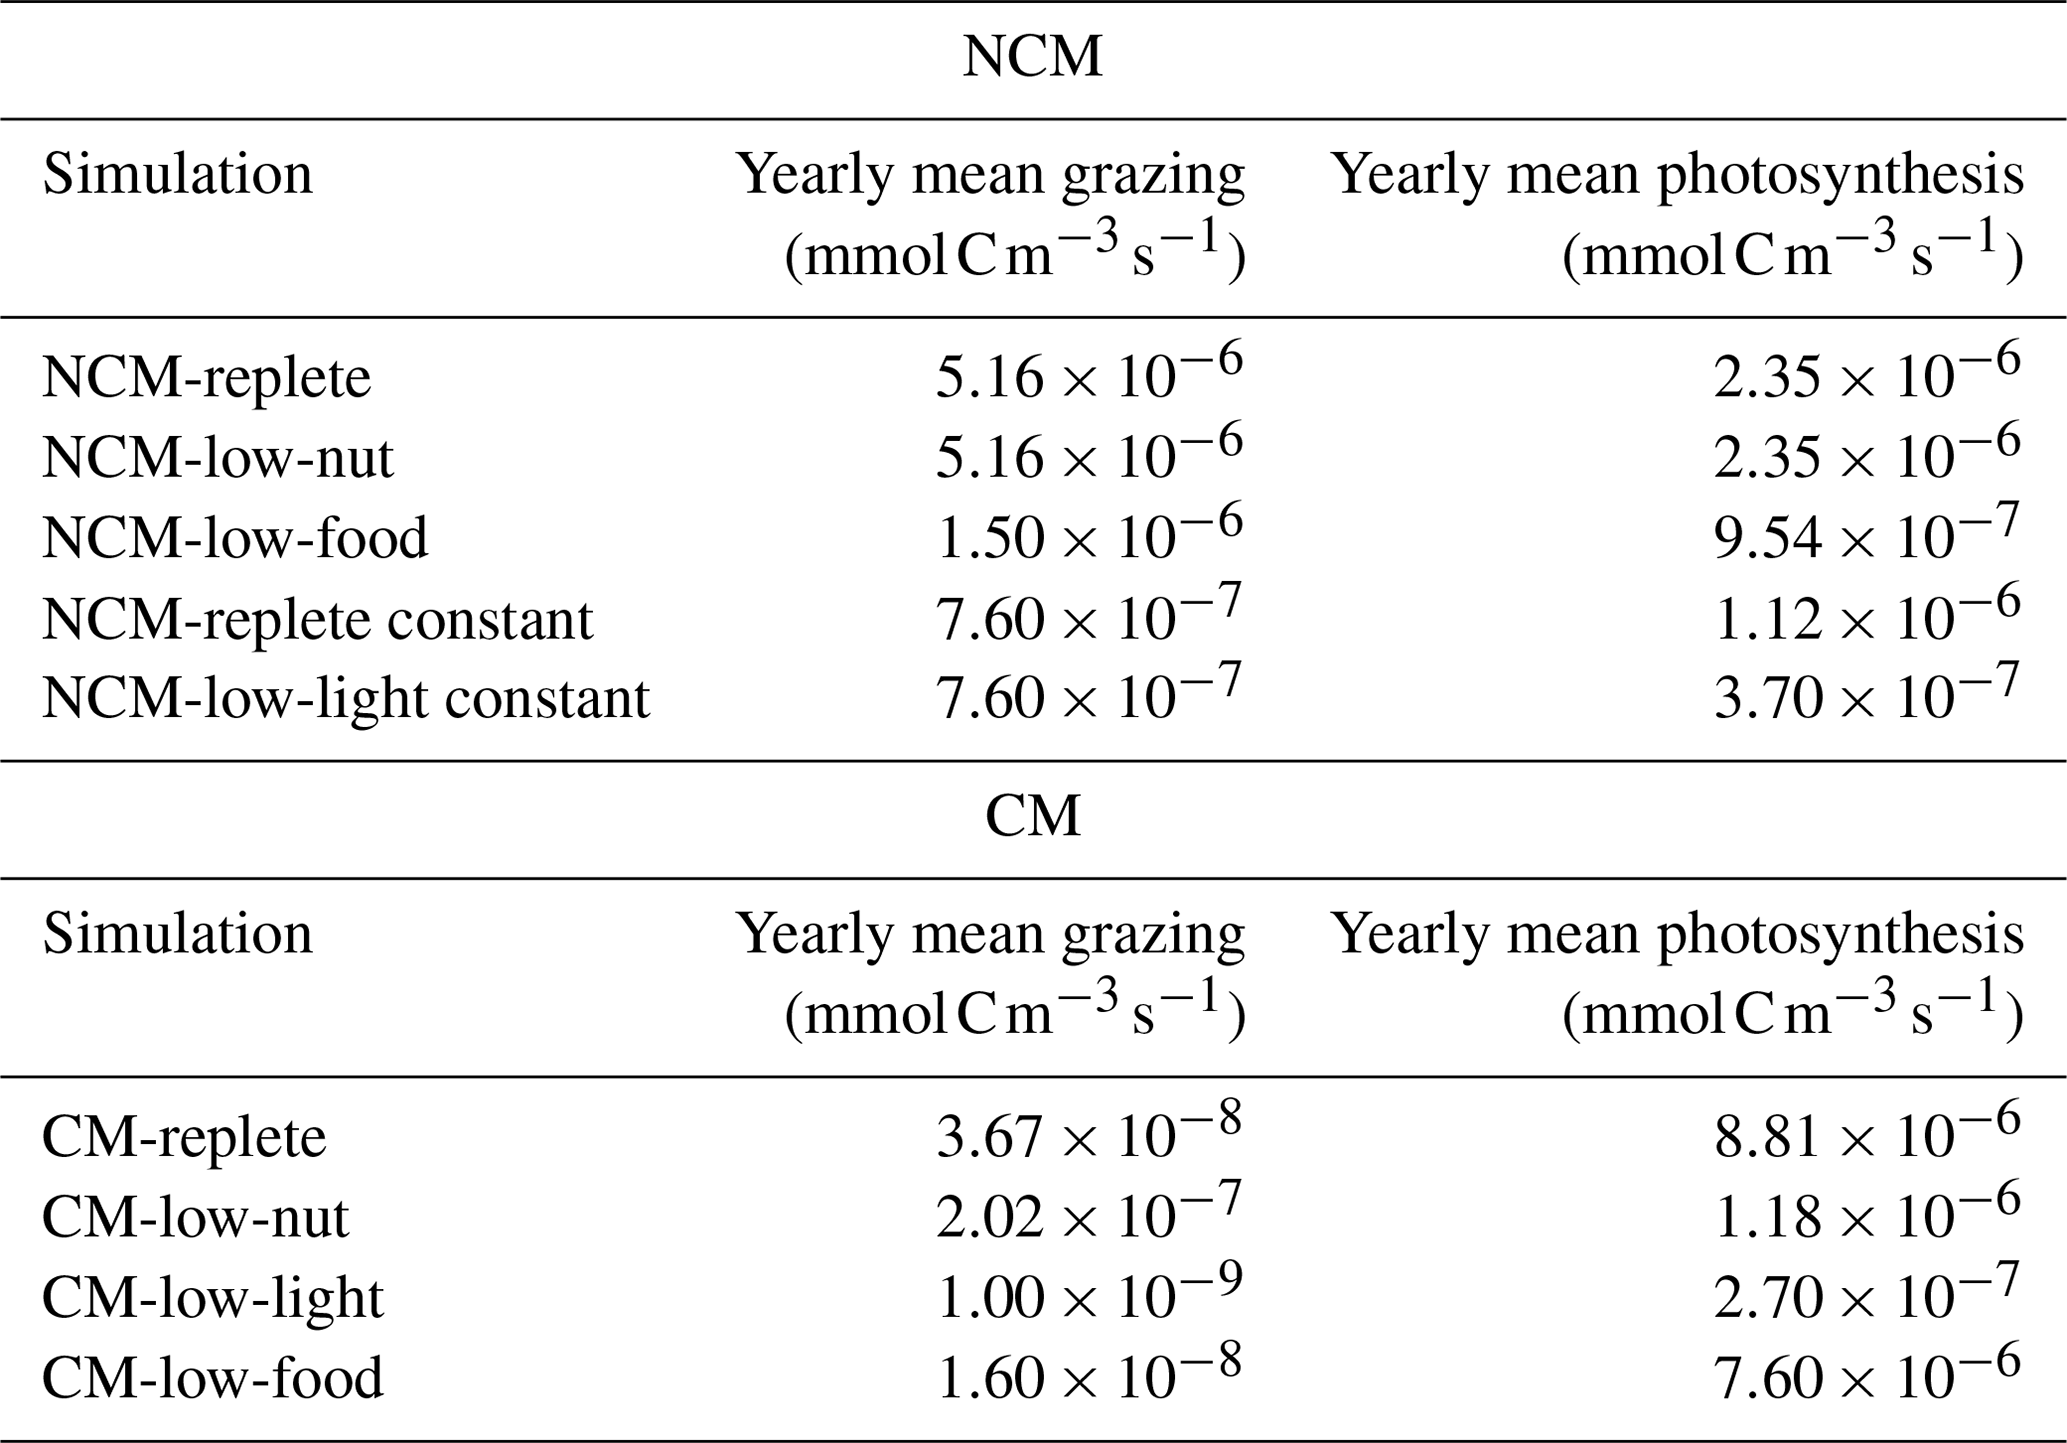
To assess whether the mixotrophs were correctly represented in the model, we compared the properties that emerged during the simulation to those listed in Table 2 for the simulation described in Tables 3 and 4. Here, we present the yearly time series of daily averaged grazing and photosynthesis fluxes (Fig. 5). Yearly mean values of grazing and photosynthesis for each simulation are presented in Appendix F.
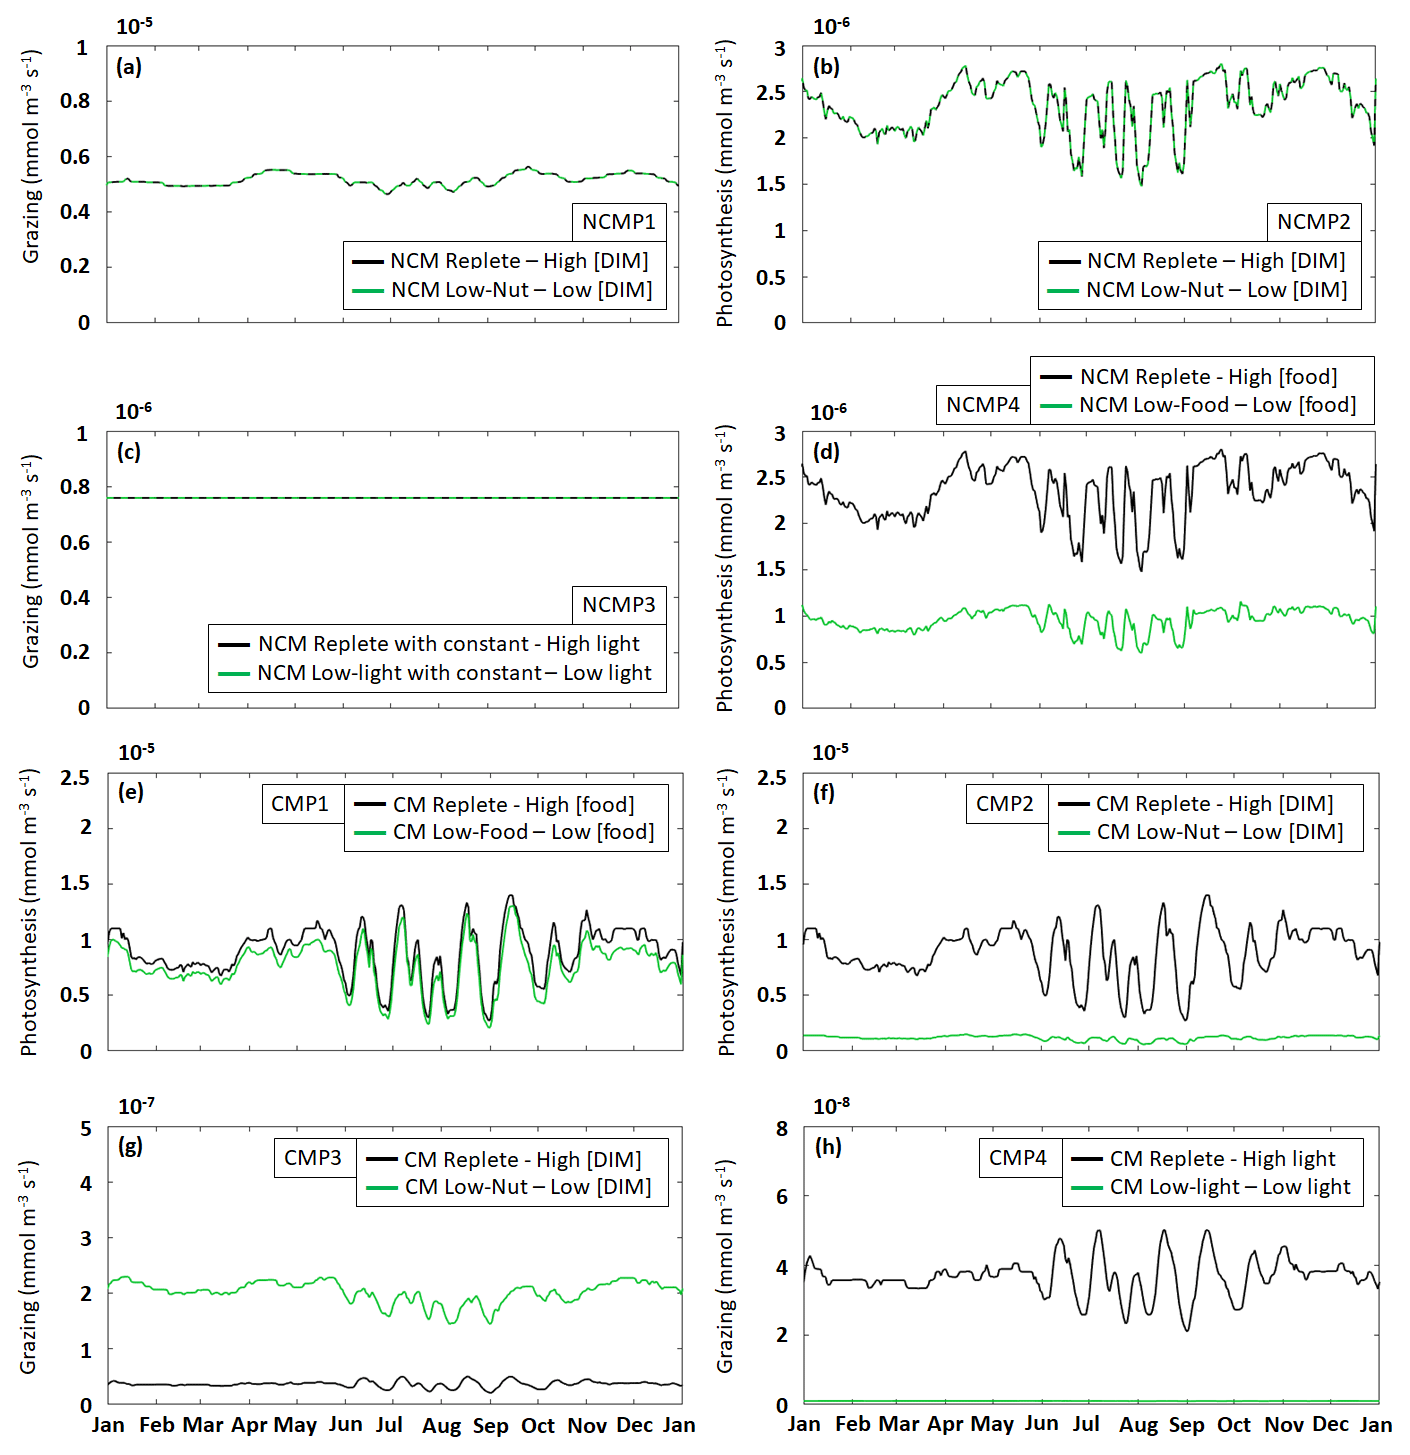
Figure 5Assessment of mixotroph representation in the model. Each frame represents the test of a property stated by Stoecker (1998) for NCMs (type IIIB) – whereby grazing is independent of (a) DIM concentration (NCMP1) and (c) irradiance (NCMP3), and photosynthesis (b) is independent of DIM concentration (NCMP2) and (d) increases with food concentration (NCMP4) – and for CMs (type IIA) – whereby photosynthesis increases with (e) food concentration (CMP1) and (f) DIM concentration (CMP2), and grazing (g) decreases when DIM concentration increases (CMP3) and (h) increases with irradiance (CMP4). Properties are detailed in Table 2, and associated simulations are detailed in Tables 3 and 4. Plotted values represent daily averaged grazing and photosynthesis. DIM refers to dissolved inorganic matter (sum of dissolved inorganic nitrogen and dissolved inorganic phosphorus).
The results show that, throughout the year, NCM grazing fluxes obtained in low- and high-DIM (DIN+DIP) conditions remained constant (Fig. 5a) and seem to be independent of irradiance levels (Fig. 5c). Similarly, NCM photosynthesis in the model does not depend on DIM concentration (Fig. 5b). However, doubling the food led to an increase in NCM photosynthesis (Fig. 5d).
For the CMs, the picture is different. CM photosynthesis increases slightly when food concentration increases, while increasing DIM concentrations led to significant increases in photosynthesis (Fig. 5e and f). Also, CM grazing depends on DIM concentration and light (Fig. 5g and h), although the effect of the latter is less pronounced. Under low DIM concentrations, CM grazing was about 1 order of magnitude higher than with high DIM concentrations (maxima of vs. ) (Fig. 5g). Increases in light also led to significant increases in grazing (maxima of vs. ; Fig. 5h).
3.2 Phytoplankton composition under typical forcing conditions and during specific events
We studied the phytoplankton composition throughout the entire year of 2017 (Fig. 6a) and during specific events, namely the winter mixing event (Fig. 6b), a Rhône River intrusion (Fig. 6c), and a Cortiou water intrusion (Fig. 6d). The formulations used to describe the limitation status are presented in Appendix D.
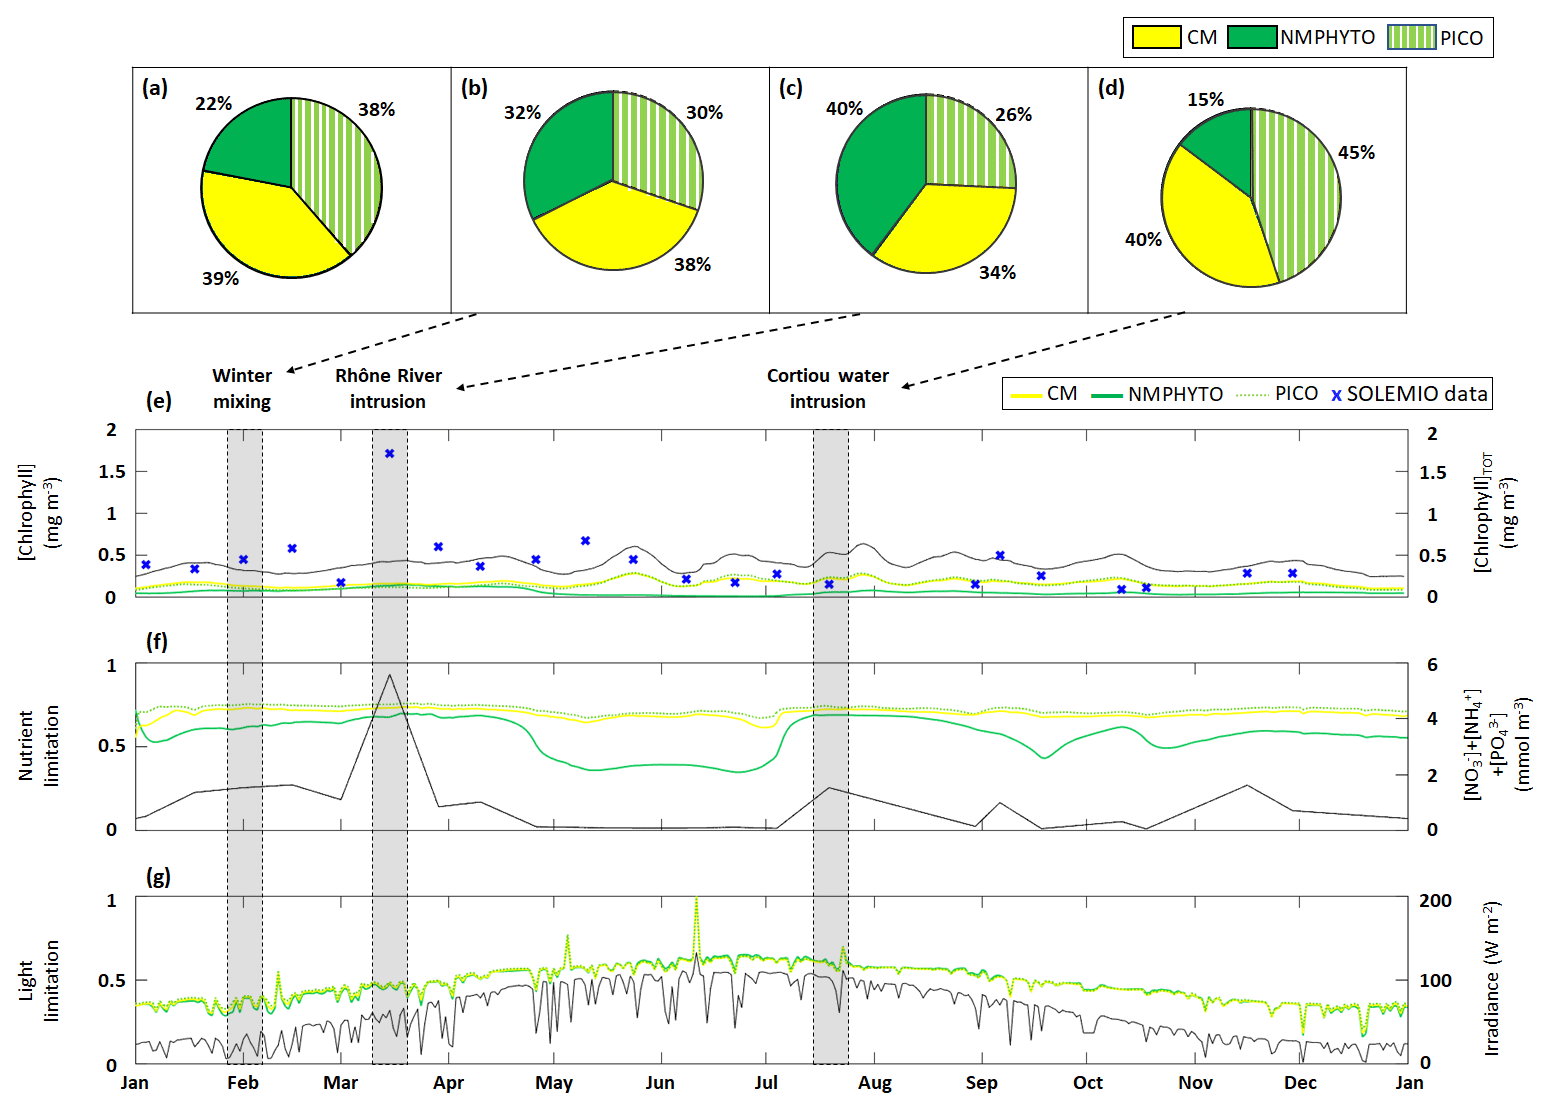
Figure 6Phytoplankton composition as percentages of C biomass during (a) 2017, (b) a winter mixing event, (c) a Rhône River intrusion, and (d) a Cortiou water intrusion. Time series of daily averages of the three phytoplankton groups: (e) chlorophyll concentrations, (f) nutrient limitation status, and (g) light limitation status (a value of 1 means no limitation). The black line in each panel shows (e) total chlorophyll concentration (sum of daily average CMs, NMPHYTO, and PICO chlorophyll concentrations), (f) sum of nutrients (), and (g) daily average irradiance, with the corresponding axes shown on the right. The markers in (f) represent in situ SOLEMIO data. Sections shaded in gray show when the three events occurred in time.
3.2.1 Annual scale
Through the year of 2017, phytoplankton biomass was dominated by CMs, closely followed by PICO and at some distance by NMPHYTO (Fig. 6a).
CM and PICO chlorophyll concentrations show similar patterns, with values varying between 0.1 (on 18 February) and 0.3 mg Chl m−3 (on 24 May). The highest variability occurred between May and October. NMPHYTO chlorophyll concentrations varied between 0.01 (on 25 June) and 0.16 mg Chl m−3 (on 20 March), with the lowest values occurring between May and July (Fig. 6e). The in situ values reached a maximum of 1.71 mg Chl m−3 on 15 March, linked to the Rhône River intrusion event. Between June and November, in situ values were generally lower compared to the other months, and a minimum of 0.1 mg Chl m−3 was reached on 11 October. The modeled chlorophyll concentration shows less variations than the in situ data, especially since the model was unable to reproduce either the maximum related to the Rhône intrusion on 15 March or the minimum on 11 October. Nevertheless, the modeled values, ranging from 0.25 to 0.64 mg Chl m−3, are generally of the same order of magnitude as the in situ observation. Both the model results and in situ data yielded the same mean chlorophyll concentrations of 0.4 mg Chl m−3.
Total nutrients (Fig. 6f) varied between 0.08 (in summer and autumn) and 5.6 mmol m−3 (reached on 15 March). CM and PICO nutrient limitation status remained fairly stable near the mean value of 0.71; however, organisms are more limited in late spring and summer (between May and July). NMPHYTO nutrient limitation status is more variable, showing higher limitations in late spring and summer (between late April and July) and lesser limitation in early spring and late summer.
The light limitation status clearly reflects the diurnal and seasonal variations in incident irradiance (Fig. 6g). Throughout the year, all three phytoplankton groups show nearly identical levels of limitation.
3.2.2 Winter mixing event
During the winter mixing event, a maximum was recorded at SOLEMIO station (0.21 mmol m−3, Fig. 4a). In terms of C biomass, CMs were most dominant, followed by NMPHYTO and PICO (Fig. 6b).
CMs and PICO chlorophyll decreased slightly, while NMPHYTO chlorophyll remained constant (Fig. 6e). The decrease in CMs and PICO chlorophyll is also visible in the total chlorophyll, which dropped from 0.41 to 0.28 mg Chl m−3 (Fig. 5e).
The nutrient limitation remained fairly stable for all phytoplankton groups (Fig. 6f).
During the event, irradiance was low (<40 W m−2, Fig. 6g) and decreased at the end of January due to bad weather. CMs, NMPHYTO, and PICO light limitation status remained similar throughout this event and at a relatively low value (0.3).
3.2.3 Rhône River intrusion
The Rhône River intrusion resulted in a maximum at SOLEMIO station (5.48 mmol m−3, Fig. 4b). Model results indicate that, during the event, phytoplankton was dominated by NMPHYTO followed by CMs and PICO (Fig. 6c).
All three chlorophyll concentrations increased, with the most significant increase occurring for NMPHYTO (from 0.11 to 0.15 mg Chl m−3), which surpassed PICO at the beginning of the event (Fig. 6e).
The intrusion also led to a significant increase in modeled total nutrients (reaching 5.5 mmol m−3). Nutrient limitation status was similar for all groups and remained between 0.67 and 0.75, showing no significant variations during the event (Fig. 5f).
While irradiance levels were moderate (around 60 W m−2), all three groups were still light limited (values of about 0.5, Fig. 6g).
3.2.4 Cortiou water intrusion
During the Cortiou water intrusion, the in situ concentration reached a maximum of 1.06 mmol m−3 (Fig. 4c) at SOLEMIO station. In the model, phytoplankton composition was dominated by PICO and CMs, with NMPHYTO being a distant third (Fig. 6d).
Chlorophyll increased in all groups, resulting in an increase in total chlorophyll from 0.36 to 0.52 mg Chl m−3 (Fig. 6e).
During the event, the sum of nutrients reached 1.53 mmol m−3 with a clear maximum. Nutrient limitation status was similar across groups and remained stable around 0.7 (Fig. 6f).
Irradiance levels were moderate (between 70 and 112 W m−2), leading to only a slight light limitation (values between 0.58 and 0.62, Fig. 6g).
3.3 Ecosystem composition under light and nutrient limitation
3.3.1 Nutrient-limited conditions
In nutrient-limited conditions, the modeled yearly total C biomass, i.e., the sum of daily C biomass of each organism, was 349.5 mmol C m−3, divided between copepods (148.7 mmol C m−3), NCM (129.8 mmol C m−3) and heterotrophic bacteria (26.2 mmol C m−3), followed by the three phytoplankton groups, of which NMPHYTO had the lowest biomass (4.5 mmol C m−3, Fig. 7a).
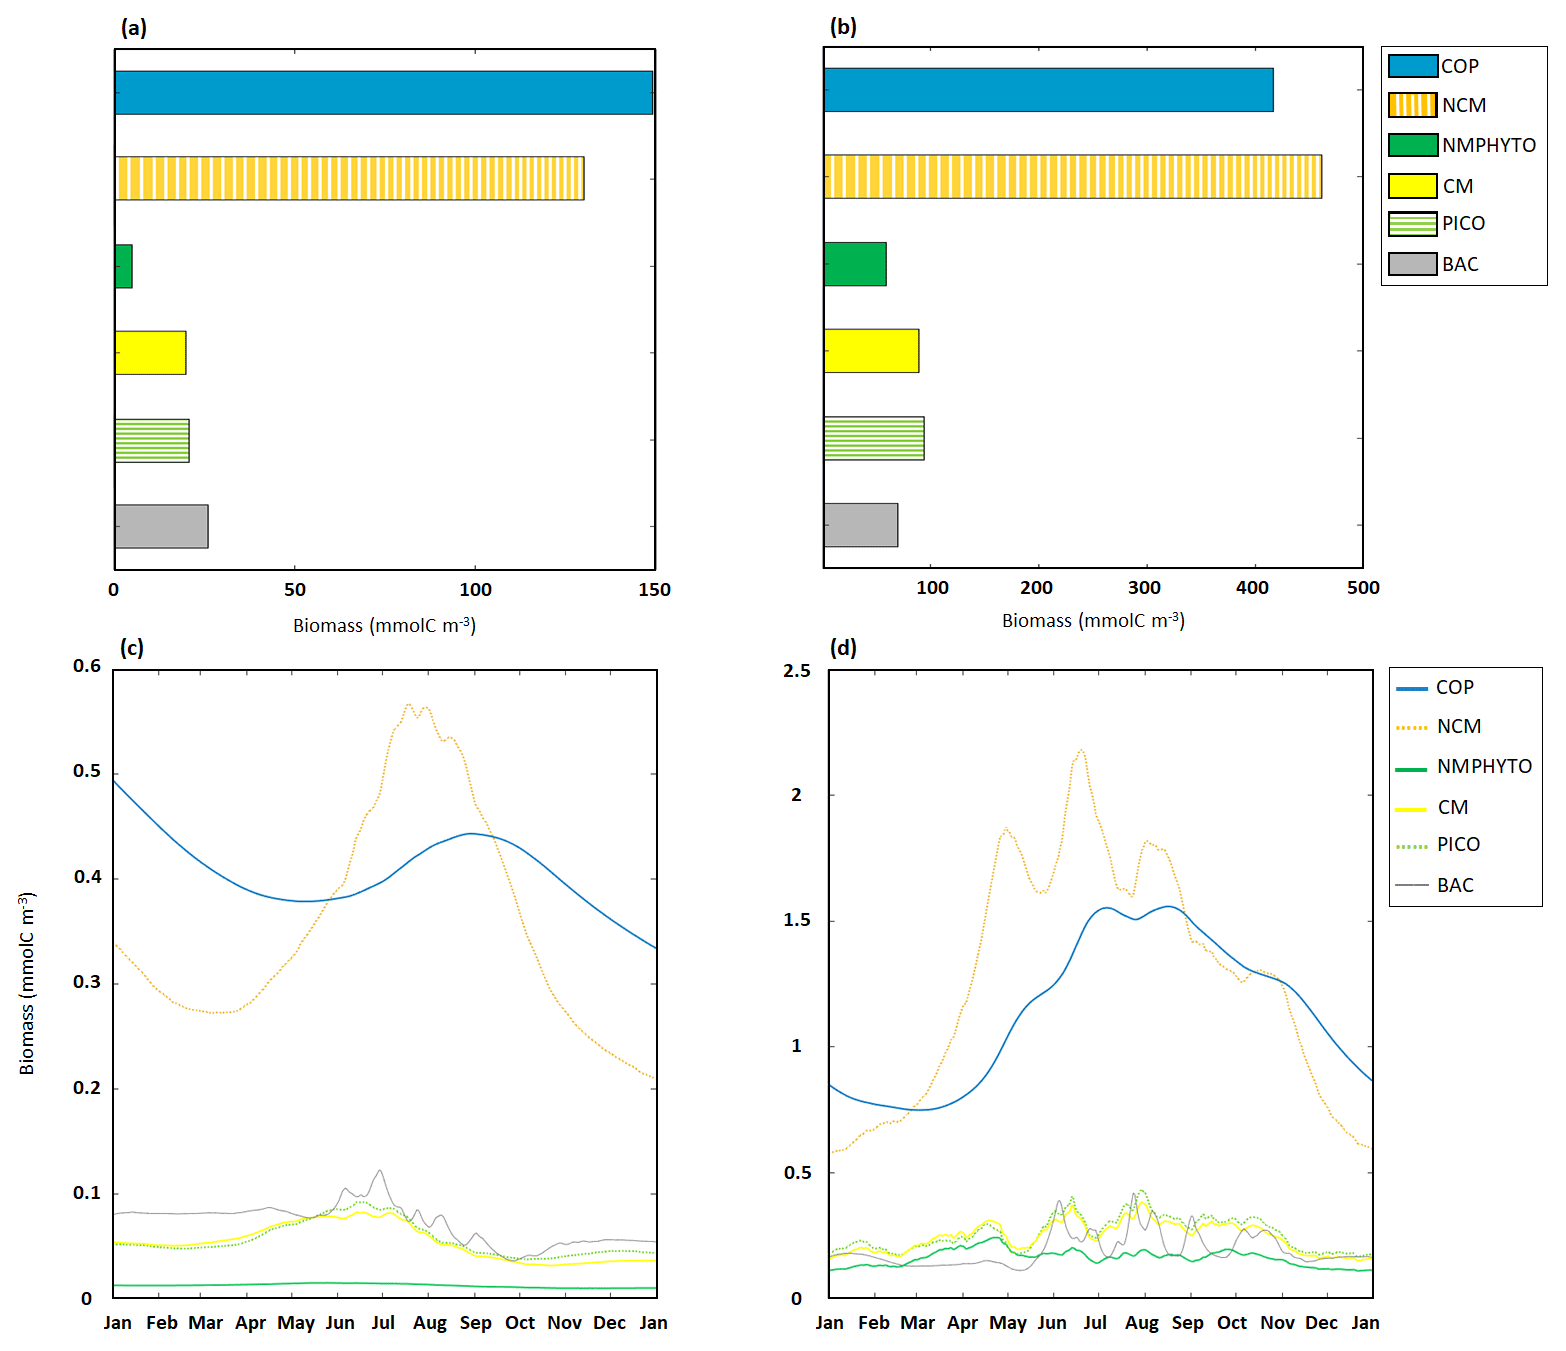
Figure 7Yearly ecosystem C biomass composition and dynamics for copepods (COPs), NCMs, nano- and micro-phytoplankton (NMPHYTO), CMs, picophytoplankton (PICO), and heterotrophic bacteria (BAC). Yearly totals under (a) nutrient- and (b) light-limited conditions. Time series of daily averages under (c) nutrient- and (d) light-limited conditions. Note the different scales in panels (a) and (b), as well as in (c) and (d).
Copepods and NCMs dominated the ecosystem, with copepods being more abundant between October to June, while NCMs dominated during the other months of the year. In early June, NCM biomass started to increase and reached a maximum of 0.56 mmol C m−3 on 18 July. Copepod biomass peaked shortly after (0.44 mmol C m−3 on 1 September). Heterotrophic bacteria biomass also started to increase in June and reached a maximum of 0.12 mmol C m−3 on 29 June. CM and PICO biomasses show similar dynamics, starting to increase in April and reaching a maximum in mid-June before decreasing into September. NMPHYTO biomass remained low and close to its mean value of 0.01 mmol C m−3 throughout the year (Fig. 7c).
3.3.2 Light-limited conditions
In light-limited conditions, the modeled yearly total C biomass was about 3 times higher than with nutrient limitation (1192.5 mmol C m−3). NCM dominated the ecosystem (462.3 mmol C m−3) followed by copepods (417.3 mmol C m−3). NMPHYTO biomass was the lowest (59.2 mmol C m−3, Fig. 7b).
Between late autumn and late spring, copepods dominate, while NCMs become dominant in terms of biomass between mid-February and September. During this period, NCM biomass appears to be more variable compared to copepods and reaches a maximum of 2.2 mmol C m−3 on 14 June. Also, heterotrophic bacteria showed a high variability, particularly in summer, while remaining close to 0.15 mmol C m−3 during the rest of the year. CM and PICO showed similar dynamics, with their biomass starting to increase in early March before decreasing from mid-April and increasing again from mid-May till summer. They also showed their highest variability in summer. NMPHYTO biomass oscillated between 0.12 and 0.2 mmol C m−3, showing a similar overall behavior to CMs and PICO, except that the NMPHYTO maximum was reached on 23 April and not in summer (Fig. 7d).
3.4 Carbon, nitrogen, and phosphorus fluxes of mixotrophs
3.4.1 Carbon fluxes
In typical and nutrient-limited conditions, NCMs can meet their metabolic needs by ingesting prey and by photosynthesizing using sequestered chloroplasts. In typical conditions (Fig. 8a), NCMs obtained about three-quarters of their C through prey ingestion (74.2 %) and the remaining quarter through photosynthesis (25.8 %). The most significant loss terms are, in descending order, grazing by copepods, exudation of DOC, and respiration. In nutrient-limited conditions (Fig. 8b), C uptake by photosynthesis and predation are more balanced (43.4 % and 56.6 %, respectively), while the losses are similar to the typical scenario.
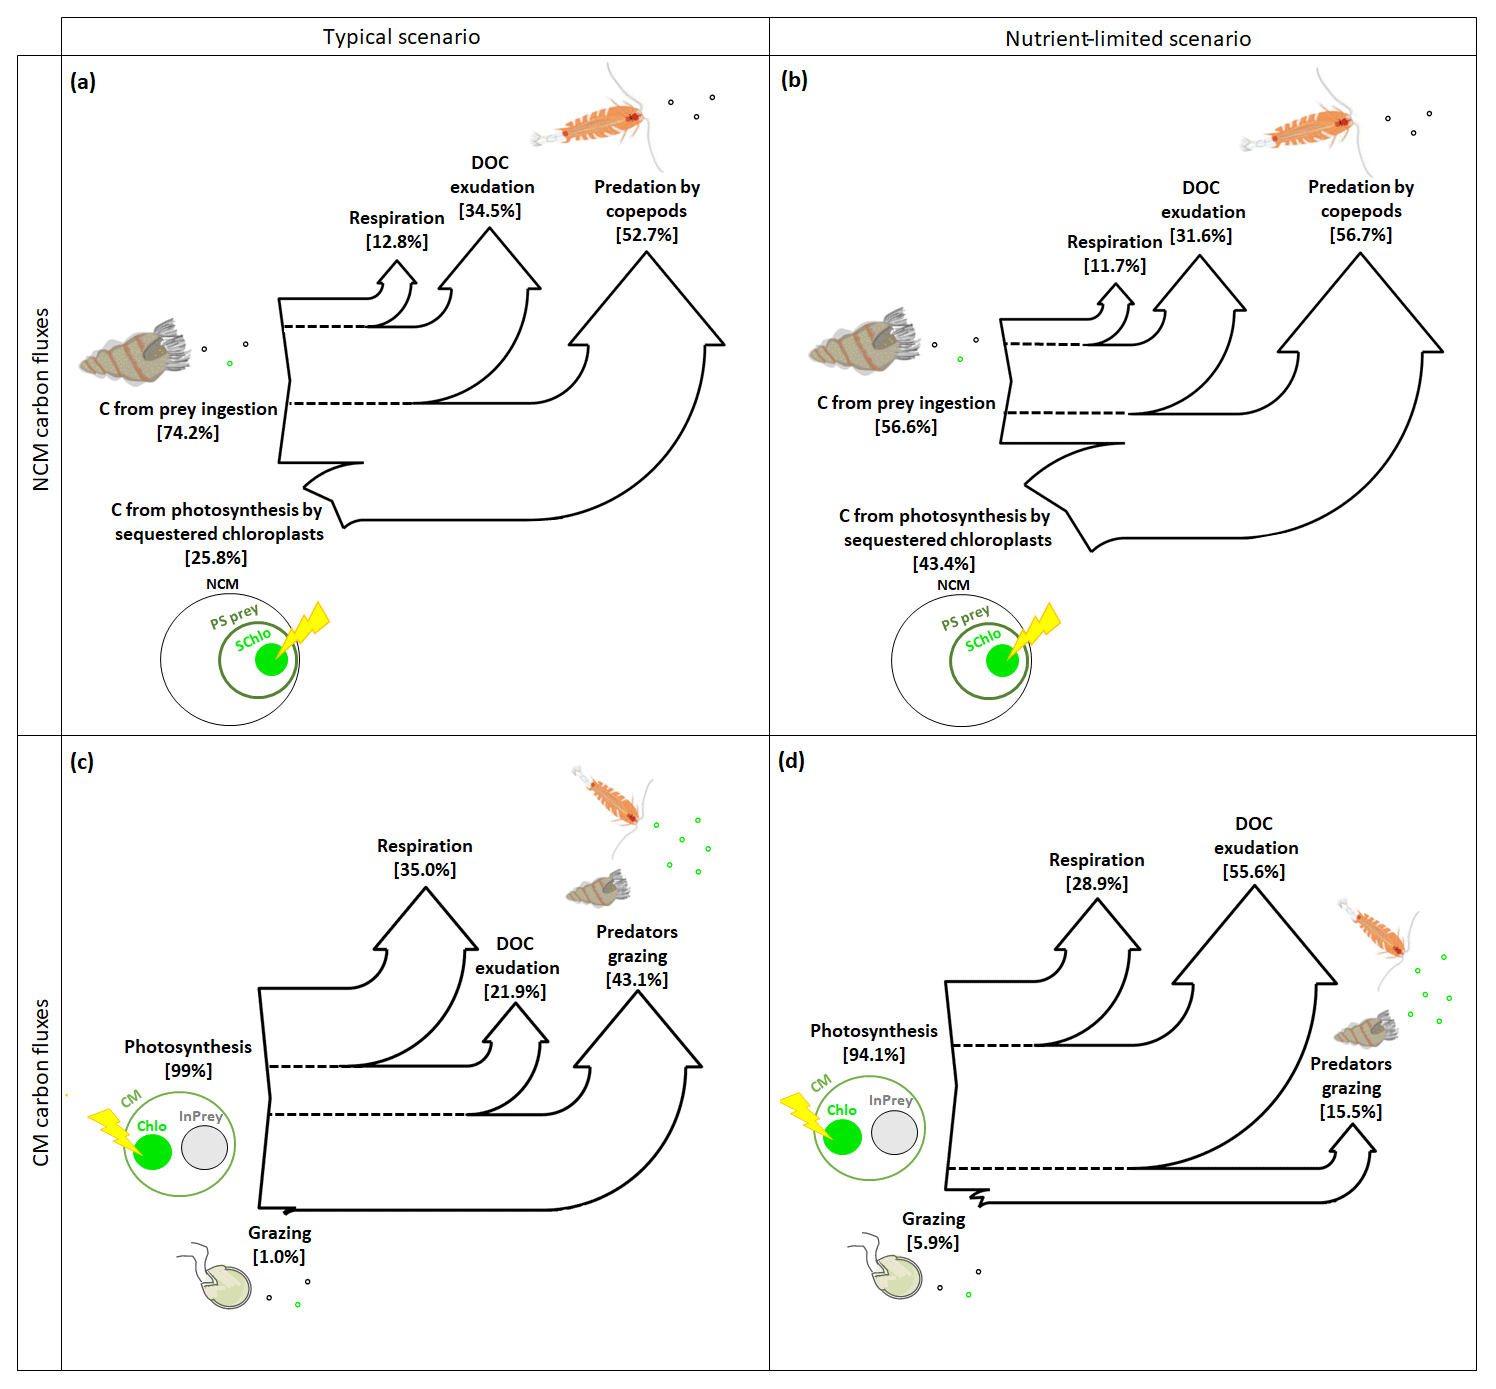
Figure 8Sankey diagrams showing the carbon (C) fluxes for NCMs (a, b) and CMs (c, d) in typical (a, c) and nutrient-limited (b, d) scenarios. Numbers represent the yearly averaged C fluxes. PS prey: photosynthetic prey; InPrey: ingested prey; SChlo: sequestered chloroplast; Chlo: chloroplast.
In contrast, when CMs find themselves in typical conditions, they meet their metabolic needs almost entirely through photosynthesis, while grazing is almost negligible (Fig. 8c). The most important loss terms are grazing, followed by respiration and DOC exudation. In nutrient-limited conditions, the role of grazing increases, but only slightly, and photosynthesis remains the dominant source of C (Fig. 8d). Interestingly, C loss terms change considerably under nutrient limitation: predation decreased significantly to become the least important loss term, while more than half those losses now occur via DOC exudation, while respiration decreased slightly.
3.4.2 Nitrogen and phosphorus fluxes
CM can complement their normal N and P uptake, i.e., DIM and DOM uptake (referred to as total N or P uptake in Fig. 9), by grazing. In typical conditions, grazing is insignificant to both N and P uptake (Fig. 9a and c), while losses occur predominantly through exudation of DON and DOP, with predation representing only about one-third.
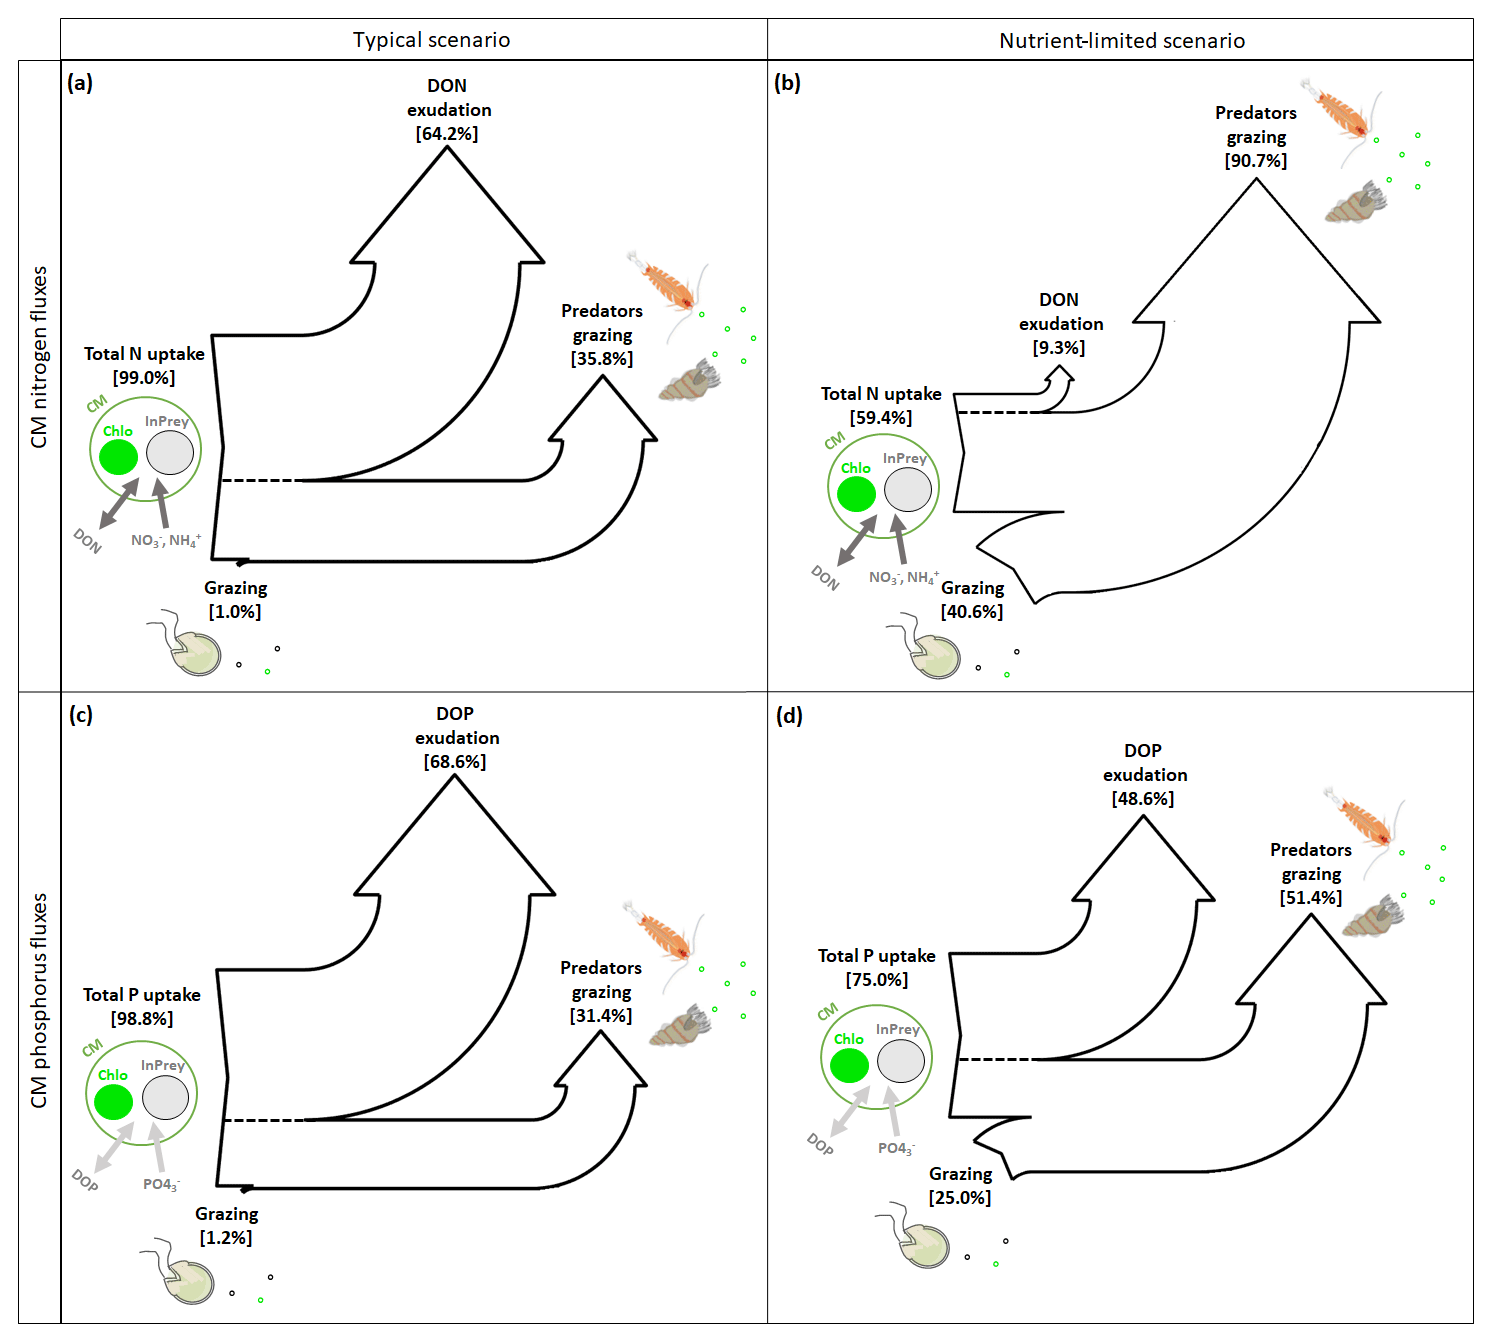
Figure 9Sankey diagrams showing (a, b) nitrogen (N) and (c, d) phosphorus (P) fluxes for CMs in (a, c) typical and (b, d) nutrient-limited conditions. Numbers represent the yearly averaged fluxes. InPrey refers to ingested prey, and Chlo refers to chloroplast. Total N (P) represents the sum of DIN (DIP) and DON (DOP) uptakes.
In nutrient-limited conditions (Fig. 9b and d), the role of grazing has increased substantially and now provides about 40 % of the N and a quarter of the P requirements. Also, the loss terms have changed considerably, with N losses occurring almost exclusively due to grazing (Fig. 9b), while P losses appear to be equally split between DOP exudation and grazing (Fig. 9d).
Our results allowed us to determine the conditions which lead to the emergence of mixotrophs in the BoM. We show that mixotrophs are significantly impacted by nutrient-limited conditions. In addition, the biogeochemical fluxes associated with NCMs and CMs showed that grazing and photosynthesis are strongly dependent on environmental conditions and can provide them with real competitive advantages.
In the following discussion, we decided to focus on CMs as they are significant contributors to overall primary production (33 % of the total photosynthesis is performed by CMs). Moreover, CM mixotrophy can significantly modify C, N, and P fluxes depending on environmental conditions.
4.1 Mixotrophs representation assessment
As biomass measurements were not available for our location, we performed the assessment of these organisms based on properties listed in Table 2. We showed that NCM and CM properties were all well reproduced by the model (Fig. 5). The third NCM property that grazing and irradiance are independent (NCMP3, Table 2) required a constant NCM concentration to be verified (Table 4). When irradiance increases, the NCM concentration increases. This feature is only due to the photosynthesis process, which becomes less limited by light. NCM photosynthesis includes a prey-dependent (i.e. , based on preys' parameters) light limitation function (the closer the function is to 1, the less limited the organisms), which tends towards 1 when irradiance increases. The grazing formulation does not include a term of direct dependence on light but includes NCM biomass, which explains the increase in grazing when NCM biomass is not set to a constant. It seems difficult to avoid this feature as photosynthesis is known to increase up to a certain value of irradiance, which depends on species (Platt et al., 1980; Geider, 2013).
Regardless of the simulation, we modeled a close percentage of C biomass for NCMs (ciliates) and copepods (difference maximum of 6 % Fig. 10a). These percentages are always significantly higher than those of phytoplankton and heterotrophic bacteria. Even if, in the Gulf of Lion and especially in the low-salinity water from the Rhône River, oligotrich ciliates have been found to be abundant (Christaki et al., 2009), we do not exclude that, by only considering copepods as a predator of NCMs, we can underestimate the grazing that occurs on this type of organisms. In the actual model, we do not consider strict heterotrophs which belong to the nano and micro size classes. These organisms can be important competitors of ciliates, and certain species can even consume ciliates (Stoecker and Capuzzo, 1990; Johansson et al., 2004). The adding of these organisms could improve the representation of NCM dynamics and, accordingly, of the ecosystem and will be considered for an improved version of the model. Moreover, we do not consider a mortality term for NCMs. Montagnes (1996) showed that mortality rates for two species of the genus Strombidium and two species of the genus Strombilidium were rapid. Accordingly, adding this term to the model could allow us to represent a more realistic NCM biomass.
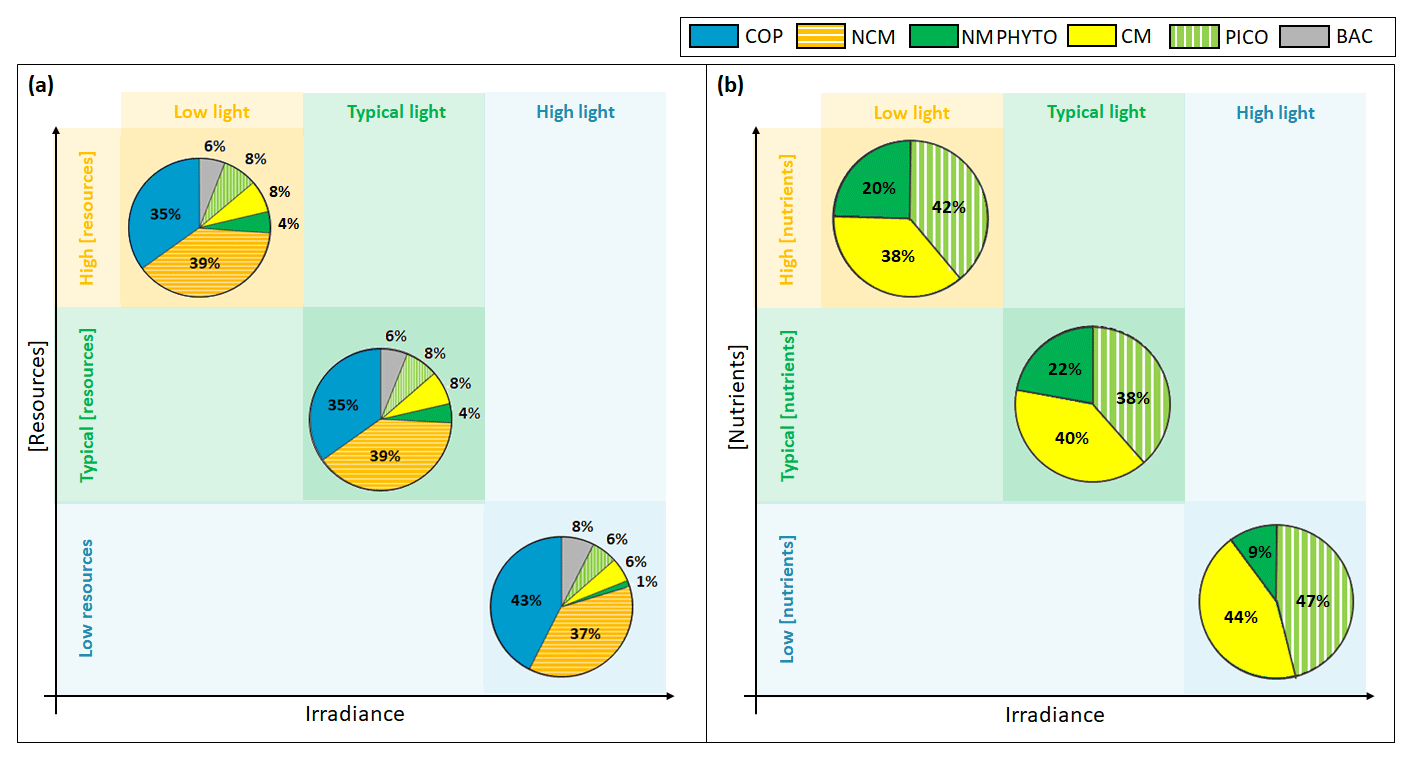
Figure 10Yearly (a) ecosystem and (b) phytoplankton composition in percentages of C biomass in light-limited, typical, and nutrient-limited conditions. The term “resources” stands for both nutrients and prey.
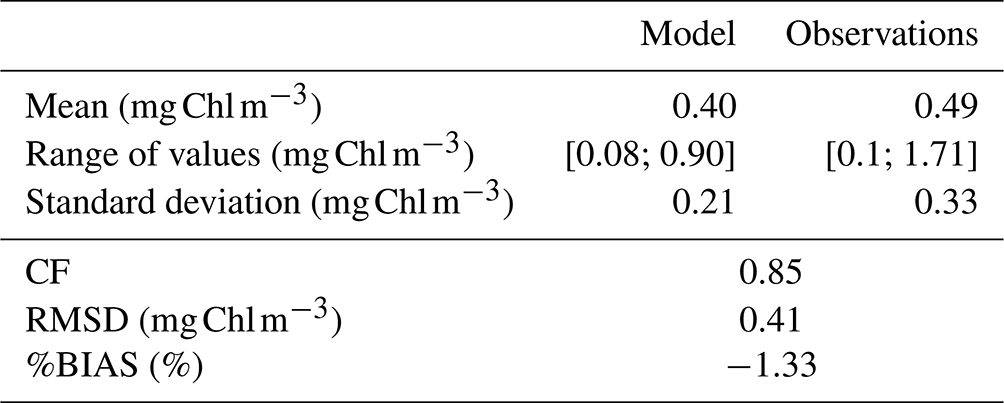
Regardless of the simulation, the CM percentage in C biomass remains close to that of phytoplankton (Fig. 10a). We performed the assessment of phytoplankton for the typical simulation by using SOLEMIO chlorophyll measurements (Fig. 5e, statistical analysis presented in Appendix G). According to statistic indicators, Eco3M_MIX-CarbOx reproduced well the measured chlorophyll (cost function below 1 and a root mean square deviation close to 0). In particular, the model provided values in the same range as observations with a relatively close mean (0.40 for the model and 0.39 for observations). Observed chlorophyll reached a maximum value in mid-March, linked to the Rhône River intrusion, which is not reproduced by the model. This maximum can be linked to an input of allochthonous chlorophyll (i.e., phytoplankton development near the nutrients-loaded Rhône River plume, which is brought to SOLEMIO by currents; Fraysse et al., 2014). As Eco3M_MIX-CarbOx is dimensionless (only time derivation), we do not represent this input, which can explain the fact that we are not able to reproduce this chlorophyll maximum. However, during this event, we reproduced the development and dominance of large cells (NMPHYTO) commonly observed in these cases (Fraysse et al., 2014).
4.2 Impact of limiting factors on ecosystem and phytoplankton composition
4.2.1 Light
In our light-limited scenario, nutrient levels were kept artificially elevated throughout the year to prevent nutrients from becoming limiting and affecting the results. Light limitation had a considerable effect on total C biomass, which was almost halved under low light compared to typical conditions (1192.5 vs. 2016.3 mmol C m−3).
Ecosystem composition remained almost identical between light-limited and typical conditions (Fig. 10a). In fact, light limitation only directly impacts the three phytoplankton groups, while copepods and NCM are only impacted indirectly through the effect of light on their prey. Heterotrophic bacteria do not become light limited in our model (Appendix C).
Considering the fact that nutrients were kept artificially elevated in the light-limited scenario, it is not surprising that CM nutrition is almost entirely based on photosynthesis (99 %, result not shown); i.e., they behaved like strict autotrophs, and their mixotrophy did not represent a competitive advantage in this case. For instance, Stoecker et al. (1997) showed that, in low-light and high-nutrient conditions, the CM Prorocentrum minimum tend to photosynthesize rather than feed on prey as this latter mechanism only becomes relevant when inorganic nutrients are limiting. Thus, in light-limited conditions, the phytoplankton arrangement only depends on the organism's ability to photosynthesize.
Although CM biomass remains high in low light, its share of the pie decreases in favor of NMPHYTO, which seem to gain a slight edge. While the share of NMPHYTO increases slightly under low light, PICO appears to be unaffected (Fig. 10a, b). In this simulation, nutrient levels were kept artificially high to prevent nutrient limitation. By lifting the nutrient limitation, NMPHYTO, which is particularly sensitive to nutrients concentration, can grow more easily. In addition, NMPHYTO includes mainly diatoms, which are known to be advantaged in low-light environments (Fisher and Halsey, 2016). CMs are more affected by low light and are not able to use mixotrophy in these conditions (nutrient concentration is high). The low effect of light on PICO agrees with observations by Timmermans et al. (2005), who showed that, when nutrients are not co-limiting, picophytoplankton still developed well.
The winter mixing event is a useful example that illustrates the impact of light on phytoplankton. During this event, the weather was particularly cloudy, yielding low levels of ambient light and several decreases. These decreases in light level are reflected in the three phytoplankton groups' limitation status, which also decreased (which indicates an increase in limitation) (Fig. 6g).
4.2.2 Nutrients concentration
When nutrients are limiting, the shares of NCMs, CMs, PICO, and NMPHYTO decrease, while copepods and heterotrophic bacteria show a relative increase (Fig. 10a). We found that, when nutrient concentration was low, the ability of NCMs to photosynthesize was particularly useful as it provided nearly half their C uptake (Fig. 8). Nevertheless, NCM yearly total biomass does not exceed that of the copepods (Figs. 7a and 10a). In fact, despite their ability to photosynthesize, NCMs remained highly dependent on prey abundance. To prove this strong dependence of NCMs on their prey, Mitra et al. (2016) performed several simulations involving different planktonic communities such as heterotrophic bacteria, phytoplankton, and NCMs. They found that NCM biomass quickly increased, but once the available prey was consumed, it dropped just as quickly. Due to this strong prey dependency, NCMs cannot dominate the ecosystem throughout the year. Instead, we found that NCM biomass increased in summer (even exceeding copepods, Fig. 7c), right after CM and PICO biomass had increased, which in turn replenished the prey concentration.
Our modeled phytoplankton showed significant reactions to changes in nutrient concentration. While low nutrients led to an almost complete disappearance of NMPHYTO (Fig. 10a), CMs and PICO appeared to handle low nutrient concentrations more easily. On the one hand, PICO are known to be able to cope with nutrient-limited environments more efficiently than larger cells, mainly due to their small size, which results in higher nutrient affinity (Agawin et al., 2000). On the other hand, nutrient limitation allowed CMs to take full advantage of mixotrophy, which allows them to compensate for a lack in DIN and DIP by grazing. Thus, by using two different competitive strategies, both PICO and CMs can tolerate low nutrient conditions, allowing them to become the dominant phytoplankton groups in this scenario. Leles et al. (2018) also found relative increases in CMs when nutrient concentration decreased.
The Rhône River and Cortiou water intrusions are useful examples that illustrate the impact of nutrient concentrations on the ecosystem and phytoplankton compositions. The Rhône River intrusion led to high concentrations, which in turn led to increased NMPHYTO growth, illustrating their high sensitivity to nutrient concentrations. NCM also fared well in this scenario and reached a dominant 39 % of the total C biomass (results not shown). In these conditions, NCM nutrition is mainly based on grazing (75.3 %) due to the high prey concentration, but photosynthesis still represents a high percentage of the nutrition. In fact, some mixotrophic ciliates (e.g., Laboea strobila) are known to be highly dependent on photosynthesis (Stoecker et al., 1988; Sanders, 1991; Esteban et al., 2010). Stoecker et al. (1988) calculated that, in this case, photosynthesis via sequestered chloroplasts could contribute up to 37 % of the ciliate's total carbon demand in resource-rich conditions. The Cortiou water intrusion led to high concentrations, alleviating the nutrient limitation for the three phytoplankton groups, particularly in NMPHYTO (Fig. 6f). In fact, immediately before this intrusion event, the ambient nutrient concentration was very low, which explains the sudden response of phytoplankton. However, NMPHYTO still only represented 15 % of the total phytoplanktonic C biomass at the time (Fig. 6d), indicating that other factors are at play as well. As the Cortiou water intrusion took place during the summer upwelling period, we can hypothesize that temperature also played a role in shaping the phytoplankton composition.
4.3 Mixotrophy as a strategy to overcome nutrient limitation in highly limited environments
Several authors studied the functioning of food webs in oligotrophic environments, including subtropical gyres, which cover about 40 % of the planet's surface and exhibit low production rates (Polovina et al., 2008). Mixotrophy is commonly observed in these gyres and has been recognized as crucial for plankton to survive in these environments (Zubkov and Tarran, 2008; Hartmann et al., 2012; Stoecker et al., 2017). Focusing on the Mediterranean Sea, several authors remarked the omnipresence of mixotrophic organisms (Pitta and Giannakourou, 2000; Christaki et al., 1999; Unrein et al., 2010), highlighting its importance in nutrient-depleted areas. Using observations, Oikomonou et al. (2020) emphasized that mixotrophy was crucial in P-limited conditions and showed that mixotrophic flagellates grazed more on heterotrophic bacteria than the heterotrophic flagellates in these conditions. Moreover, both Oikomonou et al. (2020) and Christaki et al. (1999) observed that adding P to areas with P limitation led to an immediate and pronounced reduction of grazing by mixotrophs. Livanou et al. (2021) drew similar conclusions using a modeling approach, showing that, in a P-limited environment, organisms can meet about 90 % of their P requirements through grazing. This percentage drops to 17 % after P addition as the organisms switch to uptake of DIP.
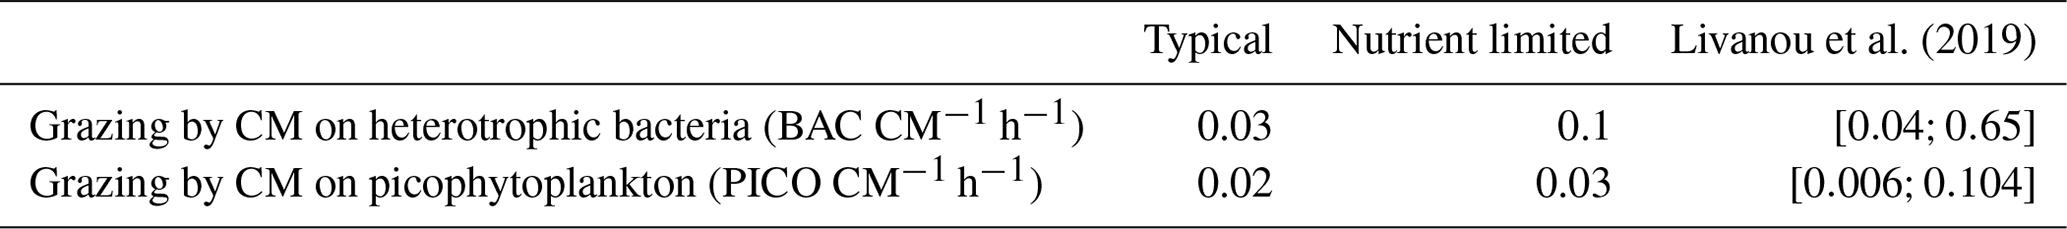
In agreement with these earlier studies, our model results indicated that the grazing component of mixotrophy increased when nutrients became limiting. This increase was significant for N and P as the percentage of grazing in the nutrition of CMs was 40-fold higher for N and 25-fold higher for P. Despite these increases, the grazing percentages for P predicted by our model were still 3.5 times lower than the values in Livanou et al. (2021). In fact, in our nutrient-limited simulation, CM were mainly limited by N, which explains why limitation had an even more pronounced effect on N fluxes. We can assume that, when CMs are mainly limited by P, the effect on P fluxes is more pronounced. Moreover, while we defined mixotrophy as the capability of a cell to use photo- and phagotrophy, other forms of mixotrophy exist in the ocean, e.g., osmotrophy, which denotes an organism's ability to feed on dissolved organic compounds. Osmotrophy has been observed in a large variety of organisms and appears to be ubiquitous among phagotrophic phytoplankton (Sanders, 1991; Burkholder et al., 2008). Our model can account for two forms of CM mixotrophy, namely prey ingestion and DON and/or DOP uptake when DIN and/or DIP become limiting. In the nutrient-limited simulation, CM osmotrophy represented a significant part of their N uptake as 43 % originated from DON. In the typical scenario, this percentage dropped to 20 %, which highlights the importance of osmotrophy as a source of N in low-nutrient conditions. These results agree with observations, which showed that osmotrophy can be a significant source of N and P for some microorganisms (Graneli et al., 1999; Lewitus, 2006). Also some HAB species obtained about 35 % of their N uptake from DON (Glibert and Legrand, 2006). In contrast to the increase in grazing to supplement N and P nutrition in nutrient-limited conditions, C uptake due to grazing remained low, but still CM grazing fluxes on heterotrophic bacteria and PICO remained in the same ranges as observed by Livanou et al. (2019) for the ultra-oligotrophic eastern Mediterranean Sea (Table 6). Other fluxes in C and especially DOC exudation were affected by the change in nutrient concentrations. DOC exudation reached about 56 % of the total C losses in nutrient-limited conditions, which is close to the percentage obtained by Livanou et al. (2021) for DOC exudation before P addition (59 %). In low-nutrient conditions, a small part of the C taken by CMs was provided by grazing on heterotrophic bacteria. This C is released to the environment as DOC as CMs are unable to use organic C from their prey. The remaining C is provided by photosynthesis, but due to the low internal N:C and P:C ratios, CMs release a large part to the environment as DOC. This released DOC can be used by heterotrophic bacteria unless they are limited by N and/or P (Thingstad et al., 1997).
Table 6Comparing modeled yearly CM grazing rates from the typical and nutrient-limited scenarios to observations obtained by Livanou et al. (2019).
4.4 Why is it important to consider mixotrophy?
An increasing number of studies have been investigating the impact of mixotrophs on their environment and were able to highlight the crucial role played by these organisms in the food web (Mitra et al., 2016; Ward and Follows, 2016; Ghyoot et al., 2017; Stoecker et al., 2017). For instance, once Ward and Follows (2016) started to consider mixotrophs in their food web model, the biomass maximum switched to larger organisms, which in turn led to an increase in carbon export to depth due to the production of larger carbon-enriched detritus. Still using a modeling approach (MIRO model), Ghyoot and al. (2017) investigated the impact of the introduction of three forms of mixotrophy (osmotrophy, non-constitutive mixotrophy, and constitutive mixotrophy) on trophic dynamics in the southern North Sea. They showed that these three types of mixotrophy have different impacts on system dynamics: while results showed that constitutive mixotrophy did not significantly affect the functioning of the ecosystem, osmotrophy increased gross primary production (GPP), sedimentation, and bacterial production, and non-constitutive mixotrophy also increased remineralization and transfer to higher trophic levels under high irradiance. Mixotrophy was also shown to play an important role in harmful algal blooms (Kempton et al., 2002; Burkholder et al., 2008). Accordingly, the need for developing models which include mixotrophy to represent and predict such events has been raised by several authors (Burkholder et al., 2008; McGillicuddy Jr., 2010; Mitra and Flynn, 2010; Flynn and McGillicuddy, 2018). Moreover, as climate and anthropogenic changes could disrupt ecosystem functioning, some authors have highlighted that mixotrophs would occupy a central place in future ecosystems. Mitra et al. (2014) indicated that, under future conditions of increased water column stability and changed nutrient regimes, mixotrophs would have an increasing competitive advantage over strict autotrophs and heterotrophs.
Despite the central role that mixotrophs could play in ecosystems of the future, only a few studies have investigated the impact of environmental forcings on these organisms. While some authors used in situ observations, mainly mesocosm experiments, to study the impact of light (Ptacnick et al., 2016), temperature (Wilken et al., 2013), or a specific nutrient such as (Oikonomou et al., 2020), others have chosen the modeling approach to be able to study a wider range of parameters. For instance, Leles et al. (2018) investigated the impact of light and nutrients on mixotrophs and on their strict autotrophic and heterotrophic competitors' modeling. They showed that changes in light and nutrients resulted in significant changes in ecosystem composition: while strict autotrophs and heterotrophs increased in relative importance in the transition from nutrient to light limitation, nutrient-poor conditions favored the development of mixotrophs. Still using modeling, Schneider et al. (2021) investigate the hypothesis that the biogeochemical gradient of inorganic nutrients and suspended sediment concentrations drives the observed occurrence of constitutive mixoplankton in the Dutch southern North Sea. They showed that dissolved inorganic phosphate and silica concentrations drive the occurrence of constitutive mixoplankton. Due to the scarcity of measurements and the lack of spatial coverage, modeling approaches appear to be a viable and necessary alternative to gain further insight into mixotroph activity (particularly photosynthesis and grazing rates) and abundance, as well as more detailed descriptions of mixotroph characteristics, which can be used for model validation, as was done here.
In the present work, we provided a relatively simple model (reduced number of compartments, 0D reasoning) to represent mixotrophy in the BoM. Even though we showed that we reproduced well the two types of mixotrophs modeled (all properties from Stoecker, 1998, were verified), Eco3M_MIX-CarbOx could still be improved. When developing Eco3M_MIX-CarbOx, we considered a simplified food web with a reduced number of compartments; consequently, we made the choice to not consider strict heterotrophs which belong to the nano and micro size classes. This choice can affect the representation of NCM biomass as these organisms are known to compete with ciliates for resources. Some species can even ingest ciliates (Stoecker and Capuzzo, 1990; Johansson et al., 2004). Moreover, in the current version of the model, we do not take into account the possible increasing metabolic cost associated with mixotrophy (i.e., maintenance of both autotrophic and heterotrophic apparatus). Raven (1997) suggested that the cost of maintaining phagotrophic apparatus for a primarily phototrophic organism remain low, but the cost of maintaining a phototrophic apparatus for a primarily phagotrophic organism can be significant and often results in lower growth rates than strict heterotrophs. It might be interesting to consider this as it could improve the representation of the NCM biomass.
For the particular location studied here, the Bay of Marseille (BoM), Eco3M_MIX-CarbOx is the first biogeochemical model to include an explicit compartment for mixotrophy in its representation of the food web. Eco3M_MIX-CarbOx used variable stoichiometry, which allowed us to determine the nutritional state of the cell, including potential nutrient limitation. This feature is even more important in the BoM where nutrient limitation has been shown to alternate between N and P several times during the year (Fraysse et al., 2013). We provided new insights regarding the conditions that lead to the emergence of mixotrophs in the BoM. Especially, we showed that, in the BoM, mixotrophy could represent a significant advantage when nutrients were limiting, particularly for CMs. Even though Eco3M_MIX-CarbOx was developed and used in the BoM, it is easily adaptable to other coastal environments if environmental forcings are provided. This feature makes it a particularly suitable tool to perform long-term studies and prediction of mixotrophy dynamics in coastal environments.
In this study, we focused on the representation of mixotrophs in the model and on elucidating how different nutrient and light regimes affected the balance between mixotrophic uptake processes. However, other factors such as temperature and pH could also affect mixotrophs (Wilken et al., 2013; Razzak et al., 2015). Considering the effect of global change on these environmental forcings, it seems imperative to gain a better understanding of their effects on mixotrophs. Moreover, a modeling approach is particularly relevant to conduct when it comes to long-term studies and especially forecasts. As a next step, Eco3M_MIX-CarbOx will be coupled to a 3D hydrodynamic model, which will allow us to study the effect of mixotrophs on the carbonate system, as well as the impact of changes in the carbonate system on the emergence of mixotrophs. More generally, the coupled model should enable us to study the impacts of climate change on coastal ecosystem composition and on C fluxes.
Here, we developed a new dimensionless biogeochemical model, Eco3M_MIX-CarbOx v1.0, to simulate the food web using variable stoichiometry in order to investigate the impact of light and nutrient limitations on the structuring of the planktonic ecosystem in a Mediterranean coastal area: the Bay of Marseille, France (BoM). In addition to the typical compartment for zooplankton, phytoplankton, and heterotrophic bacteria, Eco3M_MIX-CarbOx also contains a newly developed compartment to represent two types of mixotrophs: non-constitutive mixotrophs (NCMs) and constitutive mixotrophs (CMs). Due to the scarcity of actual measurements, we used the conceptual models from Stoecker (1998) to assess whether our model successfully reproduced the defining characteristics of mixotrophs. This could be demonstrated through a series of simulations involving changing light, nutrient, and prey regimes in which the physiological traits of NCM and CM, were well reproduced by our model. We also ran a set of simulations to investigate (i) the evolution of phytoplankton composition in typical light and nutrient conditions for the BoM, and especially during winter mixing and a Rhône River and Cortiou water intrusion; (ii) the evolution of the ecosystem composition under light- and nutrient-limited conditions; and (iii) the evolution of C, N, and P fluxes of NCMs and CMs once nutrients became limiting. During the Rhône River and Cortiou water intrusions, phytoplankton composition was mostly affected by changes in nutrient concentrations associated with these events. During the winter mixing event, variability in nutrients and light availability affected the organisms. Comparing the effects of light and nutrient limitation, nutrients had a more significant effect on ecosystem composition than light, although the limitation of either resource resulted in a decrease in overall C biomass. Regarding mixotroph dynamics, the following trends emerged: (i) the portion of the ecosystem in percentage of C biomass occupied by NCM decreased when resources (prey and nutrients) decreased, and (ii) the portion of the ecosystem in terms of the percentage of C biomass occupied by CMs increased when nutrients decreased. We showed that, when resource concentrations decreased, the contribution of photosynthesis to the C uptake of NCMs increased, allowing them to maintain a carbon biomass almost as significant as that of the copepods despite limiting conditions. When nutrients decreased, CM strongly increased the grazing component of their N and P uptake (by factors of 40 and 25, respectively). These results agree with previous studies, which have shown that mixotrophy can represent a real competitive advantage in low-nutrient (resource) conditions.
This work also provided new insights regarding the conditions that lead to the emergence of mixotrophs in the BoM. On a more general note, the model represents a new tool to perform long-term studies and predictions of mixotroph dynamics in coastal environments, particularly under different environmental forcings caused by global change where mixotrophs are expected to play a central role in future ecosystems. It is therefore important to gain a better understanding of how these organisms will respond to future light, nutrient, temperature, and pH scenarios, for example.
Table A1Summery of state variables description and initial condition values.
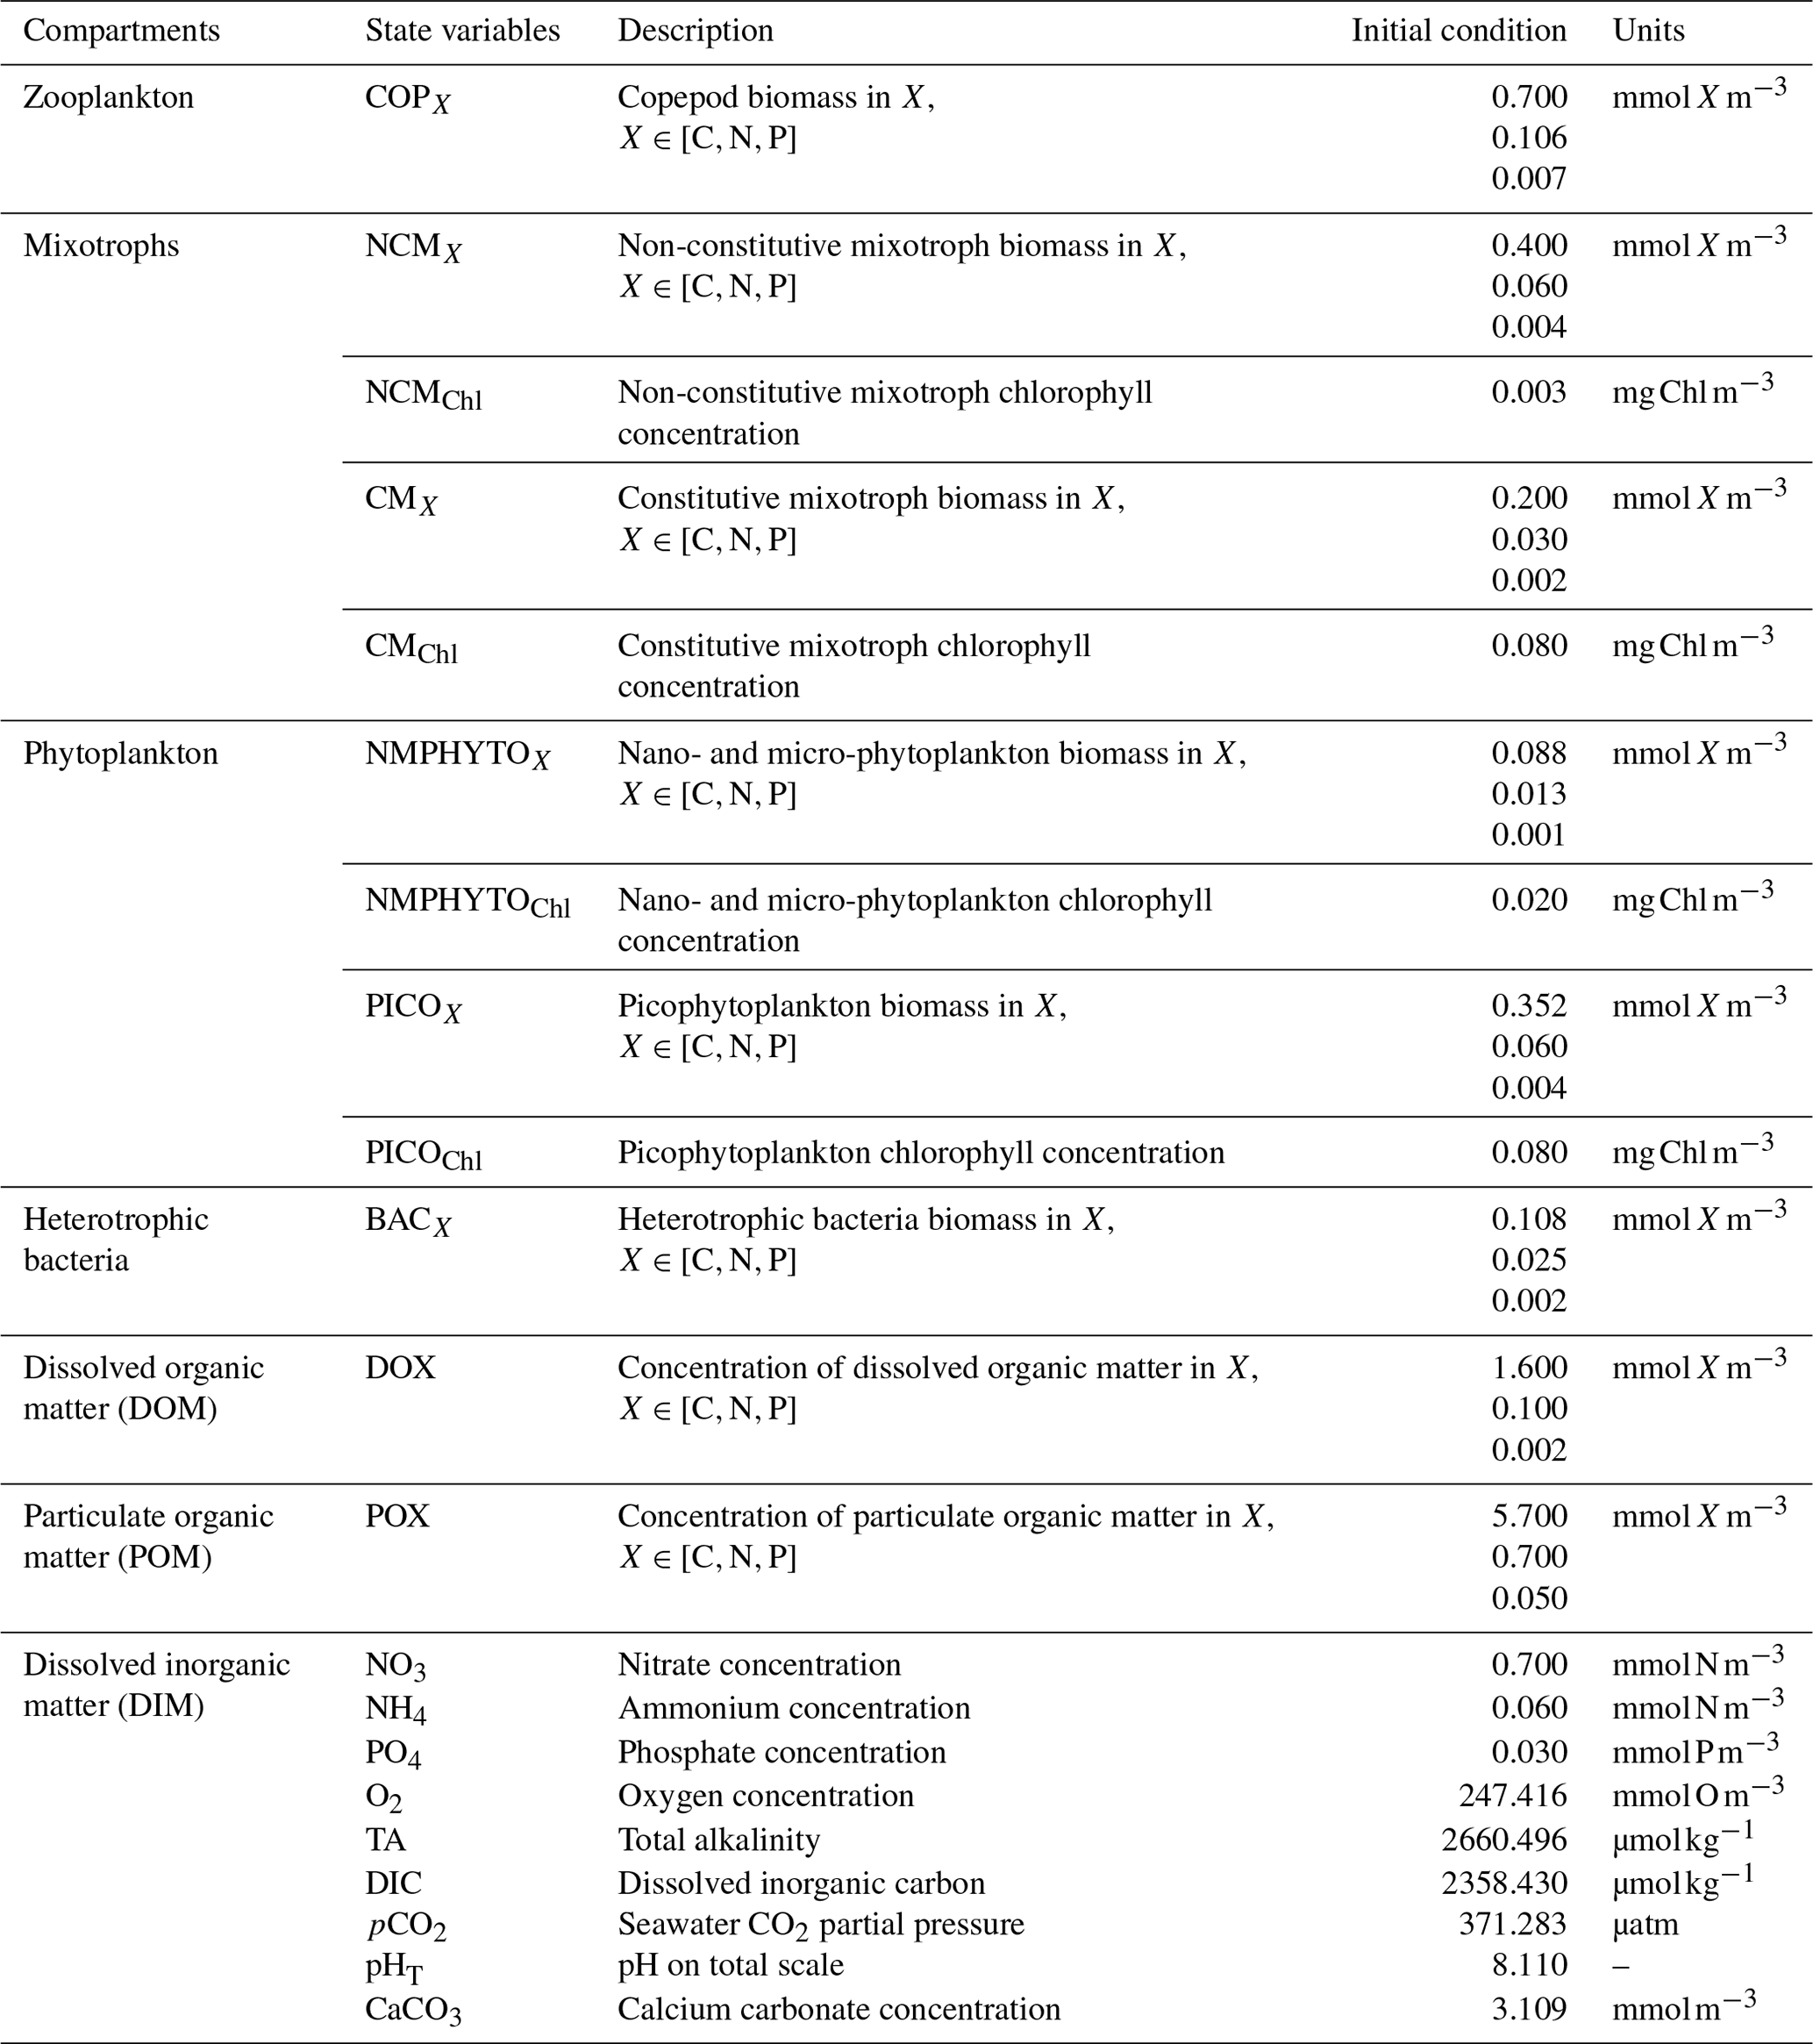
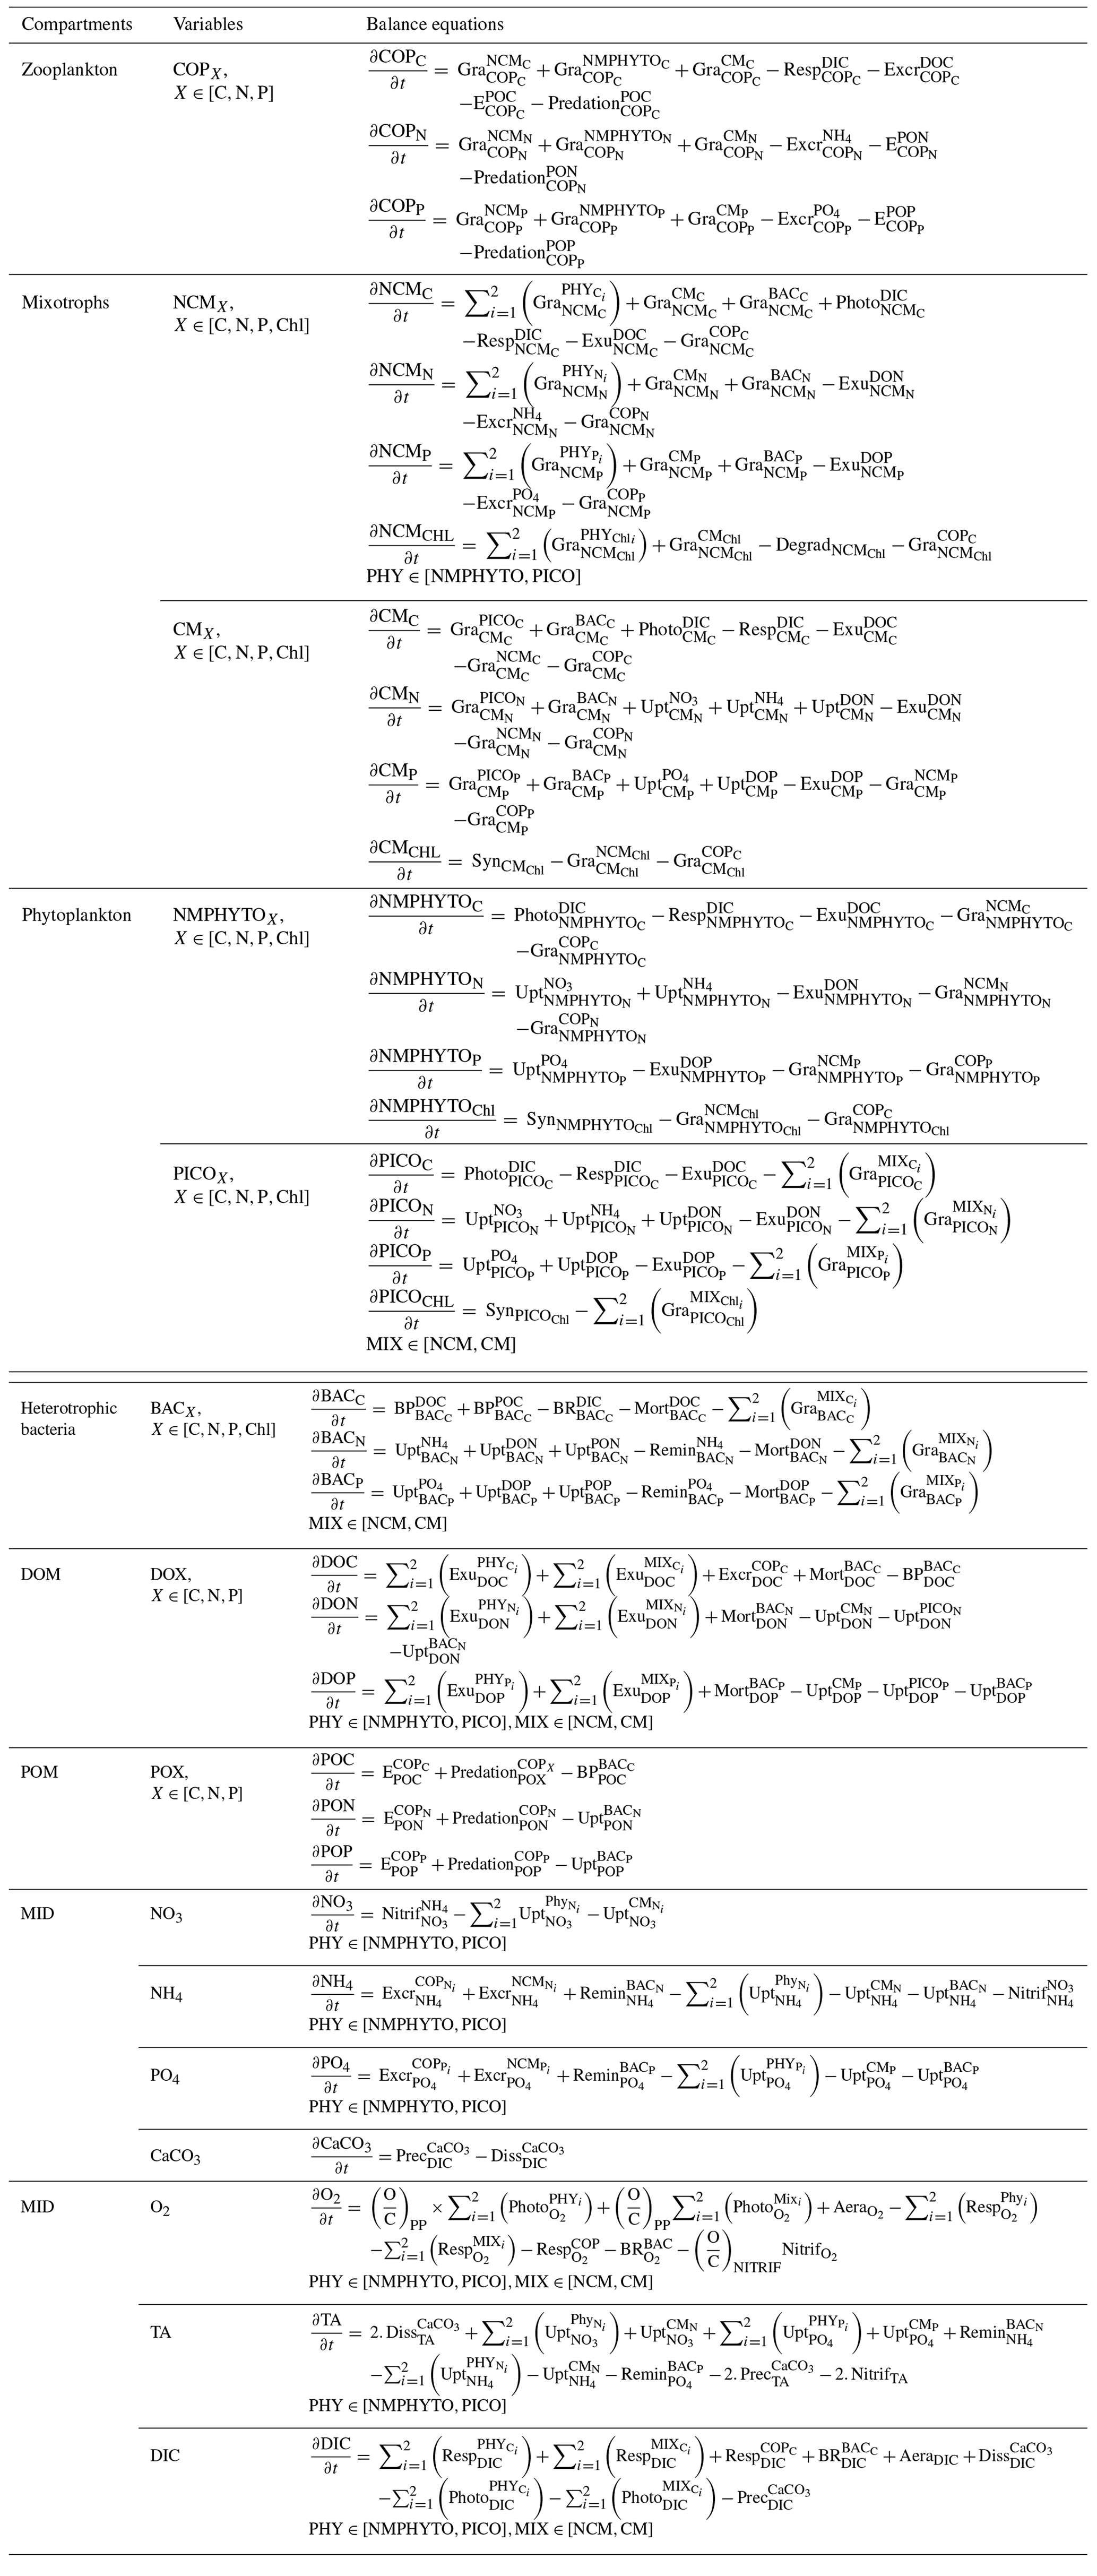
Table C1Biogeochemical processes simulated by Eco3M_MIX-CarbOx for zooplankton.
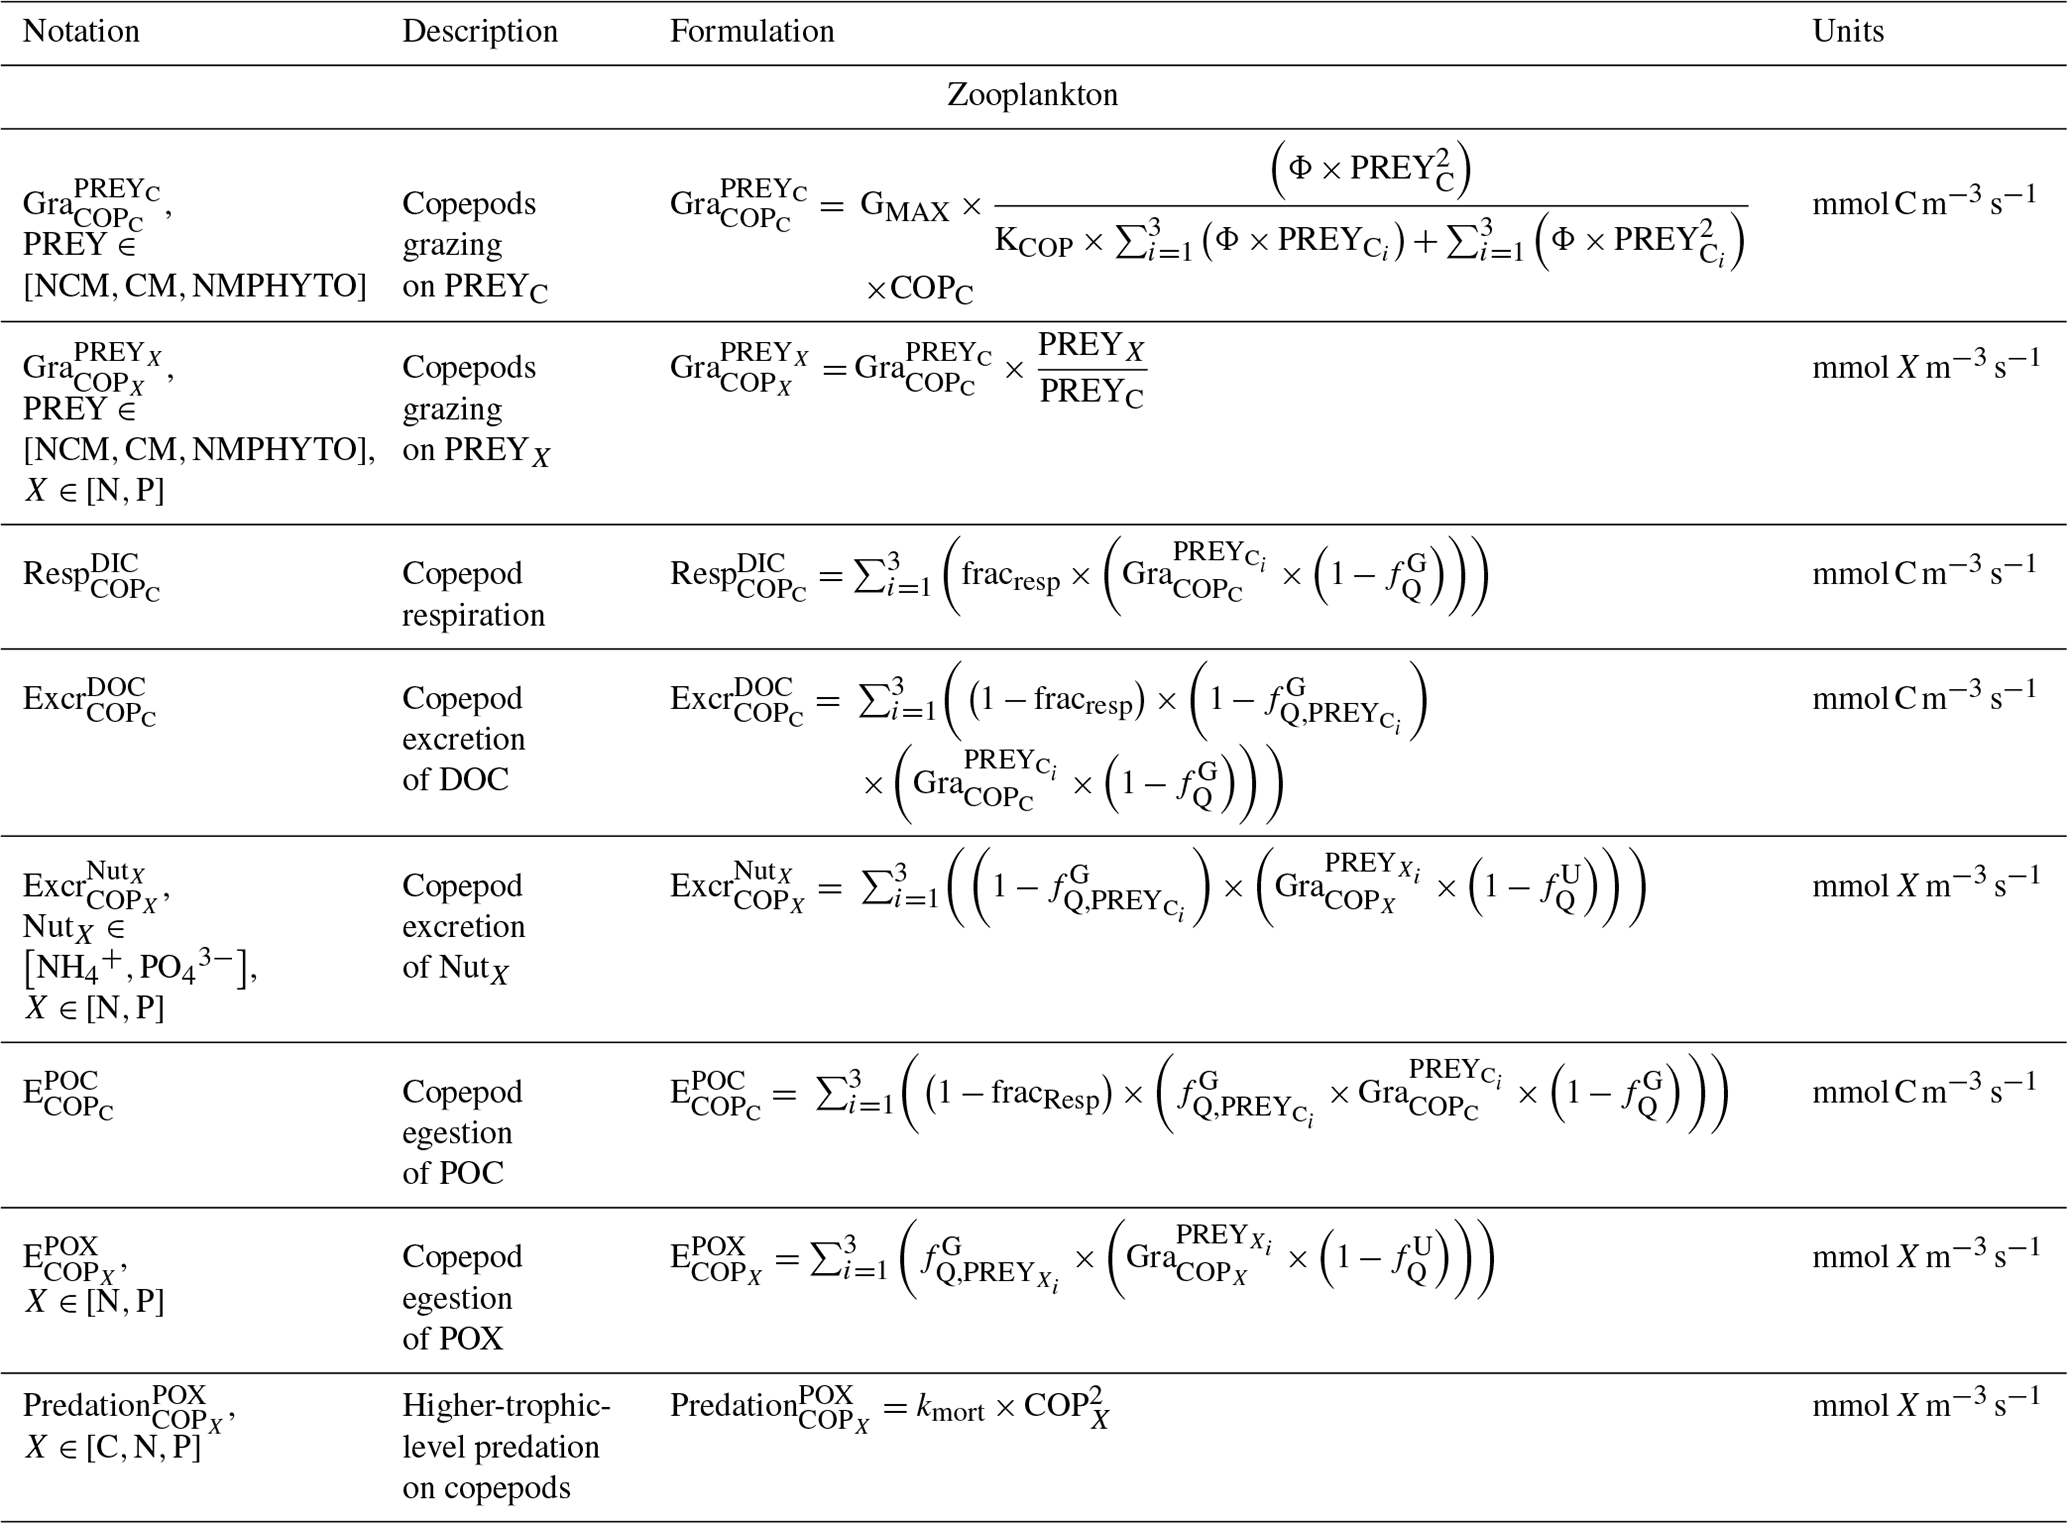
Table C2Biogeochemical processes simulated by Eco3M_MIX-CarbOx for non-constitutive mixotrophs.
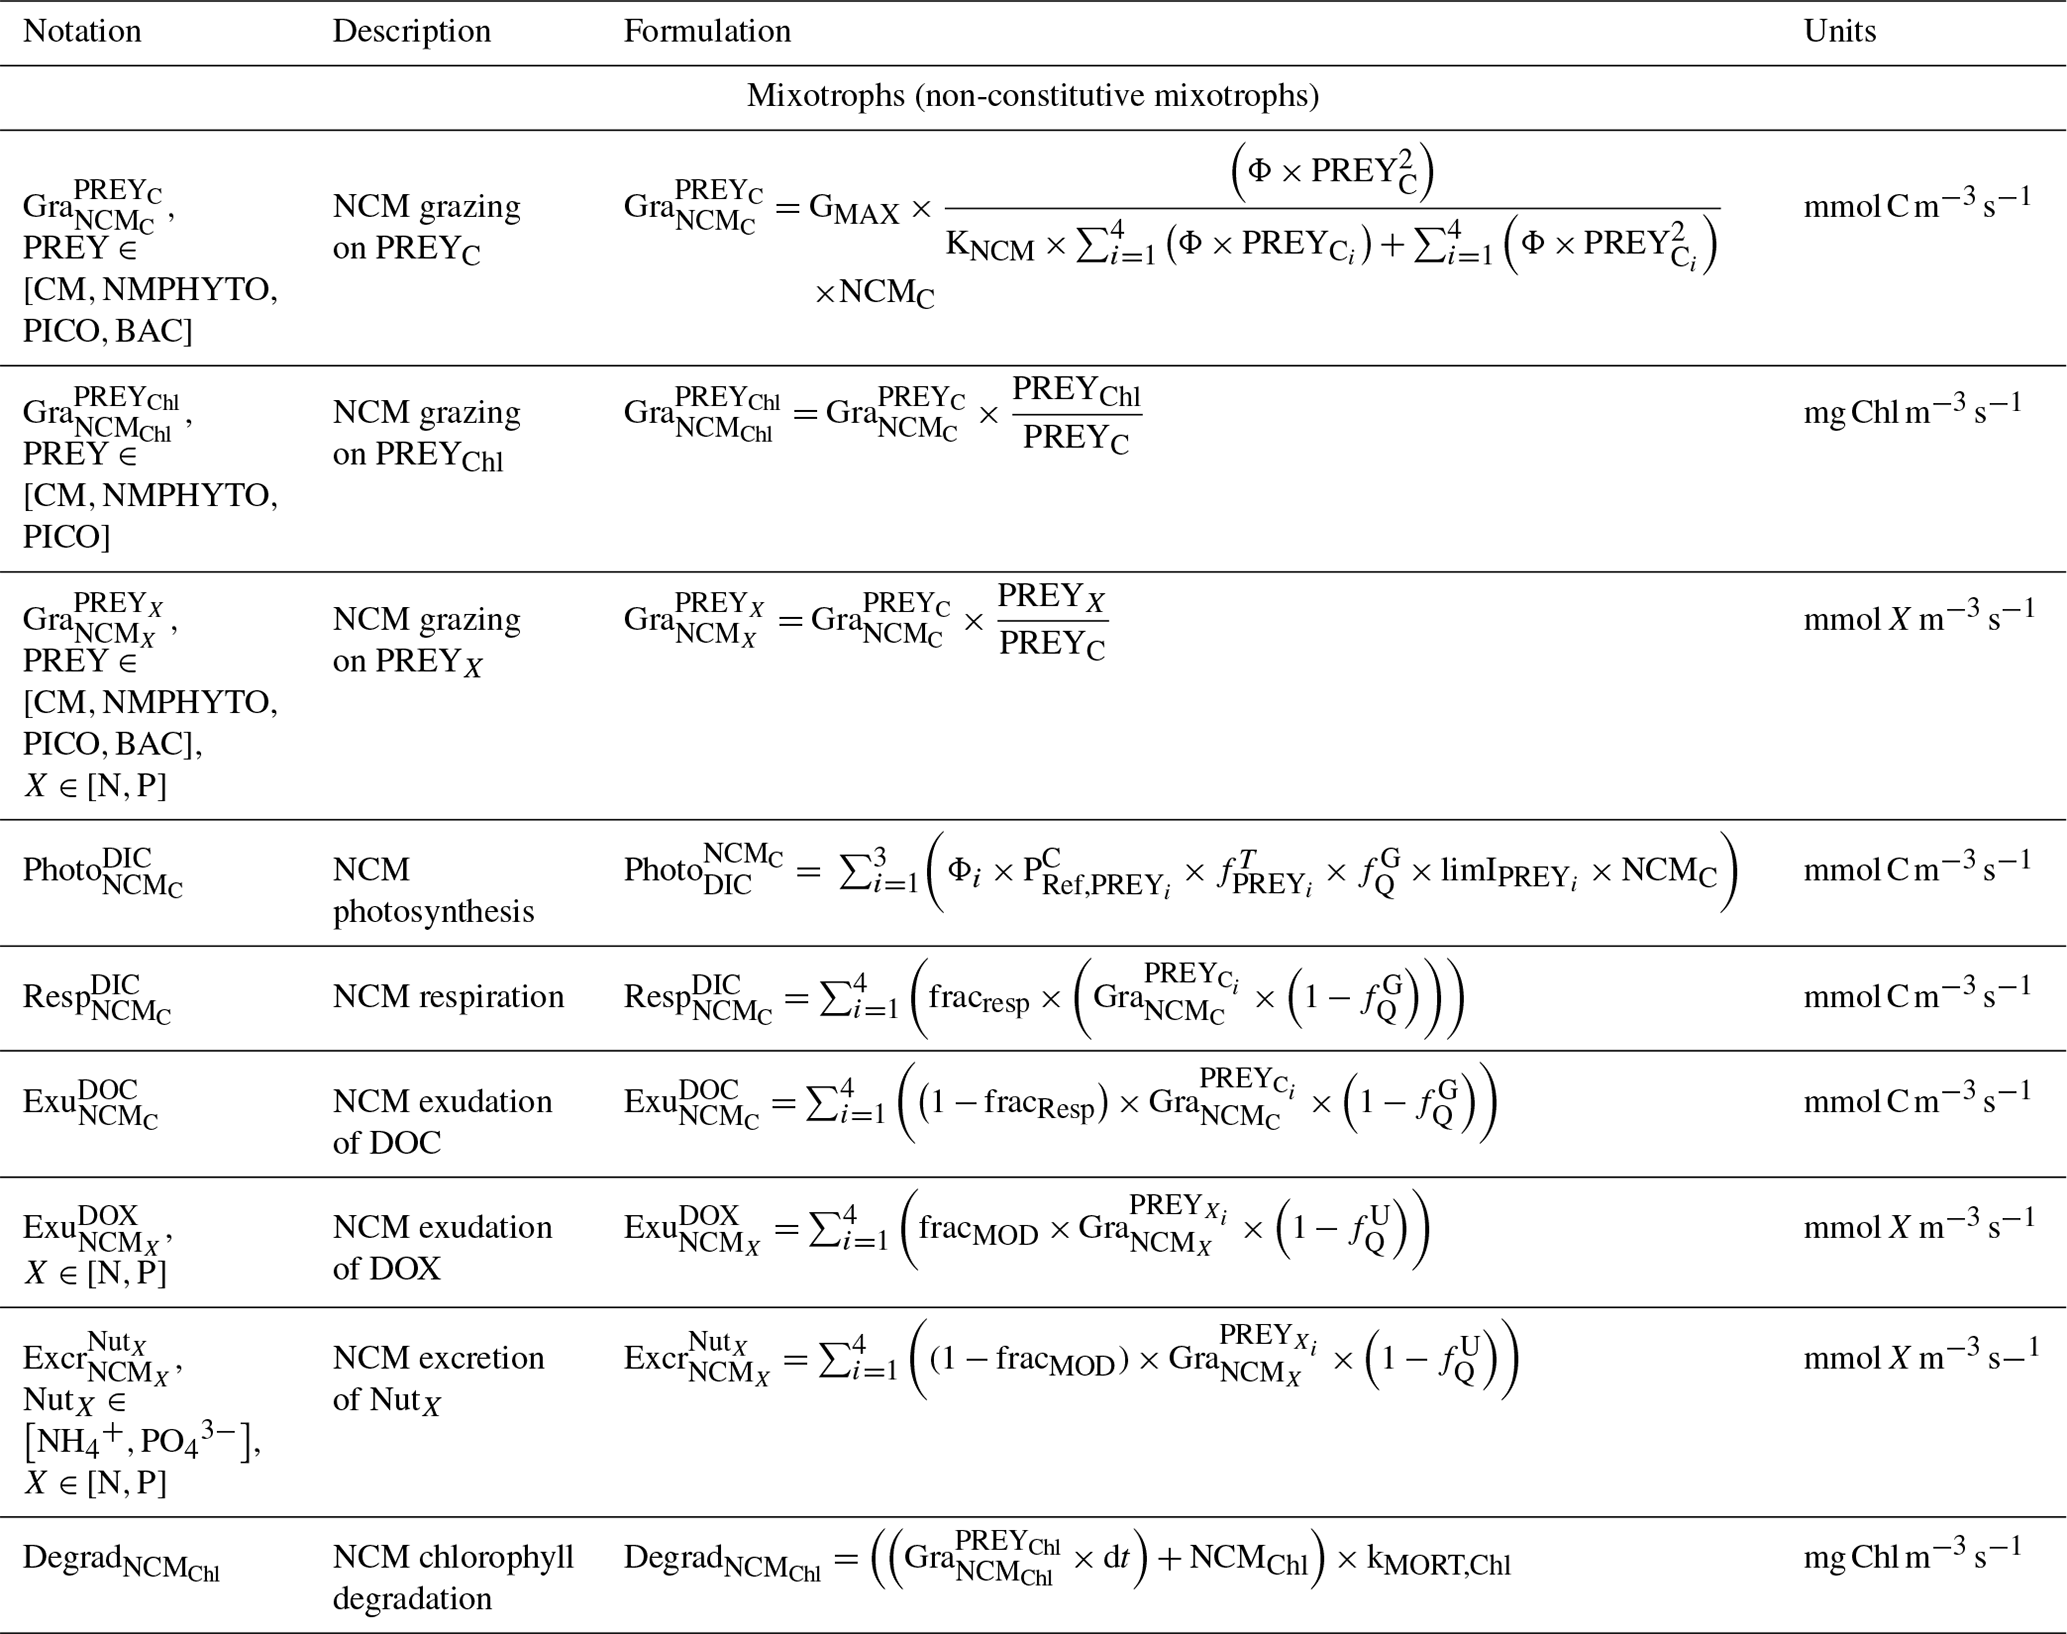
Table C3Biogeochemical processes simulated by Eco3M_MIX-CarbOx for constitutive mixotrophs.
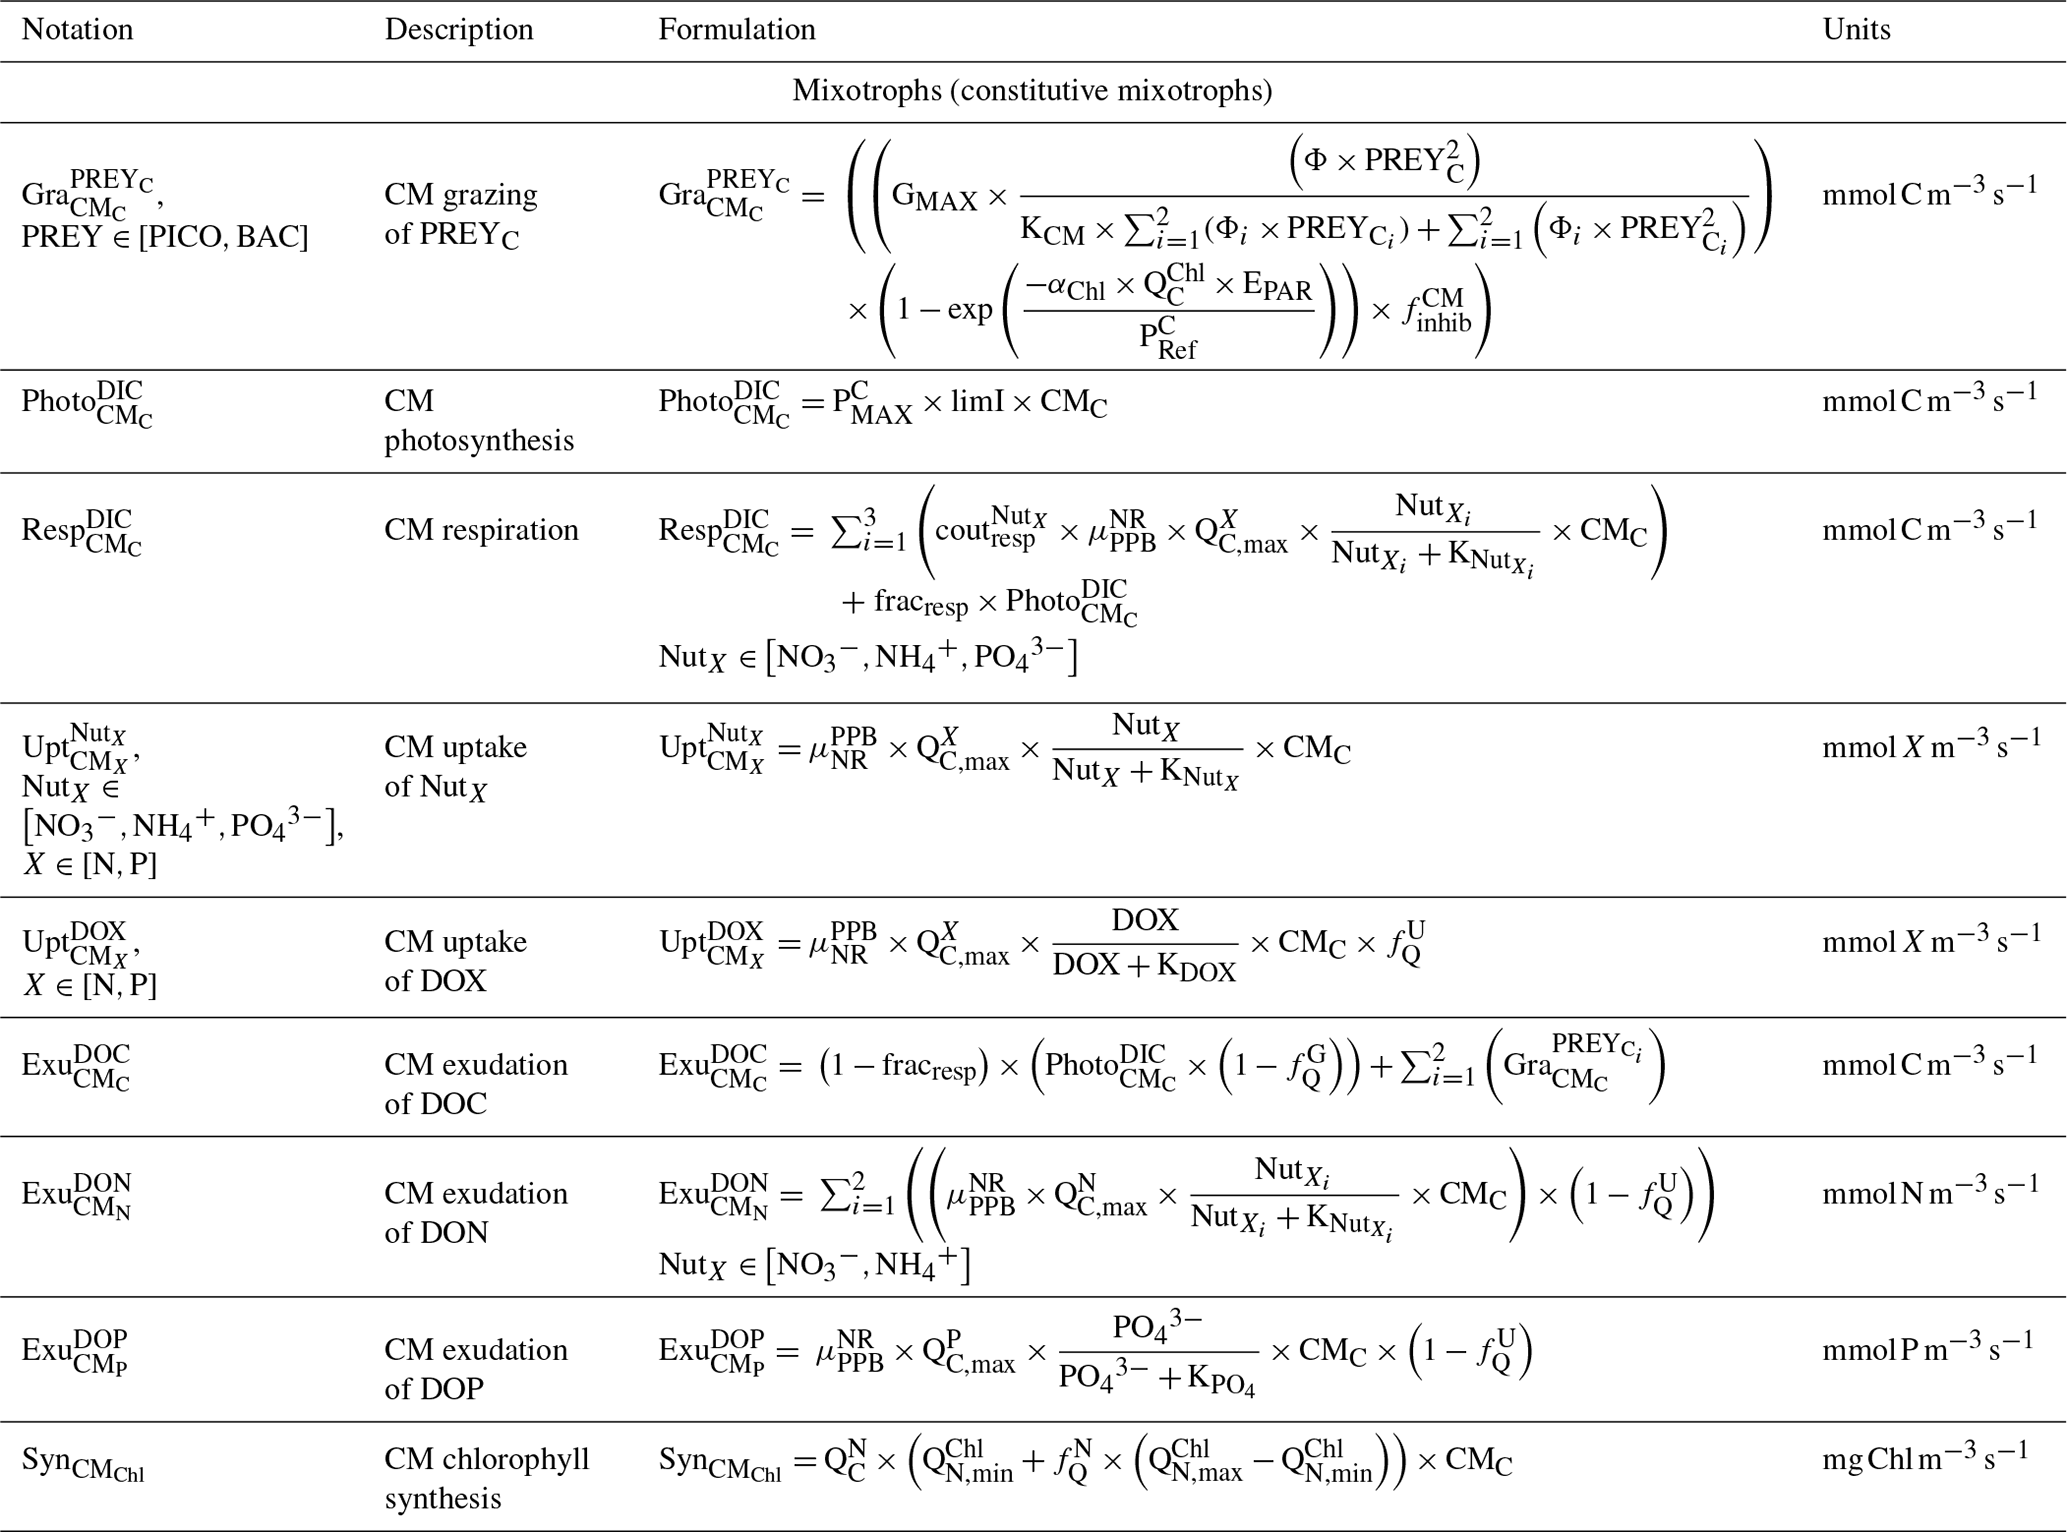
Table C4Biogeochemical processes simulated by Eco3M_MIX-CarbOx for phytoplankton.
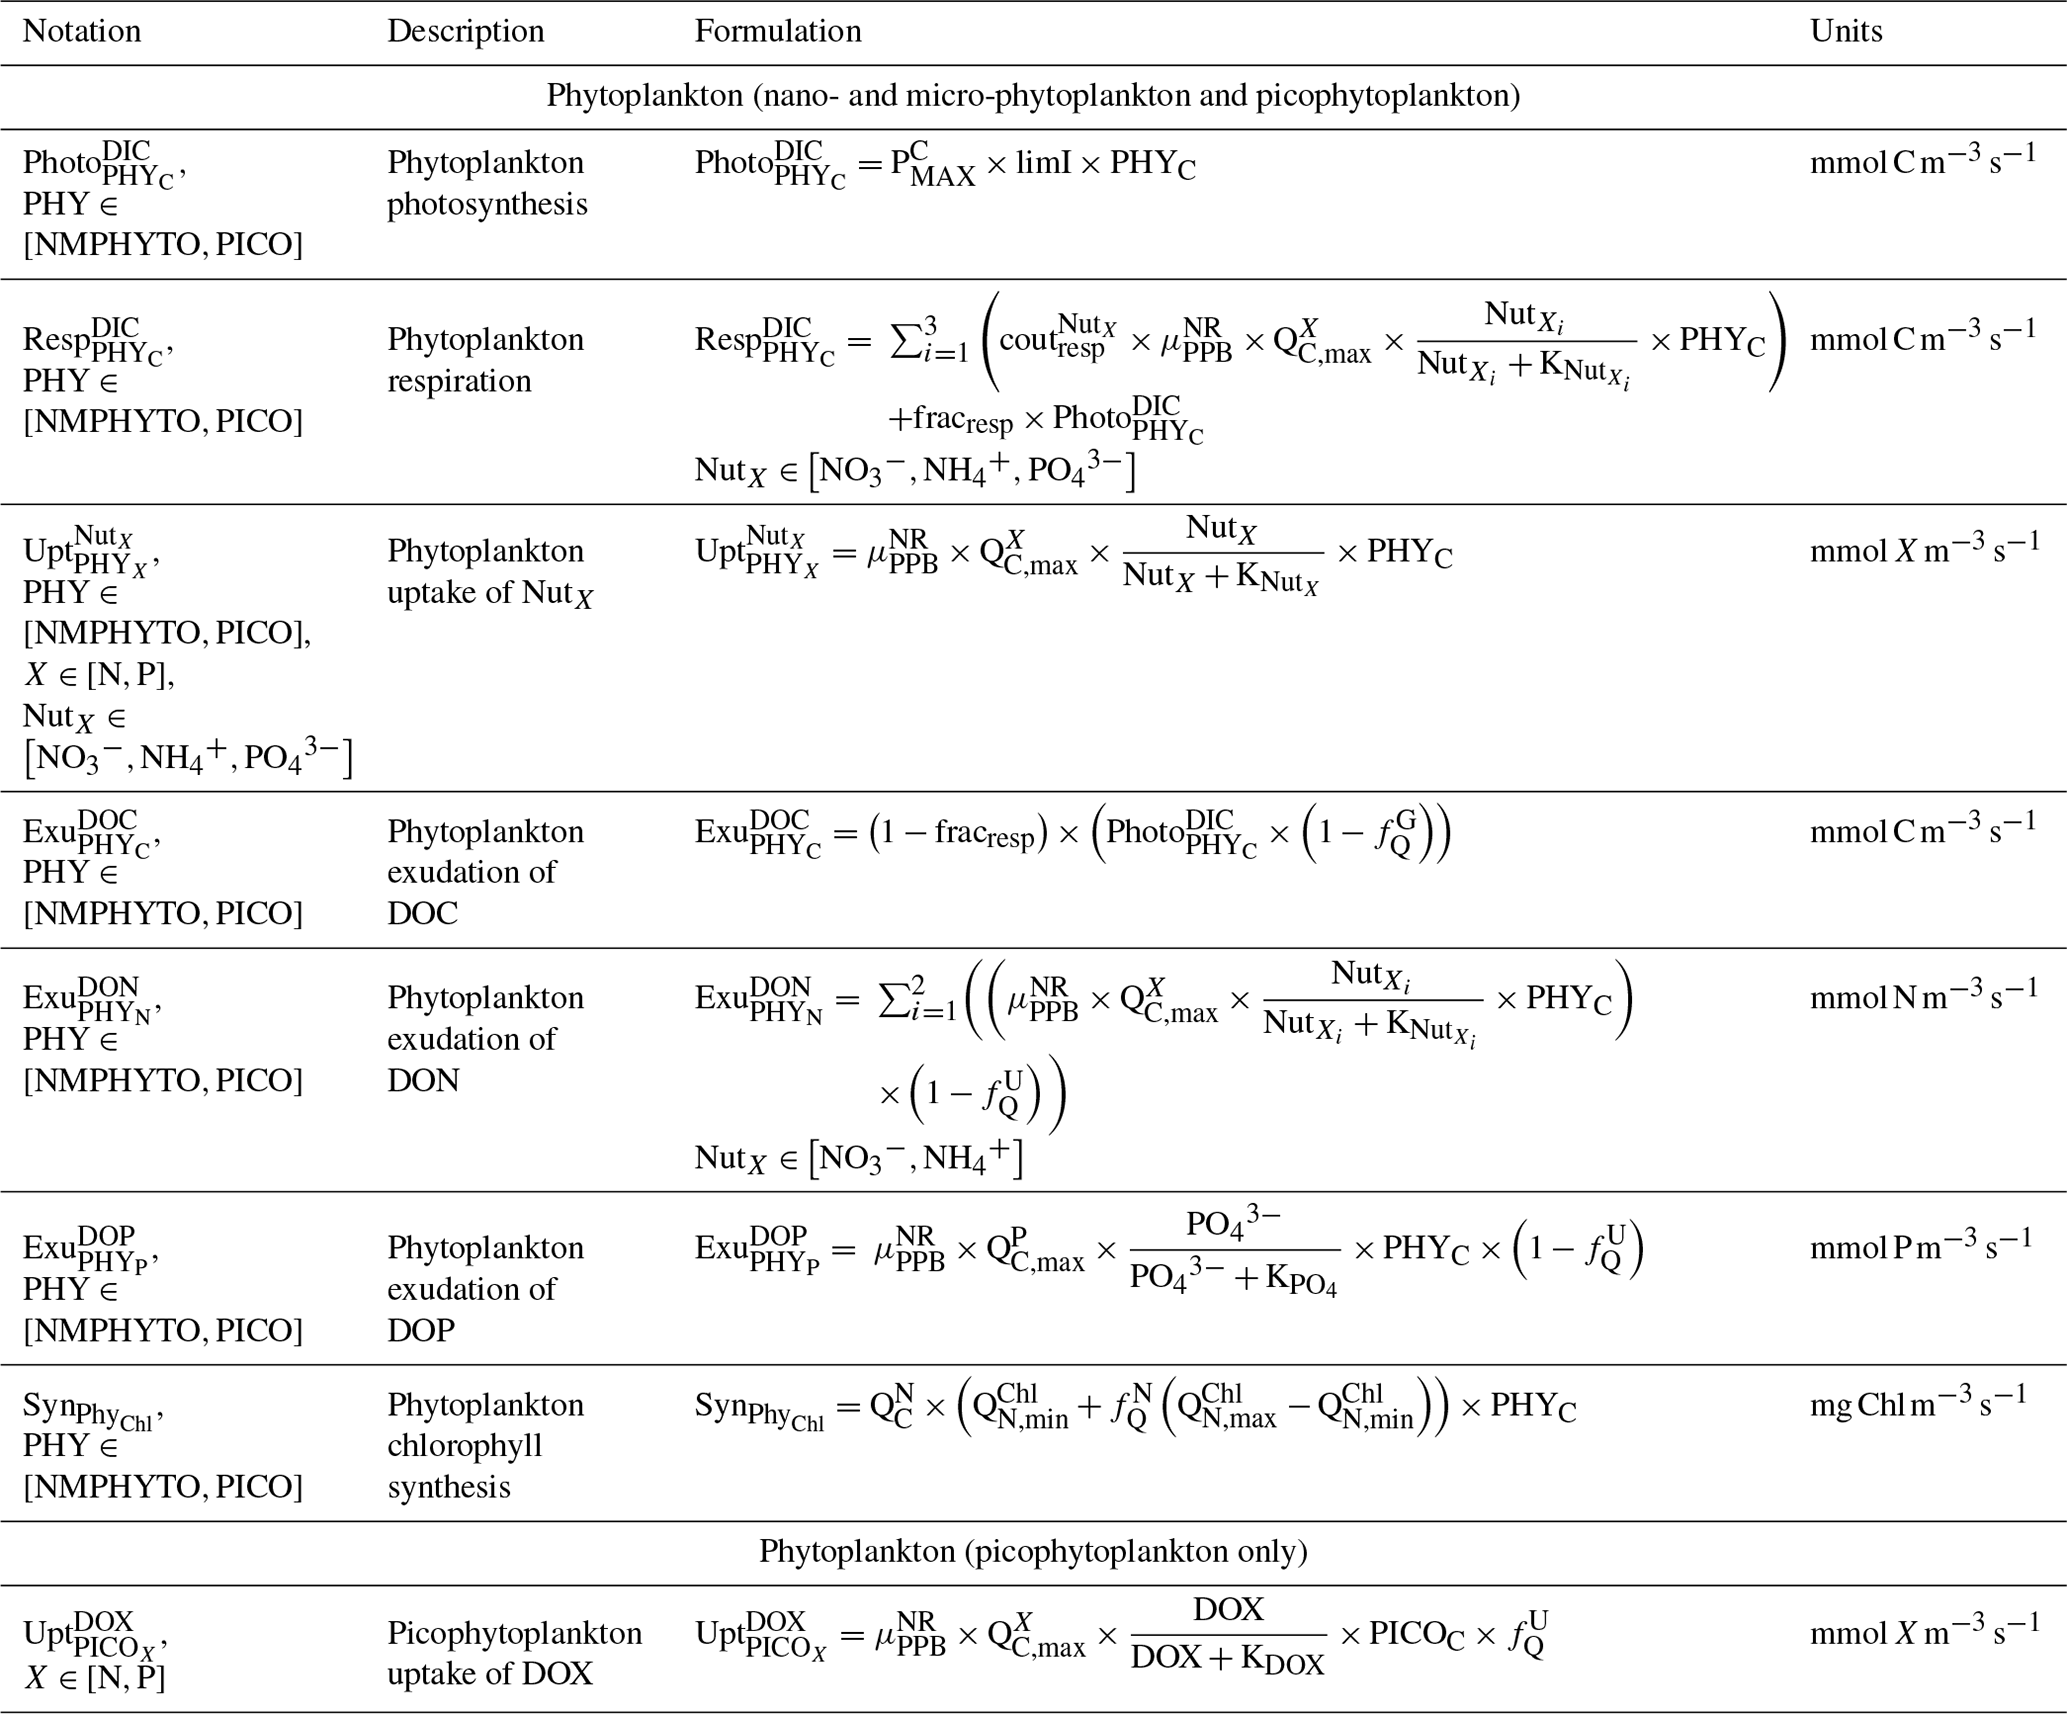
Table C5Biogeochemical processes simulated by Eco3M_MIX-CarbOx for heterotrophic bacteria.
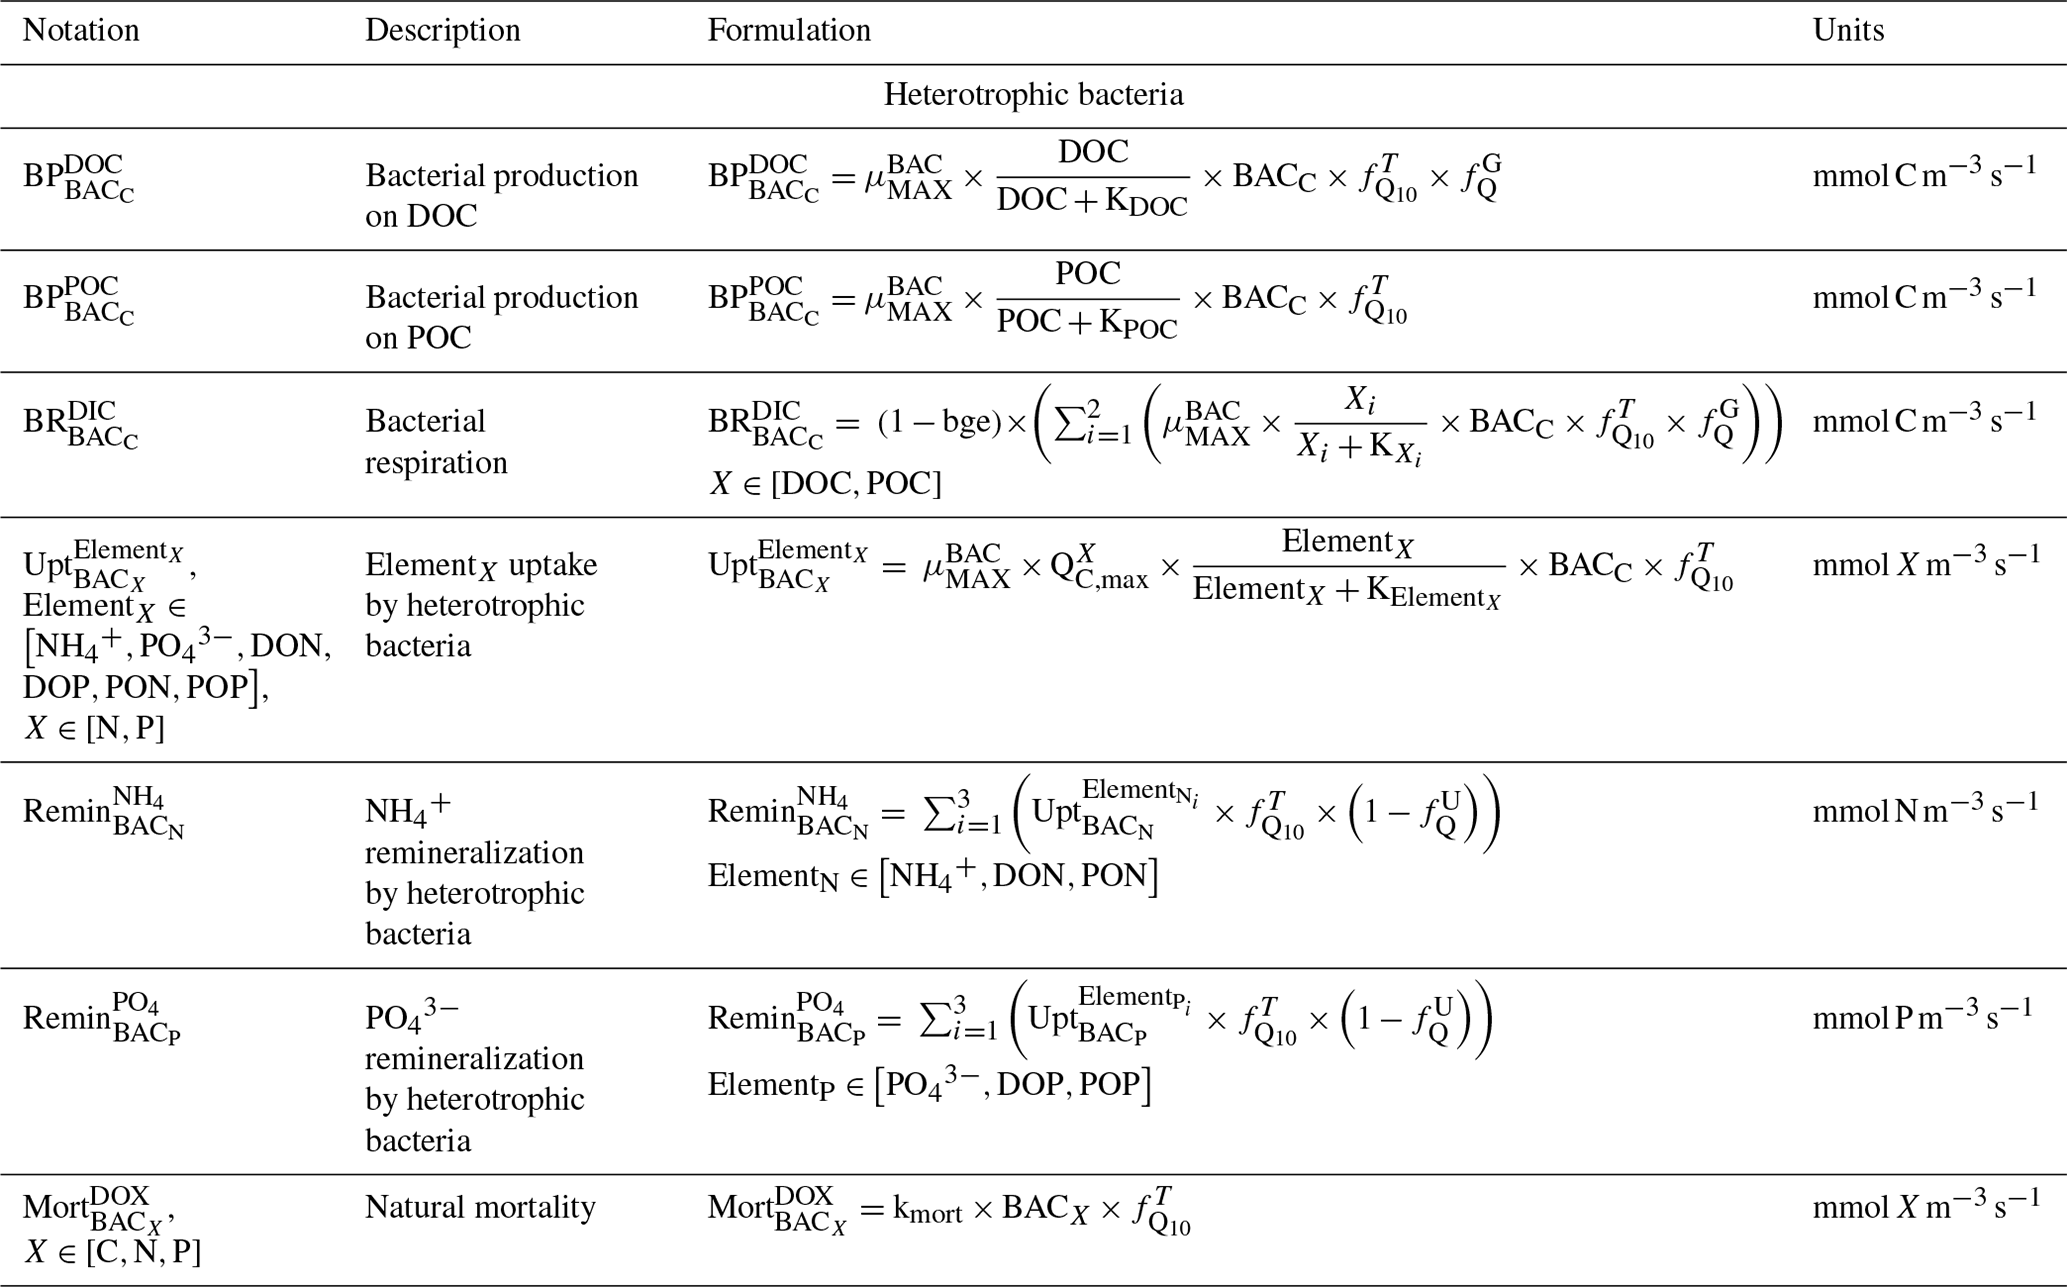
Table C6Biogeochemical processes simulated by Eco3M_MIX-CarbOx for dissolved inorganic matter (DIM).
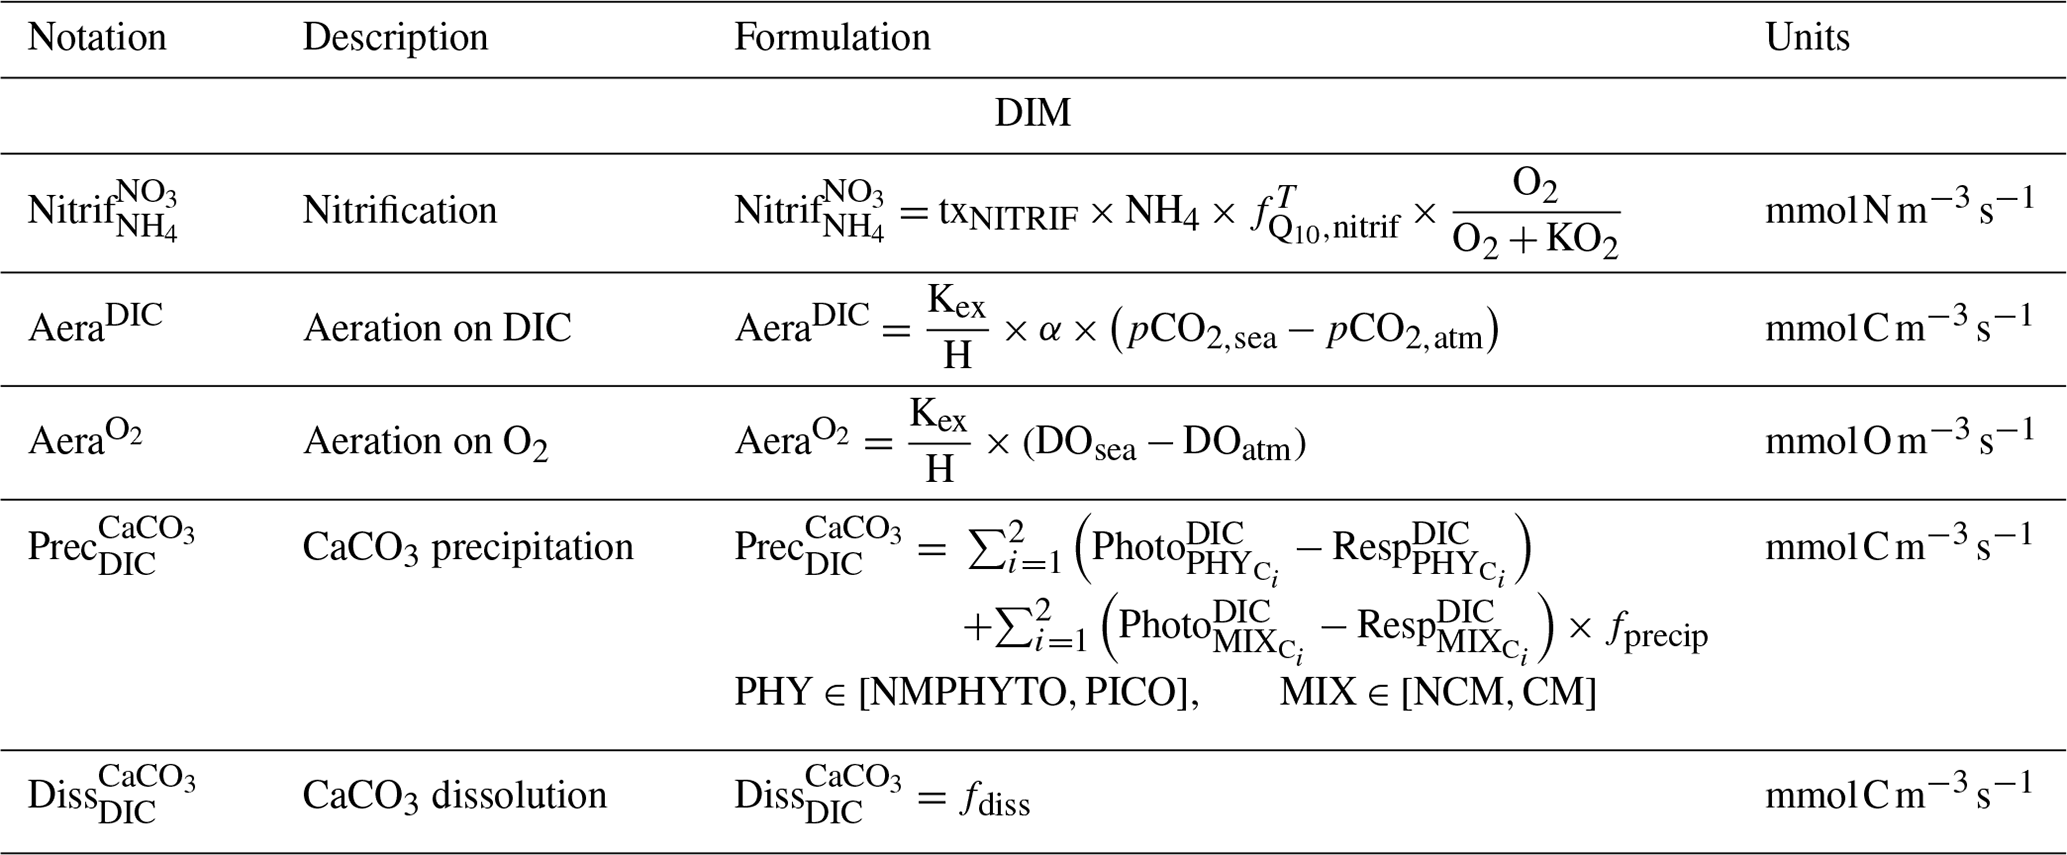
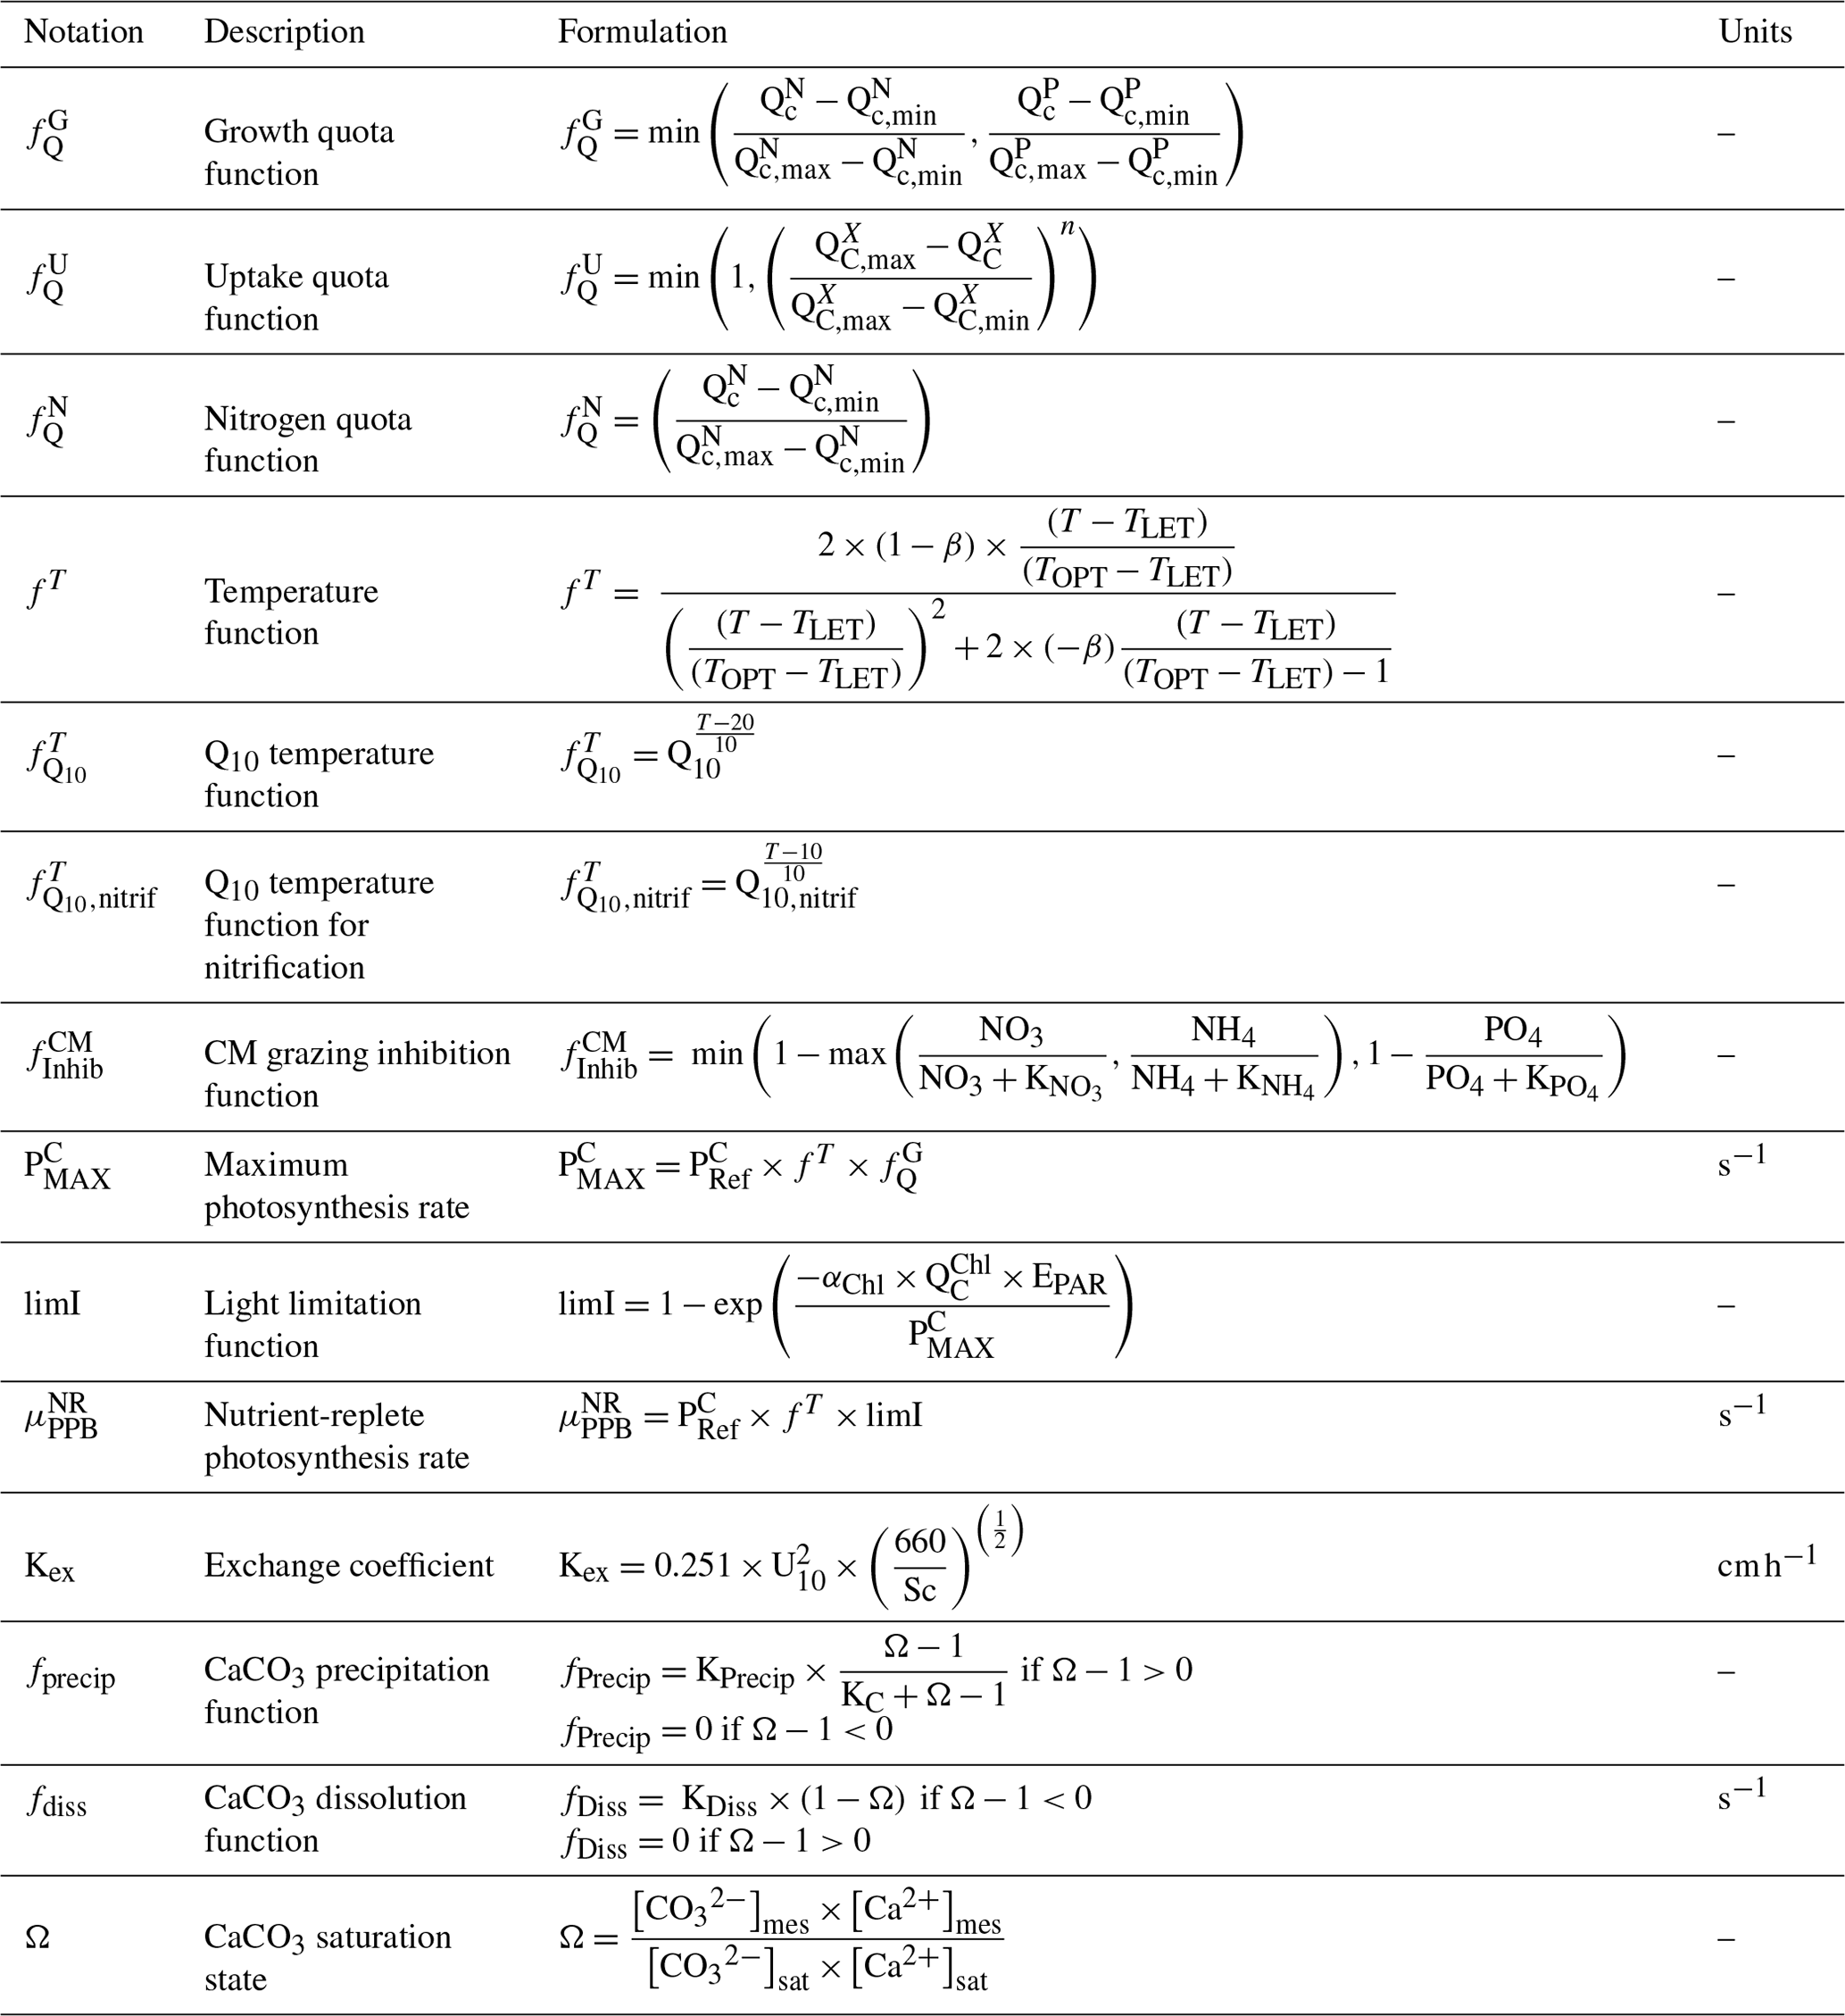
Table E1Parameters values.
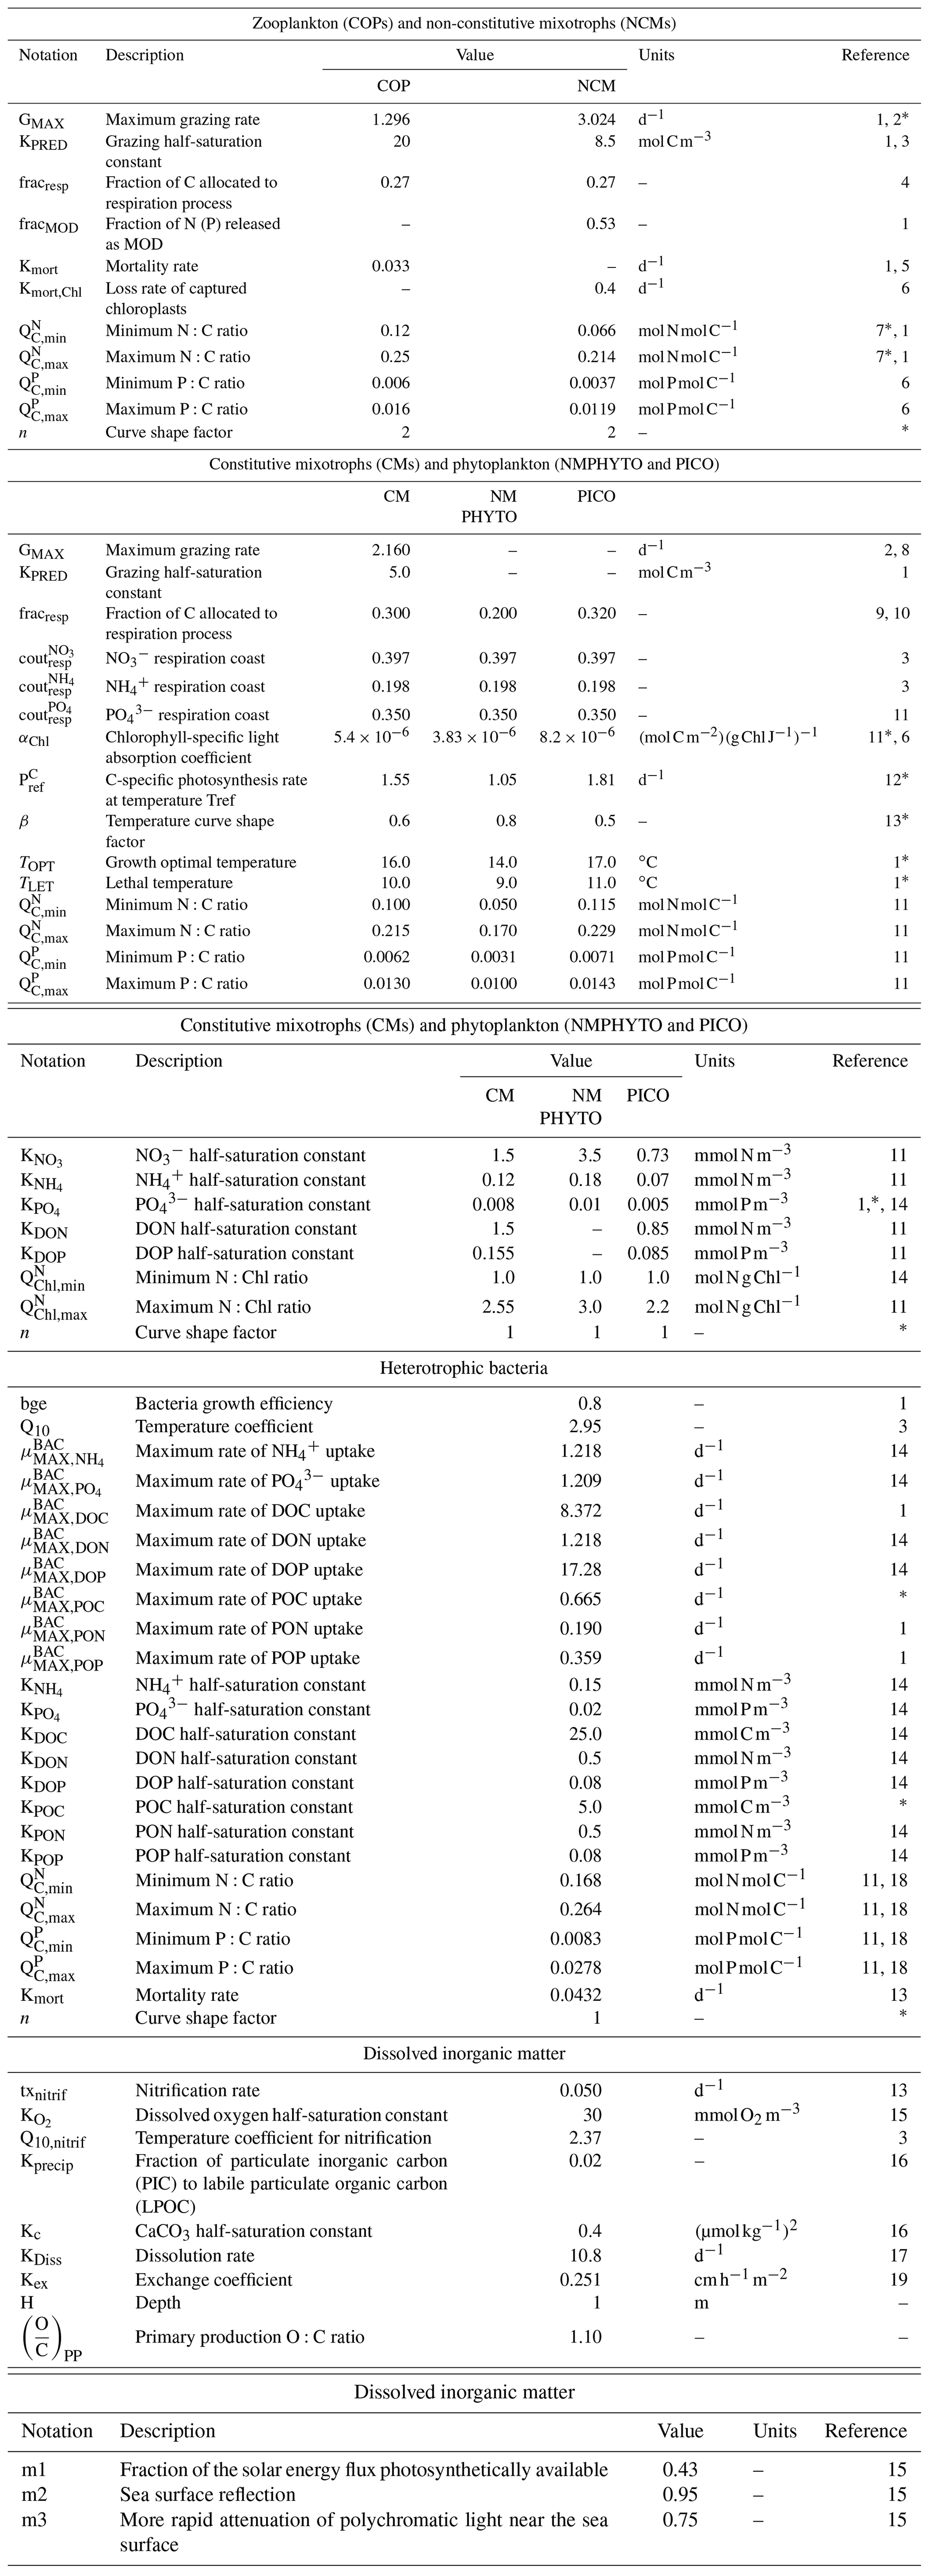
1 Campbell et al. (2013), 2 Stickney et al. (2000), 3 Auger et al. (2011), 4 Gaudy and Thibault-Botha (2007), 5 Banaru et al. (2019), 6 Leles et al. (2018), 7 Gorsky et al. (1988), 8 Ghyoot et al. (2017), 9 Nielsenet (1997), 10 Thornley and Cannell (2000), 11 Leblanc et al. (2018), 12 Sarthou et al. (2005), 13 Lacroix and Gregoire (2002), 14 Lajaunie-Salla et al. (2021), 15 Tett (1990), 16 Marty et al. (2001), 17 Gehlen et al. (2007), 18 Vrede et al. (2002), 19 Wanninkhof (2014). ∗ Calibrated.
Table E2Predator preference for their prey (COPs: copepods; NMPHYTO: nano- and micro-phytoplankton; PICO: picophytoplankton; and BACT: heterotrophic bacteria).
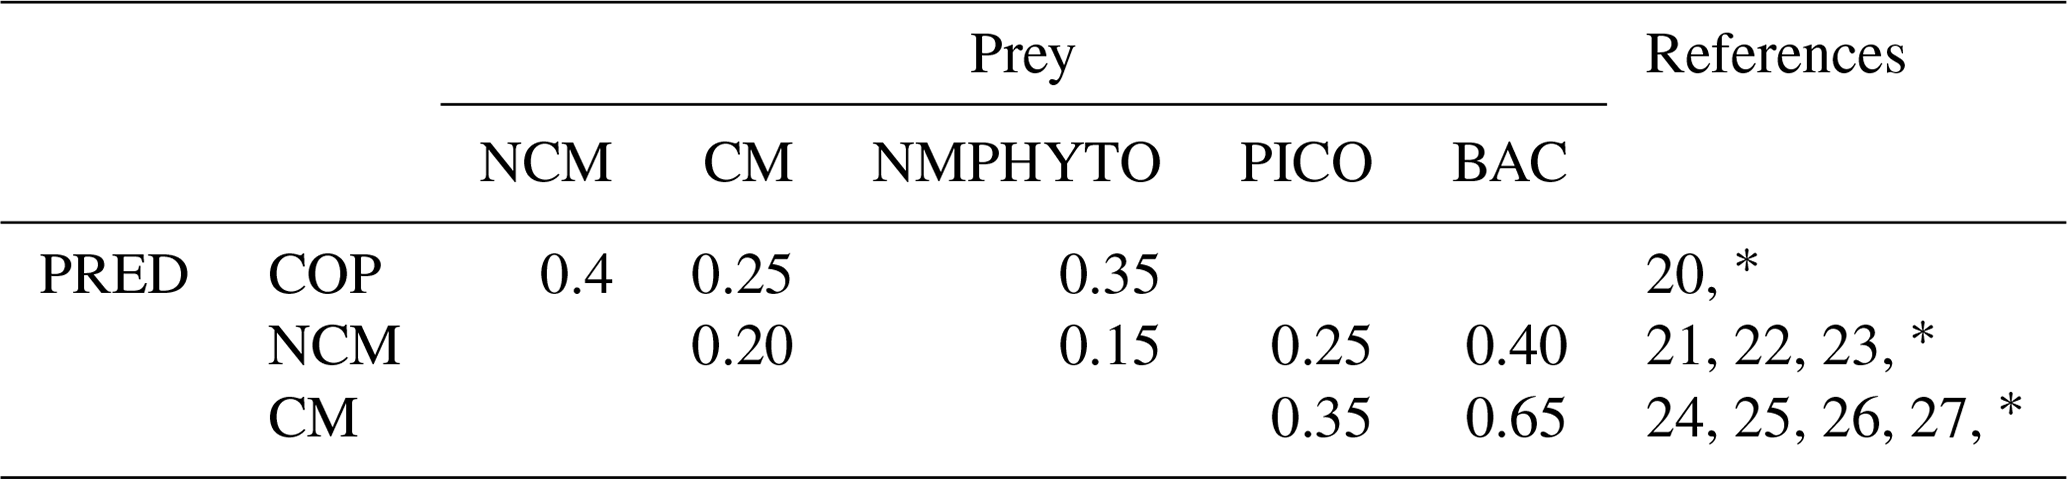
20 Verity and Paffenhofer (1996), 21 Price and Turner (1992), 22 Christaki et al. (2009), 23 Epstein et al. (1992), 24 Christaki et al. (2002), 25 Zubkhov and Tarron (2008), 26 Millette et al. (2017), 27 Livanou et al. (2019). ∗ Calibrated.
Table F1Yearly mean values of grazing and photosynthesis for NCM and CM property verification simulations (Table 2).
We calculated three statistical indicators for the comparison between modeled chlorophyll and chlorophyll measurements performed at SOLEMIO station: the percent bias (%BIAS), the cost function (CF), and the root mean square deviation (RMSD).
The %BIAS is calculated according to Allen et al. (2007). A positive %BIAS means that the model underestimated the in situ observations and vice versa. We interpreted %BIAS according to Marechal (2004) (excellent if %BIAS<10 %, very good if %, good if %, and poor otherwise). We use the absolute values of %BIAS to assess the overall agreement between the model results and observations.
The cost function is calculated based on Allen et al. (2007). According to Gibson et al. (2006), CF<1 is considered very good, is good, is reasonable, while CF≥3 is poor.
The RMSD quantifies the difference between model results and observations (Allen et al., 2007). The closer the RMSD is to 0, the more reliable the model.
Table G1Statistic indicator calculated for observed and modeled chlorophyll.
The version of Eco3M_MIX-CarbOx used in this article can be downloaded from the Zenodo website (https://doi.org/10.5281/zenodo.7669658, Barré et al., 2022). To run Eco3M_MIX-CarbOx, the whole archive must be uploaded.
-
The time, time step, and save time of simulated state variables can be found in the file config.ini (path: MIX-CarbOx_0D_v1.0/BIO/).
-
Boundary conditions, initial condition values of state variables, and forcing data are stocked in the DATA directory (path: MIX-CarbOx_0D_v1.0/BIO/DATA/)
-
Biogeochemical process formulations are stocked in the F_PROCESS directory (path: MIX-CarbOx_0D_v1.0/BIO/F_PROCESS/).
-
Result files and MATLAB routines to visualize them are stocked in SORTIES directory (path: MIX-CarbOx_0D_v1.0/BIO/SORTIES/).
To run Eco3M_MIX-CarbOx v1.0: gmake ! This command creates two executable files: eco3M_ini.exe and eco3M.exe.
For further information, please contact Lucille Barré (lucille.barre@mio.osupytheas.fr).
The current version of Eco3M_MIX-CarbOx is available from Zenodo (https://doi.org/10.5281/zenodo.7669658, Barré et al., 2022). Surface total chlorophyll concentration data are available from the SEANOE website (https://doi.org/10.17882/96252, Garcia et al., 1997) and upon request from the SOMLIT website (https://www.somlit.fr/demande-de-donnees/, last access: 10 November 2023). Temperature data are only available upon request by filling out the form for the station (Planier-Souquet) and years preselected (2017) on the T-MEDNet website (https://t-mednet.org/request-data, Guillemain, 2021). Salinity data are available from the OSU-Pytheas website (https://doi.org/10.34930/79C421C5-9335-4957-88FA-804FB4AE4B43, Garcia and Raimbault, 2022). The non-processed atmospheric pCO2 data are available from the AtmoSud website (free access, https://servicedata.atmosud.org/donnees-stations, last access: 10 November 2023) by filling out a form specifying the station (Cinq Avenues), the period (1 January to 31 December 2017), and the frequency (an hour) required. The processed data are part of the AMC project (https://www.otmed.fr/research-projects-and-results/result-2449, Xueref-Remy and Lefèvre, 2016) and are only available upon request; data requests should be addressed to alexandre.armengaud@airpaca.organd or irene.xueref-remy@imbe.fr.
The supplement related to this article is available online at: https://doi.org/10.5194/gmd-16-6701-2023-supplement.
LB conceptualized this study, developed the Eco3M_MIX-CarbOx model v1.0, designed the numerical experiments, developed the MATLAB software to visualize and process the model results, processed and analyzed the model results, wrote the initial draft, revised the paper, and answered reviewers. FD provided the initial version of the model code (without the carbonate module and with an initial implementation of the mixotrophs) and helped to develop the Eco3M_MIX-CarbOx v1.0. CP acquired the funding, participated in the conceptualization of this study and supervised it, participated in the model development, designed the numerical experiments, analyzed the model results, reviewed and edited the initial draft, and helped to answer reviewers' comments. FVW helped to design the numerical experiments and with the analysis of model results and reviewed and edited the initial draft. CM helped in the model development process by giving expertise on the code development to reduce calculation time. CY provided the wind and irradiance data and maintained computing resources. TW participated in the conceptualization of this study, helped to design the numerical experiments, analyzed the model results, reviewed and edited the initial draft, and helped to answer reviewers' comments.
The contact author has declared that none of the authors has any competing interests.
Publisher's note: Copernicus Publications remains neutral with regard to jurisdictional claims made in the text, published maps, institutional affiliations, or any other geographical representation in this paper. While Copernicus Publications makes every effort to include appropriate place names, the final responsibility lies with the authors.
We thank the National Service d'Observation en MILieu Littoral (SOMLIT) for its permission to use SOLEMIO data. We would like to thank the crew members of the RV Antedon II, operated by the DT-INSU, for making these samplings possible and the team of the SAM platform (Service Atmosphère Mer) of the MIO for the help with the field work. We also thank Michel Lafont and Véronique Lagadec of the PACEM (Plateforme Analytique de Chimie des Environnements Marins) platform of the MIO. We acknowledge the T-MEDNet team for its permission to use the Planier-Souquet temperature data. We thank the ROMARIN network team for its permission to use the salinity data from Carry buoy. We particularly thank the observatoire de la qualité de l'air en Région Sud Provence-Alpes-Côte d'Azur (AtmoSud); Alexandre Armengaud; and the AMC (Aix-Marseille Carbon Pilot Study) project leaders, Irène Xueref-Remy and Dominique Lefèvre, for providing the atmospheric CO2 data at the Cinq Avenues station. We acknowledge the staff of the “Cluster de calcul intensif HPC” platform of the OSU Institut PYTHEAS (Aix–Marseille Université, INSU-CNRS) for providing the computing facilities. We would like to thank Julien Lecubin from the Service Informatique de l'OSU Institut Pytheas for the technical assistance. We thank the XpertScientific team for correcting the manuscript. We thank the two anonymous reviewers for their helpful comments that improved this paper.
This work forms part of the IAMM project (Évaluer l'Impact de la métropole Aix-Marseille sur l'Acidification de la baie de Marseille et les conséquences sur les microorganismes marins, approche par Modélisation) funded by the public establishment of the Ministry of the Environment, l'Agence de l'eau Rhône Mediterranée Corse (grant no. Convention n∘2019 0827).
This paper was edited by Andrew Yool and reviewed by two anonymous referees.
Agawin, N. S. R., Duarte, C. M., and Agusti, S.: Nutrient and temperature control of the contribution of picoplankton to phytoplankton biomass and production, Limnol. Oceanogr., 45, 591–600, https://doi.org/10.4319/lo.2000.45.3.0591, 2000.
Allen, J. I., Holt, J. T., Blackford, J., and Proctor, R.: Error quantification of a high-resolution coupled hydrodynamic-ecosystem coastal ocean model: Part 2. Chlorophyll-a, nutrients, and SPM, J. Mar. Syst., 68, 381–404, https://doi.org/10.1016/j-jmarsys.2007.01.005, 2007.
Auger, P. A., Diaz, F., Ulses, C., Estournel, C., Neveux, J., Joux, F., Pujo-Pay, M., and Naudin, J. J.: Functioning of the planktonic ecosystem on the Gulf of Lions shelf (NW Mediterranean) during spring and its impact on the carbon deposition: a field data and 3-D modelling combined approach, Biogeosciences, 8, 3231–3261, https://doi.org/10.5194/bg-8-3231-2011, 2011.
Baklouti, M., Diaz, F., Pinazo, C., Faure, V., and Queguiner, B.: Investigation of mechanistic formulations depicting phytoplankton dynamics for models of marine pelagic ecosystems and description of a new model, Prog. Oceanogr., 71, 1–33, https://doi.org/10.1016/j.pocean.2006.05.002, 2006a.
Baklouti, M., Faure, V., Pawlowski, L., and Sciandra, A.: Investigation and sensitivity analysis of a mechanistic phytoplankton model implemented in a new modular numerical tool (Eco3M) dedicated to biogeochemical modelling, Prog. Oceanogr., 71, 34–58, https://doi.org/10.1016/j.pocean.2006.05.003, 2006b.
Banaru, D., Diaz, F., Verley, P., Campbell, R., Navarro, J., Yohia, C., Oliveros-Ramos, R., Mellon-Duval, C., and Shin, Y. J.: Implementation of an end-to-end model of the Gulf of Lions ecosystem (NW Mediterranean Sea). I. Parametrization, calibration and evaluation, Ecol. Model., 401, 1–19, https://doi.org/10.1016/j.ecolmodel.2019.03.005, 2019.
Barré, L., Diaz, F., Wagener, T., Van Wambeke, F., Mazoyer, C., Yohia, C., and Pinazo, C.: Eco3M_MIX-CarbOx (v1.0), Zenodo [code], https://doi.org/10.5281/zenodo.7669658, 2022.
Barré, L., Diaz, F., Wagener, T., Mazoyer, C., Yohia, C., and Pinazo, C.: Implementation and assessment of a model including mixotrophs and the carbonate cycle (Eco3M_MIX-CarbOx v1.0) in a highly dynamic Mediterranean coastal environment (Bay of Marseille, France) (Part. II): Towards a better representation of total alkalinity when modelling the carbonate system and air-sea CO2 fluxes, Geosci. Model Dev. Discuss. [preprint], https://doi.org/10.5194/gmd-2023-34, in review, 2023.
Barrier, N., Petrenko, A. A., and Ourmières, Y.: Strong intrusions of the Northern Mediterranean Current on the eastern Gulf of Lion: insights from in-situ observations and high-resolution numerical modelling, Ocean Dynam., 66, 313–327, https://doi.org/10.1007/s10236-016-0921-7, 2016.
Bernard, C. and Rassoulzadegan, F.: Seasonal variations of mixotrophic ciliates in the northwest Mediterranean Sea, Mar. Ecol. Prog. Ser., 108, 295–301, 1994.
Burkholder, J. M., Glibert, P. M., and Skelton, H. M.: Mixotrophy, a major mode of nutrition for harmful algal species in eutrophic waters, Harmful Algae, 8, 77–93, https://doi.org/10.1016/j.hal.2008.08.010, 2008.
Campbell, R., Diaz, F., Hu, Z., Doglioli, A., Petrenko, A., and Dekeyser, I.: Nutrients and plankton spatial distributions induced by a coastal eddy in the Gulf of Lion. Insights from a numerical model, Prog. Oceanogr., 109, 47–69, https://doi.org/10.1016/j.pocean.2012.09.005, 2013.
Christaki, U., Van Wambeke, F., and Dolan, J. R.: Nanoflagellates (mixotrophs, heterotrophs and autotrophs) in the oligotrophic eastern Mediterranean: standing stocks, bacterivory and relationships with bacterial production, Mar. Ecol. Prog. Ser., 181, 297–307, 1999.
Christaki, U., Courties, C., Karayanni, H., Giannakourou, A., Maravelias, C., Kormas, K., and Lebaron, P.: Dynamic characteristics of Prochlorococcus and Synechococcus consumption by bacterivorous nanoflagellates, Microb. Ecol., 43, 341–352, 2002.
Christaki, U., Courties, C., Joux, F., Jeffrey, W. H., Neveux, J., and Naudin, J. J.: Community structure and trophic role of ciliates and heterotrophic nanoflagellates in Rhone River diluted mesoscale structures (NW Mediterranean Sea), Aquat. Microb. Ecol., 57, 263–277, https://doi.org/10.3354/ame01339, 2009.
Djaoudi, K., Van Wanbeke, F., Barani, A., Nunige, S. H., Sempere, R., and Pulido-Vilena, E.: Atmospheric fluxes of soluble organic C, N, and P to the Mediterranean Sea: Potential biogeochemical implications in the surface layer, Prog. Oceanogr., 163, 59–69, https://doi.org/10.1016/j.pocean.2017.07.008, 2018.
Dolan, J. R.: Mixotrophy in ciliates: a review of Chlorella symbiosis and chloroplast retention, Marine Microbial Food Webs, 6, 115–132, 1992.
Dolan, J. R. and Perez, M. T.: Costs, benefits, and characteristics of mixotrophy in marine oligotrichs, Freshwater Biol., 45, 227–238, 2000.
Duhamel, S., Van Wambeke, F., Lefevre, D., Benavides, M., and Bonnet, S.: Mixotrophic metabolism by natural communities of unicellular cyanobacteria in the western tropical South Pacific Ocean, Environ. Microbiol., 20, 2743–2756, https://doi.org/10.1111/1462-2920.14111, 2018.
Epstein, S. S., Burkovsky, I. V., and Shiaris, M. P.: Ciliate grazing on bacteria, flagellates, and microalgae in a temperate zone sandy tidal flat: ingestion rates and food niche partitioning, J. Exp. Mar. Biol. Ecol., 165, 103–123, https://doi.org/10.1016/0022-0981(92)90292-I, 1992.
Esteban, G. F., Fenchel, T., and Finlay, B. J.: Mixotrophy in ciliates, Protists, 161, 621–641, https://doi.org/10.1016/j.protis.2010.08.002, 2010.
Faure, V., Pinazo, C., Torréton, J. P., and Jacquet, S.: Modelling the spatial and temporal variability of the SW lagoon of New Caledonia I: A new biogeochemical model based on microbial loop recycling, Mar. Pollut. Bull., 61, 465–479, https://doi.org/10.1016/j.marpolbul.2010.06.041, 2010a.
Faure, V., Pinazo, C., Torréton, J. P., and Douillet, P.: Modelling the spatial and temporal variability of the SW lagoon of New Caledonia II: Realistic 3D simulations compared with in situ data, Mar. Pollut. Bull., 61, 480–502, https://doi.org/10.1016/j.marpolbul.2010.06.040, 2010b.
Fisher, N. L. and Halsey, K. H.: Mechanisms that increase the growth efficiency of diatoms in low light, Photosynth. Res., 129, 183–197, 2016.
Flynn, K. J. and McGillicuddy, D. J.: Modeling marine harmful algal blooms: Current status and future prospects, Harmful Algal Blooms: A Compendium Desk Reference, 115–134, https://doi.org/10.1002/9781118994672.ch3, 2018.
Flynn, K. J., Stoecker, D. K., Mitra, A., Raven, J., Glibert, P. M., Hansen, P. J., Graneli, E., and Burkholder, J. M.: Misuse of the phytoplankton–zooplankton dichotomy: the need to assign organisms as mixotrophs within plankton functional types, J. Plankton Res., 35, 3–11, https://doi.org/10.1093/plankt/fbs062, 2012.
Fraysse, M., Pinazo, C., Faure, V. M., Fuchs, R., Lazzari, P., Raimbault, P., and Peyraud, I.: Development of a 3D Coupled Physical-Biogeochemical Model for the Marseille Coastal Area (NW Mediterranean Sea): What Complexity Is Required in the Coastal Zone?, PLoS ONE, 8, e80012, https://doi.org/10.1371/journal.pone.0080012, 2013.
Fraysse, M., Pairaud, I., Ross, O. N., Faure, V. M., and Pinazo, C.: Intrusion of Rhone River diluted water into the Bay of Marseille: Generation processes and impacts on ecosystem functioning, J. Geophys. Res.-Oceans, 119, 119, 6535–6556, https://doi.org/10.1002/2014JC010022, 2014.
Garcia, F. and Raimbault, P.: Panache du Rhône: Suivi des eaux du Rhône en zone côtière par mesure haute fréquence de la salinité de surface, MIO UMR 7294 CNRS [data set], https://doi.org/10.34930/79C421C5-9335-4957-88FA-804FB4AE4B43, 2022.
Garcia, N., Gregori, G., Lafont, M., Lagadec, V., Nunige, S., and Raimbault, P.:SOMLIT-Frioul time series (French Research Infrastructure ILICO): long-term core parameter monitoring in the Bay of Marseille, SEANOE [data set], https://doi.org/10.17882/96252, 1997.
Gatti, J., Petrenko, A., Devenon, J. -L., Leredde, Y., and Ulses, C.: The Rhone River dilution zone present in the northeastern shelf of the Gulf of Lion in December 2003, Cont. Shelf Res., 26, 1794–1815, https://doi.org/10.1016/j.csr.2006.05.012, 2006.
Gaudy, R. and Thibault-Botha, D.: Metabolism of Centropages species in the Mediterranean Sea and the North Atlantic Ocean, Prog. Oceanogr., 72, 151–163, https://doi.org/10.1016/j.pocean.2007.01.005, 2007.
Gehlen, M., Gangstø, R., Schneider, B., Bopp, L., Aumont, O., and Ethe, C.: The fate of pelagic CaCO3 production in a high CO2 ocean: a model study, Biogeosciences, 4, 505–519, https://doi.org/10.5194/bg-4-505-2007, 2007.
Geider, R.: Algal photosynthesis, Vol. 2, Springer Science & Business Media, ISBN 1475721536, 2013.
Geider, R., MacIntyre, H. L., and Kana T. M.: A dynamic regulatory model of phytoplanktonic acclimation to light, nutrients, and temperature, Limnol. Oceanogr., 43, 679–694, 1998.
Ghyoot, C., Flynn, K. J., Mitra, A., Lancelot, C., and Gypens, N.: Modeling Plankton Mixotrophy: A Mechanistic Model Consistent with the Shuter-Type Biochemical Approach, Frontiers in Ecology and Evolution, 5, 5–78, https://doi.org/10.3389/fevo.2017.00078, 2017.
Gibson, R. N., Atkinson, R. J. A., and Gordon, J. D. M.: Review of three-dimensional ecological modelling related to the North Sea shelf system, Part II: Model validation and data needs, Oceanogr. Mar. Biol., 44, 1–60, 1420006398, 2006.
Glibert, P. M. and Legrand, C., The Diverse Nutrient Strategies of Harmful Algae: Focus on Osmotrophy, Ecology of Harmful Algae, 163–175, https://doi.org/10.1007/978-3-540-32210-8_13, 2006.
Glibert, P. M., Al-Azri, A., Allen, J. I., Bouwman, A. F., Beusen, A. H. W., Burford, M. A., Harrison, P. J., and Zhou, M.: Key Questions and Recent Research Advances on Harmful Algal Blooms in Relation to Nutrients and Eutrophication, Global Ecology and Oceanography of Harmful Algal Blooms, Ecol. Stud., 232, 229–258, https://doi.org/10.1007/978-3-319-70069-4_12, 2018.
Gorsky, G., Dallot, S., Sardou, J., Fenaux, R., Carré, C., and Palazzoli, I.: C and N composition of some northwestern Mediterranean zooplankton and micronekton species, J. Exp. Mar. Biol. Ecol., 124, 133–144, https://doi.org/10.1016/0022-0981(88)90116-5, 1988.
Guillemain, D.: Données de température à la station Planier-Souquet (5m), Regional temperature observation network T-MEDNet [data set], https://t-mednet.org/request-data (last access: 7 November 2023), 2021.
Graneli, E., Carlsson, P., and Legrand, C.: The role of C, N and P in dissolved and particulate organic matter as a nutrient source for phytoplankton growth, including toxic species, Aquat. Ecol., 33, 17–27, 1999.
Hartmann, M., Grob, C., Tarran, G. A., Martin, A. P., Burkill, P. H., Scanlan, D. J., and Zubkova, M. V.: Mixotrophic basis of Atlantic oligotrophic ecosystems, P. Natl. Acad. Sci. USA, 109, 5756–5760, https://doi.org/10.1073/pnas.1118179109, 2012.
Johansson, M., Gorokhova, E., and Larsson, U. L. F.: Annual variability in ciliate community structure, potential prey and predators in the open northern Baltic Sea proper, J. Plankton Res., 26, 67–80, https://doi.org/10.1093/plankt/fbg115, 2004.
Jost, C., Lawrence, C. A., Campolongo, F., Van de Bund, W., Hill, S., and DeAngelis, D. L.: The effects of mixotrophy on the stability and dynamics of a simple planktonic food web model, Theor. Popul. Biol., 66, 37–51, https://doi.org/10.1016/j.tpb.2004.02.001, 2004.
Kempton, J. W., Lewitus, A. J., Deeds, J. R., Law, J. M., and Place, A. R.: Toxicity of Karlodinium micrum (Dinophyceae) associated with a fish kill in a South Carolina brackish retention pond, Harmful Algae, 1, 233–241, https://doi.org/10.1016/S1568-9883(02)00015-X, 2002.
Kirchman, D. L. and Gasol, J. M.: Microbial Ecology of the Oceans, John Wiley & Sons, ISBN 1119107199, 2018.
Lacroix, G. and Grégoire, M.: Revisited ecosystem model (MOD-ECOGeL) of the Ligurian Sea: seasonal and interannual variability due to atmospheric forcing, J. Marine Syst., 37, 229–258, https://doi.org/10.1016/S0924-7963(02)00190-2, 2002.
Lajaunie-Salla, K., Diaz, F., Wimart-Rousseau, C., Wagener, T., Lefèvre, D., Yohia, C., Xueref-Remy, I., Nathan, B., Armengaud, A., and Pinazo, C.: Implementation and assessment of a carbonate system model (Eco3M-CarbOx v1.1) in a highly dynamic Mediterranean coastal site (Bay of Marseille, France), Geosci. Model Dev., 14, 295–321, https://doi.org/10.5194/gmd-14-295-2021, 2021.
Leblanc, K., Quéguiner, B., Diaz, F., Cornet, V., Michel-Rodriguez, M., Durrieu de Madron, X., Bowler, C., Malviva, S., Thyssen, M., Grégori, G., Rembauville, M., Grosso, O., Poulain, J., de Vargas, C., Pujo-Pay, M., and Conan, P.: Nanoplanktonic diatoms are globally overlooked but play a role in spring blooms and carbon export, Nat. Commun., 9, 953–964, https://doi.org/10.1038/s41467-018-03376-9, 2018.
Leles, S. G., Bruggeman, L. P. J., Blackford, J., Ciavatta, S., Mitra, A., and Flynn, K. J.: Modelling mixotrophic functional diversity and implications for ecosystem function, J. Plankton Res., 40, 627–642, https://doi.org/10.1093/plankt/fby044, 2018.
Lewitus, A. J: Osmotrophy in marine microalgae, Algal cultures, analogues of blooms and applications, Volume 1, Subba Rao D. V., Science publishers Inc., USA, ISBN 1578083923, 2006.
Livanou E., Lagaria, A., Santi, I., Mandalakis, M., Paylidou, A., Lika, K., and Psarra, S.: Pigmented and heterotrophic nanoflagellates: Abundance and grazing on prokaryotic picoplankton in the ultra-oligotrophic Eastern Mediterranean Sea, Deep-Sea Res. Pt. II, 164, 100–111, https://doi.org/10.1016/j.dsr2.2019.04.007, 2019.
Livanou, E., Oikonomou, A., Psarra, S., and Konstadia, L.: Role of mixotrophic nanoflagellates in the Eastern Mediterranean microbial food web, Mar. Ecol. Prog. Ser., 672, 15–32, https://doi.org/10.3354/meps13782, 2021.
Marechal, D.: A soil-based approach to rainfall-runoff modelling in ungauged catchments for England and Wales, PhD thesis, Cranfield University, 157 pp., 2004.
Margalef, R.: Life-forms of phytoplankton as survival alternatives in an unstable environment, edited by: Gauthier-Villars, Oceanol. Acta, 1, 493–509, https://archimer.ifremer.fr/doc/00123/23403/ (last access: July 2023), 1978.
Marty, J.-C., Chiavérini, J., Pizay, M.-D., and Avril, B.: Seasonaland interannual dynamics of nutrients and phytoplankton pigments in the western Mediterranean Sea at the DYFAMED time series station (1991–1999), Deep-Sea Res. Pt. II, 49, 1965–1985, https://doi.org/10.1016/S0967-0645(02)00022-X, 2001.
McGillicuddy Jr., D. J.: Models of harmful algal blooms: conceptual, empirical, and numerical approaches, J. Marine Syst., 83, 105, 2010.
Mella-Flores, D., Mazard, S., Humily, F., Partensky, F., Mahé, F., Bariat, L., Courties, C., Marie, D., Ras, J., Mauriac, R., Jeanthon, C., Mahdi Bendif, E., Ostrowski, M., Scanlan, D. J., and Garczarek, L.: Is the distribution of Prochlorococcus and Synechococcus ecotypes in the Mediterranean Sea affected by global warming?, Biogeosciences, 8, 2785–2804, https://doi.org/10.5194/bg-8-2785-2011, 2011.
Millet, B., Pinazo, C., Banaru, D., Pagès, R., Guiart, P., and Pairaud, I.: Unexpected spatial impact of treatment plant discharges induced by episodic hydrodynamic events: Modelling lagrangian transport of fine particles by Northern Current intrusions in the Bays of Marseille (France), Édité par João Miguel Dias, PLoS ONE, 13, e0195257, https://doi.org/10.1371/journal.pone.0195257, 2018.
Millette, N. C., Pierson, J. J., Aceves, A., and Stoecker, D. K.: Mixotrophy in Heterocapsa rotundata: a mechanism for dominating the winter phytoplankton, Limnol. Oceanogr., 62, 836–845, https://doi.org/10.1002/lno.10470, 2017.
Millot, C.: The Golf of Lions' hydrodynamic, Cont. Shelf Res., 10, 885–894, 1990.
Mitra, A. and Flynn, K. J.: Modelling mixotrophy in harmful algal blooms: More or less the sum of the parts?, J. Marine Syst., 83, 158–169, https://doi.org/10.1016/j.jmarsys.2010.04.006, 2010.
Mitra, A., Flynn, K. J., Burkholder, J. M., Berge, T., Calbet, A., Raven, J. A., Granéli, E., Glibert, P. M., Hansen, P. J., Stoecker, D. K., Thingstad, F., Tillmann, U., Våge, S., Wilken, S., and Zubkov, M. V.: The role of mixotrophic protists in the biological carbon pump, Biogeosciences, 11, 995–1005, https://doi.org/10.5194/bg-11-995-2014, 2014.
Mitra, A., Flynn, K. J., Tillmann, U., Raven, J. A., Caron, D., Stoecker, D. K., Not, F., Hansen, P. J., Hallegraeff, G., Sanders, R., Wilken, S., McManus, G., Johnson, M., Pitta, P., Våge, S., Berge, T., Calbet, A., Thingstad, F., Jin Jeong, H., Burkholder, J. -A., Glibert, P. M., Granéli, E., and Lundgren, V.: Defining planktonic protist functional groups on mechanisms for energy and nutrient acquisition: Incorporation of diverse mixotrophic strategies, Protist, 167, 106–120, https://doi.org/10.1016/j.protis.2016.01.003, 2016.
Montagnes, D. J.: Growth responses of planktonic ciliates in the genera Strobilidium and Strombidium, Mar. Ecol. Prog. Ser., 130, 241–254, https://doi.org/10.3354/meps130241, 1996.
Morel, A. and André, J. -M.: Pigment distribution and primary production in the western Mediterranean as derived and modelled from coastal zone colour scanner observations, J. Geophys. Res.-Oceans, 96, 12685–12698, https://doi.org/10.1029/91JC00788, 1991.
Nielsen, L. P., Christensen, P. B., Revsbech, N, P., and Sorensen, I.: Denitrification and photosynthesis in stream sediment studied with microsensor and wholecore techniques, Limnol. Oceanogr., 35, 1135–1144, https://doi.org/10.4319/lo.1990.35.5.1135, 1990.
Oikomonou, A., Livanou, E., Mandalakis, M., Ligaria, A., and Psarra, S.: Grazing effect of flagellates on bacteria in response to phosphate addition in the oligotrophic Cretan Sea, NE Mediterranean, FEMS Microbiol. Ecol., 96, fiaa086, https://doi.org/10.1093/femsec/fiaa086, 2020.
Oursel, B., Garniera, C., Zebracki, M., Durrieu, G., Pairaud, I., Omanovic, D., Cossab, D., and Lucas, Y.: Flood inputs in a Mediterranean coastal zone impacted by a large urban area: Dynamic and fate of trace metals, Mar. Chem., 167, 44–56, https://doi.org/10.1016/j.marchem.2014.08.005, 2014.
Pitta, P. and Giannakourou, A.: Planktonic ciliate in the oligotrophic Eastern Mediterranean: vertical, spatial distribution and mixotrophy, Mar. Ecol. Prog. Ser., 194, 269–282, 2000.
Platt, T. G. C. L., Gallegos, C. L., and Harrison, W. G.: Photoinhibition of photosynthesis in natural assemblages of marine phytoplankton, J. Mar. Res., 38, 1525, 1980.
Polovina, J. J., Howell, E. A., and Abecassis, A.: Ocean's least productive waters are expanding, Geophys. Res. Lett., 35, L03618, https://doi.org/10.1029/2007GL031745, 2008.
Pratt, J. R. and Cairns, J.: Functional groups in the protozoa, Roles in differing ecosystems, J. Protozool. Res., 32, 415–423, 1985.
Price, R. W. and Turner, J. T.: Ecology of planktonic ciliates in marine food webs, Rev. Aquat. Sci., 6, 139–181, 1992.
Ptacnik, R., Sommer, U., Hansen, T., and Martens, V.: Effects of microzooplankton and mixotrophy in an experimental planktonic food web, Limnol. Oceanogr., 49, 1435–1445, 2004.
Ptacnik, R., Gomes, A., Royer, S-J., Berger, S. A., Calbet, A., Nejstgaard, J. C., Gasol, J. M., Isari, S., Moorthi, S. D., Ptacnikova, R., Striebel, M., Sazhin, A. F., Tsagaraki, T. M., Zervoudaki, S., Altoja, K., Dimitriou, P. D., Laas, P., Gazihan, A., Martinez, R. A., Schabhuttl, S., Santi, I., Sousoni, D., and Pitta, P.: A light-induced shortcut in the planktonic microbial loop, Sci. Rep., 6, 29286, https://doi.org/10.1038/srep29286, 2016.
Pujo-Pay, M., Conan, P., Oriol, L., Cornet-Barthaux, V., Falco, C., Ghiglione, J.-F., Goyet, C., Moutin, T., and Prieur, L.: Integrated survey of elemental stoichiometry (C, N, P) from the western to eastern Mediterranean Sea, Biogeosciences, 8, 883–899, https://doi.org/10.5194/bg-8-883-2011, 2011.
Putt, M.: Metabolism of photosynthate in the chloroplast-retaining ciliate Laboea strobila, Mar. Ecol. Prog. Ser., Oldendorf, 60, 271–282, 1990.
Raven, J. A.: Phagotrophy in phototrophs, Limnol. Oceanogr., 42, 198–205, 1997.
Razzak, S. A., Ilyas, M., Ali, S. A. M., and Hossain, M. M.: Effects of CO2 Concentration and pH on Mixotrophic Growth of Nannochloropsis oculate, Appl. Biochem. Biotech., 176, 1290–1302, https://doi.org/10.1007/s12010-015-1646-7, 2015.
Riemann, B., Havskum, H., Thingstad, F., and Bernard, C.: The role of mixotrophy in pelagic environments, Molecular Ecology of Aquatic Microbes, NATO ASI Series, 38, Joint, I. Springer, Berlin, Heidelberg, https://doi.org/10.1007/978-3-642-79923-5_6, 1995.
Ross, O. N., Fraysse, M., Pinazo, C., and Pairaud, I.: Impact of an intrusion by the Northern Current on the biogeochemistry in the Eastern Gulf of Lion, NW Mediterranean, Estuar. Coast. Shelf S., 170, 1–9, 2016.
Sanders, R.: Mixotrophic Protists in Marine and Freshwater Ecosystems, J. Protozool., 38, 76–81, 1991.
Sarthou, G., Timmerman, K. R., Blain, S., and Tréguer, P.: Growth physiology and fate of diatoms in the ocean: a review, J. Sea Res., 53, 25–42, https://doi.org/10.1016/j.seares.2004.01.007, 2005.
Schaeffer, A., Molcard, A., Forget, P., Fraunié, P., and Garreau, P.: Generation mechanisms for mesoscale eddies in the Gulf of Lions: radar observation and modelling, Ocean Dynam., 61, 1587–1609, https://doi.org/10.1007/s10236-011-0482-8, 2011.
Schneider, L. K., Gypens, N., Troost, T. A. and Stolte, W., Modeling mixoplankton along the biogeochemical gradient of the Southern North Sea, Ecol. Model., 459, 109690, https://doi.org/10.1016/j.ecolmodel.2021.109690, 2021.
Sherr, B. F., Sherr, E. B., Caron, D. A., Vaulot, D., and Worden, A. Z.: Oceanic protists, Oceanography, 20, 130–134, https://doi.org/10.5670/oceanog.2007.57, 2007.
Stickney, H. L., Hood, R. R., and Stoecker, D. K.: The impact of mixotrophy on planktonic marine ecosystems, Ecol. Model., 125, 203–230, https://doi.org/10.1016/S0304-3800(99)00181-7, 2000.
Stoecker, D. K.: Mixotrophy among Dinoflagellates 1, J. Eukaryot. Microbiol., 46, 397–401, 1999.
Stoecker, D. K. and Capuzzo, J. M.: Predation on protozoa: its importance to zooplankton, J. Plankton Res., 12, 891–908, 1990.
Stoecker, D. K., Silver, M. W., Michaels, A. E., and Davis, L. H.: Obligate mixotrophy in Laboea strobila, a ciliate which retains chloroplasts, Mar. Biol., 99, 415–423, 1988.
Stoecker, D. K., Li, A., Coats, D. W., Gustafson, D. E., and Nannen, M. K.: Mixotrophy in the dinoflagellate Prorocentrum minimum, Mar. Ecol. Prog. Ser., 152, 1–12, 1997.
Stoecker, D. K.: Conceptual models of mixotrophy in planktonic protists and some ecological and evolutionary implications, Eur. J. Protistol., 34, 281–290, https://doi.org/10.1016/S0932-4739(98)80055-2, 1998.
Stoecker, D. K., Hansen, P. J., Caron, D. A., and Mitra, A.: Mixotrophy in marine plankton, Annu. Rev. Mar. Sci., 9, 11–35, https://doi.org/10.1146/annurev-marine-010816-060617, 2017.
Tett, P.: A three-layer vertical and microbiological processes model for shelf seas, Report No. 14, Proudman Oceanographic Laboratory, Birkenhead, UK, 85, https://nora.nerc.ac.uk/id/eprint/3877/1/ir14.pdf (last access: 7 November 2023), 1990.
Thingstad, T. F., Hagström, A., and Rassoulzadegan, F.: Accumulation of degradable DOC in surface waters: Is it caused by a malfunctioning microbialloop?, Limnol. Oceanogr., 42, 398–404, https://doi.org/10.4319/lo.1997.42.2.0398, 1997.
Timmermans, K. R., van der Wagt, B., Veldhuis, M. J. W., Maatman, A., and de Baar, H. J. W.: Physiological responses of three species of marine pico-phytoplankton to ammonium, phosphate, iron and light limitation, J. Sea Res., 53, 109–120, https://doi.org/10.1016/j.seares.2004.05.003, 2005.
Thornley, J. H. M. and Cannell, M. G. R.: Modelling the component of plant respiration: Representation and realism, Ann. Bot.-London, 85, 55–67, https://doi.org/10.1006/anbo.1999.0997, 2000.
Unrein, F., Gasol, J. M., and Massana, R.: Dinobryon faculiferum (Chrysophyta) in coastal Mediterranean seawater: presence and grazing impact on bacteria, J. Plankton Res., 32, 559–564, https://doi.org/10.1093/plankt/fbp150, 2010.
Verity, P. G. and Paffenhofer, G. A.: On assessment of prey ingestion by copepods, J. Plankton Res., 18, 1767–1779, 1996.
Vrede, K., Heldal, M., Norland, S., and Bratbak, G.: Elemental Composition (C, N, P) and Cell Volume of Exponentially Growing and Nutrient-Limited Bacterioplankton, American Society for Microbiology Journal, 68, 2965–2971, https://doi.org/10.1128/AEM.68.6.2965-2971.2002, 2002.
Wanninkhof, R.: Relationship between wind speed and gas exchange over the ocean revisited, Limnol. Oceanogr.-Meth., 12, 351–362, https://doi.org/10.4319/lom.2014.12.351, 2014.
Ward, B. A. and Follows M. J.: Marine mixotrophy increases trophic transfer efficiency, mean organism size, and vertical carbon flux, P. Natl. Acad. Sci. USA, 113, 2958–2963, https://doi.org/10.1073/pnas.1517118113, 2016.
Wilken, S., Huisman, J., Naus-Wiezer, S., and Van Donk, E.: Mixotrophic organisms become more heterotrophic with rising temperature, Ecol. Lett., 16, 225–233, https://doi.org/10.1111/ele.12033, 2013.
Xueref-Remy, I., Lefèvre, D., Nathan, B., Milne, M., Piazzola, J., Yohia, C., Armengaud, A., Blanc, P. E. Mevy, J.-P., Reiter, I., Paya, A., Lajaunie-Salla, K., Wimart-Rousseau, C., Diaz, F., Pinazo, C., and Wagener, T.: Aix-Marseille Carbon Pilot Study (AMC), https://www.otmed.fr/research-projects-and-results/result-2449 (last access: 7 November 2023), 2016.
Yacobi, Y. Z., Zohary, T., Kress, N., Hecht, A., Robarts, R. D., Waiser, M., Wood, A. M., and Li, W. K. W.: Chlorophyll distribution throughout the southeastern Mediterranean in relation to the physical structure of the water mass, J. Marine Syst., 6, 179–190, https://doi.org/10.1016/0924-7963(94)00028-A, 1995.
Yohia, C.: Genèse du mistral par interaction barocline et advection du tourbillon potentiel, Climatologie, 13, 24–37, https://doi.org/10.4267/climatologie.1182, 2017.
Zubkov, M. V. and Tarran, G. A.: High bacterivory by the smallest phytoplankton in the North Atlantic Ocean, Nature, 455, 224–226, https://doi.org/10.1038/nature07236, 2008.
- Abstract
- Introduction
- Materials and methods
- Results
- Discussion
- Conclusions
- Appendix A: State variable descriptions and initial condition values
- Appendix B: Balance equations
- Appendix C: Processes descriptions, formulations, and units
- Appendix D: Detailed function formulation
- Appendix E: Parameters descriptions, values, and units
- Appendix F: Yearly mean values of photosynthesis and grazing for NCM and CM property verification simulations
- Appendix G: Statistical analysis
- Appendix H: User manual
- Code and data availability
- Author contributions
- Competing interests
- Disclaimer
- Acknowledgements
- Financial support
- Review statement
- References
- Supplement