the Creative Commons Attribution 4.0 License.
the Creative Commons Attribution 4.0 License.
 | 09 Sep 2020
Cloud_cci ATSR-2 and AATSR data set version 3: a 17-year climatology of global cloud and radiation properties
Caroline A. Poulsen
Gregory R. McGarragh
Gareth E. Thomas
Martin Stengel
Matthew W. Christensen
Adam C. Povey
Simon R. Proud
Elisa Carboni
Rainer Hollmann
Roy G. Grainger
We present version 3 (V3) of the Cloud_cci Along-Track Scanning Radiometer (ATSR) and Advanced ATSR (AATSR) data set. The data set was created for the European Space Agency (ESA) Cloud_cci (Climate Change Initiative) programme. The cloud properties were retrieved from the second ATSR (ATSR-2) on board the second European Remote Sensing Satellite (ERS-2) spanning 1995–2003 and the AATSR on board Envisat, which spanned 2002–2012. The data are comprised of a comprehensive set of cloud properties: cloud top height, temperature, pressure, spectral albedo, cloud effective emissivity, effective radius, and optical thickness, alongside derived liquid and ice water path. Each retrieval is provided with its associated uncertainty. The cloud property retrievals are accompanied by high-resolution top- and bottom-of-atmosphere shortwave and longwave fluxes that have been derived from the retrieved cloud properties using a radiative transfer model. The fluxes were generated for all-sky and clear-sky conditions. V3 differs from the previous version 2 (V2) through development of the retrieval algorithm and attention to the consistency between the ATSR-2 and AATSR instruments. The cloud properties show improved accuracy in validation and better consistency between the two instruments, as demonstrated by a comparison of cloud mask and cloud height with co-located CALIPSO data. The cloud masking has improved significantly, particularly in its ability to detect clear pixels. The Kuiper Skill score has increased from 0.49 to 0.66. The cloud top height accuracy is relatively unchanged. The AATSR liquid water path was compared with the Multisensor Advanced Climatology of Liquid Water Path (MAC-LWP) in regions of stratocumulus cloud and shown to have very good agreement and improved consistency between ATSR-2 and AATSR instruments. The correlation with MAC-LWP increased from 0.4 to over 0.8 for these cloud regions. The flux products are compared with NASA Clouds and the Earth's Radiant Energy System (CERES) data, showing good agreement within the uncertainty. The new data set is well suited to a wide range of climate applications, such as comparison with climate models, investigation of trends in cloud properties, understanding aerosol–cloud interactions, and providing contextual information for co-located ATSR-2/AATSR surface temperature and aerosol products.
The following new digital identifier has been issued for the Cloud_cci ATSR-2/AATSRv3 data set: https://doi.org/10.5676/DWD/ESA_Cloud_cci/ATSR2-AATSR/V003 (Poulsen et al., 2019).


Clouds play a critical role in the Earth's radiation budget as their response to the changing climate can cool or warm the planet. There is considerable uncertainty in the balance between these cooling and warming effects. The Fifth Assessment Report of the Intergovernmental Panel on Climate Change summarised the current understanding of climate sensitivity, which measures the temperature change when the amount of carbon dioxide (CO2) in the atmosphere is doubled. IPCC (2013) estimated this number to be between 1.5 and 4.5 ∘C. The large range results almost entirely from the response of clouds. In terms of radiative impact, the effect of cloud–aerosol interactions is also a major uncertainty. It is imperative to create accurate records of cloud properties and use them to study changes in cloud behaviour.
A number of satellite cloud records exist to address this question. The longest series of satellite instruments used to measure cloud comes from the Advanced Very High Resolution Radiometers (AVHRRs). Satellite cloud climatologies based on these instruments include the International Satellite Cloud Climatology Project (ISCCP; Young et al., 2018), which also includes geostationary satellites; the AVHRR PATMOS-X climatology (Heidinger et al., 2014); the European Meteorological Satellite Organisation (EUMETSAT) Climate Monitoring Satellite Applications Facility (CM-SAF) CLARA-A2 data set (Karlsson et al., 2017); and the Cloud_cci AVHRR data set (Stengel et al., 2019). Much attention has been focused on improving the quality of the Fundamental Climate Data Record (FCDR), i.e. the radiances, harmonising the calibration of instruments on different platforms and accounting for the impact of the diurnal cycle and drifting orbits. Algorithms are increasingly complex and more accurate. Nevertheless, there are significant differences between the products and their associated trends, as has recently been shown for the cloud mask in a study comparing the cloud fraction in four of the longest AVHRR data sets (Karlsson and Devasthale, 2018). The Moderate Resolution Imaging SpectroRadiometer (MODIS) cloud record (Platnick et al., 2017; Baum et al., 2012) has much higher-quality radiances but a shorter record beginning in 2002 and, similar to the Multi-angle Imaging SpectroRadiometer (MISR) data set (Davies et al., 2017), considerable uncertainty (Marchand, 2013). Since 2006, CloudSat (Stephens et al., 2008) and CALIPSO (Winker et al., 2009), an active radar and lidar, respectively, have collected vertical profiles of cloud. These have been of immense value in understanding clouds and climate processes, but their coverage is sparse compared to a passive instrument.
Spanning a gap in time between AVHRR and MODIS, the second Along-Track Scanning Radiometer (ATSR-2)/Advanced ATSR (AATSR) instrument series has the potential to offer a much more stable cloud property record than AVHRR. The ATSR-2/AATSR are part of a well-characterised series of instruments, using on-board calibration and post hoc vicarious calibration activities. These instruments' orbits are very similar and stable (see Table 1), which is key in climate applications. While the AATSR instrument ceased operation in 2012, the next instrument in the series, the Sea and Land Surface Temperature Radiometer (SLSTR), has been in operation since 2016, with a second instrument launched in 2018. The instrument will continue for the foreseeable future as a European Space Agency (ESA) operational mission on Sentinel-3 platforms (Coppo et al., 2010). These satellite records have been used to produce the first climatology of top- and bottom-of-atmosphere radiative flux co-located with the cloud products. This was derived from the Aerosol_cci (Thomas et al., 2009) and the Cloud_cci products combined with MODIS surface albedo and temperature profiles from ERA-Interim reanalysis, which was then input into a radiative flux model. This climatology is produced at pixel resolution, i.e. ∼1 km, which is a high resolution compared to fluxes from the Clouds and the Earth's Radiant Energy System (CERES).
This paper documents production of the ATSR-2/AATSR cloud and flux property data set, completed as part of the ESA Cloud_cci programme (Hollmann et al., 2013). The data set is named ATSR-2/AATSRv3 and follows on from the precursor data set ATSR-2/AATSRv2. It covers a 17-year time period from 1995 to 2012 and delivers cloud properties of superior quality to the previous version and additional flux products. The data set has already been used in a number of studies, such as Neubauer et al. (2017), Christensen et al. (2017) and Zelinka et al. (2018). The following sections describe updates to the cloud algorithm and briefly introduce the products and their validation.
Table 1 Outline of the key specifications of the ATSR-2 and AATSR instruments compared to the follow-on SLSTR instruments. LTDN stands for local time descending node.
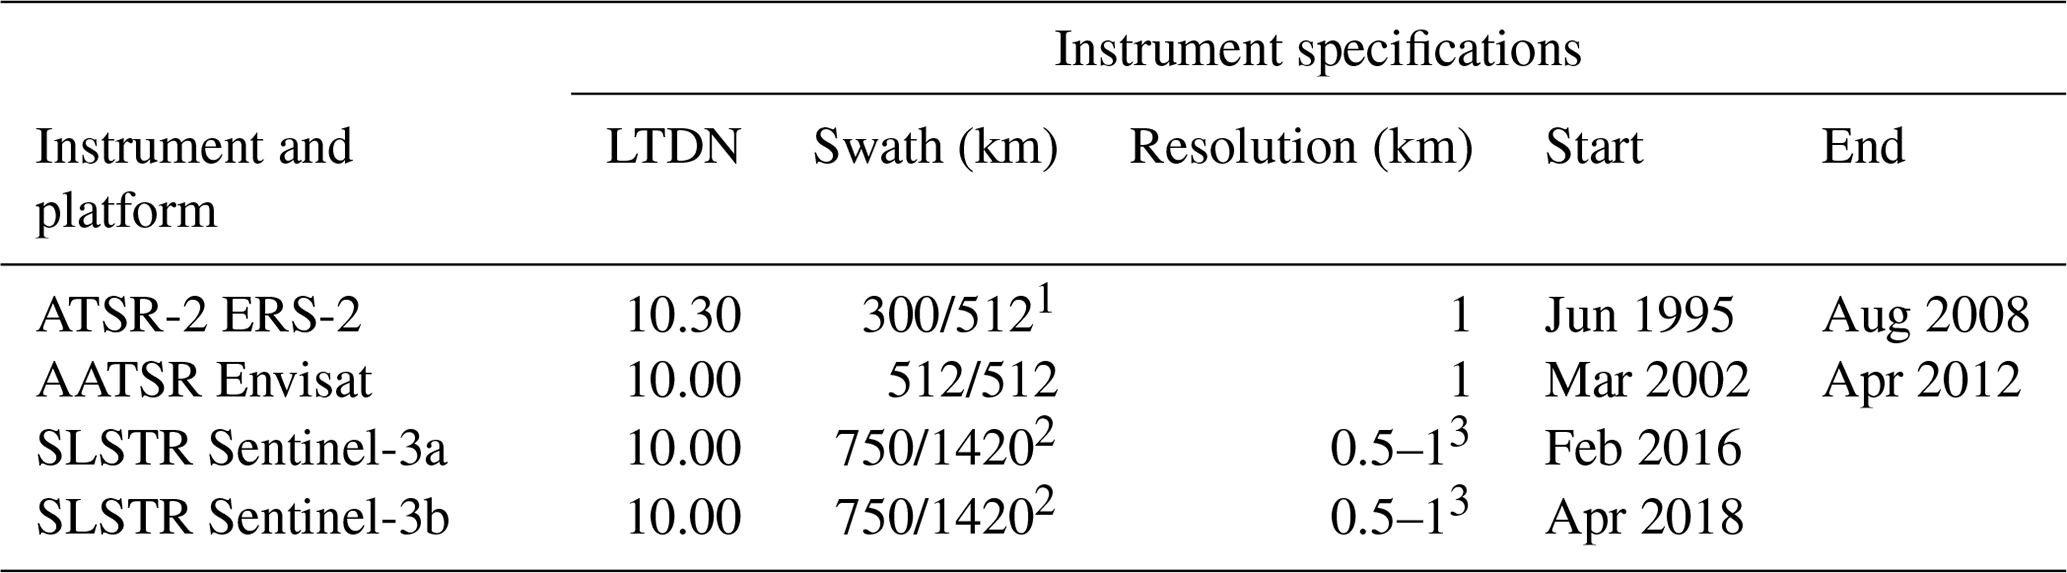
1 300 km swath over sea and 512 km over land. 2 1420 km nadir swath and 750 km backwards (dual) view swath. 3 0.5 km visible channel resolution and 1 km infrared channel resolution.
The ATSR series of instruments are a multi-channel (0.55, 0.66, 0.87, 1.6, 3.7, 11 and 12 µm) dual-view imaging radiometer with the principal objective of measuring global surface temperature, aerosols and clouds. ATSR-2 was launched on board ESA's second European Remote Sensing Satellite (ERS-2) spacecraft on 21 April 1995, while AATSR was launched on board Envisat in 2002, with final measurements taken on 9 May 2012. A follow-on instrument, SLSTR, was launched in February 2016 on board Sentinel-3A and a companion instrument was launched in April 2018 on board Sentinel-3B. The primary operational products are aerosol and land and sea surface temperature.
ATSR channels are specifically designed to have low noise. Furthermore, AATSR measurements are carried out with a high level of accuracy as the instrument includes an on-board thermal blackbody and a visible calibration system designed for high uniformity and stability (Smith et al., 2001). The on-board calibration is supplemented by vicarious calibration with ground targets (Smith and Cox, 2013). A high level of stability is maintained in the satellite's orbits through regular orbit control manoeuvres.
(Stephens, 1978)Table 2 Cloud_cci ATSR-2/AATSR cloud and radiation properties. ANNmask is the Artificial Neural Network for cloud detection, ANNphase is the Artificial Neural Network for cloud phase, SV is the state vector, PP stands for post-processed, OE stands for optimal estimation, BR is BUGSRad (a radiative flux algorithm), TOA stands for top-of-atmosphere, BOA stands for bottom-of-atmosphere (i.e. the surface), LW stands for longwave, SW and stands for shortwave. The upper part of the table has been adapted from Sus et al. (2018).
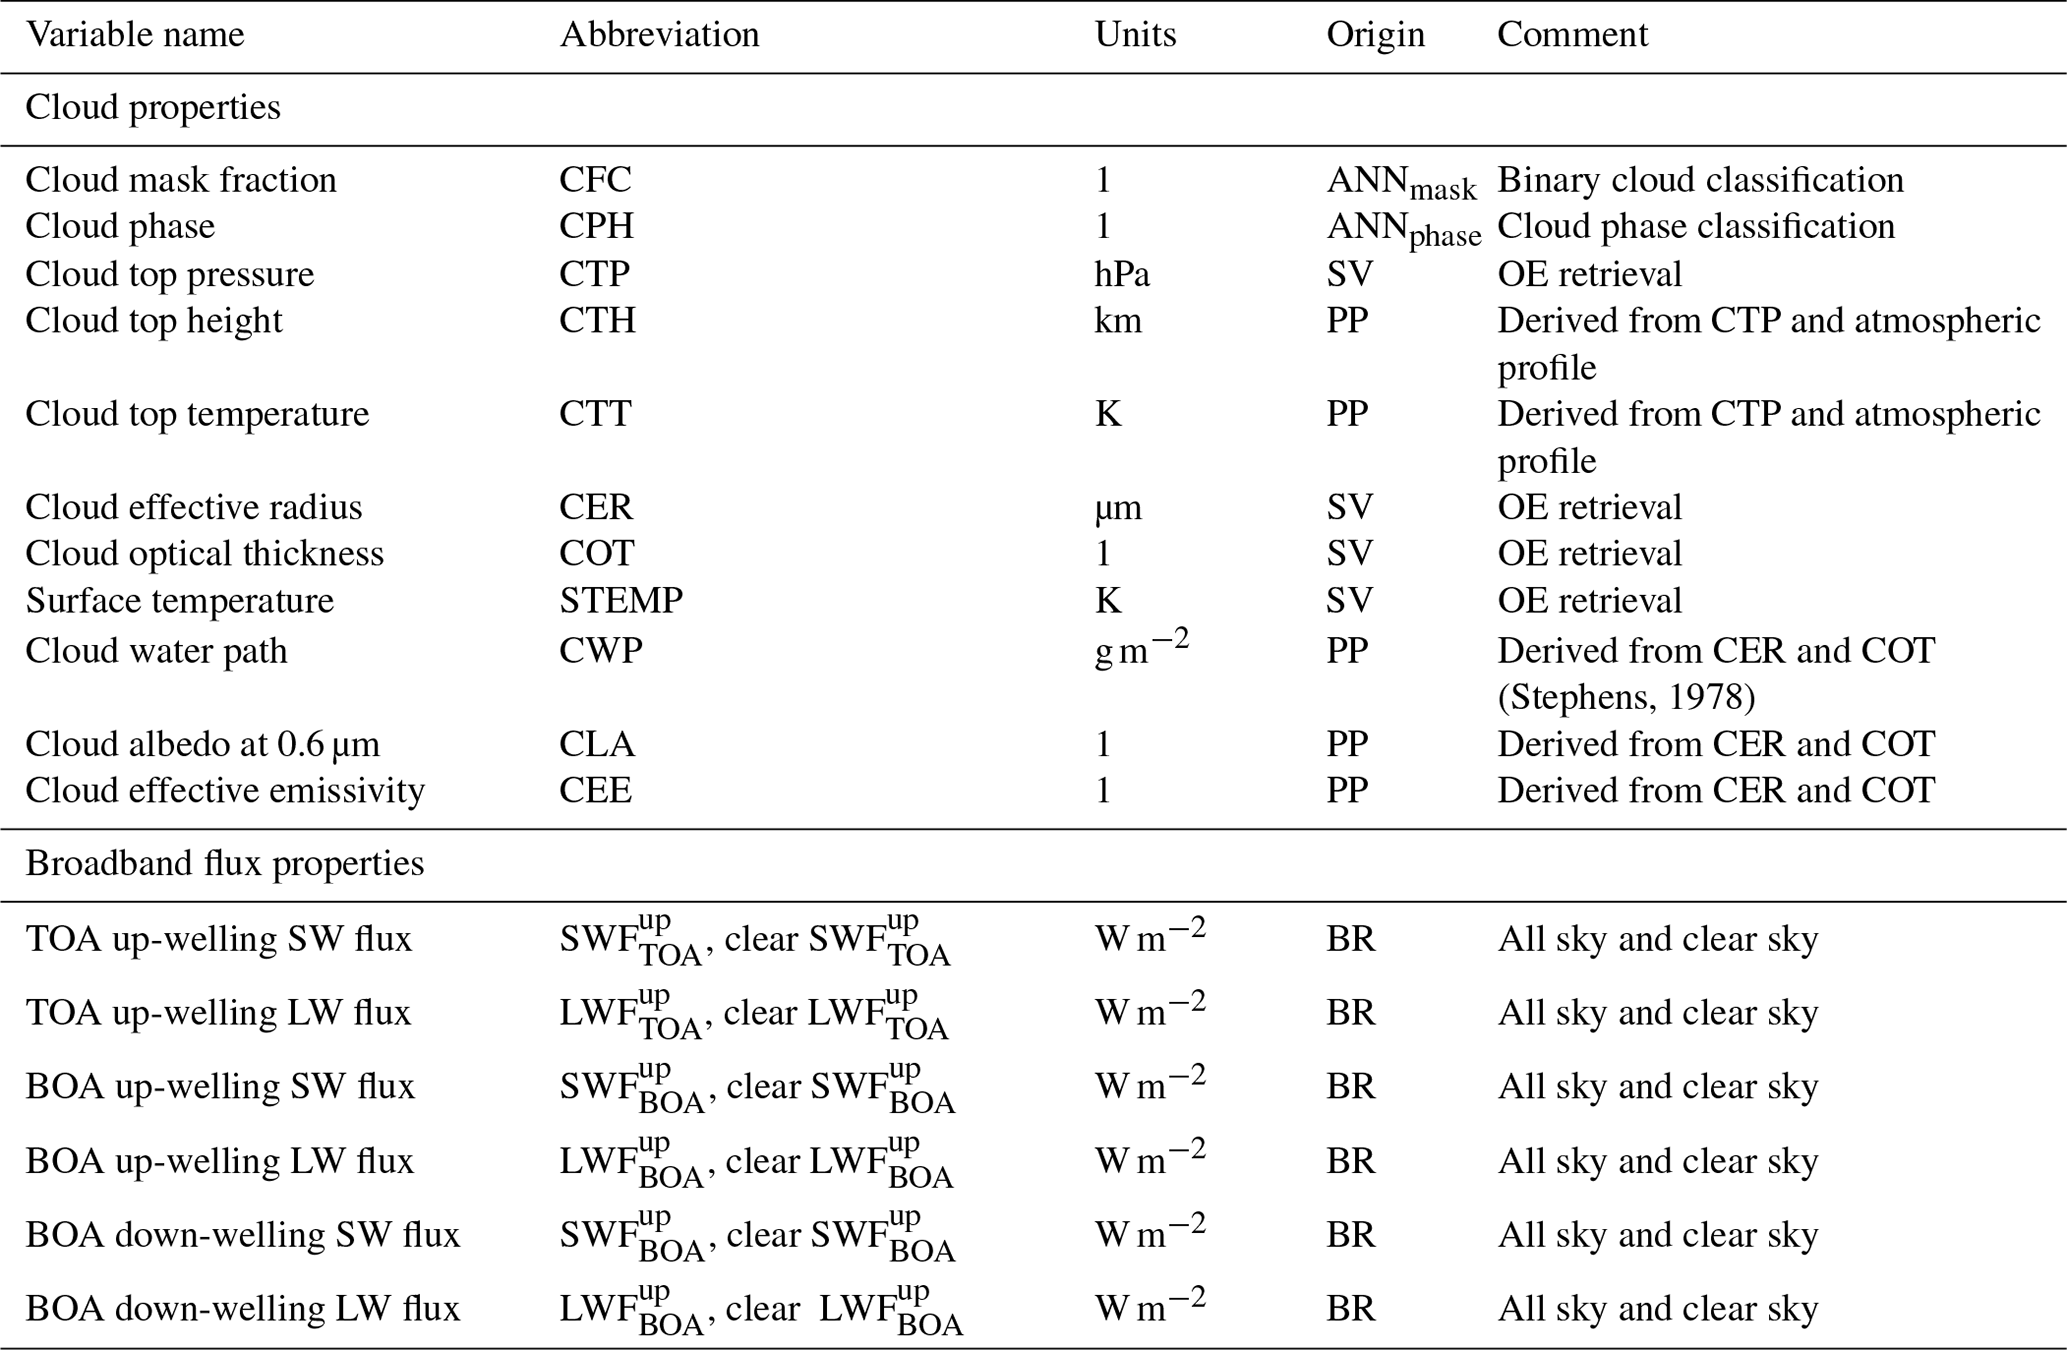
The same cloud variables are produced in version 3 (V3) as in version 2 (V2), but the flux products are new for V3. The variables, naming abbreviation, units and algorithm type are summarised in Table 2. The data are available on three processing levels.
-
Level-2. Retrieved cloud and flux variables at satellite-sensor-pixel level, being the same resolution and location as the sensor measurements (Level-1), i.e. approximately 1 km pixels.
-
Level-3U. Cloud and flux properties of Level-2 orbits projected onto a global spatial grid without combining any observations from overlapping orbits, i.e. only sub-sampling. These products use a latitude–longitude grid of 0.05∘ resolution.
-
Level-3C. Cloud and flux properties of Level-2 orbits from a single sensor combined (averaged and sampled for histograms) onto a global spatial grid. The temporal resolution of this product is 1 month. These products use a latitude–longitude grid of 0.5∘ resolution.
In addition to cloud properties, each of the retrieved cloud variables includes pixel-level uncertainties. The propagation of those from Level-2 to Level-3 is described in Stengel et al. (2017).
3.1 Algorithm
The ATSR-2/AATSR cloud products were produced using the Community Cloud retrieval for Climate (CC4CL) algorithm, developed during the ESA CCI programme. The algorithm has been described in detail in Stengel et al. (2017); Poulsen et al. (2012); McGarragh et al. (2017); Sus et al. (2018). For completeness, the basic concepts are summarised here. The CC4CL algorithm consists of three main components: (1) cloud detection, (2) cloud typing and (3) the retrieval of cloud properties based on an optimal estimation (OE) technique. The cloud mask and cloud phase are both determined using artificial neural network (ANN) algorithms. Each ANN is trained using CALIPSO data co-located with AVHRR and then transferred to the ATSR series of instruments through the application of spectral band adjustments described in Sus et al. (2018).
The optimal estimation retrieval within CC4CL, known as the Optimal Retrieval of Aerosol and Cloud (ORAC), is a non-linear statistical inversion method based on Bayes’ theorem (Rodgers, 2000). A state vector containing all variables to be retrieved is optimised to obtain the best fit between observed top-of-atmosphere (TOA) radiances and those simulated by a forward model. The inversion can accommodate a priori information and its associated uncertainty (though, in this application, only surface temperature is constrained, based on ERA-Interim reanalyses). The method provides a rigorous characterisation of the retrieval uncertainties, including propagation of measurement noise, the uncertainty in parameters assumed by the model and the uncertainty in the forward model itself. The retrieval also provides information about the quality of the fitting, such as the number of iterations it took to minimise the retrieval to an acceptable level and cost. Similar to a χ2 statistic, cost is a combination of the squared deviations between the measurements and forward model as well as the retrieved state vector and a priori state vector, each weighted by their associated covariance matrix. The cost provides an indication of how well the measurements fit the model. A cost of less than 5 is taken to mean the model was a good fit to measurements, though the exact threshold used does not greatly affect the conclusions. A higher cost indicates the model is failing to capture the observed conditions, such as multiple layers of cloud.
The radiation products are created using BUGSRad (Stephens et al., 1991) in a similar manner to Fu and Liou (1992). BUGSRad is a radiative transfer algorithm based on the two-stream approximation and correlated-k distribution methods of atmospheric radiative transfer. It is applied to a single-column atmosphere for which the cloud and aerosol layers are assumed to be plane-parallel. Cloud and aerosol properties retrieved using CC4CL, together with co-located visible and near-infrared surface albedo from MODIS (Schaaf et al., 2002), are ingested into BUGSRad to compute both shortwave and longwave radiative fluxes for the top- and bottom-of-atmosphere results. Total solar irradiance is drawn from the Solar and Heliospheric Observatory (SOHO; Domingo et al., 1995). The algorithm uses 18 bands that span the electromagnetic spectrum to compute the broadband flux. In total, 6 bands are used for shortwave and 12 bands are used for longwave radiative flux calculations. To account for the low sampling frequency of the polar orbiting satellite and the dependence of the shortwave fluxes on viewing geometry, an angular dependence correction is applied to the shortwave radiation properties to make the L3C monthly products represent 24 h averages. Further details are outlined in Stengel et al. (2019).
Since V2 was produced, a number of developments have been made regarding the algorithm, resulting in considerable improvement to the ATSR-2/AATSR records as summarised below. Figures 1 and 2 show global maps of yearly average cloud properties from 2008 for V3 Level-3C data compared to that from V2.
-
The cloud mask was retrained using a larger data set including 1 km CALIPSO data. This has reduced the number of clouds falsely detected over polar regions (sea, sea ice and land), reduced cloud coverage in the topics and increased the number of clouds detected in stratocumulus cloud banks.
-
The cloud phase selection in V2 used a threshold scheme developed by Heidinger and Pavolonis (2009). This has been replaced with an ANN approach for V3 (Stengel et al., 2019). The change significantly increased the number of clouds in the liquid phase and had a follow-on effect on other variables such as the LWP (increase) and correspondingly decreased the IWP and cloud albedo, particularly in polar regions and the northern and southern storm track regions. This change also affects the retrieval of cloud top height, with an overall reduction in the height of the clouds. This is particularly evident in the tropics and the stratocumulus cloud banks, accompanied by an increase in LWP. It also impacted the CER, as liquid clouds have a smaller effective radius than ice clouds.
-
The surface reflectance model was revised to correct a bug in the application of large solar zenith angles over bright polar surfaces. This resulted, in a significant decrease in the COT and CER, to much more realistic values. Changes outside the polar regions were minimal.
-
The look-up tables (LUTs) are now based on Baum et al. (2014) ice optical properties instead of Baran et al. (2004). This resulted in significantly smaller ice CER and COT, with a corresponding reduction in IWP to more realistic values.
-
In V2, maintaining consistency with the earlier sections of the AVHRR record required using lower-resolution (and less accurate) auxiliary data sets for ice and snow, such as European Centre for Medium Range Forecasting (ECMWF) reanalysis, and inferior land sea masks. This resulted in poor results over mountainous and snow- or ice-covered regions. These auxiliary data sets were also not consistent with those used by the AATSR ORAC Aerosol_cci. In V3, we implemented the higher resolution National Snow and Ice data centre (NISE) masks (Brodzik and Stewart, 2016), improving retrievals over snow and ice covered surfaces.
-
In V2 there was a discontinuity between the ATSR-2 and AATSR cloud retrievals, particularly in cloud fraction, COT and CER. This discontinuity was caused by a number of factors:
-
The use of the 3.7 µm channel to generate the data set, which differs in dynamic range between ATSR-2 and AATSR.
-
Differences between the two instruments in the availability of shortwave channels across the swath during the day.
-
-
In order to create a record which minimised the inconsistency between ATSR-2 and AATSR (and the aerosol record), in V3 cloud properties were retrieved using the 1.6 µm channel rather than the 3.7 µm channel and only retrieved for the narrow swath mode of ATSR-2 when all channels are present.
The key strengths of the Cloud_cci data sets have been retained in V3.
-
The spectral consistency of derived parameters, which is achieved by an OE approach based on a physically consistent cloud model simultaneously fitting satellite observations from the visible to the mid-infrared.
-
Uncertainty characterisation, which is inferred at pixel level from OE theory, that is physically consistent (1) with the uncertainties of the input data (e.g. measurements, a priori) and (2) among the retrieved variables. These pixel-level uncertainties are further propagated into the monthly products.
-
Comprehensive assessment and documentation of the retrieval schemes and the derived cloud property data sets, including the exploitation of applicability for evaluation of climate models and reanalyses.
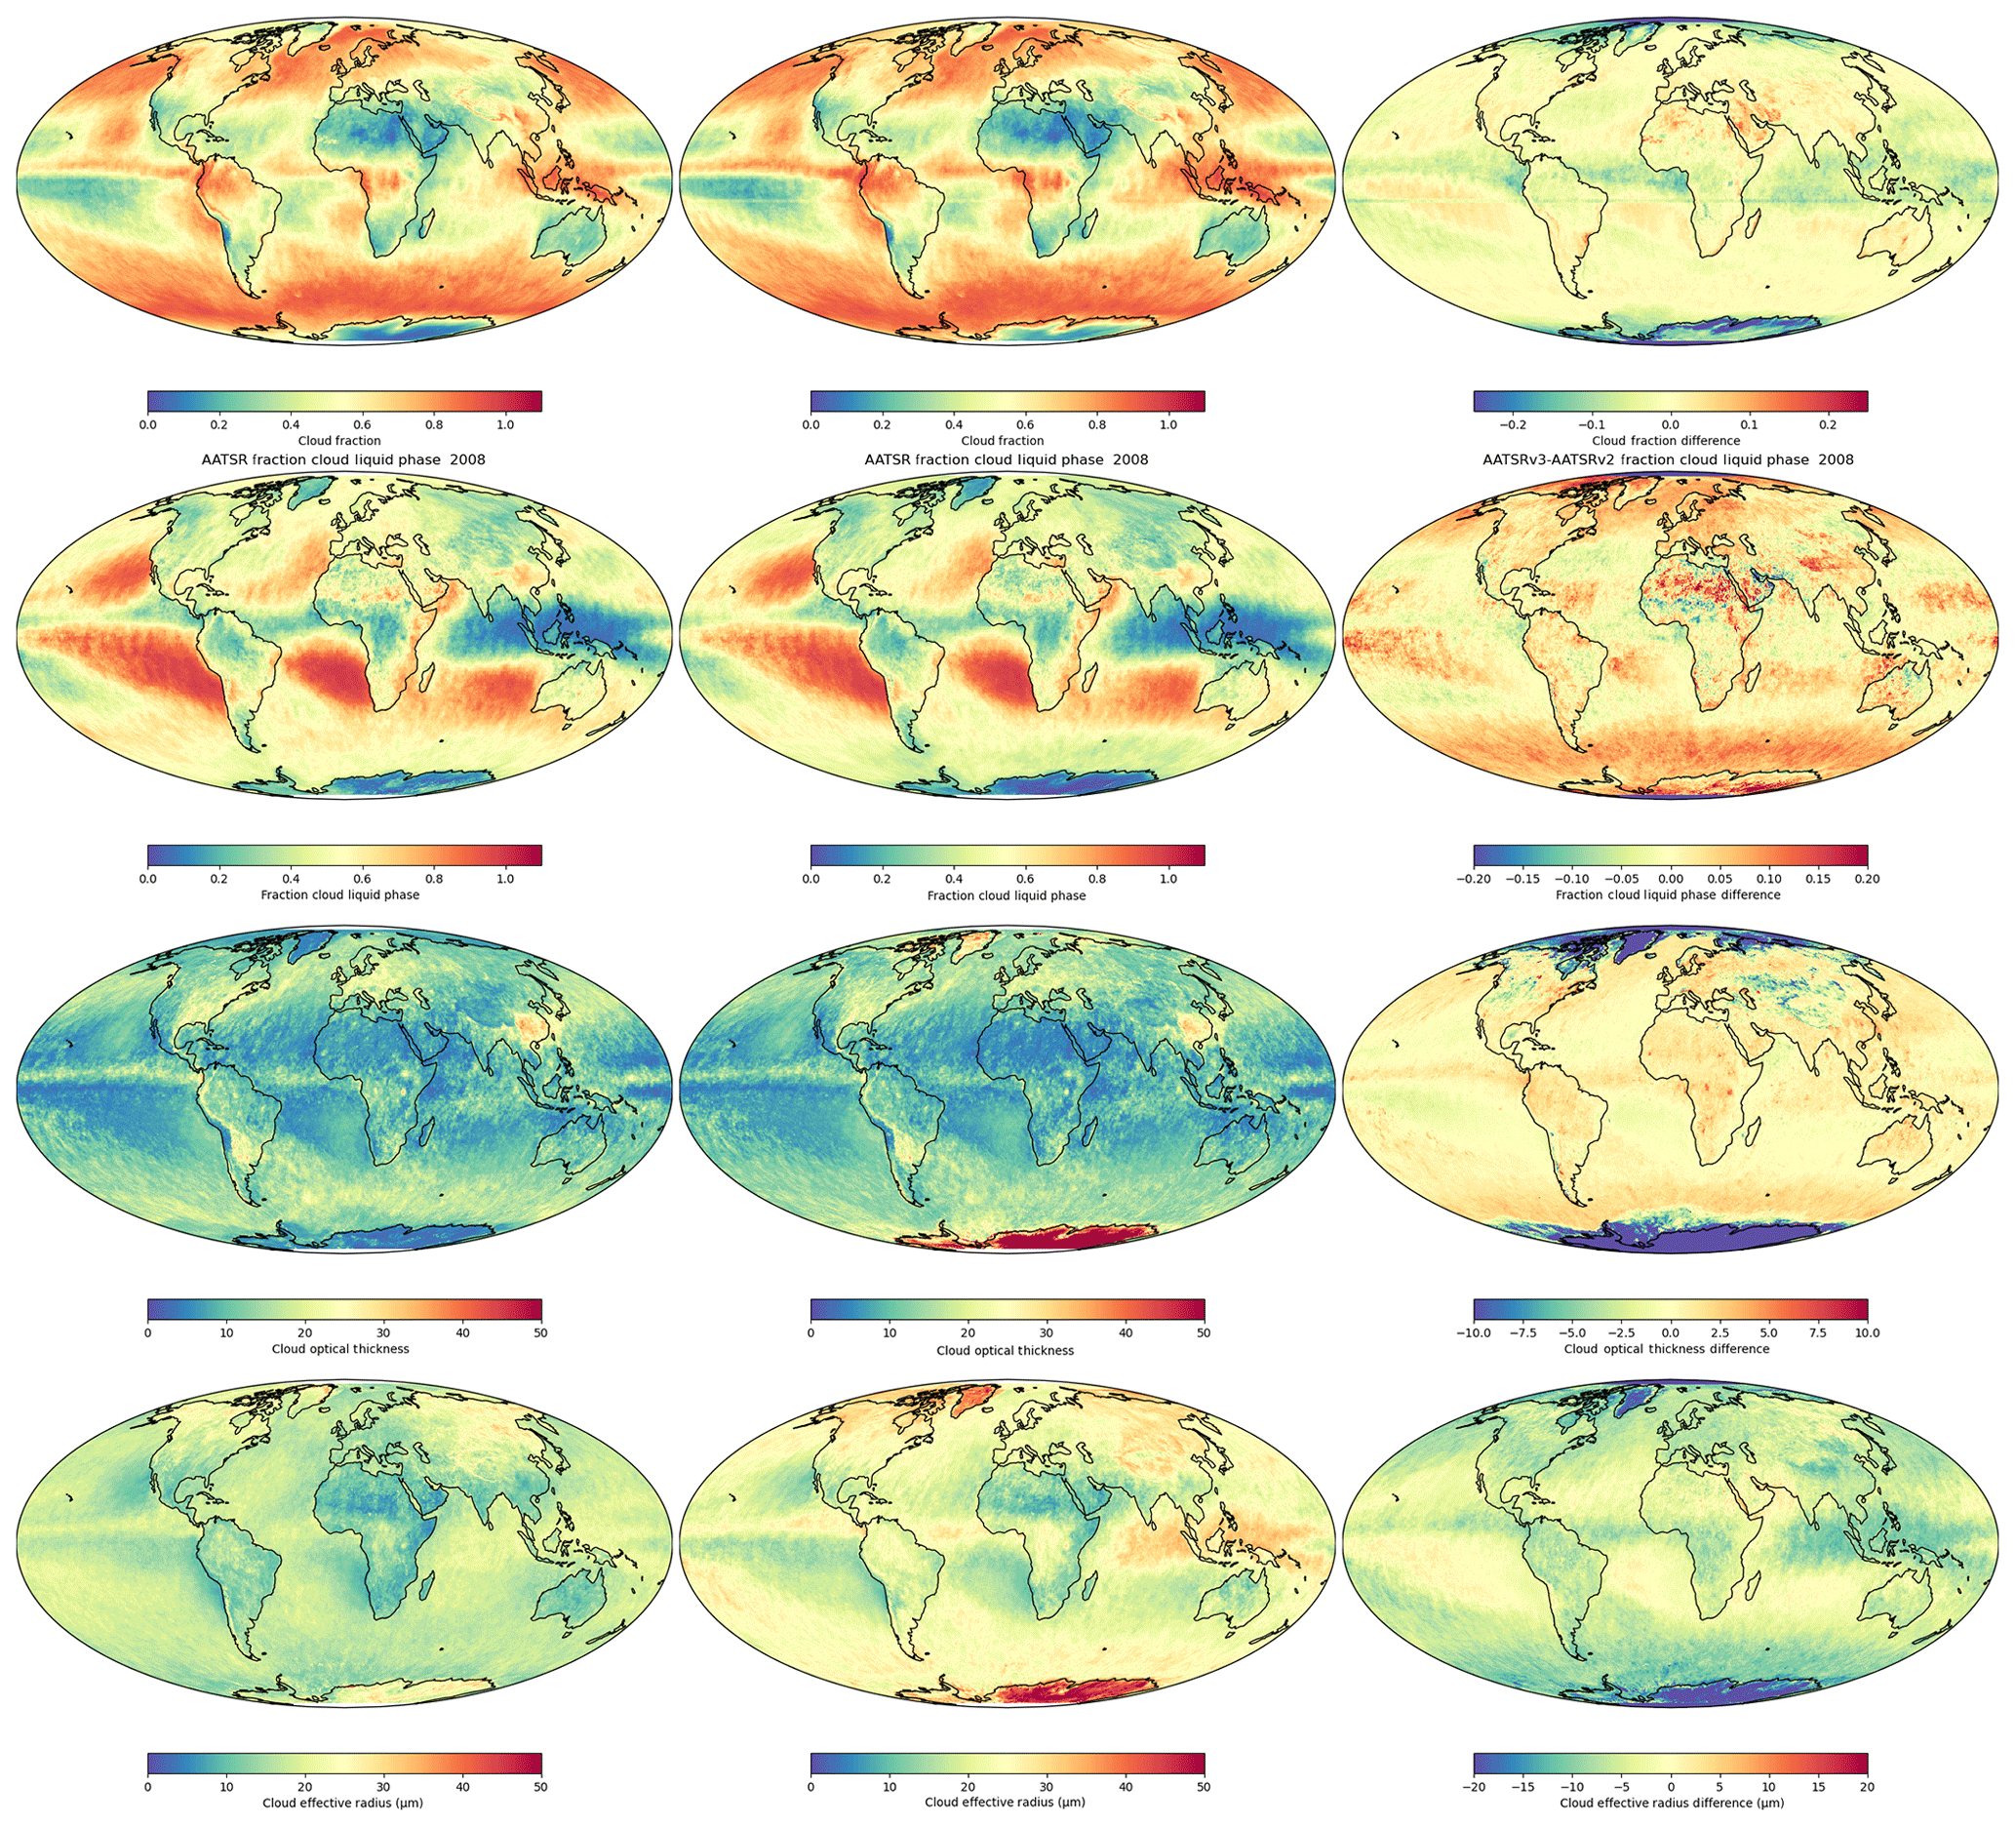
Figure 1 Examples from 2008 of Level-3C (yearly average) Cloud_cci AATSR V3 (left column), V2 (middle column) and the difference between V3 and V2 (right column). From the top the rows represent the following variables: cloud fraction (CFC), liquid cloud faction (CPH), cloud optical thickness (COT) and cloud effective radius (CER).
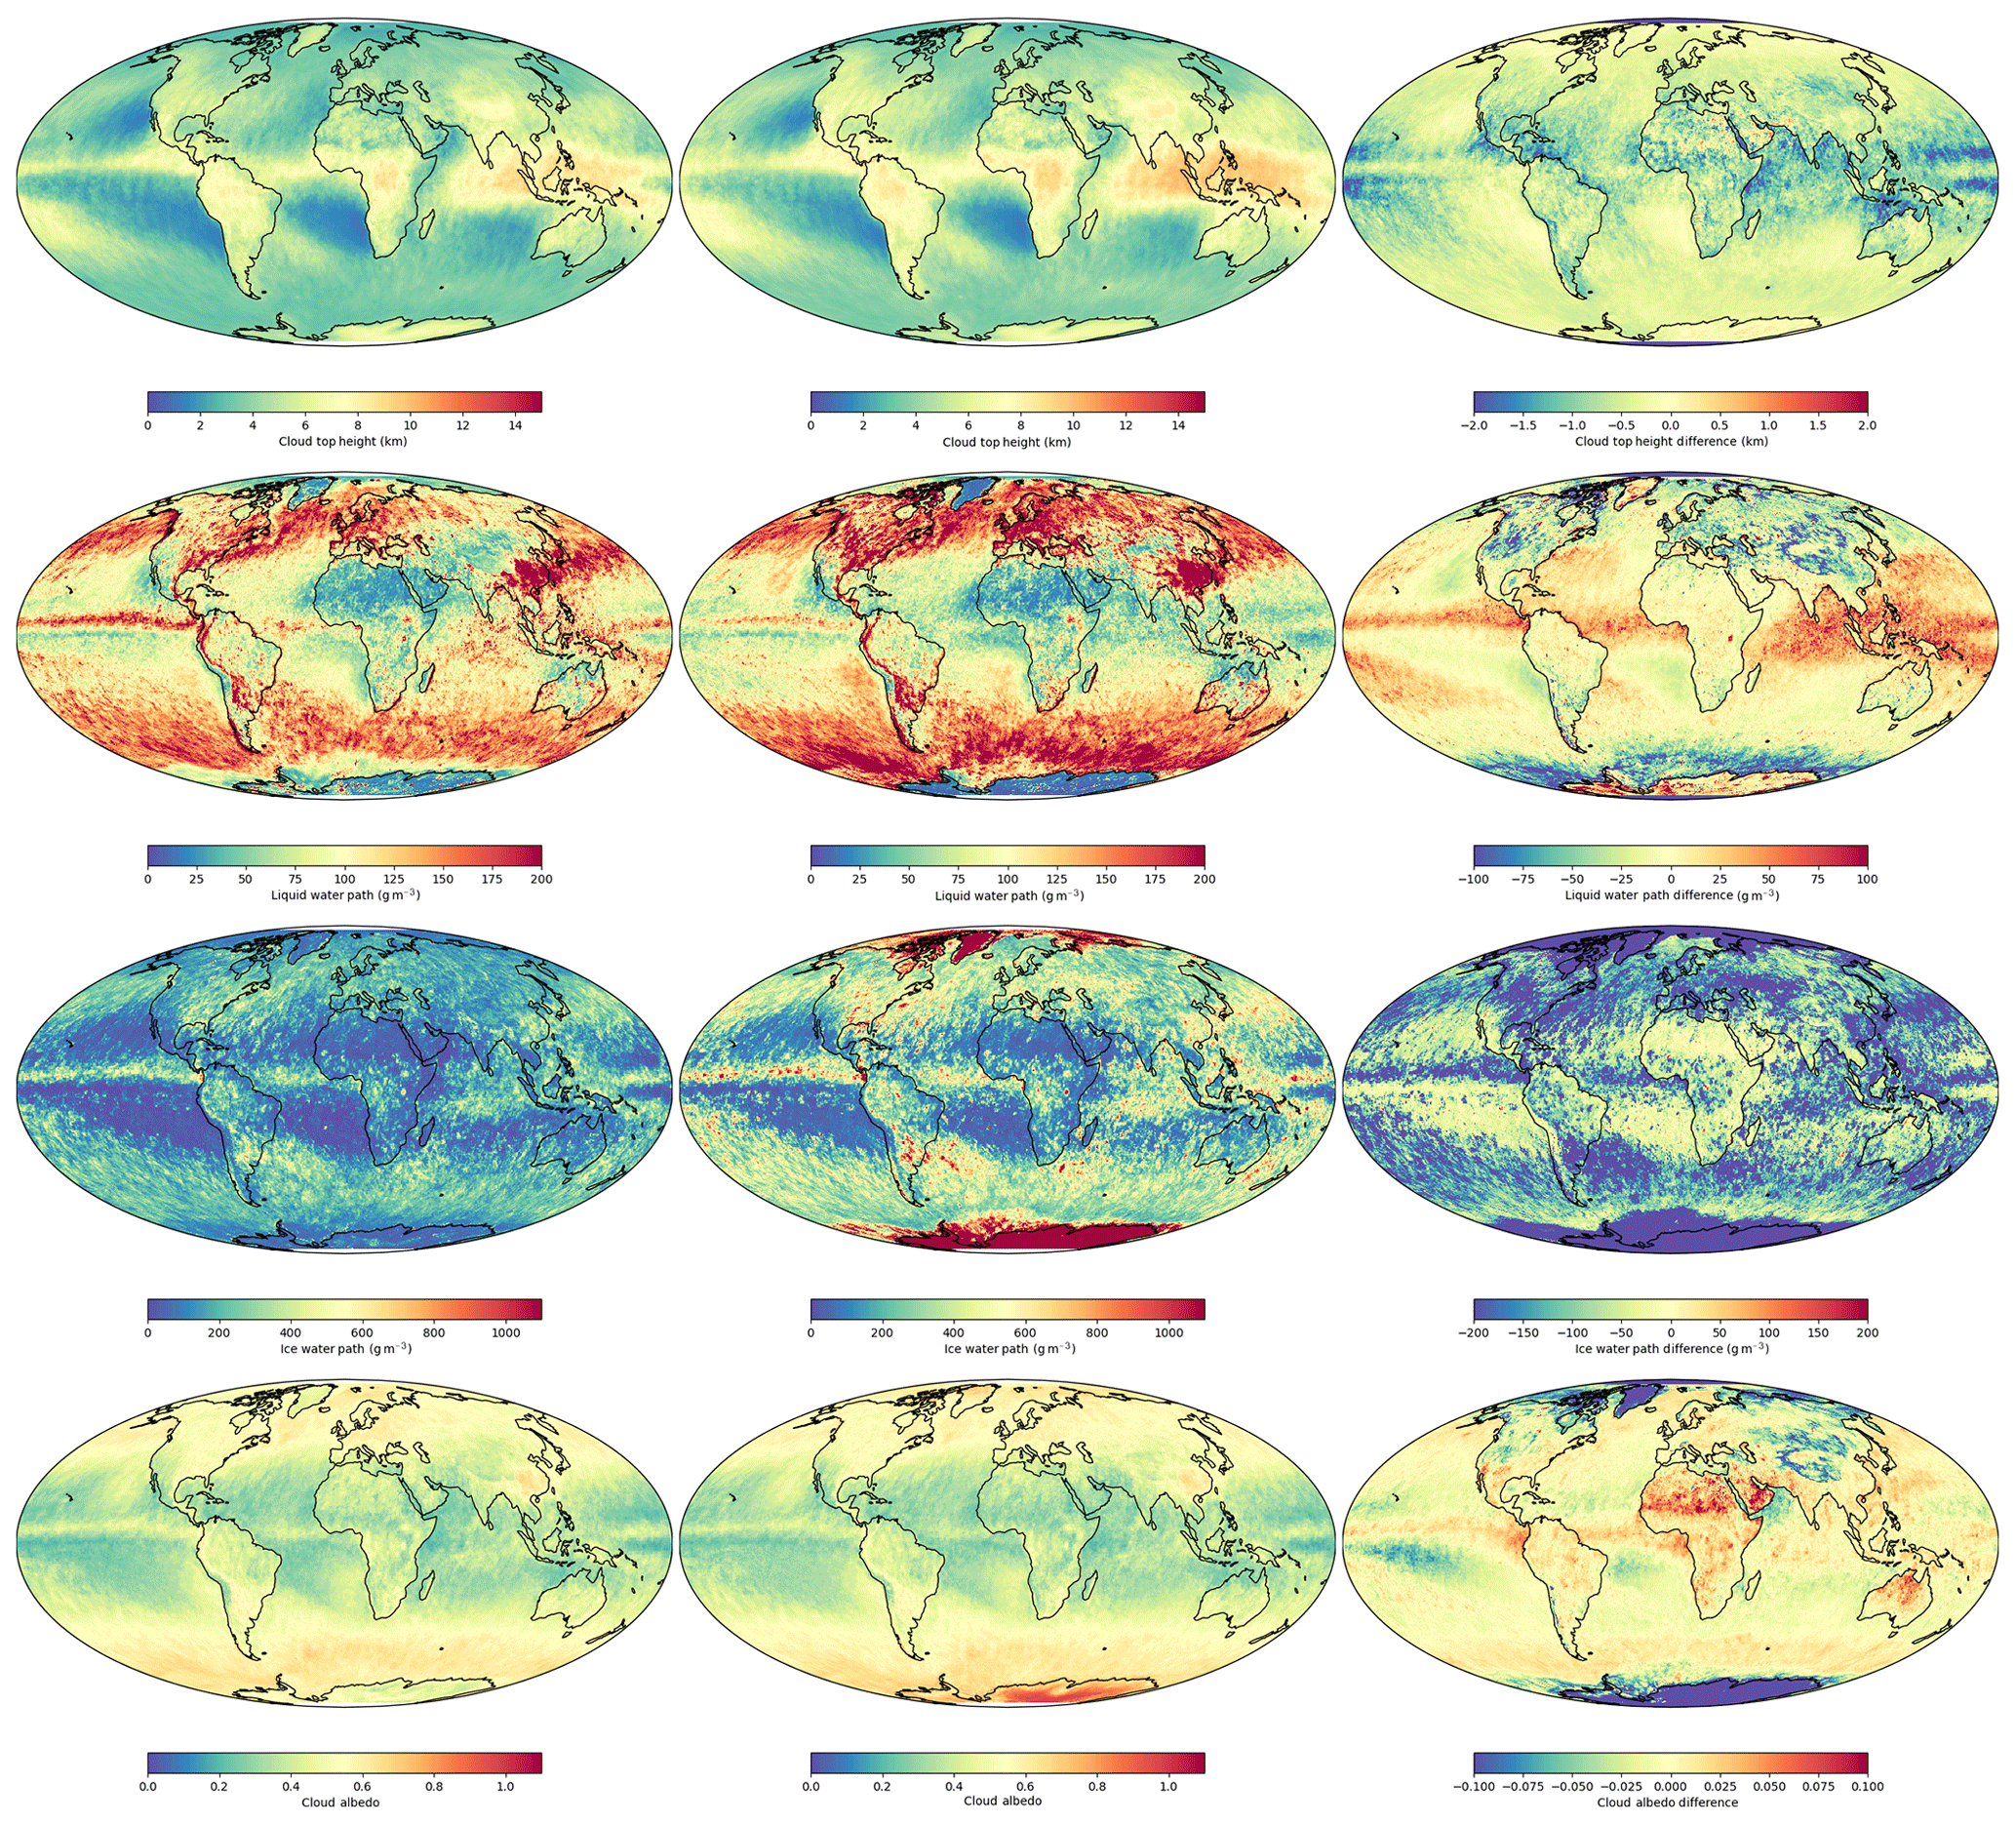
Figure 2As in Fig. 1 but for cloud top height (CTH), liquid water path (LWP), ice water path (IWP) and cloud albedo (CLA).
An evaluation of CC4CL cloud mask and cloud top height Level-2 products has been carried out based on CALIPSO data for five days, covering all seasons, in 2008: 20 March, 13 June, 20 June, 21 September and 20 December. The cloud fraction and height validation was based on CALIPSO cloud observations which were simultaneously (i.e. within 5 min) observing the same location as the AATSR satellite. For morning satellites, such co-locations only occur at high latitudes, i.e. greater that 70∘, restricting the comparison to the types of cloud found at those latitudes. Clouds in that latitude band are often located over snow and sea ice, which is a more difficult retrieval as both clouds and the surface are bright in the visible channels and cold in the infrared. Hence, these results should be considered a conservative validation, as the results for other regions, such as mid-latitudes and the tropics (particularly over ocean), are likely to be more accurate. The CALIPSO cloud products used in the validation study were the 1 km layer and 5 km layer products of version 4.20.
4.1 Cloud fraction
The AATSR Level-2 cloud fraction products are retrieved at 1 km resolution, and thus the retrievals were co-located with the CALIPSO 1 km cloud products. These are less sensitive to thin clouds than the 5 km products (NASA, 2019), which were used in the evaluation of the Cloud_cci AVHRR products (Stengel et al., 2019). The validation was repeated using the 5 km products (not shown) and the changes were negligible. The Hanssen–Kuiper skill score (KSS), an often used skill score (Hanssen and Kuipers, 1965) is defined as , where TPR is fraction of pixels correctly identified as cloud and FPR is the fraction of pixels wrongly identified as cloud. The results are consistent with the results found for the AVHRR Cloud_cci product in the same region.
The results of the comparison are shown in Table 3. The cloud detection has clearly improved for V3, with the most significant improvement being the identification of clear pixels. This result is consistent with the reduction in cloud fraction observed over the poles in the global maps. The cloud detection improved for both clear and cloudy pixels. The identification of clear pixels increased significantly from a probability of detection (PODclear), i.e. the fraction of pixels identified correctly as clear, of 61 % to 76 %.
Table 3 Comparison of co-located AATSR cloud mask and CALIPSO 1 km layer product for V2 (left) and V3 (right). The comparison metrics shown are hit rate, the percentage of pixels identified correctly as either cloudy or clear, the Probability Of Detection (POD) for cloudy and clear pixels separately, the Hanssen-Kuiper skill score (KSS; defined as ), and the total number (cloudy and clear) of co-locations used in the analysis.

4.2 Cloud top height
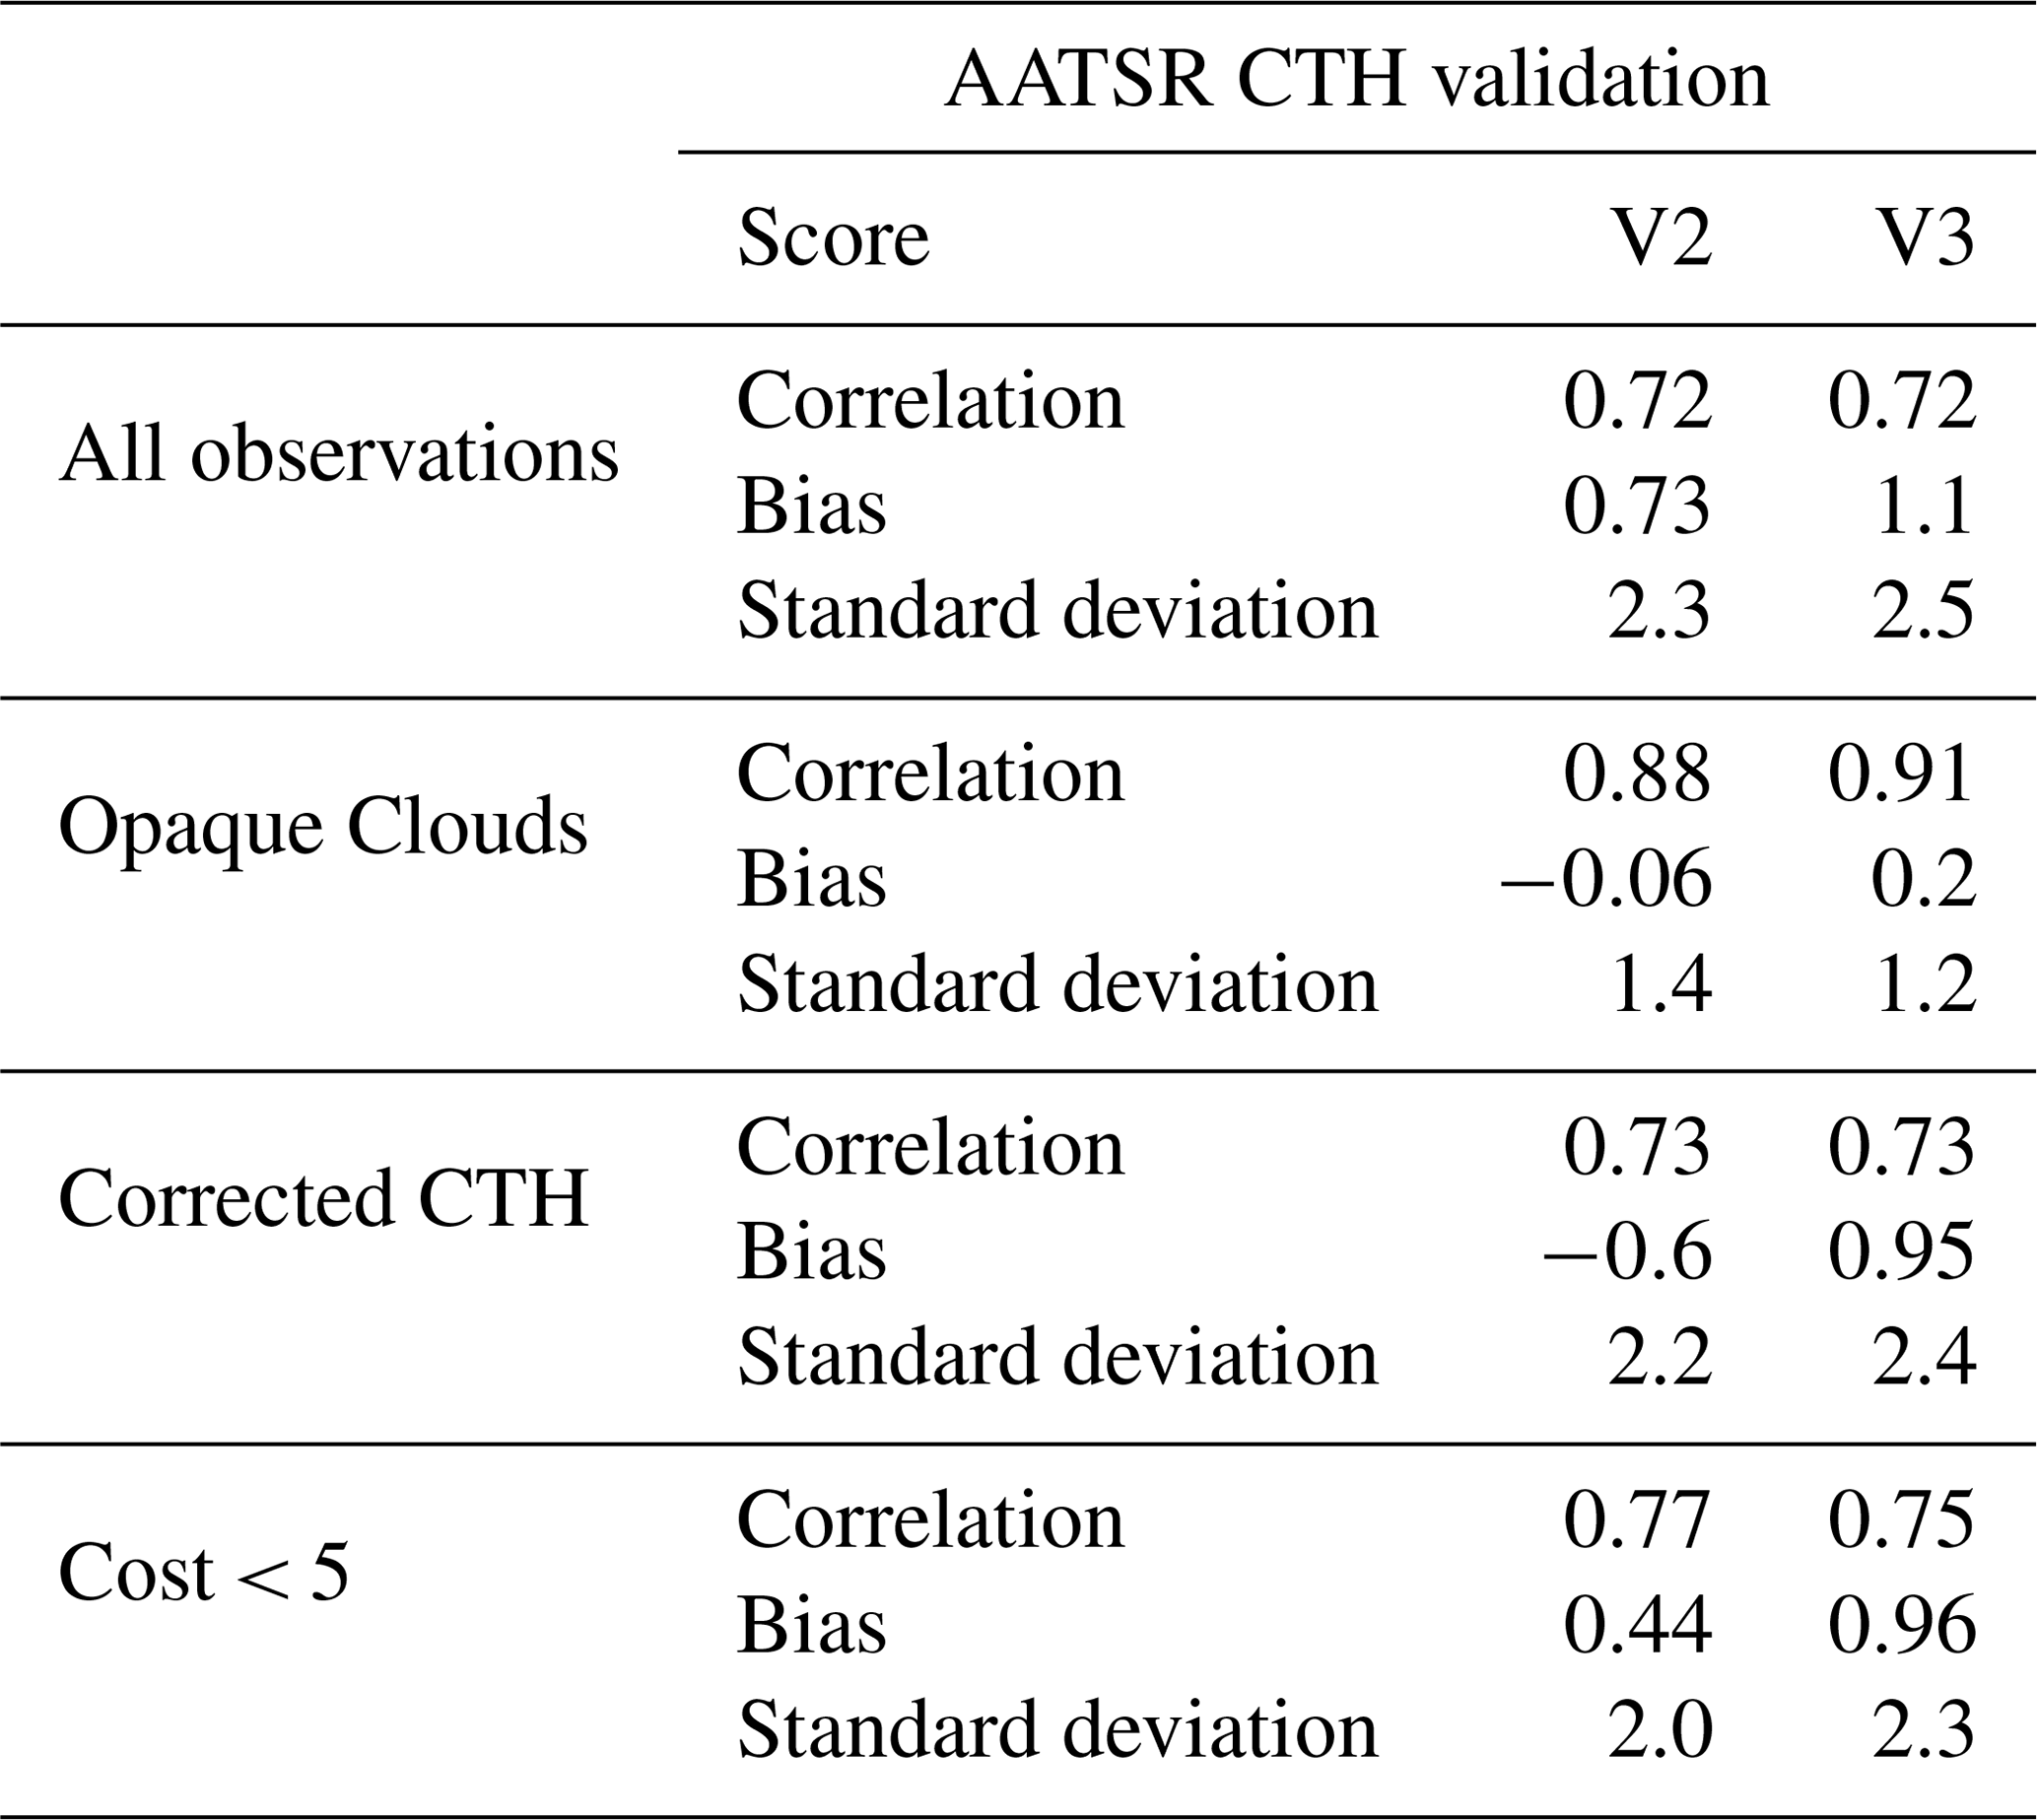
The cloud top height product was validated using the CALIPSO 1 km product. In previous studies (Sus et al., 2018) it was shown that the CTH retrieval is more accurate when the cloud is opaque or single layer. Here, the opacity flag from the CALIPSO 1 km layer product is used to verify this finding. The opacity flag indicates features that completely attenuate the lidar beam (NASA, 2019). Results are summarised in Table 4 and are presented separately for all cloud observations, only opaque clouds, the cloud top height corrected for penetration depth and for all clouds retrievals with a cost less than 5 (as would be expected for single-layer clouds). The cost is an output of the optimal estimation retrieval scheme and is the result of the squared deviations between the measurements and the forward model (which in this scenario is a single layer of cloud) and the retrieved state vector and the a priori state vector, weighted by an associated covariance matrix. Essentially, it is an indicator of whether the observed measurements were a good fit to the forward model. A cost of less than 5 indicates the measurements fit the model well. A higher cost would indicate we are viewing cloud from multiple layers, for example. From V2 to V3, the correlation with the lidar measurements for all the co-located pixels was unchanged, but the bias decreased from 1.3 to 0.9 km. When only opaque clouds are considered, the correlation increases considerably but with a slight increase in bias. The corrected cloud top heights are produced by approximating the observed brightness temperature as emitted from one optical depth into the cloud and assuming the cloud is vertically homogeneous with a constant lapse rate. This product achieves a similar correlation to the all-cloud results but further reduces the bias from 0.94 to 0.85 km for V3. For clouds with a cost of less than 5, the correlation decreased and the bias also reduced. High costs are indicative of multi-layer cloud, such as thin cirrus over liquid cloud. These are typically retrieved as some weighted average of the two layers, returning a nonphysical value (Poulsen et al., 2012). Overall, V3 is a superior cloud top height (temperature and pressure) product. The comparison was also performed with the CALIPSO 5 km layer (not shown), and the sensitivity to optical depth is investigated. The results showed negligible variation with optical depth threshold and with the 5 km product.
Table 4 Comparison of AATSR cloud top height with co-located CALIPSO measurements for 5 d in 2008. On the left V2 is shown, and V3 is shown on the right . The results are shown for all observations, only opaque clouds (as defined by CALIPSO), the corrected cloud top height product and retrievals with a cost of less than 5. All values are in kilometres.
4.3 Liquid water path
The liquid water path of the Cloud_cci data sets is evaluated against the Multisensor Advanced Climatology of Liquid Water Path (MAC-LWP) data set (Elsaesser et al., 2017) over ocean. The MAC-LWP climatology is based on retrievals from multiple microwave radiometer instruments, including the SSM/I series (Special Sensor Microwave Imager), the Tropical Rainfall Measurement Mission Microwave Imager (TMI) and the Advanced Microwave Scanning Radiometer for EOS (AMSR-E). Microwave measurements of LWP are typically more accurate than visible imagers because microwave instruments are able to penetrate deep convective clouds and ice over water clouds while also measuring the LWP at lower altitudes, which is not possible for passive imagers. Their disadvantage is the large footprint, up to 0.25∘.
This evaluation focuses on regions where liquid clouds are dominant (i.e. fewer than 5 % ice clouds), specifically three stratocumulus regions: the oceanic area west of Africa at 10–20∘ S, 0–10∘ E (SAF); the area west of South America at 16–26∘ S, 76–86∘ W (SAM); and the area west of California at 20–30∘ N, 120–130∘ W (NAM), similar to the analyses in the Cloud_cci Product Evaluation Intercomparison Report (PVIR, 2018). The MAC-LWP data set was co-located with the Cloud_cci data set on a monthly basis. No correction was made for the diurnal cycle as it is assumed to be small in the selected regions. A time series of the comparison is shown in Fig. 3 and summarised in Table 5. There was a significant improvement from V2 to V3, particularly in the consistency between the ATSR-2 and AATSR instruments. The V2 data set showed a large offset between ATSR-2 and AATSR, which has almost disappeared in V3. The correlation with MAC-LWP exhibited in V3 is extremely good, over 0.8 for all regions, which is a significant improvement over V2, particularly for the region off the Californian coast. The associated bias and standard deviation are also very low, typically less than 5 % of the total liquid water path.
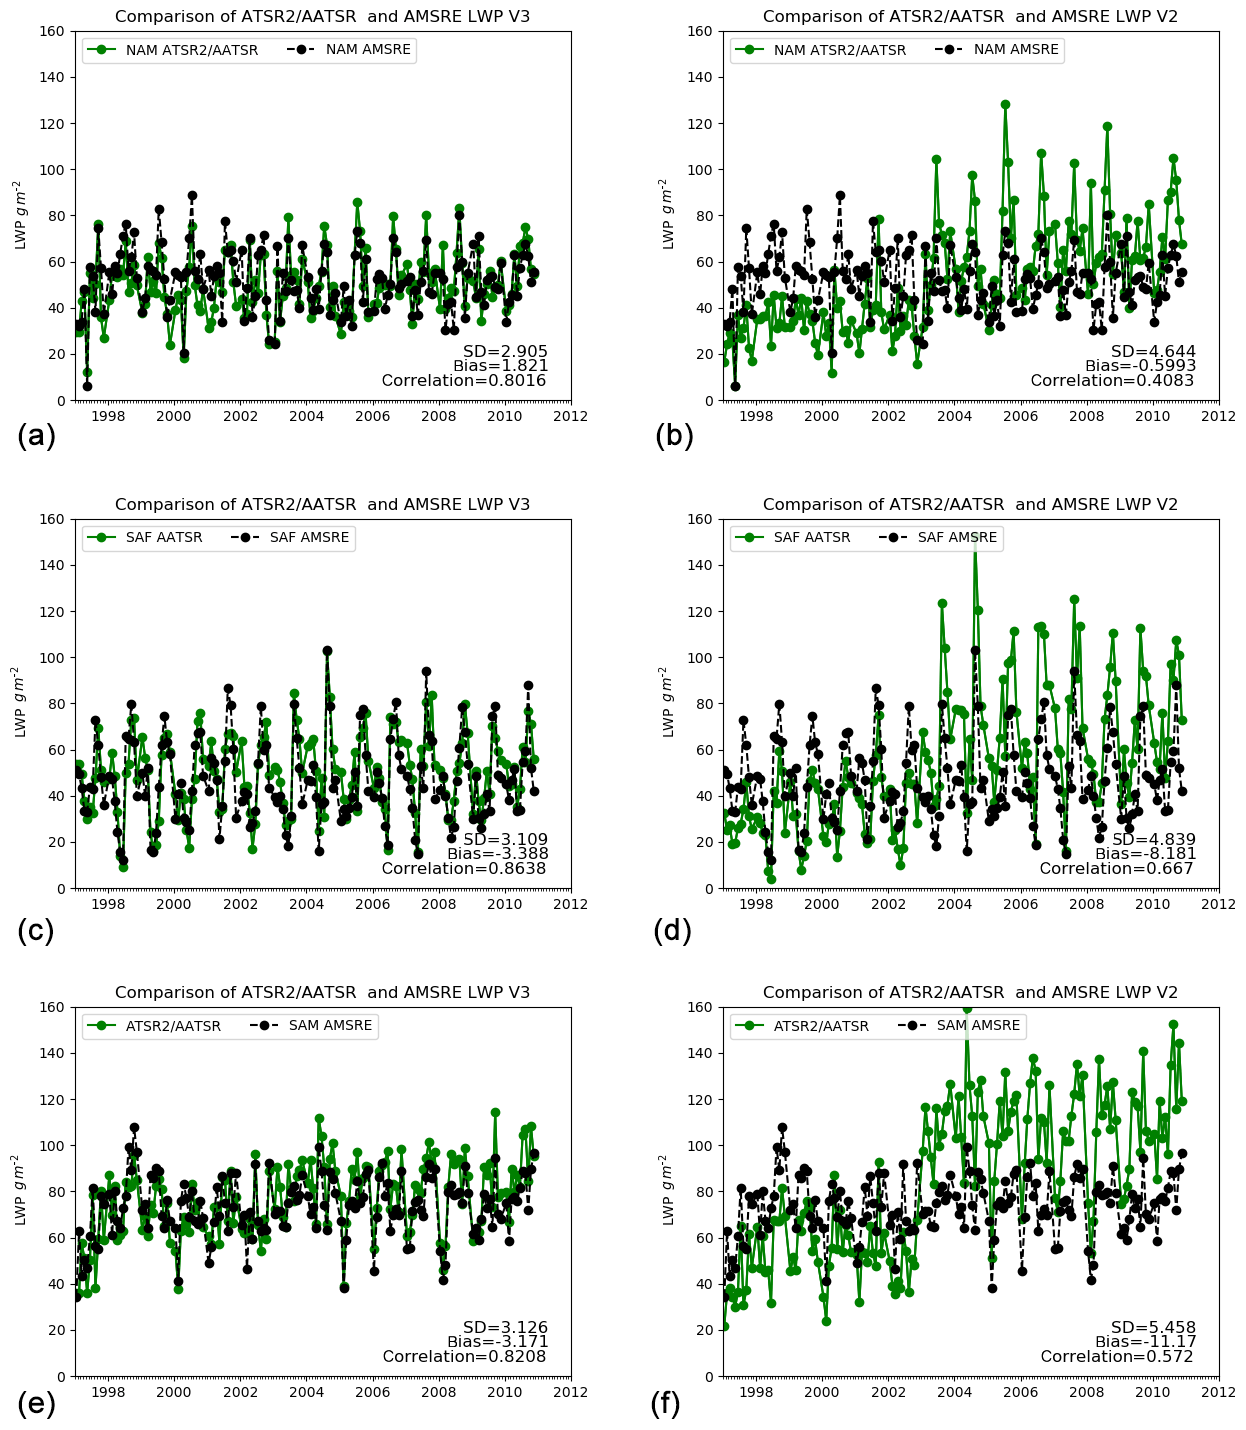
Figure 3Comparison of ATSR-2/AATSR Cloud_cci LWP time series (coloured) with MAC-LWP (black) for three regions: west of California (NAM, a, b), west of Africa (SAF, c, d), and west of South America (SAM, e, f). Version 3 (a, c, e) has reduced the discontinuity between sensors seen in version 2 (b, d, f).
Table 5 Multi-annual (2000–2012) liquid water path validation results for ATSR-2/AATSR when compared with MAC-LWP monthly data for three regions of predominantly stratocumulus cloud. The results for V2 (left) and V3 (right) are compared for correlation, bias and standard deviation.
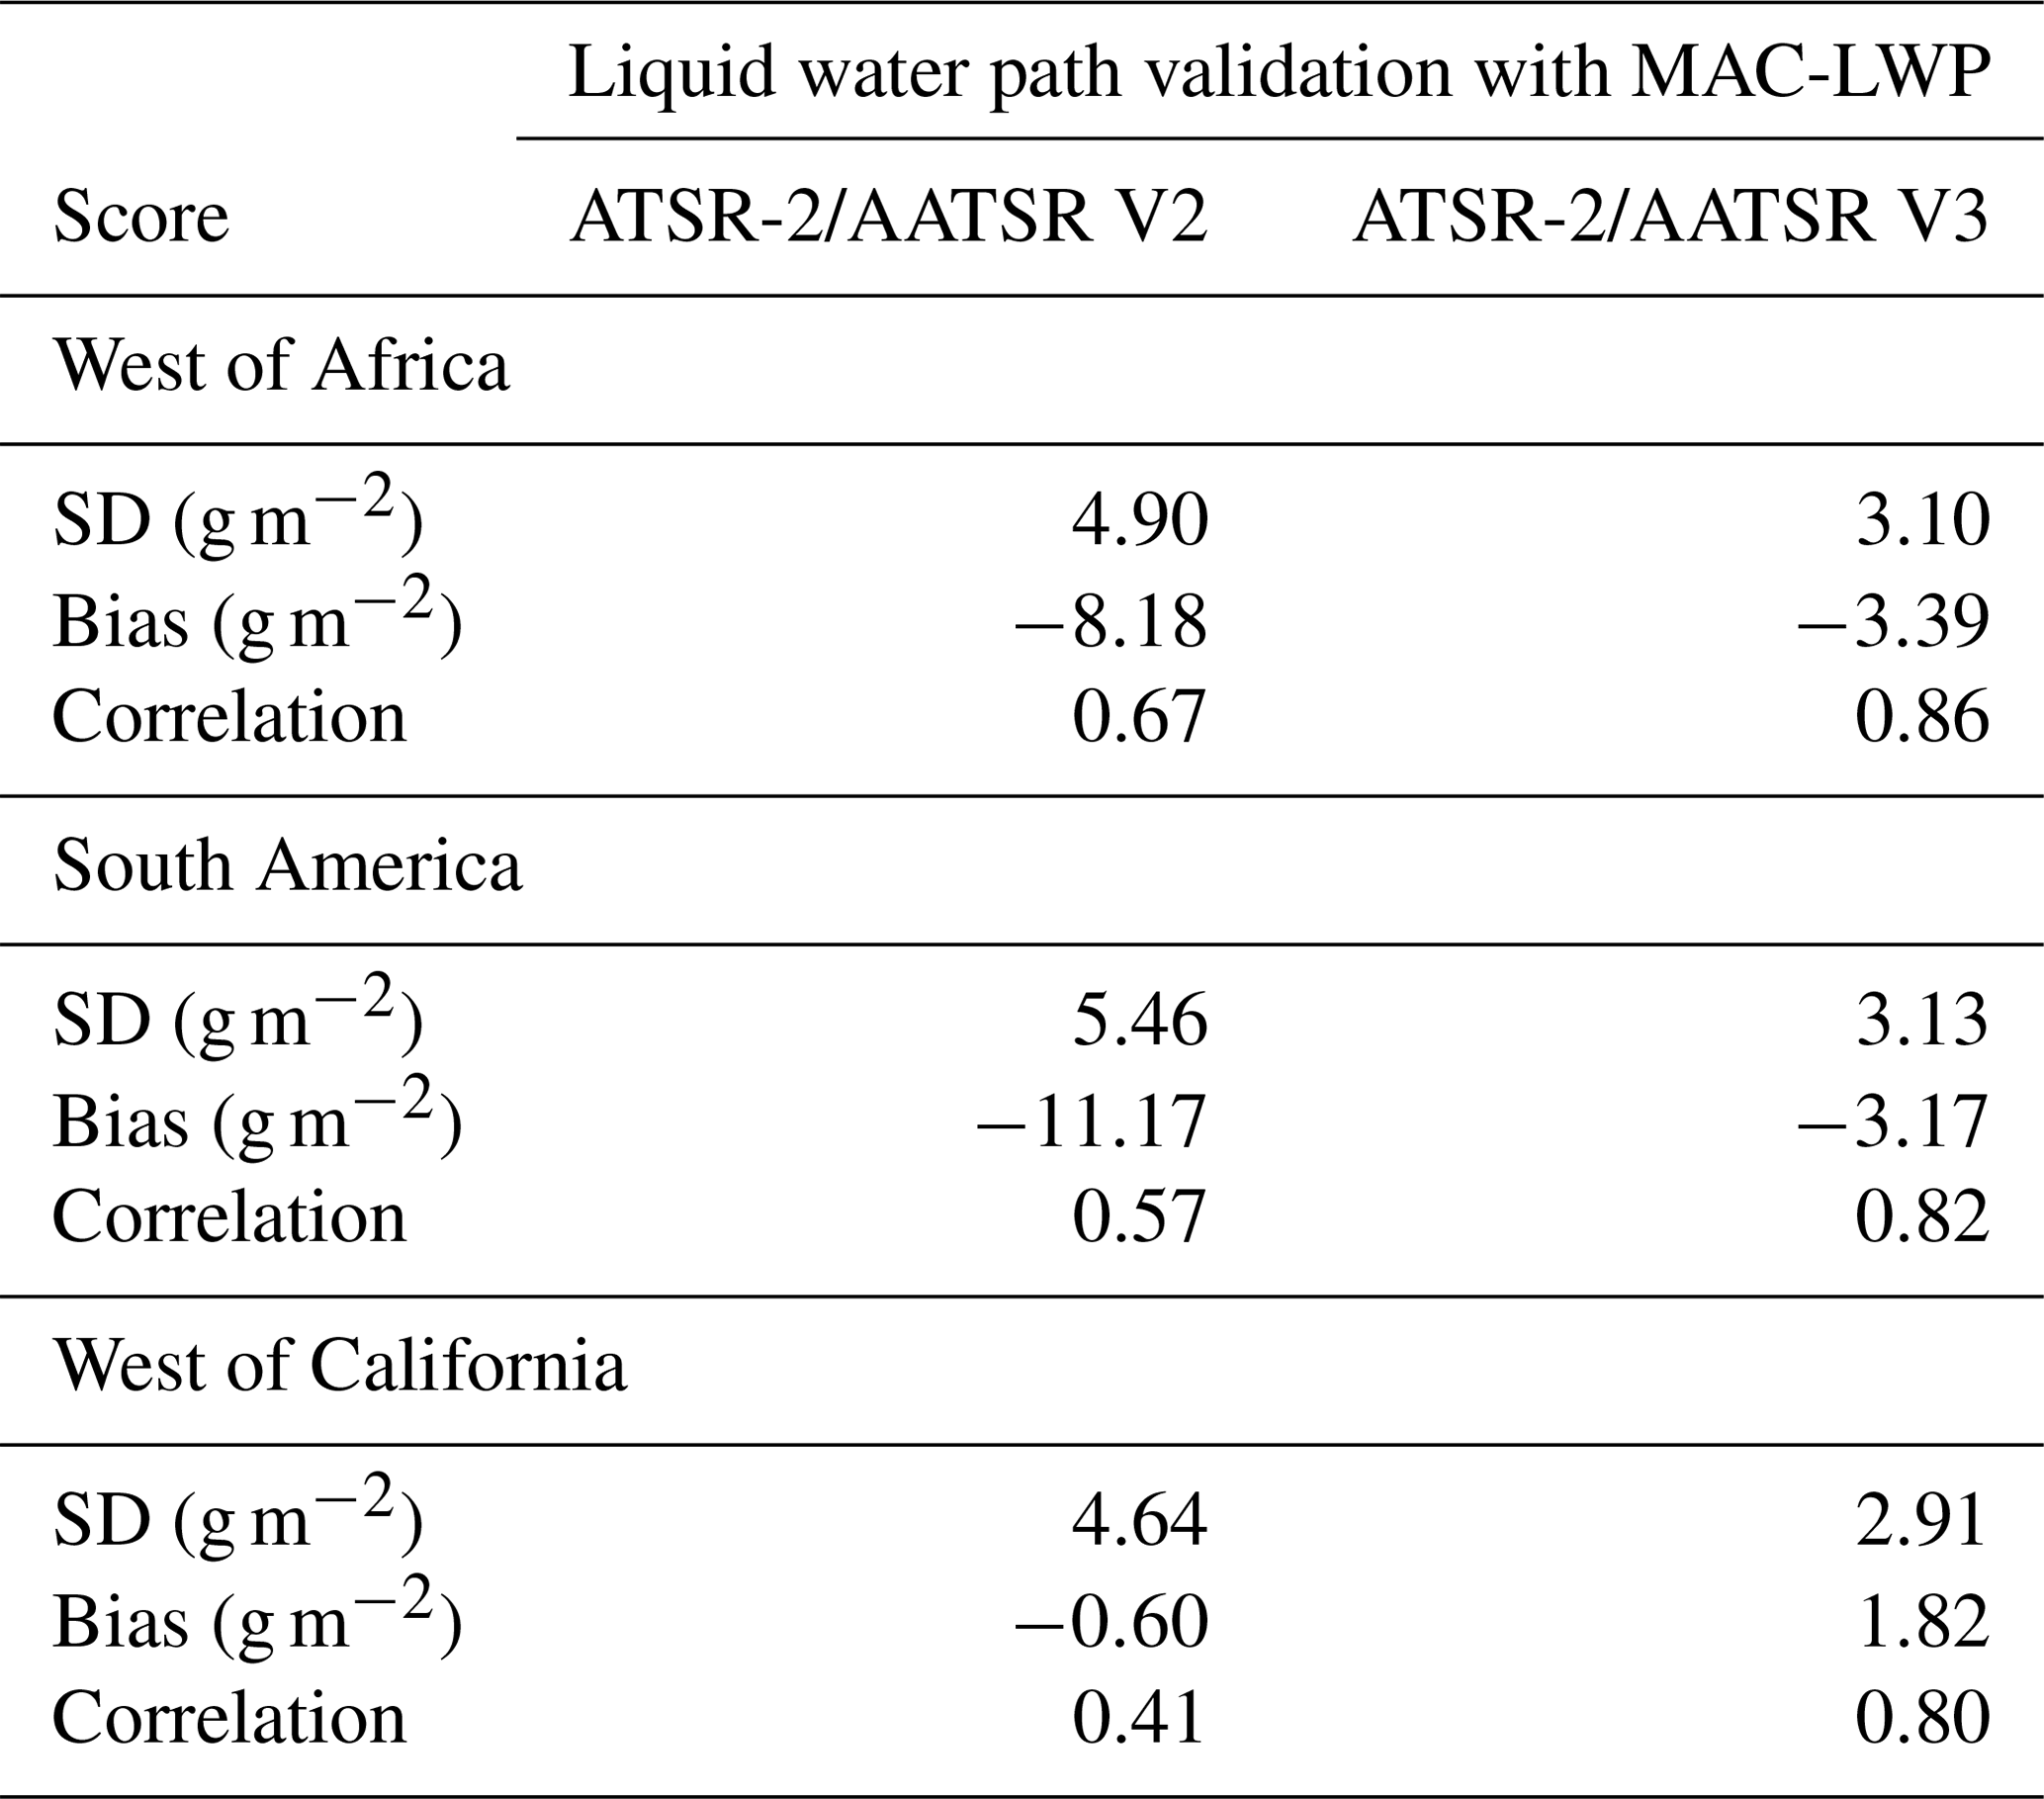

Figure 4 Examples of Level-3C (yearly average for 2008) Cloud_cci AATSR V3 (left column), CERES (middle column) and the difference between CERES and AATSR (right column): global maps of fluxes, from top to bottom, , clear, and clear.
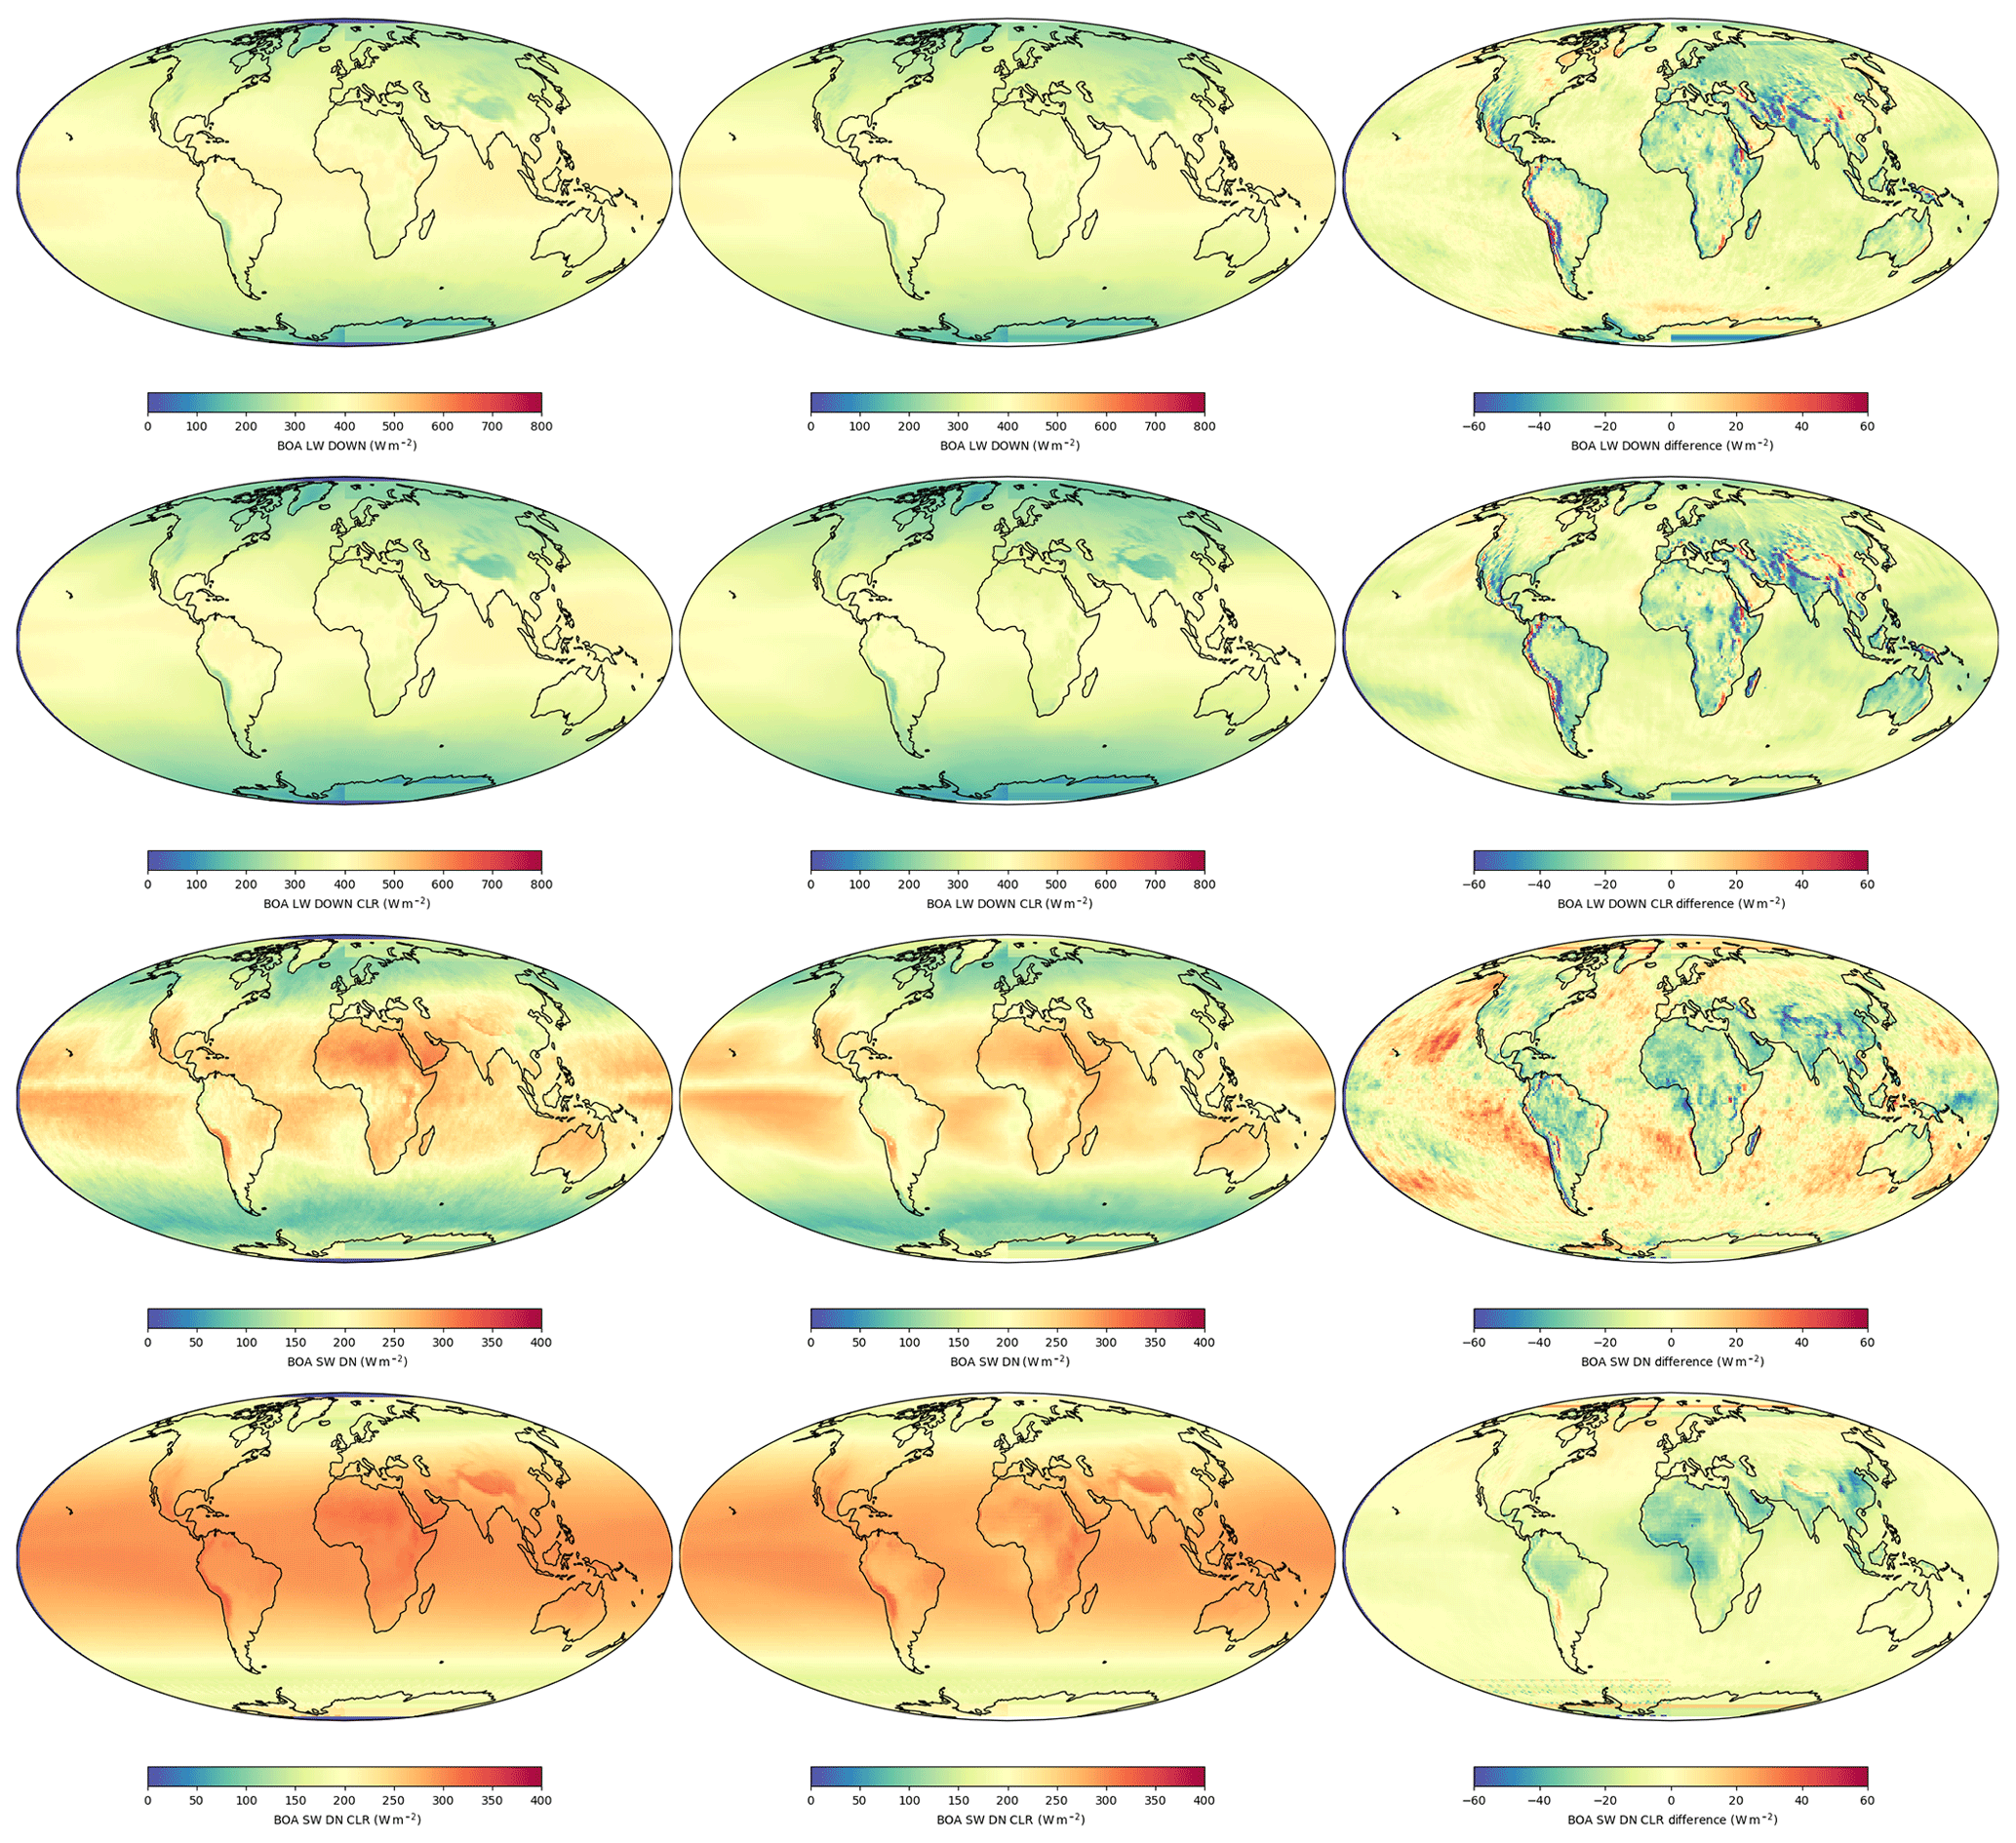
Figure 5 Examples of Level-3C (yearly average for 2008) Cloud_cci AATSR V3 (left column) and CERES (middle column) and the difference between CERES and AATSR (right column): global maps of forcing, from top to bottom, , clear, and clear.
4.4 Comparison of radiative fluxes
Examples of the Cloud_cci AATSR flux products are shown in Fig. 4. In the left column the multi-month mean for 2008 from AATSR is shown. The AATSR products are compared with the Clouds and Earth Radiation Energy System (CERES) Energy Balanced and Filled (EBAF) Top-of-Atmosphere (TOA) and Bottom-of-Atmosphere (BOA) fluxes edition 4.1 (Loeb et al., 2018) shown in the middle column, and the right column shows the difference between the two. The two data sets show very similar global patterns. The highest TOA longwave cloudy fluxes are observed over warm land, typically desert regions and ocean regions with low cloud coverage. The highest TOA longwave upwelling clear-sky fluxes are found in the tropics and mid-latitudes. The highest TOA cloudy shortwave fluxes are located over the bright polar regions, deserts and regions of bright cloud, such as the storm tracks and stratocumulus cloud decks. The TOA clear-sky shortwave fluxes are low over the oceans and higher over bright land surfaces. The global mean comparison of TOA fluxes is summarised in Table 6. The means were compared for both ±60∘ latitude and the whole globe when both CERES and AATSR are present. For the TOA fluxes, the LW fluxes show the largest negative bias over land and largest positive biases over sea, particularly in clear conditions. The CERES team have evaluated the accuracy of the TOA products in Loeb et al. (2018) and state that their all-sky shortwave and longwave monthly uncertainty (which is comprised of both random and systematic error sources and is specified for the global region) is 2.5(3) W m−2 for Aqua and Terra (Terra only) period, while the clear-sky shortwave and longwave uncertainty is 5(6) and 4.5(5) W m−2, respectively, for the Aqua and Terra (Terra only) monthly products. The period compared here covers the AQUA period. The agreement between AATSR TOA-derived fluxes and CERES is within this uncertainty. Averaged globally, the AATSR all-sky longwave fluxes are slightly lower (colder) over the sea (particularly in the tropics; see the red areas in the difference map) and slightly higher (warmer) over land. Comparing the all-sky and clear-sky differences suggests that the longwave radiative fluxes associated with clouds (particularly regions with high-altitude ice clouds) are higher in AATSR than in CERES. TOA all-sky shortwave flux shows a similar pattern to the TOA all-sky longwave bias, although it is reversed in sign. Both shortwave and longwave clear-sky TOA fluxes are systematically lower than CERES, indicating a potential underestimation of the surface reflectance and surface temperature in the AATSR product. The AATSR sea surface reflectance model uses a Cox and Munk (1954) formulation. For the longwave channels, a key source of differences could be the sensitivity to the diurnal correction applied to the AATSR data in order to make a like-for-like comparison with CERES. These differences will be investigated for improvement in future versions.
Table 6 Multi-annual (2003–2012) zonally averaged broadband shortwave and longwave fluxes (SWF, LWF) at the top-of-atmosphere (TOA) inferred from the Cloud_cci AATSR V3 data set. Two latitude ranges, −60 to 60∘ (top) and −90 to 90∘ (bottom), are presented. The values are compared with the equivalent values from the Clouds and Earth Radiation Energy System (CERES) Energy Balanced and Filled (EBAF) fluxes (all values are given in W m−2). The differences and relative differences are also reported.
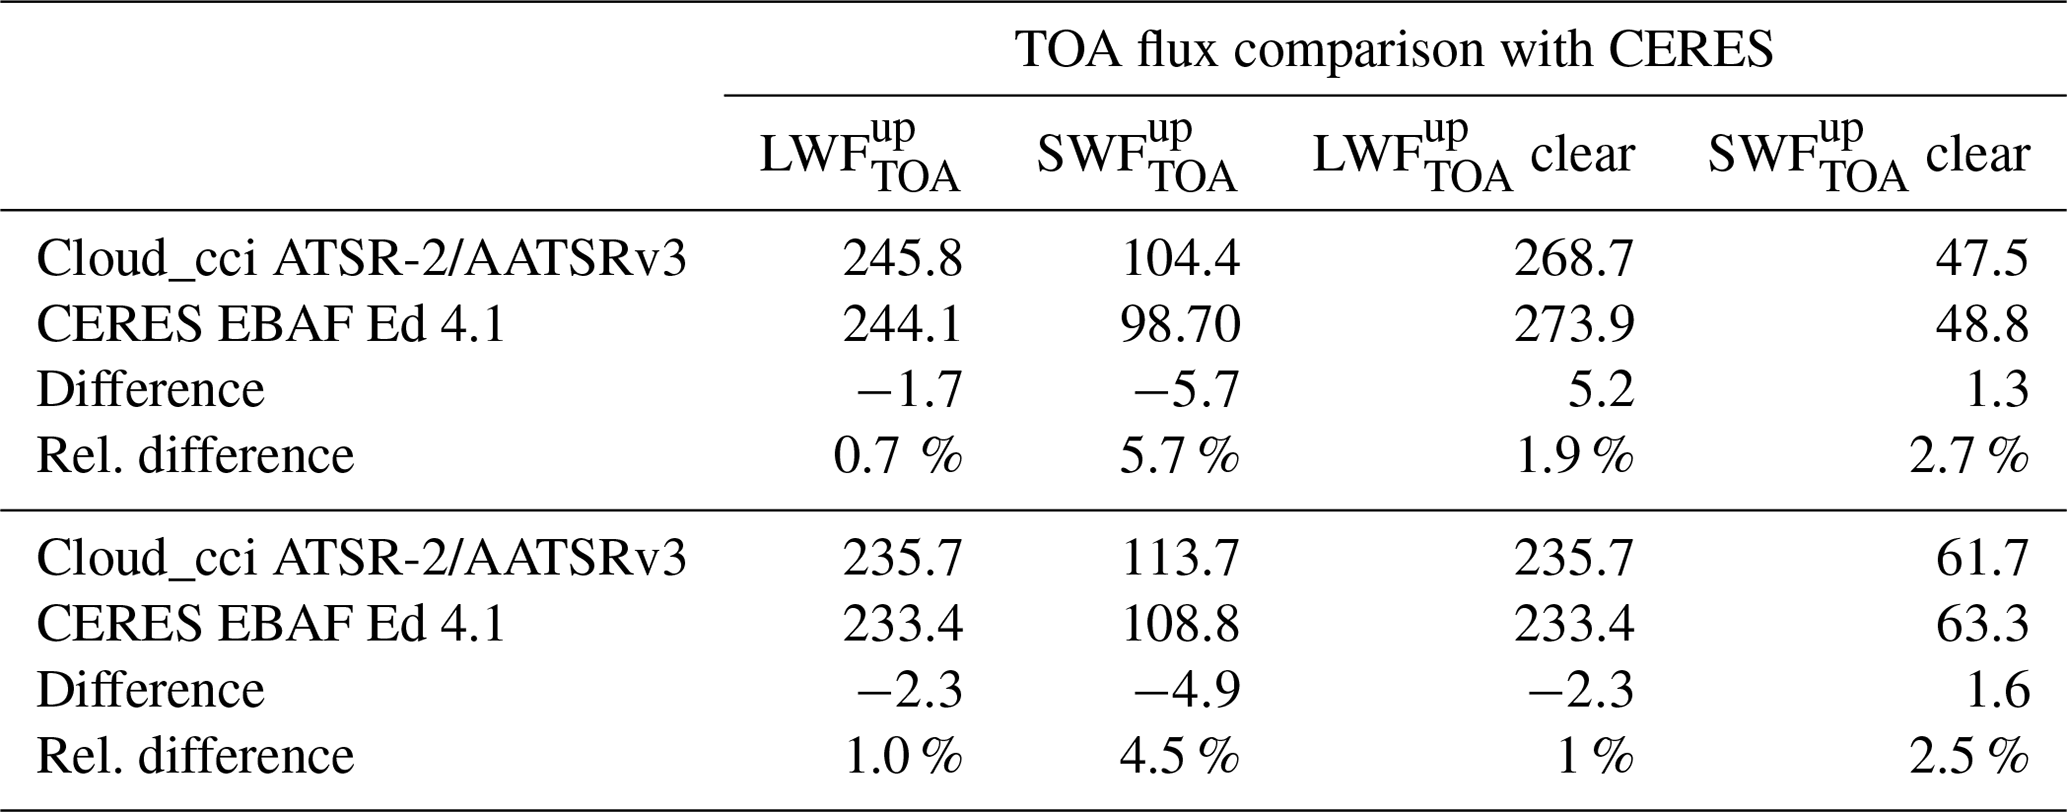
Table 7As in Table 6 but for the bottom-of-atmosphere values (BOA).

The BOA longwave downwelling fluxes (all-sky and clear) have a minimum in the cold polar regions and a maximum in the tropics. The corresponding shortwave fluxes are lowest in the southern and northern storm tracks and peak in the tropics. The BOA all-sky shortwave downwelling flux shows the largest regional differences. The BOA shortwave downwelling clear-sky fluxes show AATSR to be higher in regions of high aerosol loading. The downward longwave fluxes are also higher for AATSR. The BOA LW fluxes show the largest disagreement with CERES. The global mean BOA comparisons are summarised in Table 7. The means were compared for ±60∘ latitude and the whole globe. The CERES data quality statement indicates NASA (2020) uncertainties of 9 and 8 W m−2 for longwave BOA downwelling all-sky and clear sky, respectively, and 14 and 6 W m−2 for the shortwave BOA downwelling all-sky and clear sky, respectively. This is consistent with the AATSR shortwave values. The BOA clear and all-sky longwave differences with CERES are very slightly outside this range. We hypothesise that this difference that the AATSR cloud base height is systematically biased. While the AATSR fluxes also use satellite aerosol measurements in the clear-sky calculations, the impact on the shortwave flux is less pronounced than in the CERES product, which used MODIS aerosol products. This difference and difference between longwave downwelling fluxes will be investigated for future improvements to the retrieval.
A DOI has been issued for the data set Cloud_cci AATSR and ATSR-2v3 described in this paper: https://doi.org/10.5676/DWD/ESA_Cloud_cci/ATSR2-AATSR/V003 Poulsen et al. (2019). The CC4CL retrieval system code repository used to produce the data version is accessible at https://github.com/ORAC-CC/orac/wiki (last access: 19 August 2020).
The AATSR-2/AATSR cloud data sets provide a unique data set that straddles the AVHRR and MODIS timelines and maintains a stable orbit between satellite platforms. Version 3 of the Cloud_cci ATSR-2/AATSR cloud and radiation property data set, as presented in this paper, includes a number of algorithm improvements and bug fixes that positively impact the accuracy of the cloud properties and improve the consistency between the ATSR-2 and AATSR instruments. The radiation properties are new for version 3. The simultaneous provision of cloud, aerosol and radiative fluxes facilitates understanding the changes in radiative flux associated with cloud properties at high resolution (1 km).
Cloud fraction and cloud top height have been validated using CALIPSO measurements. While the lidar only finds good co-locations in the polar regions, the comparison demonstrates some of the key changes between V2 and V3. The cloud fraction shows considerable improvement in its ability to discern clear scenes, with the Kuiper skill score improving from 0.49 to 0.66. There were no major developments from V2 to V3 that would significantly affect the cloud top height retrievals, so the cloud top height validation has remained similar.
The MAC-LWP product has been compared with the ATSR-2 and AATSR product in regions of stratocumulus cloud. The V3 data set shows significantly improved consistency between ATSR-2 and AATSR resulting from changes in the channel selection. The ATSR-2/AATSR liquid water path is shown to be highly correlated with the MAC-LWP in these regions (coefficients > 0.8). The bias and standard deviation have reduced by around 5 %–10 % in all regions.
The TOA and BOA flux products have been compared with the latest CERES EBAF version 4.1 products and show good agreement, within the estimated uncertainties. The differences are largest and the most uncertain over polar regions.
CP coordinated the generation of the presented data set, which was undertaken by GT and EC; contributed to key developments of the algorithm; evaluated the data; and drafted the manuscript. MS developed the cloud detection and phase determination. GM contributed key developments to the algorithm; AP, SP, RG, and GT contributed to the development of the optimal estimation scheme. MC developed the radiation scheme. All authors assisted in drafting the manuscript.
The authors declare that they have no conflict of interest.
This work was undertaken in the Cloud_cci project as part of the European Space Agency (ESA) CCI programme. The data was generated and archived at the Centre for Environmental Data Analysis (CEDA), which is supported by the Natural Environment Research Council (NERC). The MAC-LWP and CERES data were obtained from the NASA Langley Research Center Atmospheric Science Data Center.
This research has been supported by the ESA CCI (contract no. 4000109870/13/INB) and the NERC National centre for Earth Observation (contract no. PR140015).
This paper was edited by Alexander Kokhanovsky and reviewed by three anonymous referees.
Baum, B. A., Yang, P., Heymsfield, A. J., Bansemer, A., Merrelli, A., Schmitt, C., and Wang C.: Ice cloud bulk single-scattering property models with the full phase matrix at wavelengths from 0.2 to 100 µm, J. Quant. Spectrosc. Ra., 146, 123–139, https://doi.org/10.1016/j.jqsrt.2014.02.029, 2014. a
Baum, B., Menzel, W. P., Frey, R., Tobin, D., Holz, R., and Ackerman, S.: MODIS Cloud Top Property Refinements for Collection 6, J. Appl. Meteorol. Climatol., 51, 1145–1163, https://doi.org/10.1175/JAMC-D-11-0203.1, 2012. a
Baran A. J., Shcherbakov, V. N., Baker, B. A., Gayet J. F., and Lawson, R. P.: On the scattering phase function of non-symmetric ice crystals, Q. J. R. Meteor Soc., 131, 260916, https://doi.org/10.1256/qj.04.137, 2005. a
Brodzik, M. J. and Stewart J. S.: Near-Real-Time SSM/I-SSMIS EASE-Grid Daily Global Ice Concentration and Snow Extent, Version 5, Boulder, Colorado USA, NASA National Snow and Ice Data Center Distributed Active Archive Center, https://doi.org/10.5067/3KB2JPLFPK3R, 2016. a
Christensen, M. W., Neubauer, D., Poulsen, C. A., Thomas, G. E., McGarragh, G. R., Povey, A. C., Proud, S. R., and Grainger, R. G.: Unveiling aerosol–cloud interactions – Part 1: Cloud contamination in satellite products enhances the aerosol indirect forcing estimate, Atmos. Chem. Phys., 17, 13151–13164, https://doi.org/10.5194/acp-17-13151-2017, 2017. a
Coppo, P., Ricciarelli, B., Brandani, F., Delderfield, J., Ferlet, M., Mutlow, C., Munro, G., Nightingale, T., Smith, D., Bianchi, S., Nicol, P., Kirschstein, S., Hennig, T., Engel, W., Frerick, J., and Nieke, J.: SLSTR: a high accuracy dual scan temperature radiometer for sea and land surface monitoring from space, J. Modern Opt., 57, 1815–1830, https://doi.org/10.1080/09500340.2010.503010, 2010. a
Cox, C. and Munk, W.: Measurement of the Roughness of the Sea Surface from Photographs of the Sun’s Glitter, J. Opt. Soc. Am. 44, 838–850, 1954. a
Davies, R., Jovanovic, V. M., and Moroney, C. M.: Cloud heights measured by MISR from 2000 to 2015, J. Geophys. Res.-Atmos., 122, 3975–3986, https://doi.org/10.1002/2017JD026456, 2017. a
Domingo, V., Fleck, B., and Poland, A. I.: The SOHO Mission: an Overview, Sol. Phys., 162, 1–37, https://doi.org/10.1007/BF00733425, 1995. a
Elsaesser, G. S., O’Dell, C. W. Lebsock, M. D., Bennartz, R., Greenwald, T. J., and Wentz, F. J.: The Multisensor Advanced Climatology of Liquid Water Path (MAC-LWP), J. Climate, 30, 10193–10210, https://doi.org/10.1175/JCLI-D-16-0902.1, 2017. a
Fu, Q. and Liou, K.-N.: On the correlated k-distribution method for radiative transfer in nonhomogeneous atmospheres, J. Atmos. Sci., 49, 2139–2156, https://doi.org/10.1175/1520-0469(1992)049<2139:OTCDMF>2.0.CO;2, 1992. a
Heidinger, A. K. and Pavolonis, M. J.: Gazing at Cirrus Clouds for 25 Years through a Split Window. Part I: Methodology, J. Appl. Meteor. Climatol., 48, 1100–1116, https://doi.org/10.1175/2008JAMC1882.1, 2009. a
Heidinger, A. K., Foster, M. J., Walther, A., and Zhao, X.: The Pathfinder Atmospheres–Extended AVHRR Climate Dataset, B. Am. Meteorol. Soc., 95, 909–922, https://doi.org/10.1175/BAMS-D-12-00246.1, 2014. a
Hollmann, R., Merchant, C. J., Saunders, R., Downy, C., Buchwitz, M., Cazenave, A., Chuvieco, E., Defourny, P., de Leeuw, G., Forsberg, R., Holzer-Popp, T., Paul, F., Sandven, S., Sathyendranath, S., van Roozendael, M., and Wagner, W.: The ESA Climate Change Initiative: Satellite Data Records for Essential Climate Variables, B. Am. Meteorol. Soc., 94, 1541–1552, https://doi.org/10.1175/BAMS-D-11-00254.1, 2013. a
Stocker, T. F., Qin, D., Plattner, G.-K., Tignor, M., Allen, S. K., Boschung, J., Nauels, A., Xia, Y., Bex, V., and Midgley, P. M. (Eds.): Climate Change 2013: The Physical Science Basis, Contribution of Working Group I to the Fifth Assessment Report of the Intergovernmental Panel on Climate Change, Cambridge University Press, Cambridge, UK, New York, NY, USA, 1535 pp., https://doi.org/10.1017/CBO9781107415324, 2013. a
Karlsson, K.-G., Anttila, K., Trentmann, J., Stengel, M., Fokke Meirink, J., Devasthale, A., Hanschmann, T., Kothe, S., Jääskeläinen, E., Sedlar, J., Benas, N., van Zadelhoff, G.-J., Schlundt, C., Stein, D., Finkensieper, S., Håkansson, N., and Hollmann, R.: CLARA-A2: the second edition of the CM SAF cloud and radiation data record from 34 years of global AVHRR data, Atmos. Chem. Phys., 17, 5809–5828, https://doi.org/10.5194/acp-17-5809-2017, 2017. a
Karlsson, K.-G. and Devasthale, A.: Inter-Comparison and Evaluation of the Four Longest Satellite-Derived Cloud Climate Data Records: CLARA-A2, ESA Cloud CCI V3, ISCCP-HGM, and PATMOS-x, Rem. Sens., 10, 2072–4292, https://doi.org/10.3390/rs10101567, 2018. a
Hanssen A. W. and Kuipers, W. J. A.: On the relationship between frequency of rain and various meteorological parameters, Mededelingen en verhandelingen, 81, 2–15, 1965. a
Loeb, N. G., Doelling, D. R., Wang, H., Su, W., Nguyen, C., Corbett, J. G., Liang, L., Mitrescu, C., Rose, F. G., and Kato, S.: Clouds and the Earth’s Radiant Energy System (CERES) Energy Balanced and Filled (EBAF) Top-of-Atmosphere (TOA) Edition 4.0 Data Product, J. Climate, 31, 895–918, https://doi.org/10.1175/JCLI-D-17-0208.1, 2018. a, b
Marchand, R.: Trends in ISCCP, MISR, and MODIS cloud‐top‐height and optical‐depth histograms, J. Geophys. Res.-Atmos., 118, 1941–1949, https://doi.org/10.1002/jgrd.50207, 2013. a
McGarragh, G. R., Poulsen, C. A., Thomas, G. E., Povey, A. C., Sus, O., Stapelberg, S., Schlundt, C., Proud, S., Christensen, M. W., Stengel, M., Hollmann, R., and Grainger, R. G.: The Community Cloud retrieval for CLimate (CC4CL) – Part 2: The optimal estimation approach, Atmos. Meas. Tech., 11, 3397–3431, https://doi.org/10.5194/amt-11-3397-2018, 2018. a
NASA: Atmospheric Science Data Centre, CALIOP Quality statement, available at: https://asdc.larc.nasa.gov/documents/calipso/quality_summaries/CALIOP_L2LayerProducts_3.01.pdf, last access: 26 August 2020. a, b
NASA: CERES data quality statement, available at: https://ceres.larc.nasa.gov/documents/DQ_summaries/CERES_EBAF_Ed4.1_DQS.pdf, last access: 30 May 2020. a
Neubauer, D., Christensen, M. W., Poulsen, C. A., and Lohmann, U.: Unveiling aerosol–cloud interactions – Part 2: Minimising the effects of aerosol swelling and wet scavenging in ECHAM6-HAM2 for comparison to satellite data, Atmos. Chem. Phys., 17, 13165–13185, https://doi.org/10.5194/acp-17-13165-2017, 2017. a
Platnick, S., Meyer, K. G., King, M. D., Wind, G., Amarasinghe, N., Marchant, B., Arnold, G. T., Zhang, Z. B., Hubanks, P. A., Holz, R. E., Yang, P., Ridgway, W. L., and Riedi, J.: The MODIS Cloud Optical and Microphysical Products: Collection 6 Updates and Examples From Terra and Aqua, IEEE Trans. Geosci., 55, 502–525, https://doi.org/10.1109/TGRS.2016.2610522, 2017. a
Poulsen, C. A., Siddans, R., Thomas, G. E., Sayer, A. M., Grainger, R. G., Campmany, E., Dean, S. M., Arnold, C., and Watts, P. D.: Cloud retrievals from satellite data using optimal estimation: evaluation and application to ATSR, Atmos. Meas. Tech., 5, 1889–1910, https://doi.org/10.5194/amt-5-1889-2012, 2012. a, b
Poulsen, C., McGarragh, G., Thomas, G., Stengel, M., Christensen, M., Povey, A., Proud, S., Carboni, E., Hollmann, R., Grainger, D.: ESA Cloud Climate Change Initiative (ESA Cloud_cci) data: Cloud_cci ATSR2-AATSR L3C/L3U CLD_PRODUCTS v3.0, Deutscher Wetterdienst (DWD) and Rutherford Appleton Laboratory (Dataset Producer), https://doi.org/10.5676/DWD/ESA_Cloud_cci/ATSR2-AATSR/V003, 2019. a, b
Stengel, M., Stapelberg, S., Schlundt, C., Karlsson, K.-G., Meirink, J.F., Poulsen, C., Bojanowski, J., and Stöckli, R.: Cloud_cci Product validation and Intercomparison Report, available at: http://www.esa-cloud-cci.org/sites/default/files/documents/public/Cloud_cci_D4.1_PVIR_v5.1.pdf (last access: 30 August 2019), 2018. a
Rodgers, C. D.: Inverse methods for atmospheric sounding: Theory and Practice, Series on Atmospheric, Oceanic and Planetary Physics, Vol. 2, World Scientific, 2000. a
Schaaf, C. B., Gao, F., Strahler, A. H., Lucht, W., Li, X. W., Tsang, T., Strugnell, N. C., Zhang, X. Y., Jin, Y. F., Muller, J. P., Lewis, P., Barnsley, M., Hobson, P., Disney, M., Roberts, G., Dunderdale, M., Doll, C., d'Entremont, R. P., Hu, B. X., Liang, S. L., Privette, J. L., and Roy, D.: First operational BRDF, albedo nadir reflectance products from MODIS, Rem. Sens. Environ., 83, 135–148, https://doi.org/10.1016/S0034-4257(02)00091-3, 2002. a
Smith, D. L. and Cox, C.V.: (A)ATSR Solar Channel On-Orbit Radiometric Calibration, IEEE T. Geosci. Remote, 51, 1370–1382, https://doi.org/10.1109/TGRS.2012.2230333, 2013. a
Smith, D. L., Delderfield, J., Drummond, D., Edwards, T., Mutlow, C. T., Read, P. D., and Toplis, G. M.: Calibration of the AATSR instrument, Adv. Space Res., 28, 31–39, https://doi.org/10.1016/S0273-1177(01)00273-3, 2001. a
Stephens, G. L.: Radiation Profiles in Extended Water Clouds. I: Theory, J. Atmos. Sci., 35, 2111–2122, https://doi.org/10.1175/1520-0469(1978)035, 1978. a
Stephens, G. L., Gabriel, P. M., and Partain, P. T.: Parameterization of atmospheric radiative transfer. Part I: Validity of simple models, J. Atmos. Sci., 58, 3391–3409, https://doi.org/10.1175/1520-0469(2001)058<3391:POARTP>2.0.CO;2, 2001. a
Stephens, G. L., Vane, D. G., Tanelli, S., Im, E., Durden, S., Rokey, M., Reinke, D., Partain, P., Mace, G. G., Austin, R., L'Ecuyer, T., Haynes, J., Lebsock, M., Suzuki, K., Waliser, D., Wu, D., Kay, J., Gettelman, A., Wang, Z., and Marchand, R.: CloudSat mission: Performance and early science after the first year of operation, J. Geophys. Res., 113, D00A18, https://doi.org/10.1029/2008JD009982, 2008. a
Stengel, M., Stapelberg, S., Sus, O., Finkensieper, S., Würzler, B., Philipp, D., Hollmann, R., Poulsen, C., Christensen, M., and McGarragh, G.: Cloud_cci Advanced Very High Resolution Radiometer post meridiem (AVHRR-PM) dataset version 3: 35-year climatology of global cloud and radiation properties, Earth Syst. Sci. Data, 12, 41–60, https://doi.org/10.5194/essd-12-41-2020, 2020. a, b, c, d
Stengel, M., Stapelberg, S., Sus, O., Schlundt, C., Poulsen, C., Thomas, G., Christensen, M., Carbajal Henken, C., Preusker, R., Fischer, J., Devasthale, A., Willén, U., Karlsson, K.-G., McGarragh, G. R., Proud, S., Povey, A. C., Grainger, R. G., Meirink, J. F., Feofilov, A., Bennartz, R., Bojanowski, J. S., and Hollmann, R.: Cloud property datasets retrieved from AVHRR, MODIS, AATSR and MERIS in the framework of the Cloud_cci project, Earth Syst. Sci. Data, 9, 881–904, https://doi.org/10.5194/essd-9-881-2017, 2017. a, b
Sus, O., Stengel, M., Stapelberg, S., McGarragh, G., Poulsen, C., Povey, A. C., Schlundt, C., Thomas, G., Christensen, M., Proud, S., Jerg, M., Grainger, R., and Hollmann, R.: The Community Cloud retrieval for CLimate (CC4CL) – Part 1: A framework applied to multiple satellite imaging sensors, Atmos. Meas. Tech., 11, 3373–3396, https://doi.org/10.5194/amt-11-3373-2018, 2018. a, b, c, d
Thomas, G. E., Carboni, E., Sayer, A. M., Poulsen, C. A., Siddans, R., and Grainger, R. G.: Oxford-RAL Aerosol and Cloud (ORAC): aerosol retrievals from satellite radiometers, in: Satellite aerosol remote sensing over land Kokhanovsky, A. A. and de Leeuw, G. (eds.), Springer-Praxis, 2009. a
Winker, D. M., Vaughan, M. A., Omar, A., Hu, Y., Powell, K. A., Liu, Z., Hunt, W. H., and Young, S. A.: Overview of the CALIPSO Mission and CALIOP Data Processing Algorithms, J. Atmos. Ocean. Tech., 26, 2310–2323, https://doi.org/10.1175/2009JTECHA1281.1, 2009. a
Young, A. H., Knapp, K. R., Inamdar, A., Hankins, W., and Rossow, W. B.: The International Satellite Cloud Climatology Project H-Series climate data record product, Earth Syst. Sci. Data, 10, 583–593, https://doi.org/10.5194/essd-10-583-2018, 2018. a
Zelinka, M. D., Grise, K. M., Klein, S. A., Zhou, C., DeAngelis, A. M., and Christensen, M. W.: Drivers of the Low Cloud Response to Poleward Jet Shifts in the North Pacific in Observations and Models, J. Climate, 31, 7925–7947, https://doi.org/10.1175/JCLI-D-18-0114.1, 2018. a