the Creative Commons Attribution 4.0 License.
the Creative Commons Attribution 4.0 License.
 | 19 Mar 2024
Modelled forest ecosystem carbon–nitrogen dynamics with integrated mycorrhizal processes under elevated CO2
Melanie A. Thurner
Silvia Caldararu
Jan Engel
Anja Rammig
Sönke Zaehle
Almost 95 % of all terrestrial plant species form symbioses with mycorrhizal fungi that mediate plant–soil interactions: mycorrhizae facilitate plant nitrogen (N) acquisition and are, therefore, vital for plant growth, but they also build a pathway for plant-assimilated carbon (C) into the rhizosphere. Therefore, mycorrhizae likely play an important role in shaping the response of ecosystems to environmental changes such as rising atmospheric carbon dioxide (CO2) concentrations, which can increase plant N demand and the transfer of plant C assimilation to the soil. While the importance of mycorrhizal fungi is widely recognised, they are rarely represented in current terrestrial biosphere models (TBMs) explicitly. Here, we present a novel, dynamic plant–mycorrhiza–soil model as part of the QUINCY (QUantifying Interactions between terrestrial Nutrient CYcles and the climate system) TBM. This new model is based on mycorrhizal functional types that either actively mine soil organic matter (SOM) for N or enhance soil microbial activity through increased transfer of labile C into the rhizosphere, thereby (passively) priming SOM decomposition. Using the Duke Free-Air CO2 Enrichment (FACE) experiment, we show that mycorrhizal fungi can have important effects on projected SOM turnover and plant nutrition under ambient as well as elevated-CO2 treatments. Specifically, we find that including enhanced active mining of SOM for N in the model allows one to more closely match the observations with respect to observed decadal responses of plant growth, plant N acquisition and soil C dynamics to elevated CO2, whereas a simple enhancement of SOM turnover by increased below-ground C transfer of mycorrhizae is unable to replicate the observed responses. We provide an extensive parameter uncertainty study to investigate the robustness of our findings with respect to model parameters that cannot readily be constrained by observations. Our study points to the importance of implementing mycorrhizal functionalities in TBMs as well as to further observational needs to better constrain mycorrhizal models and to close the existing major knowledge gaps in actual mycorrhizal functioning.
- Article
(3560 KB) - Full-text XML
- BibTeX
- EndNote


The land biosphere sequesters about a quarter of the annual anthropogenic CO2 emissions, thereby slowing human-induced climate change (Le Quéré et al., 2018). However, it is unclear if this buffering effect will continue into the future (Ciais et al., 2014). Multiple lines of evidence (Norby et al., 2005; Jiang et al., 2020; Walker et al., 2021) and the majority of nitrogen-enabled terrestrial biosphere models (TBMs; Zaehle et al., 2014; Wieder et al., 2015; Fleischer et al., 2019) suggest that CO2-fertilised plant growth, which is one of the major causes of this uptake, will be reduced by increasing nutrient limitation. Whole-ecosystem experiments, in which plants are exposed to elevated levels of atmospheric CO2 (eCO2), show a range of responses from ongoing CO2-fertilised growth (McCarthy et al., 2007) to progressive nutrient limitation (Norby et al., 2010). One possible explanation for these divergent responses is the differential ability of plants to accesses soil nutrients through mycorrhizal fungi (Terrer et al., 2016).
Mycorrhizal fungi are ubiquitous and form symbioses with almost 95 % of all terrestrial plant species (Read, 1991). It is commonly assumed that this mutualistic relationship between plants and fungi is an evolutionary adaptation to nutrient-poor conditions (Read, 1991), whereby host plants benefit from mycorrhizal nutrient supply (Ames et al., 1983; Marschner and Dell, 1994; Ek et al., 1997). In return, plants export carbohydrates to their symbiotic fungi, covering most of the fungal carbon (C) demand (Gorka et al., 2019). Plant–mycorrhiza symbioses are important for soil C sequestration and, thus, soil organic matter (SOM) content, either via the allocation of C into below-ground tissues such as roots or mycorrhizal biomass or by rhizodeposition, i.e. C exudation into the rhizosphere of the soil (Godbold et al., 2006; Frey, 2019; Gorka et al., 2019).
Mycorrhizae are generally classified based on their morphology into arbuscular mycorrhizae, ectomycorrhizae, ericoid mycorrhizae and orchid mycorrhizae, but the first two are the most common forms (Read, 1991; Johnson and Jansa, 2017). Arbuscular mycorrhizae (AMs) directly enter plant root cells and build symbiotic associations with more than 80 % of all terrestrial plant families, especially with crop and grass species, but also with most tropical trees, which is why they are often assumed to be more important for plant phosphorus (P) nutrition (Read, 1991; Hodge et al., 2001). Ectomycorrhizae (ECMs) are hosted by only 10 % of plant species, including most temperate and boreal tree species and, contrary to previous findings, some tropical tree species (Corrales et al., 2018). This results in ECM interactions covering a large fraction (26.5 %) of mycorrhizal relationships in terrestrial plant biomass (Soudzilovskaia et al., 2019). ECMs are usually regarded as nitrogen (N) nutrition supporters and only cover plant roots, working as a storage and exchange area for carbohydrates and nutrients as well as protection against infections and a physical barrier between the roots and soil nutrients (Read, 1991; Jordy et al., 1998; Laczko et al., 2004; Pritsch et al., 2004; Finlay, 2008).
Given the vast diversity of mycorrhiza species, even after decades of research, there is still no complete understanding on how plant–mycorrhiza symbioses affect ecosystem nutrition or the stabilisation and turnover of SOM (Jansa and Treseder, 2017; Tedersoo and Bahram, 2019). Some species accelerate SOM decay by C exudation to soil, which activates the microbial community and, thus, enhances SOM decomposition rates (Hodge et al., 2001; Cheng et al., 2012; Lindahl and Tunlid, 2015; Paterson et al., 2016; Lang et al., 2021). Other mycorrhizal species have the ability to take up nutrients directly from SOM in addition to mineral nutrients (Wu et al., 2005; Pérez-Tienda et al., 2012; Hodge and Storer, 2015) or even act saprotrophically, i.e. they are able to gain C from SOM (Treseder et al., 2007; Malcolm et al., 2008; Nehls, 2008), whereas other species are shown to lack the genetic capacity to act as saprotrophs (Lindahl and Tunlid, 2015; Frey, 2019).
Because of the knowledge gaps regarding the actual role of mycorrhizal fungi functioning in ecosystems, they are rarely represented in state-of-the-art TBMs that are used to simulate the global carbon and nutrient cycle responses to global change (Le Quéré et al., 2018). Most TBMs predict a higher N limitation effect on CO2-fertilised growth than observed, potentially due to a significant underestimation of plant N acquisition enhancement under eCO2 (Zaehle et al., 2014). One possible reason for this is that most TBMs represent N acquisition as plant root uptake of mineral N only but lack a representation of a plant-controlled pathway to increase N availability and acquisition on demand (Knops et al., 2002; Chapman et al., 2006; Zaehle and Dalmonech, 2011). This could be any pathway, which may involve direct organic nutrient uptake and/or rhizodeposition in order accelerate SOM decomposition, but in particular mycorrhiza-mediated rhizosphere–SOM interactions (Chapman et al., 2006; Phillips et al., 2013; Brzostek et al., 2017). The absence of such pathways can lead to incorrect predictions of plant and ecosystem responses to eCO2 and to uncertain estimates of the ecosystem impact on climate change (Brzostek et al., 2017; Terrer et al., 2018; Shi et al., 2019).
Consequently, several approaches to implement mycorrhizal dynamics into ecosystem models have been developed during the last decade, either to explore C–nutrient exchange/competition between the host plant and mycorrhizal fungi for individuals (e.g. Meyer et al., 2010; Franklin et al., 2014) or to improve the representation of plant nutrient acquisition in TBMs at the ecosystem scale by simulating their effects on SOM dynamics (e.g. Deckmyn et al., 2011; Orwin et al., 2011) or by including them directly into plant N nutrition calculations (e.g. Phillips et al., 2013; Brzostek et al., 2014, 2015; Sulman et al., 2017). One of the main issues facing such a model is that both species of arbuscular and ectomycorrhizal fungi have been shown to actively mine SOM as a nutrient source, either by a direct enzymatic breakdown of material, which potentially includes saprotrophic behaviour (Hodge et al., 2001; Wu et al., 2005; Pérez-Tienda et al., 2012; Hodge and Storer, 2015), or by passively priming SOM by C exudation, which accelerates SOM decomposition (Hodge et al., 2001; Cheng et al., 2012; Lindahl and Tunlid, 2015; Paterson et al., 2016; Lang et al., 2021). Additionally, associations with either AMs or ECMs are identified at the species level (and it is difficult to aggregate them to the ecosystem level) or appointed to plant functional types (PFTs) (which are represented in TBMs). Thus, for the purpose of this study, we choose not to implement the common mycorrhizal types; rather, we explore what the consequences of these two mycorrhizal functionalities (i.e. an active SOM-mining saprotrophic mycorrhizal function and a passive SOM-priming mycorrhizal function that accelerate SOM decomposition by C exudation) are on plant N acquisition and ecosystem carbon storage, how explicitly we can model plant–mycorrhiza–soil interactions given the current knowledge and data availability, and, finally, whether or not this improves the prediction of the observed responses of plant N acquisition at the ecosystem scale under ambient- and elevated-CO2 conditions.
We implement the two alternative representations of mycorrhizal functionalities into the QUINCY (QUantifying Interactions between terrestrial Nutrient CYcles and the climate system; Thum et al., 2019) model and then compare the model predictions for these representations to the standard model, which does not account for mycorrhizal fungi, to assess the robustness of the alternative model structures and their parameterisation. We test all model variants at the Duke Free-air CO2 Enrichment (FACE) site to especially investigate responses to atmospheric CO2 enhancement and, subsequently, compare model output to observational data, where available (McCarthy et al., 2006).
2.1 QUINCY model
The QUINCY TBM is described in detail in Thum et al. (2019). The model simulates photosynthesis and the growth of vegetation represented by average individuals of PFTs as well as soil biogeochemical processes. QUINCY represents fully coupled C, N, P and water cycles, and it traces the isotopic signals of 13C, 14C and 15N. QUINCY operates on a half-hourly time step to account for short-term acclimation, but many processes have a specific memory time, e.g. days, weeks or months, over which the calculated flux is averaged to also consider longer response times. Below, we briefly present the representation of the most relevant processes for plant N acquisition as well as of soil organic matter dynamics that are affected or modified by the implementation of the mycorrhizal processes.
Plant N acquisition is described as direct uptake of inorganic nitrogen by fine roots. Potential root uptake is assumed to be a function of fine-root biomass and mineral soil N content, i.e. ammonium (NH4) and nitrate (NO3). This potential uptake is scaled down in times of low plant N demand, which depends on the ratio of available to required N for growth. Biomass is allocated dynamically above- and below-ground in response to plant nutrient and water demand. Acquired N and assimilated C are first added to the plant labile pool, which is one of two nonstructural plant pools represented by QUINCY. From there, C and N are distributed among all other plant pools, i.e. the plant structural pool to represent tissue growth and the plant reserve pool as second nonstructural pool for storage, within a week. This allows QUINCY to account for sink and source limitation and also smooths daily variations.
QUINCY includes a representation of soil carbon and nutrient pools that is based on the CENTURY soil model (Parton et al., 1993). It accounts for five organic soil pools (i.e. three litter pools, a fast-overturning SOM pool and a slow-overturning SOM pool) and three inorganic soil pools (i.e. NH4, NO3 and PO4). Decomposition is described as first-order decay by specific turnover times and pool sizes. Net mineralisation of nutrients occurs if the nutrient immobilisation for litter decomposition is less than the gross nutrient mineralisation from the decomposition of SOM. Plant uptake competes with immobilisation as well as leaching and nitrification- and denitrification-related gaseous losses for the available inorganic nutrients.
2.2 MYC model description
The plant–MYCorrhiza–soil interaction (MYC) model includes plant–mycorrhiza dynamics and mycorrhiza–soil interactions. Relevant QUINCY fluxes and MYC model fluxes are presented in Fig. 1.
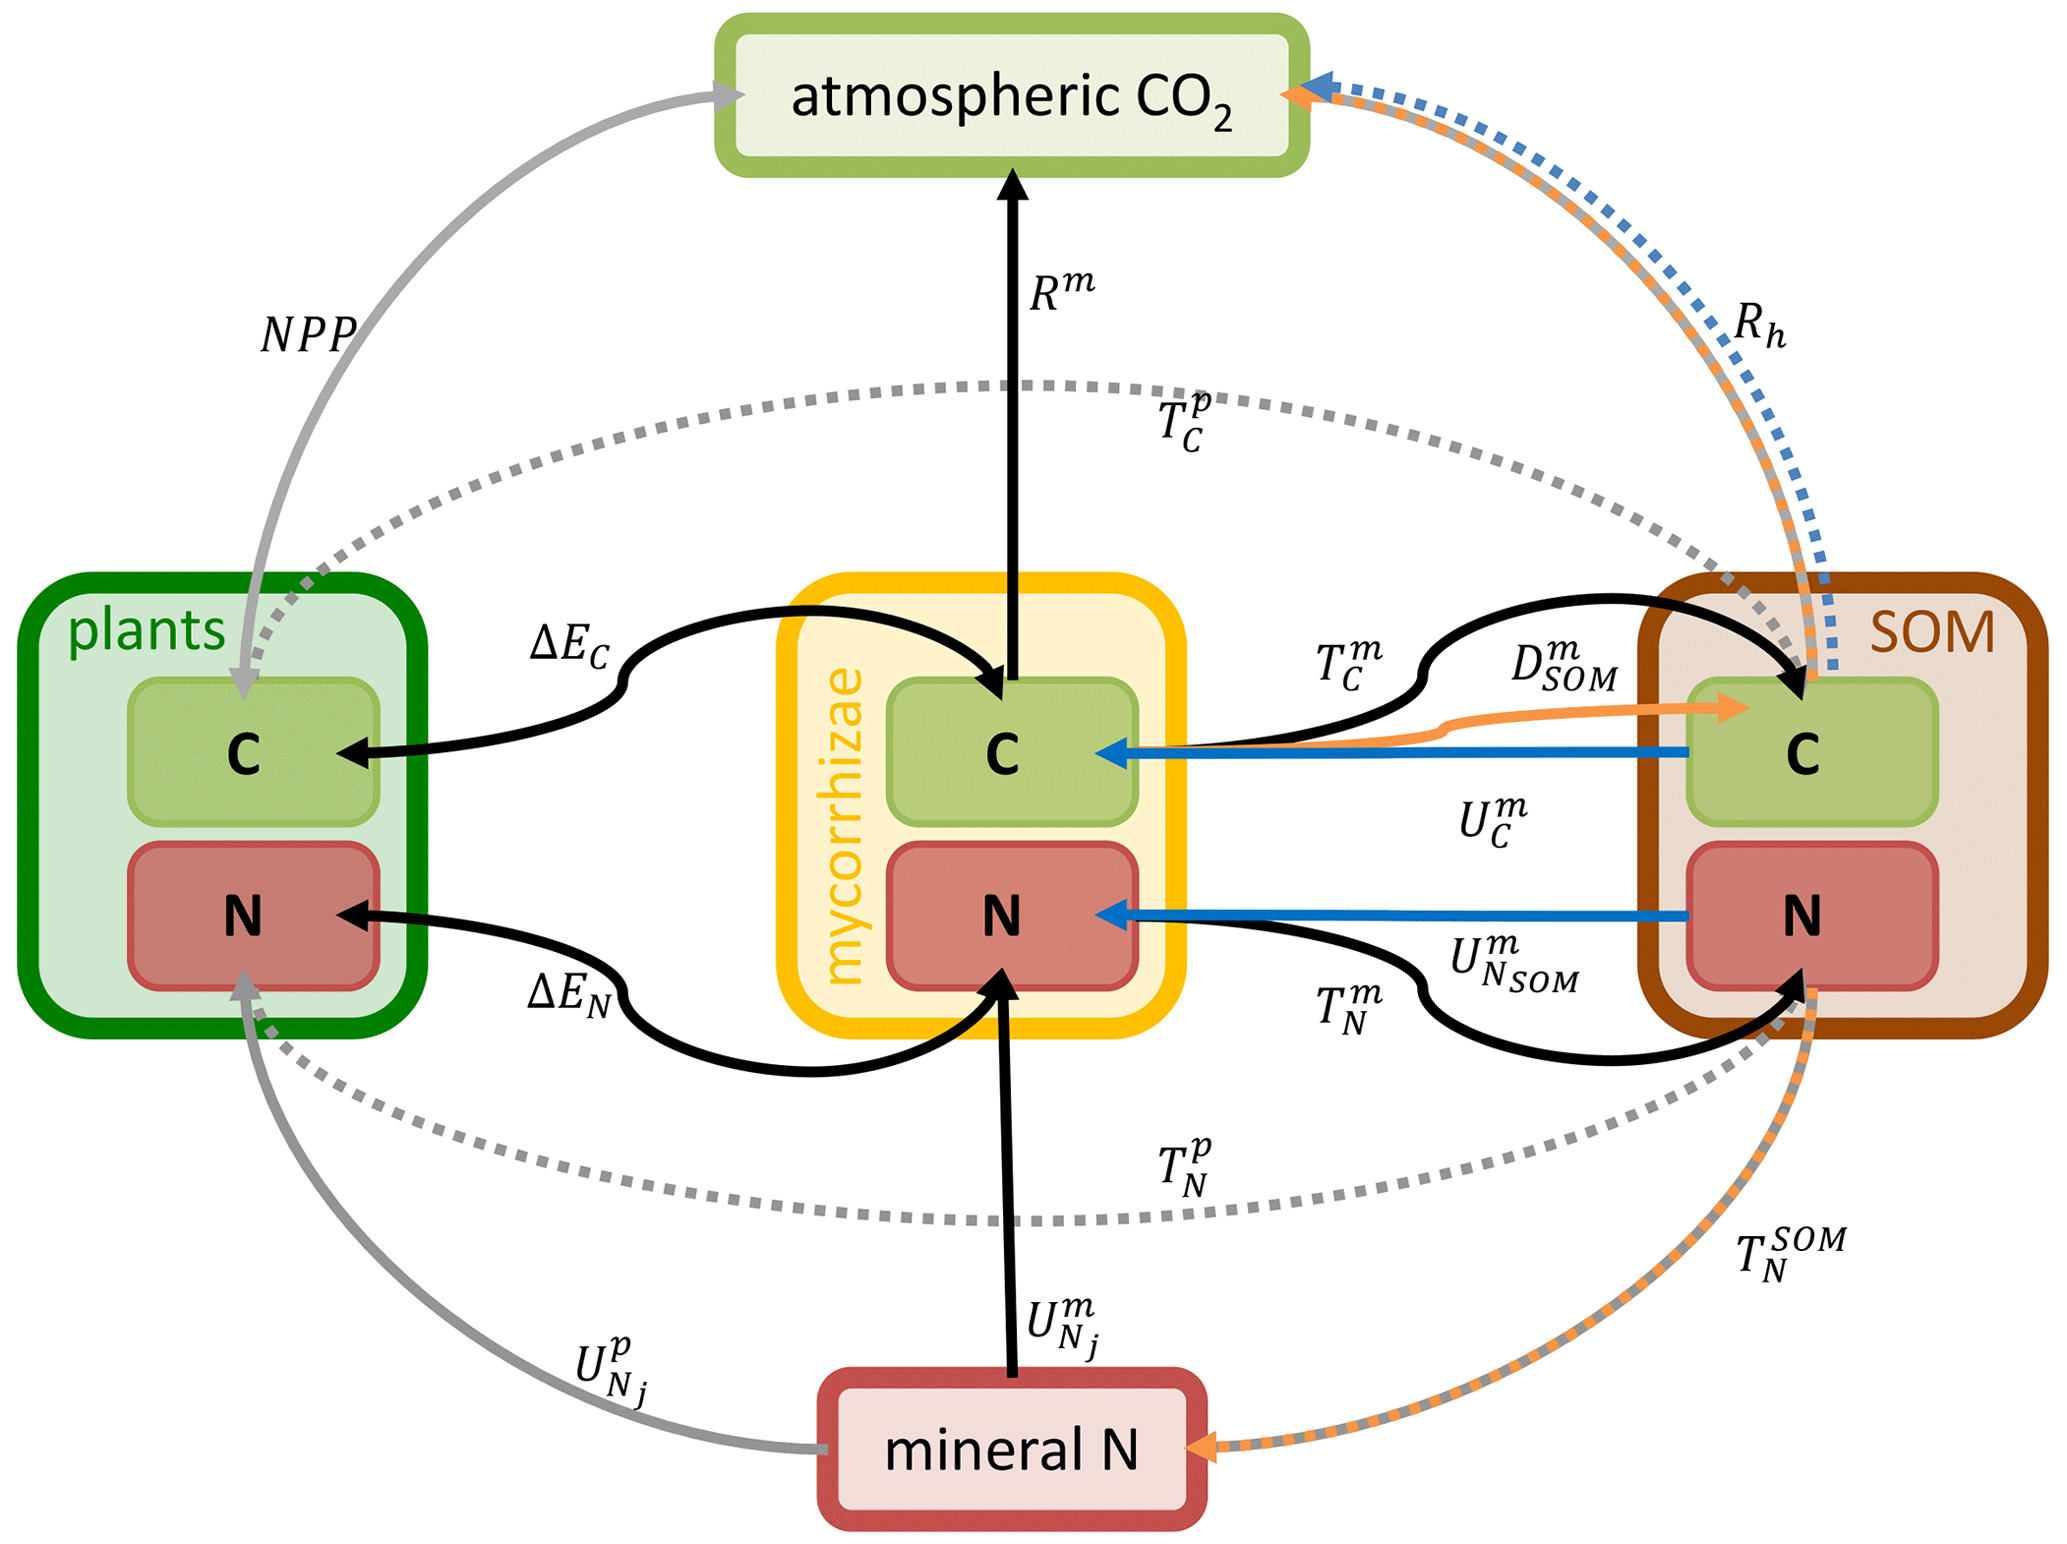
Figure 1Schematic representation of the plant–MYCorrhiza–soil interaction (MYC) model fluxes within the QUINCY framework. Boxes represent model pools: light green represents C pools and red represents N pools. They are grouped for plants (dark green), mycorrhizae (yellow) and SOM (brown). Arrows indicate fluxes: solid arrows are explained in Eqs. (1)–(12), whereas dashed arrows are not explained in detail here, as the latter are not modified by or used within the MYC model. Grey arrows belong to the QUINCY framework, black arrows belong to both mycorrhizal functionalities, blue arrows belong only to saprotrophic mycorrhizae, and orange arrows belong to or are affected by decomposing mycorrhizae. E depicts exchange fluxes, R denotes respiration fluxes, T represents turnover fluxes and U depicts uptake fluxes. Subscripts indicate whether plants (p), mycorrhizae (m) or SOM determine flux rates. Subscripts contain additional information, e.g. exchanged property or source. For more details, see Eqs. (1)–(12).
Plants and mycorrhizae interact through the C flux from host plants to mycorrhizal fungi, the reduction in the fine-root uptake capacity in the presence of mycorrhizae (as these roots are assumed to be partially covered by the mycelium and therefore have a less direct contact with the soil), and the export of nitrogen taken up by mycorrhizae to plant roots. The respective net C and N acquisition of plants (Fig. 2a, b) is described as follows:
The net C acquisition of plants, i.e. plant biomass production (BP), is given by net primary production (NPP) and net C exchange between the host plant and mycorrhizal fungi (ΔEC in Fig. 2a). Plant (net) N acquisition () is given by direct root uptake () and net N exchange (ΔEN in Fig. 2b).
NPP and root N uptake are calculated by the following expressions in the standard QUINCY model, which have been further modified to account for the effects of mycorrhizae:
In the above expressions, j refers to either NH4 or NO3, Nj denotes the NH4 or NO3 concentration in soil, is a parameter describing the maximum uptake rate per unit fine-root biomass (), and are the respective low- and high-affinity half-saturation parameters, and is a scaling factor that describes current plant N demand. The modification of the maximum uptake rate per unit biomass () maintains the overall maximum uptake capacity of the rhizosphere () by taking the relative presence of mycorrhizae (fcover,max) and their higher uptake efficiency () compared to plants into account, while the adjustment of root biomass considers the disconnection of root tips from soil by mycorrhizal fungi. This coverage is given by the current ratio of fine-root biomass () and mycorrhizal biomass (Cm), but it is constrained by a maximum coverage to account for a shift in the mycorrhizal community to more exploitative species if plants are under severe N limitation.
In a similar way to plant C and N acquisition (Eq. 1), mycorrhizal growth (Gm in Fig. 2c, d) is defined as the net budget for C and N accumulation over time. is given by mycorrhizal C uptake from SOM (, only in the case of saprotrophic mycorrhizae); net C exchange between the host plant and mycorrhizal fungi (ΔEC); and losses by mycorrhizal turnover (), respiration (Rm) and exudation to accelerate SOM decomposition (, only in the case of decomposing mycorrhizae; Fig. 2c). is given by mycorrhizal N uptake (), net N exchange (ΔEN) and mycorrhizal turnover ( in Fig. 2d).
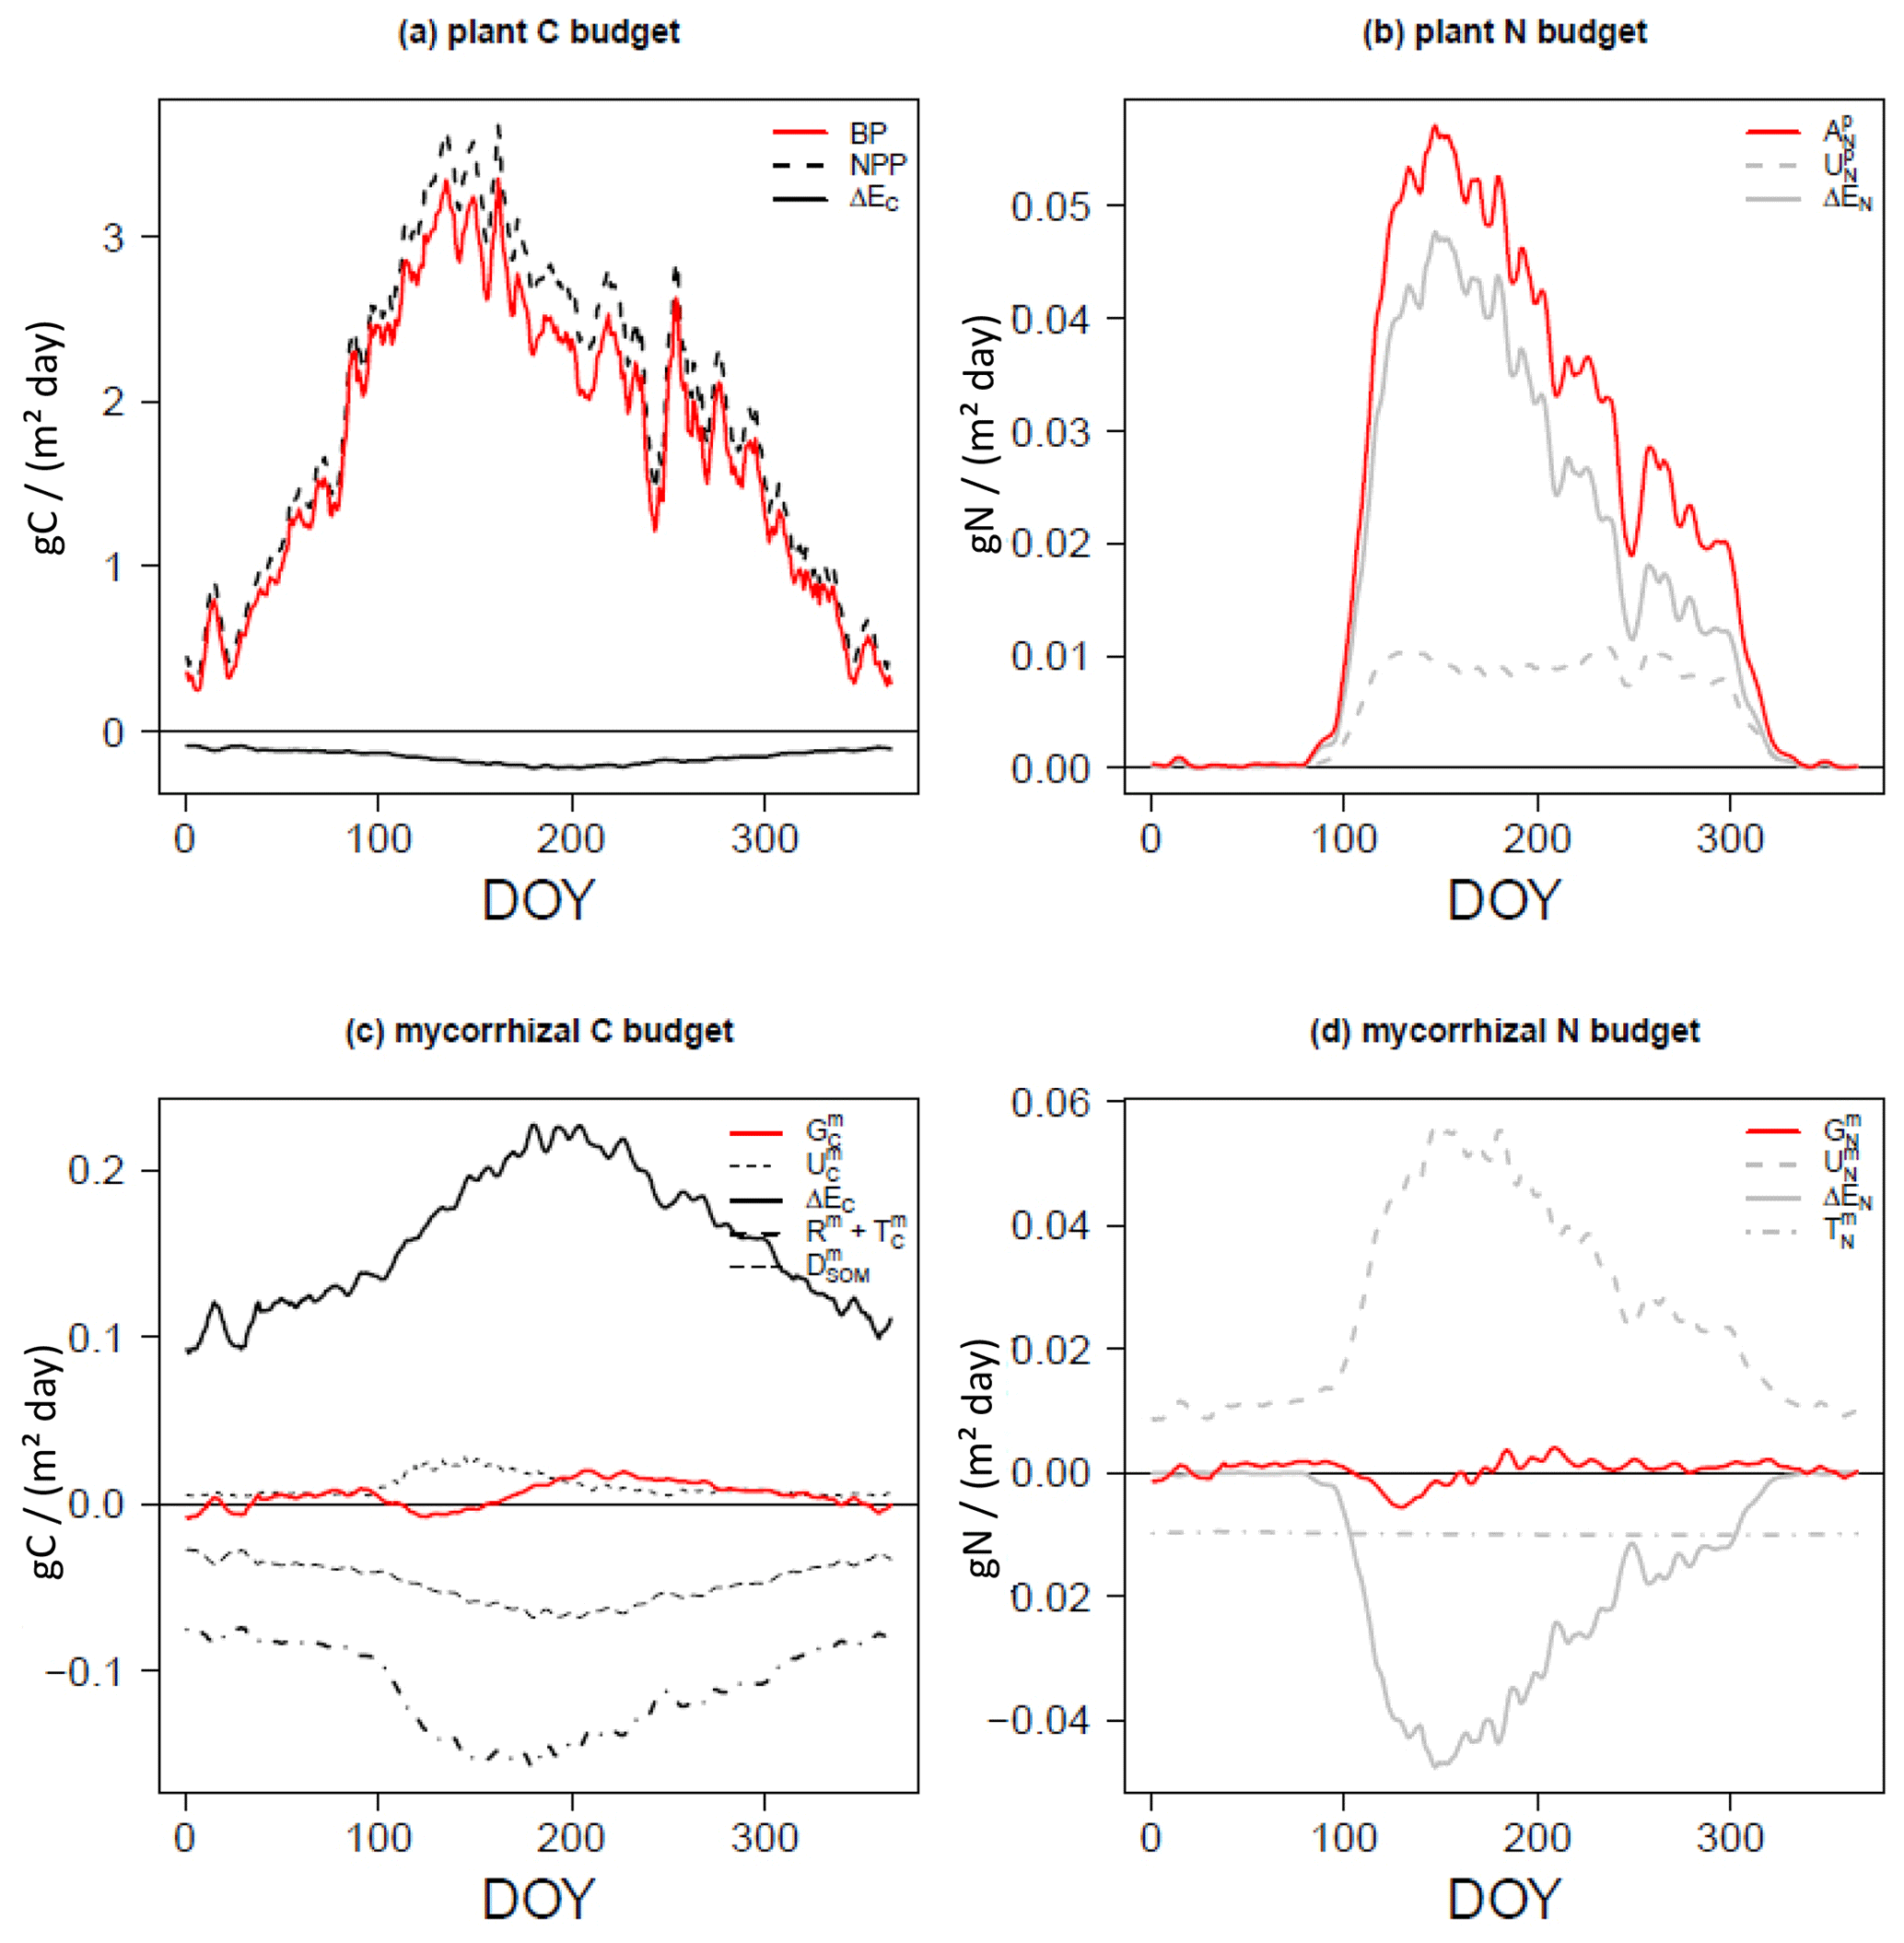
Figure 2C and N budgets of plants (a, b) and mycorrhizal fungi (c, d), as described in Eqs. (1) and (3), per day (of year, DOY). Net budgets are shown in red, C fluxes are given in black and N fluxes are presented in grey. Uptake (U) is shown using dashed lines, net exchange rates (ΔE) are presented using solid lines, losses by turnover (T) and respiration (R) are shown using dot-dash lines (c, d), and losses by exudation to SOM (D) are presented using long dashes (c).
The exchange of C and N between the host plant and mycorrhizal fungi consists of an exudation flux from plants to mycorrhizae (Ep2m), where we assume that plant N exudation is zero and that the export flux from mycorrhizae to plants (Em2p in Fig. 3) is as follows:
Positive signs depict fluxes from mycorrhizae to plants, whereas negative signs depict fluxes from plants to mycorrhizae.
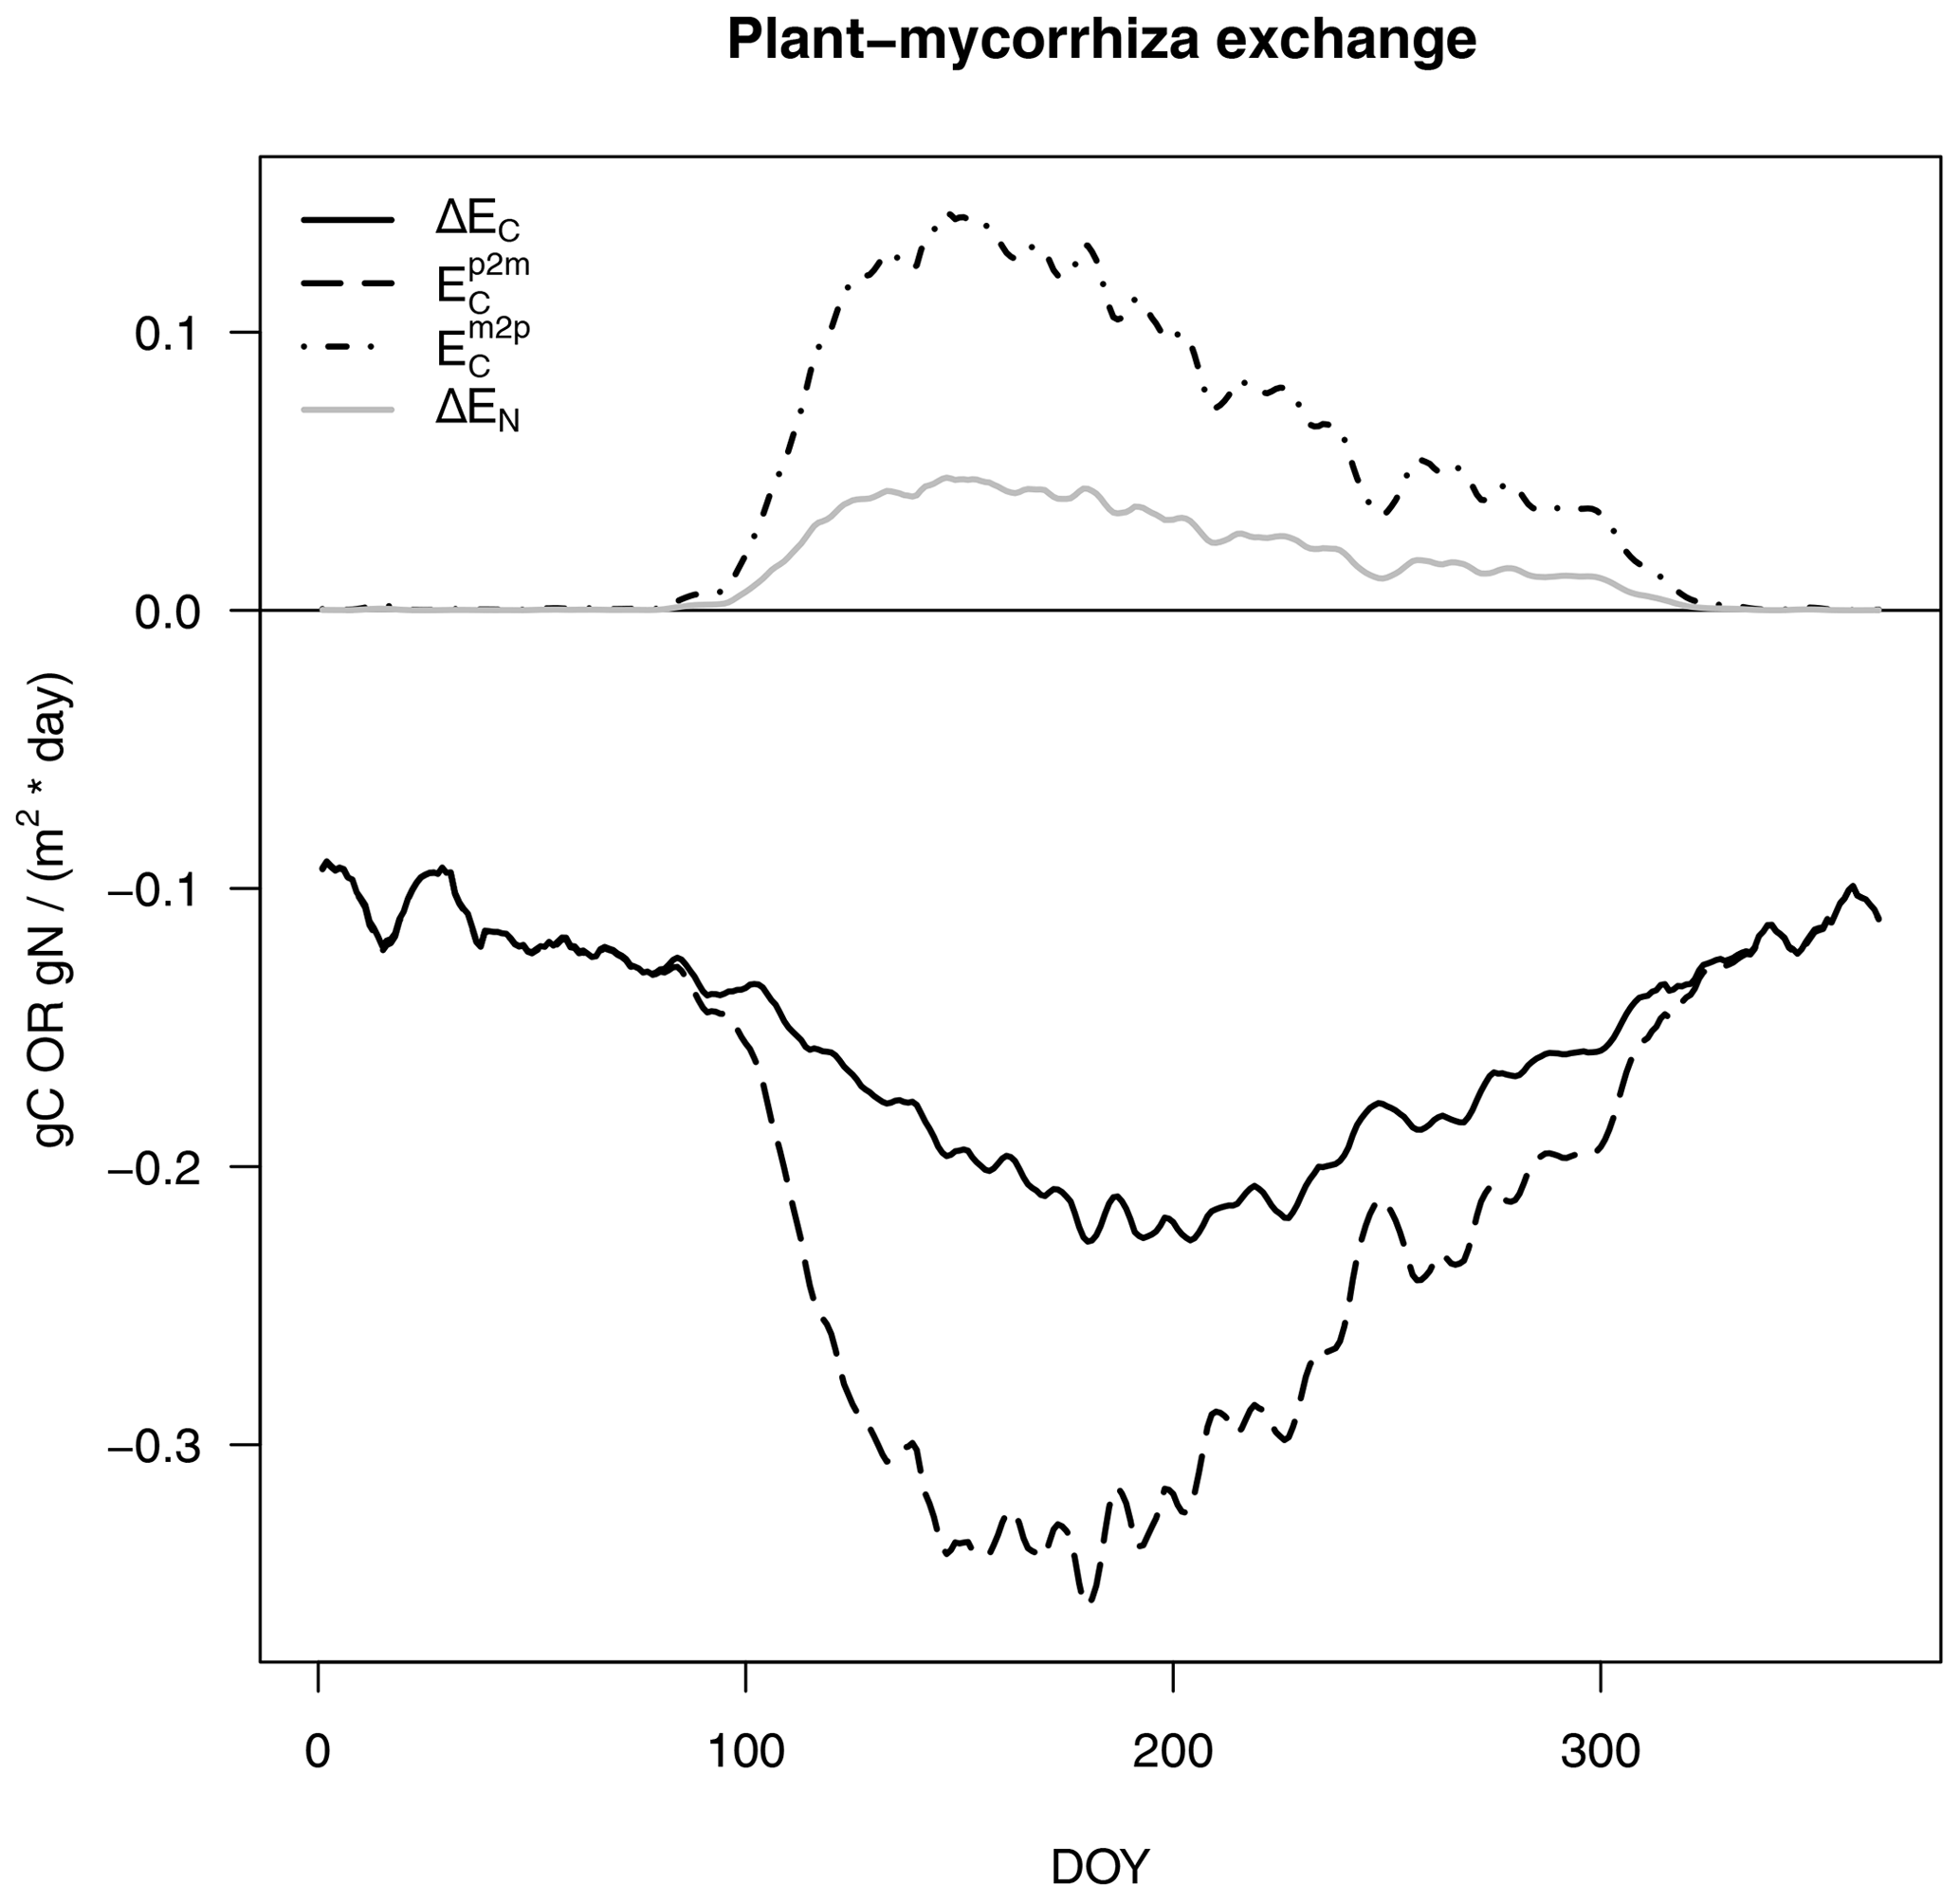
Figure 3C and N exchange rates between host plants and mycorrhizal fungi, as described in Eq. (4), per day (of year, DOY). C fluxes are shown in black and N fluxes are given in grey, as in Fig. 2. Net exchange rates (ΔE, solid lines) are partitioned into exudation from plants to mycorrhizal fungi (Ep2m, dashed line) and export from mycorrhizal fungi to plants (Em2p, dot-dash line).
We constrain C exudation () from the host plant to mycorrhizal fungi in a similar way to that assumed in MYCOFON using the following parameters (Meyer et al., 2010):
-
the amount of available C, which is represented by the labile C pool in QUINCY;
-
plant N demand, where increasing N demand increases C allocation to mycorrhizal growth;
-
an interaction term that allows for a decline in exudation if plants do not receive nutrients in return, which could happen either in the case of satisfied demand by plants or in the case of severe N limitation, thereby turning mycorrhizal fungi into competitors that do not deliver any N to host plants;
-
a minimum and maximum amount of mycorrhizae compared with plant fine roots, to avoid complete mycorrhizal death and to prevent plants overspending C.
For a detailed description of the equations, see Appendix A.
We calculate N export from mycorrhizal fungi to host plants () as mycorrhizal surplus N, which is derived from current mycorrhizal N uptake () and N demand (), assuming that mycorrhizal fungi will first maintain their own C : N ratio () before they can deliver N to host plants. This potential N export is scaled by plant N demand () for actual N export to suppress export if the plants have sufficient N. As we assume that mycorrhizal fungi deliver N as part of amino acids, C export () is given by N export and a prescribed C : N ratio ().
Mycorrhizal N uptake () is the sum of mineral N uptake () and organic N uptake () in the case of saprotrophic mycorrhizae. Mineral N uptake, i.e. uptake of ammonium (NH4) and nitrate (NO3), is calculated similarly to plant root uptake in QUINCY (Eq. 2), but it is down-regulated if the C investment in N transformation to amino acids exceeds a threshold to avoid mycorrhizal death:
Here, Nj denotes either NH4 or NO3, is a parameter describing the maximum uptake rate per unit mycorrhizal biomass (Cm), and are the respective low- and high-affinity half-saturation parameters, and fresp,max is the empirical threshold for C investment into mineral N uptake.
We calculate the turnover of mycorrhizal fungi () based on the life span of mycorrhizae as follows:
where τmyc is mycorrhizal turnover time and Xm is either mycorrhizal C or N. is added to the respective litter pool in soil, similar to the death plant fine roots.
We calculate respiration of mycorrhizal fungi (Rm) as the sum of direct mycorrhizal respiration (), which is associated with growth and maintenance processes, using a constant C use efficiency (CUEm) and recently gained C, and N uptake respiration (), which is related to the specific costs (rj) associated with transforming mineral N (Nj) into amino acids (Zerihun et al., 1998).
Special functionalities of saprotrophic and decomposing mycorrhizae
Saprotrophic mycorrhizae mine SOM as additional organic N source. We assume that mycorrhizae access old, C-depleted, N-rich SOM. We further assume that mycorrhizae are only facultative saprotrophs, which is why we decrease N uptake from SOM if both plants and mycorrhizae have sufficient N, which is quantified by the current C : N ratio of mycorrhizae.
Here, is the maximum uptake rate per unit mycorrhizal biomass (Cm); is the half-saturation parameter; and flimit is a down-regulation function for N uptake from SOM, which is derived from the target C : N ratio of mycorrhizal fungi (), a minimum C : N ratio () and the current C : N ratio.
We assume that organic N uptake by SOM-mining mycorrhizae is associated with a C flux corresponding to the uptake of amino acids and some additional C, even if most mycorrhizal fungi lack the capacity to assimilate soil organic C (SOC) and acquire C only from their host plant (Lindahl and Tunlid, 2015; Frey, 2019). This C uptake () is described as follows:
where CUEm is the C use efficiency of mycorrhizal uptake and describes the share of SOC that mycorrhizae can incorporate. The remaining C is respired.
Decomposing mycorrhizae exude C () to accelerate decomposition. This C provides energy for microbes to decompose older SOM faster, which enhances the net mineralisation flux and, therefore, increases soil mineral N availability for mycorrhizal fungi as well as plants and microbes. We calculate the exudation as follows:
where is an empirical parameter. In order to not violate the fixed soil C : N ratio assumed in QUINCY, is added to heterotrophic respiration. This is reasonable, as we assume that the induced acceleration of decomposition increases heterotrophic respiration generally.
We represent the resulting acceleration of decomposition implicitly by lowering the turnover time of slow SOM in the presence of decomposing mycorrhizal fungi.
where denotes the turnover time of the SOM without the influence of decomposers but in mycorrhizal presence, and are empirical parameters, and Cm is mycorrhizal biomass.
In order to maintain the overall ecosystem dynamics in a steady state, comparable to the model simulations without mycorrhizae, we multiply the turnover of the slow-overturning SOM pool in QUINCY by an empirically determined parameter for both mycorrhizal functionalities.
Meyer et al. (2010)Meyer et al. (2010)Marschner and Dell (1994)Göransson et al. (2006)Marschner and Dell (1994)Göransson et al. (2006)Marschner and Dell (1994)Smith and Read (2010)Allen et al. (2003)Wallander et al. (2003)Hauptmann (1985)Thum et al. (2019)Thum et al. (2019)Thum et al. (2019)Thum et al. (2019)Thum et al. (2019)Thum et al. (2019)Thum et al. (2019)Thum et al. (2019)Thum et al. (2019)Thum et al. (2019)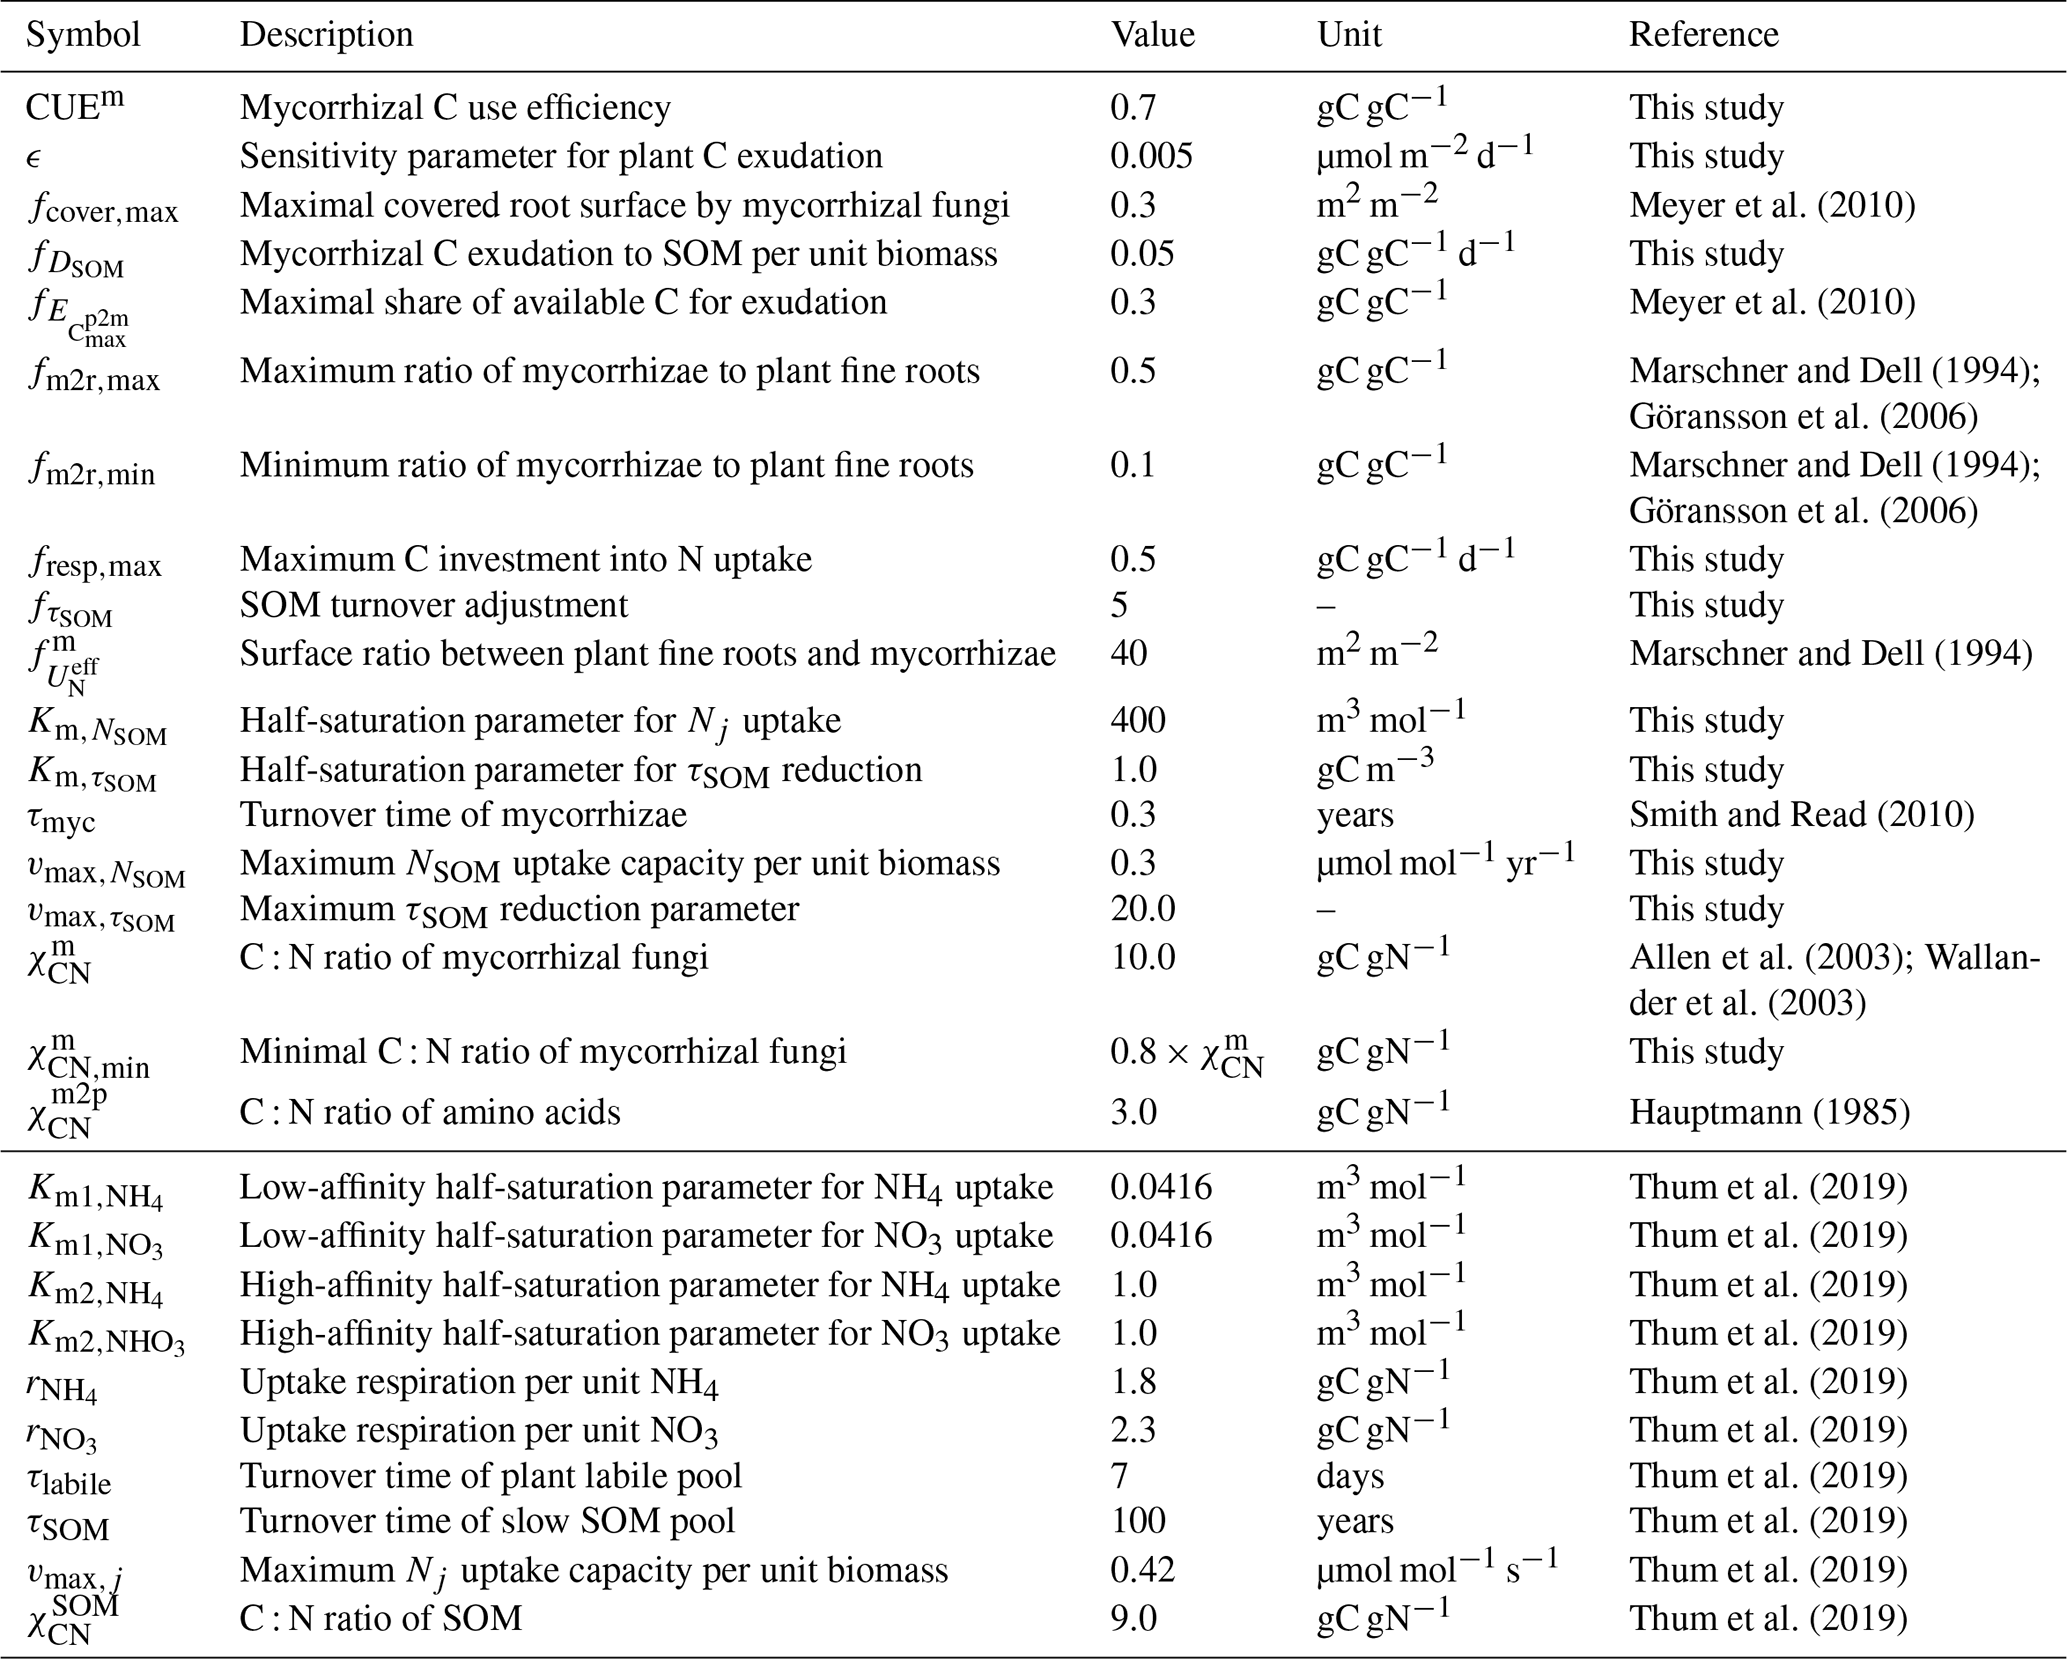
2.3 Duke Forest FACE experiment
We test the QUINCY–MYC model at the Duke Forest Free-air CO2 Enrichment (FACE) site (hereafter Duke FACE). The Duke FACE experiment (McCarthy et al., 2007) was set up in a loblolly pine (Pinus taeda) plantation (35.9° N, 79.08° W; North Carolina, US) that was established in 1983 after a clear-cut. The experiment started in August 1996 with three plots per CO2 treatment, i.e. ambient and elevated (+200 ppm) CO2 concentration, with plots paired according to soil N availability.
For our analysis, we use locally measured climate data (see Sect. 2.4), comprising annual measurement data for ambient and elevated treatments for plant C and N fluxes, i.e. plant biomass production (BP) and plant N acquisition (), which are estimated by Finzi et al. (2007). Responses were calculated per each treatment plot pair and then averaged. Soil C concentrations and δ13C measurements are taken from Lichter et al. (2008), who used specific δ13C labelling of the artificial CO2 that was used for fumigation.
2.4 Model set-up and protocol
QUINCY requires half-hourly meteorological forcing consisting of air temperature, precipitation (rain and snow), long-wave and short-wave radiation, atmospheric CO2 concentration, and N and P deposition rates. Meteorological data are derived from version 7 of the CRUNCEP dataset (Viovy, 2016), which provides daily data from 1901 to 2015. Data are disaggregated using a statistical weather generator (Zaehle and Friend, 2010) to the half-hourly model time step. Annual data for atmospheric CO2 concentration are taken from Le Quéré et al. (2018), while N deposition rates are from Lamarque et al. (2010) and Lamarque et al. (2011). As local records of forcing data are available, we used data from Walker et al. (2014) for the duration of the Duke FACE experiment.
Additionally, QUINCY requires information about vegetation, given as PFT and soil information, such as texture, bulk density and rooting and soil depth, for each site. As this work aims to study N controls on plant growth, we also use information about inorganic P content that is kept constant to avoid the influence of P limitation.
QUINCY pools (vegetation and soil) are brought to quasi-equilibrium by a spin-up period of 500 years that uses repeated meteorological data from 1901 to 1930 to drive simulations, before the actual simulation period (1901–2015) starts, with transient climate and CO2 concentrations as described above. Vegetation tissue pools are set to zero in 1983, the year of forest establishment at the site. Harvested biomass persists in the system by adding it to litter, except for woody biomass, from which a fraction of 80 % is removed.
We perform two simulations: one for ambient CO2 and one in which atmospheric CO2 concentrations are elevated by 200 ppm from August 1996 on in order to mirror the FACE experiment. The δ13C signal is calculated by the amount of fumigated artificial CO2 compared with natural CO2 (McCarthy et al., 2007).
To assess parameter uncertainty, we vary all MYC model parameters (Table 1, section above the line) within a range of ±10 %. We use Latin hypercube sampling (LHS; Saltelli et al., 2000) to generate 200 parameter sets for each mycorrhizal functionality. We did not vary default QUINCY parameters (Table 1, section below the line), as a detailed analysis can be found in Thum et al. (2019).
For the analysis of the Duke FACE experiment, we carry out two runs for each model variant and each parameter set: QUINCY without mycorrhizal fungi (1 times two runs, i.e. one under ambient CO2 and one under elevated CO2, as described above), QUINCY with decomposing mycorrhizae (200 times two runs, i.e. one run for each CO2 concentration for each of the 200 LHS parameter sets) and QUINCY with saprotrophic mycorrhizae (200 times two runs, i.e. one run for each CO2 concentration for each of the 200 LHS parameter sets). We analyse the median and the 10 % and 90 % quantiles of the LHS simulations.
In order to better present changes in the CO2 elevation during the experiment, flux responses are shown as relative responses (δY in Eq. 13a), whereas changes in pool sizes, e.g. soil organic matter content or mycorrhizal biomass, are shown as absolute changes (ΔX in Eq. 13b).
In order to better understand the impact of the mycorrhizal parameterisation on the simulated ecosystem dynamics, we also use a linear decomposition method (Rastetter et al., 1992) to attribute the changes in ecosystem C storage under eCO2 to changes in the N cycle induced by mycorrhizae.
3.1 Effects on simulated vegetation dynamics under ambient and elevated CO2
Simulated ambient plant biomass production (BP) is generally lower than observed BP (999.6 ± 138.8 gC m−2 yr−1), but it does not differ much among simulations with and without mycorrhizal fungi (Fig. 4a). Simulated ambient plant N acquisition () captures observed plant N acquisition (8.3 ± 0.5 gN m−2 yr−1) in general (Fig. 4c), whereby both BP and N acquisition are higher in simulations without mycorrhizae (BP: 808.7 ± 39.5 gC m−2 yr−1; : 9.0 ± 0.2 gN m−2 yr−1) and with saprotrophic mycorrhizae (BP: 755.6 ± 41.1 gC m−2 yr−1; : 9.8 ± 1.4 gN m−2 yr−1), whereas these values are lower in simulations with decomposing mycorrhizae (BP: 678.1 ± 71.2 gC m−2 yr−1; : 6.3 ± 0.5 gN m−2 yr−1). This indicates a stronger competition for N by decomposing mycorrhizae than by saprotrophic mycorrhizae, which in turn limits plant growth. Root infection by mycorrhizal fungi lowers direct plant N uptake, as mycorrhizae reduce root contact with the soil ( in Fig. 4e) by around 84 %; however, this effect is balanced the by mycorrhizal N uptake and export to plants (ΔEN in Fig. 4g). N export is higher for saprotrophic mycorrhizae (8.4 ± 1.4 gN m−2 yr−1) than for decomposing mycorrhizae (4.5 ± 0.4 gN m−2 yr−1), leading to the simulated difference in total plant N acquisition.
Elevated CO2 (eCO2) increases both observed and modelled BP. The first-year effect is lower for observations (+24.8 %) and for simulations with saprotrophic mycorrhizae (+25.0 %), whereas it is higher for simulations without mycorrhizae (+43.6 %) and with decomposing mycorrhizae (+35.3 %; δBP in Fig. 4b). The observed BP response reaches a value of +27.2 ± 2.1 % for the first 6 years of the experiment; it then increases to +36.5 ± 2.9 % for 5 years and decreases slightly in the last year (+20.3 %). This behaviour is not entirely captured by any of the simulations, but it also remains unclear whether the last-year decrease is a sign of progressive N limitation caused by annual variation or by a bias in observations after winter 2001–2002, when a storm affected some of the plots (McCarthy et al., 2006). The positive observed responses of plant N acquisition during the entire experimental phase (+23.5 ± 6.2 %; in Fig. 4c) point to the effect of climate variability and disturbance, rather than progressive N limitation (McCarthy et al., 2006). Modelled responses of BP are similar in simulations without mycorrhizal fungi and with saprotrophic mycorrhizae within the first half of the experiment. In the second half of the experiment, the BP response simulated by the model without mycorrhizal fungi decreases. This is constrained by the small increase in simulated plant N acquisition within the first 5 years (+8.9 ± 4.0 %) and the slightly negative response afterwards (−5.0 ± 5.5 %). In contrast, the simulated BP response of the model with saprotrophic mycorrhizae remains enhanced until the end of the experiment (+39.6 ± 1.2 %), which is supported by a strong positive response of plant N acquisition during the entire experiment (+33.8 ± 12.9 %). The simulated BP response by the model variant with decomposing mycorrhizae is only positive during the first 3 years of the experiment and is slightly negative on average (−3.3 ± 16.1 %). This response is caused by a small but entirely negative response of plant N acquisition (−2.6 ± 1.2 %). Notably, this negative response of plant N acquisition is not caused by reduced plant N uptake in response to eCO2 as in the model variant without mycorrhizal fungi ( in Fig. 4f). In the simulations, decomposing mycorrhizae accelerate N decomposition in response to eCO2 and, therefore, allow plants to increase N uptake (+6.8 ± 2.8 %). However, they also act as strong competitors and, while mycorrhizae take up N from the soil, they reduce N export to their host plants to satisfy their own N demand (−7.6 ± 2.8 %; δΔEN in Fig. 4h). In contrast, the simulated positive plant N acquisition response during the entire experiment in the model variant with saprotrophic mycorrhizae is caused by both a slight increase in plant N uptake (+1.8 ± 5.7 %) and a strong increase in mycorrhizal N export (+40.3 ± 14.9 %), which matches the observed total plant N acquisition response best.
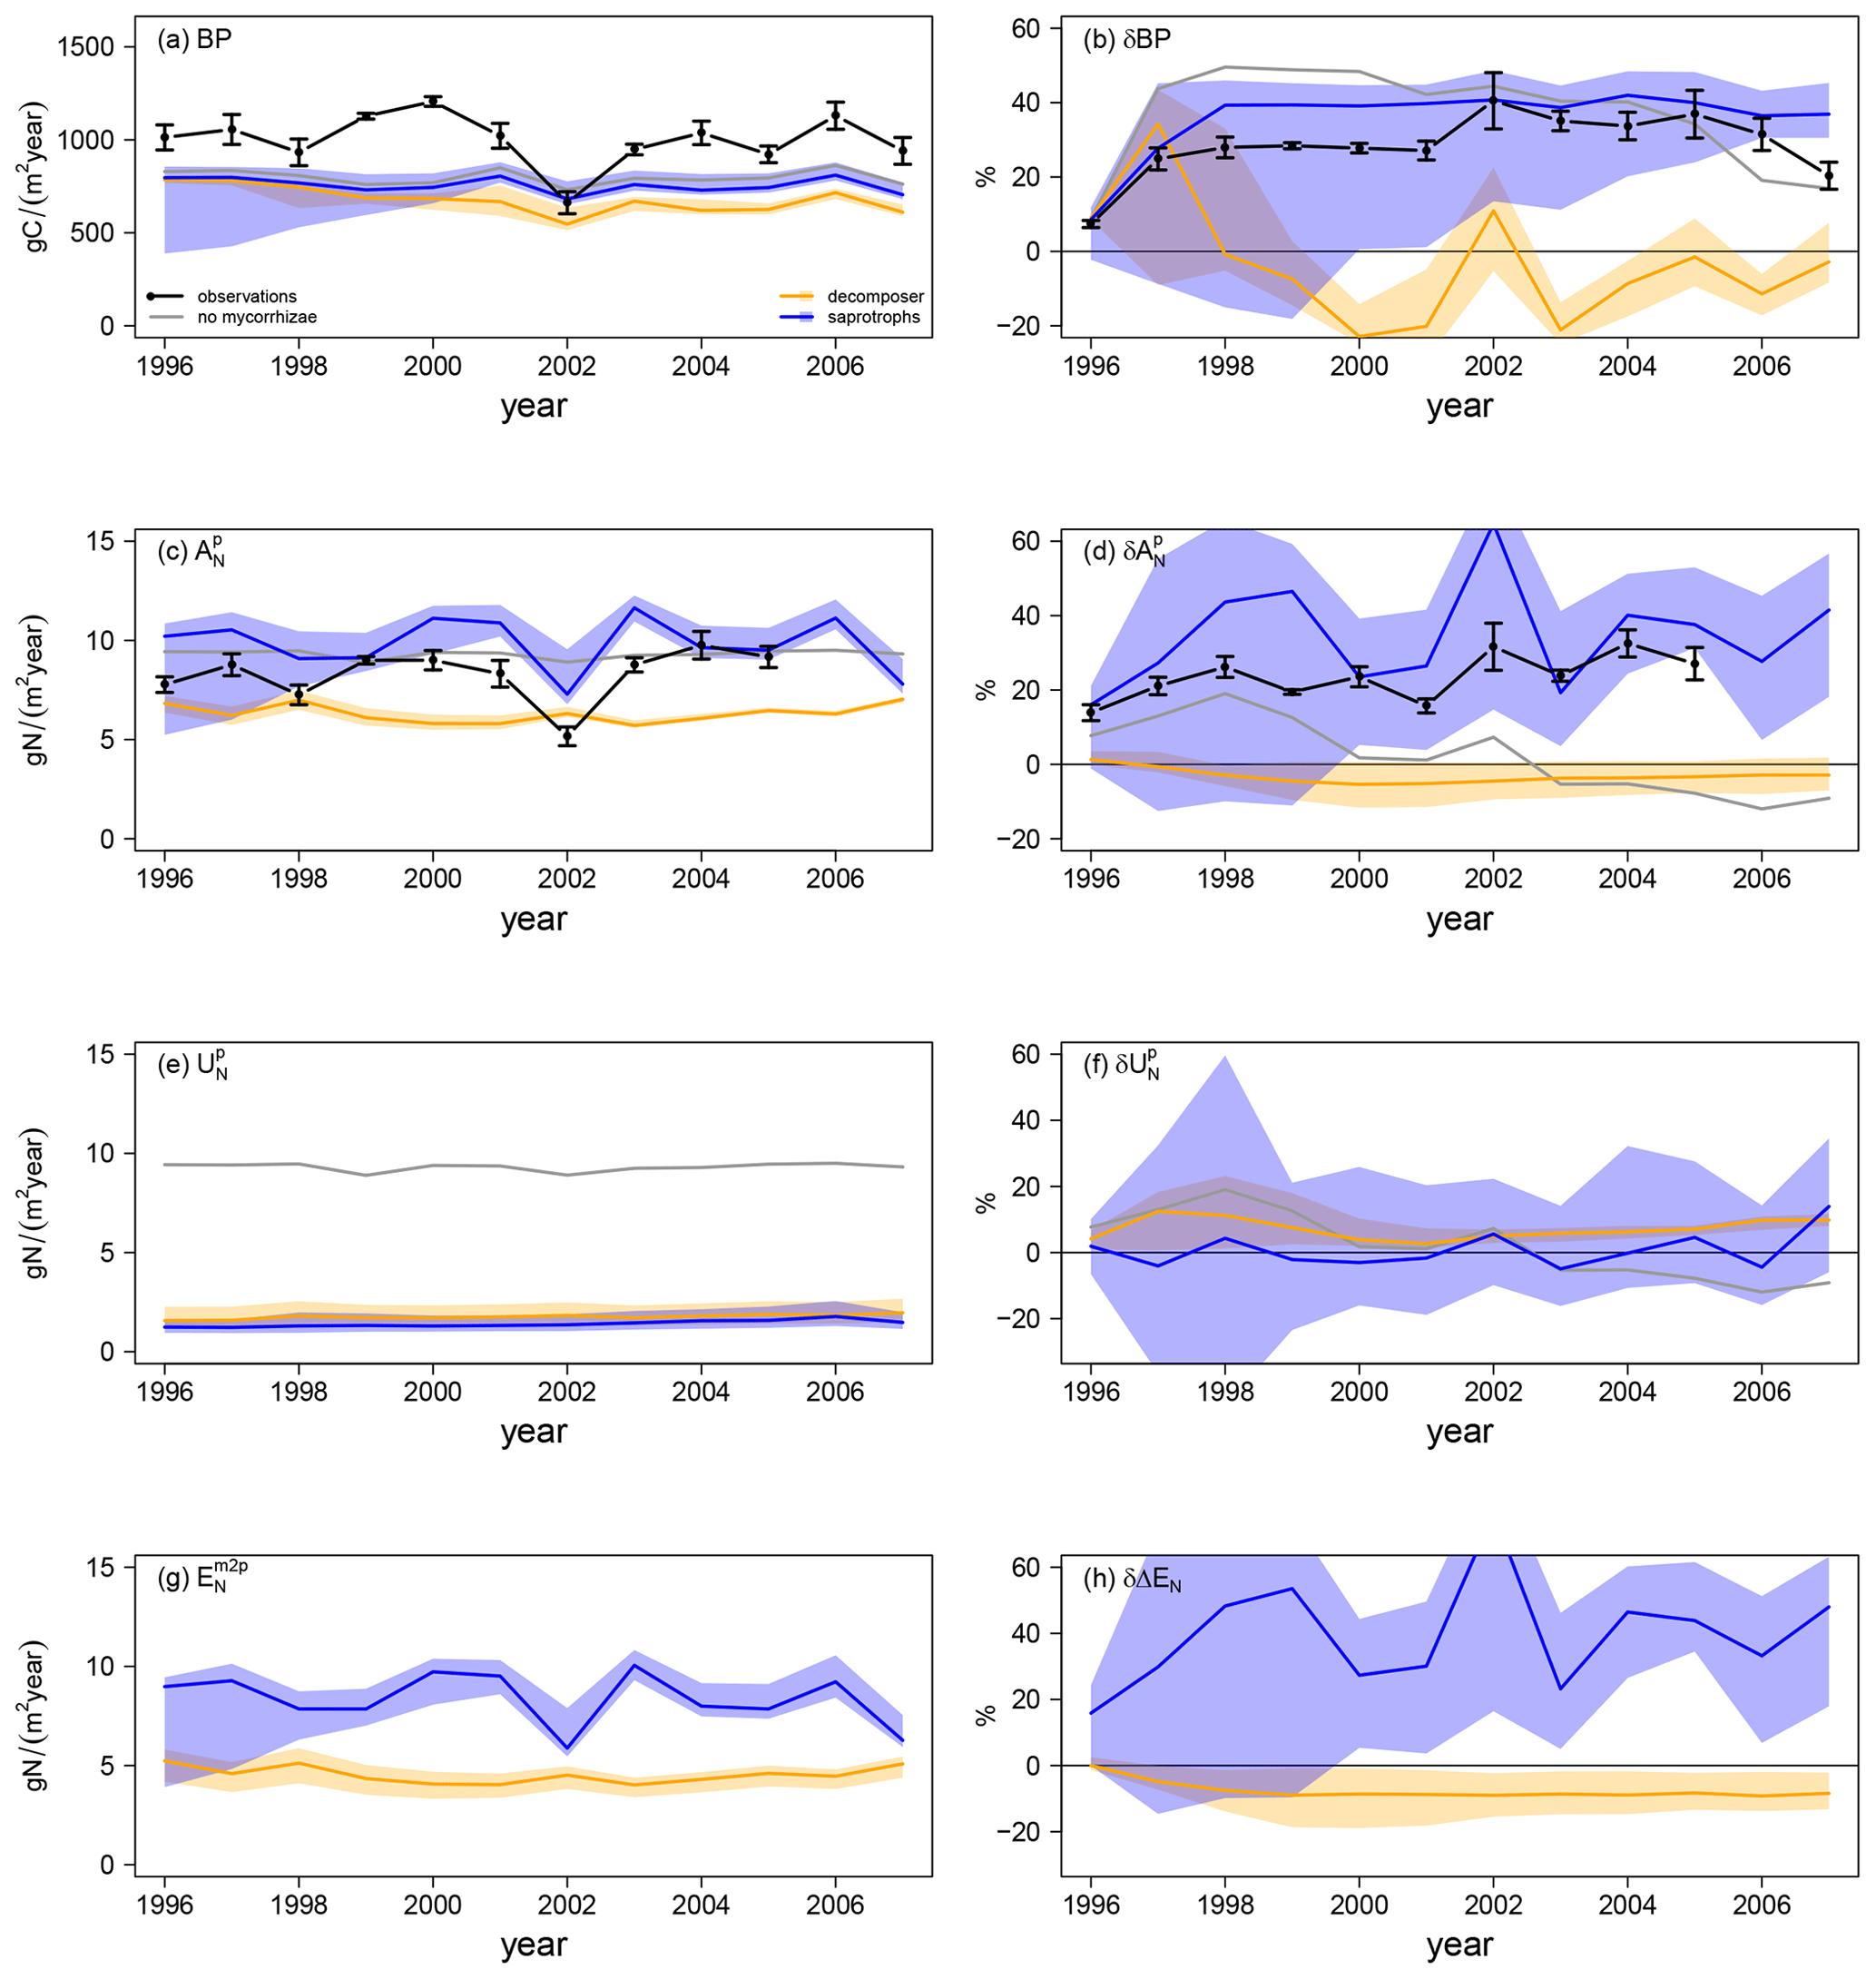
Figure 4Vegetation C and N fluxes for the Duke FACE experiment for plant biomass production (BP; a, b), plant N acquisition (; c, d), plant N uptake (; e, f) and N export from mycorrhizae to plant (; g, h) from ambient-CO2 simulations and treatments (a, c, e, g) and in response to elevated CO2 (b, d, f, h), which is calculated by Eq. (13a). The simulations are presented as follows: grey – QUINCY without mycorrhizae; orange – QUINCY with decomposing mycorrhizae; blue – QUINCY with saprotrophic mycorrhizae. The line represents the LHS simulation median and shaded areas present the 10 %–90 % quantile range of LHS simulations. Black denotes observations by Finzi et al. (2007) averaged over treatments, with the error bars indicating ±1 SE.
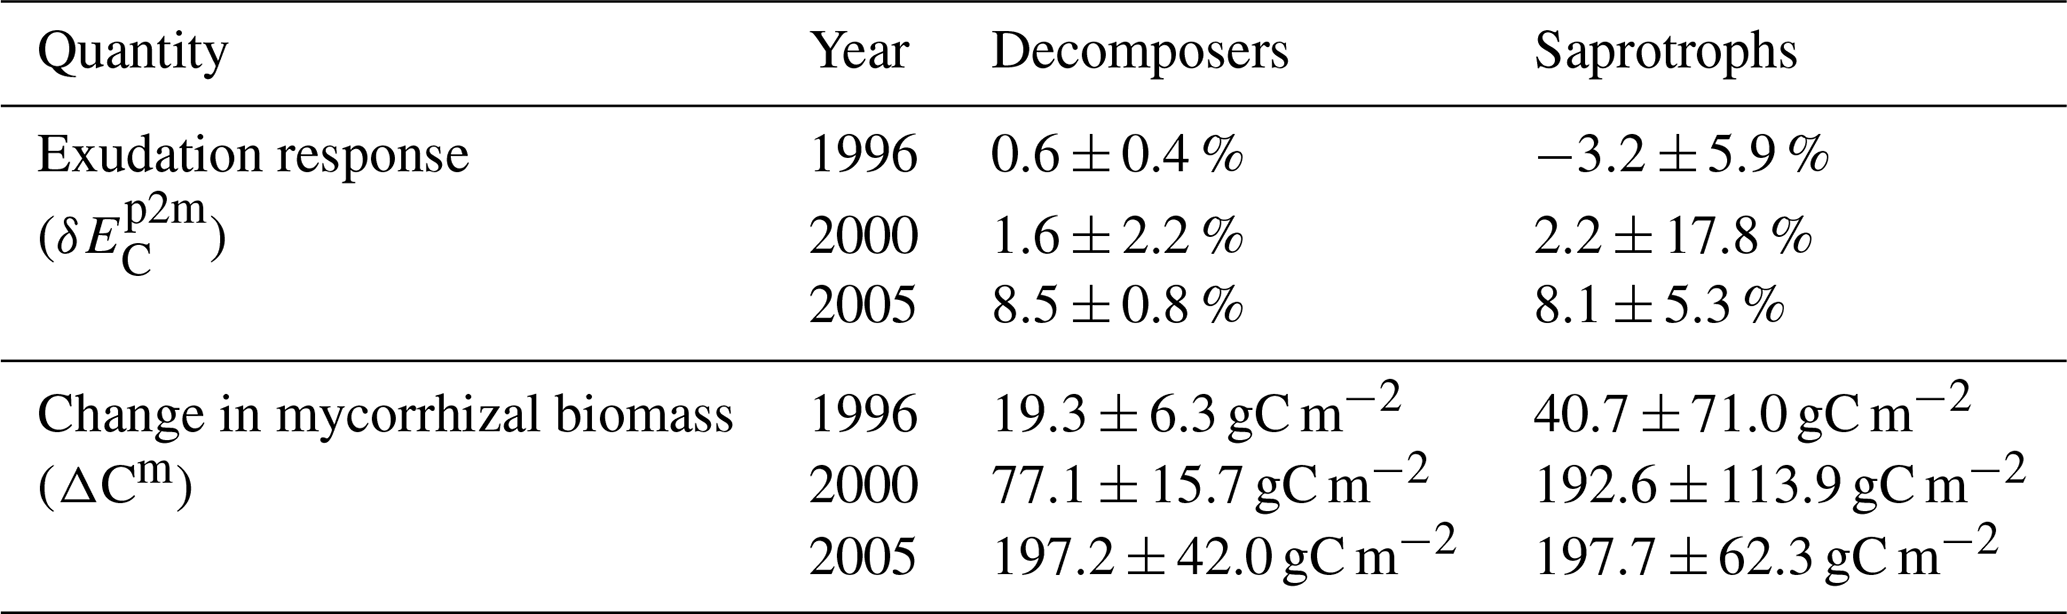
Table 2Change in mycorrhizal growth during the Duke FACE experiment.
Differences in simulated N export rates from mycorrhizae to host plants (ΔEN) under ambient CO2 among mycorrhizal types are caused by differences in total N uptake by mycorrhizae ( in Fig. 5a). Generally, decomposing mycorrhizae take up almost 30 % more N from mineral sources than saprotrophic mycorrhizae ( in Fig. 5c; decomposers: 8.1 ± 0.4 gN m−2 yr−1; saprotrophs: 6.3 ± 0.8 gN m−2 yr−1). However accessing SOM as an N source ( in Fig. 5e; 7.2 ± 1.5 gN m−2 yr−1) allows saprotrophic mycorrhizae to more than double their N uptake, leading to a 66 % higher ambient mycorrhizal N uptake by saprotrophic mycorrhizae than by decomposing mycorrhizae.
Under eCO2, only saprotrophic mycorrhizae can increase their mycorrhizal N uptake significantly (by +23.5 ± 8.5 %), whereas the simulated mycorrhizal N uptake response () is almost zero for the model variant with decomposing mycorrhizae (+1.5 ± 1.5 %; Fig. 5b). This is caused by the greater competition for mineral N under eCO2 by plants and decomposing mycorrhizal fungi, which constrains the eCO2 response of mycorrhizal N uptake from mineral sources by decomposing mycorrhizae and plant N uptake (+4.9 ± 1.6 %) respectively (Figs. 4f, 5d). However, the slight increase in mineral N uptake in response to eCO2, in comparison with the reduced N uptake in the model variant without mycorrhizal fungi, shows the effect of decomposing mycorrhizae on N cycling. Only the strong competition for mineral N then leads to the stronger limitation of plant growth. In contrast, saprotrophic mycorrhizae increase the uptake of both mineral (+5.5 ± 5.8 %) and organic N (+39.8 ± 13.8 %) in response to eCO2 (Fig. 5d, f), resulting in the strong positive overall response of mycorrhizal N uptake that allows saprotrophic mycorrhizae to deliver more N to their host plants (Fig. 4h). The positive response of mycorrhizal N uptake from mineral sources also indicates an increase in mycorrhizal biomass, especially at the beginning of the experiment, which is caused by increased C exudation from plants to mycorrhizal fungi in response to eCO2.
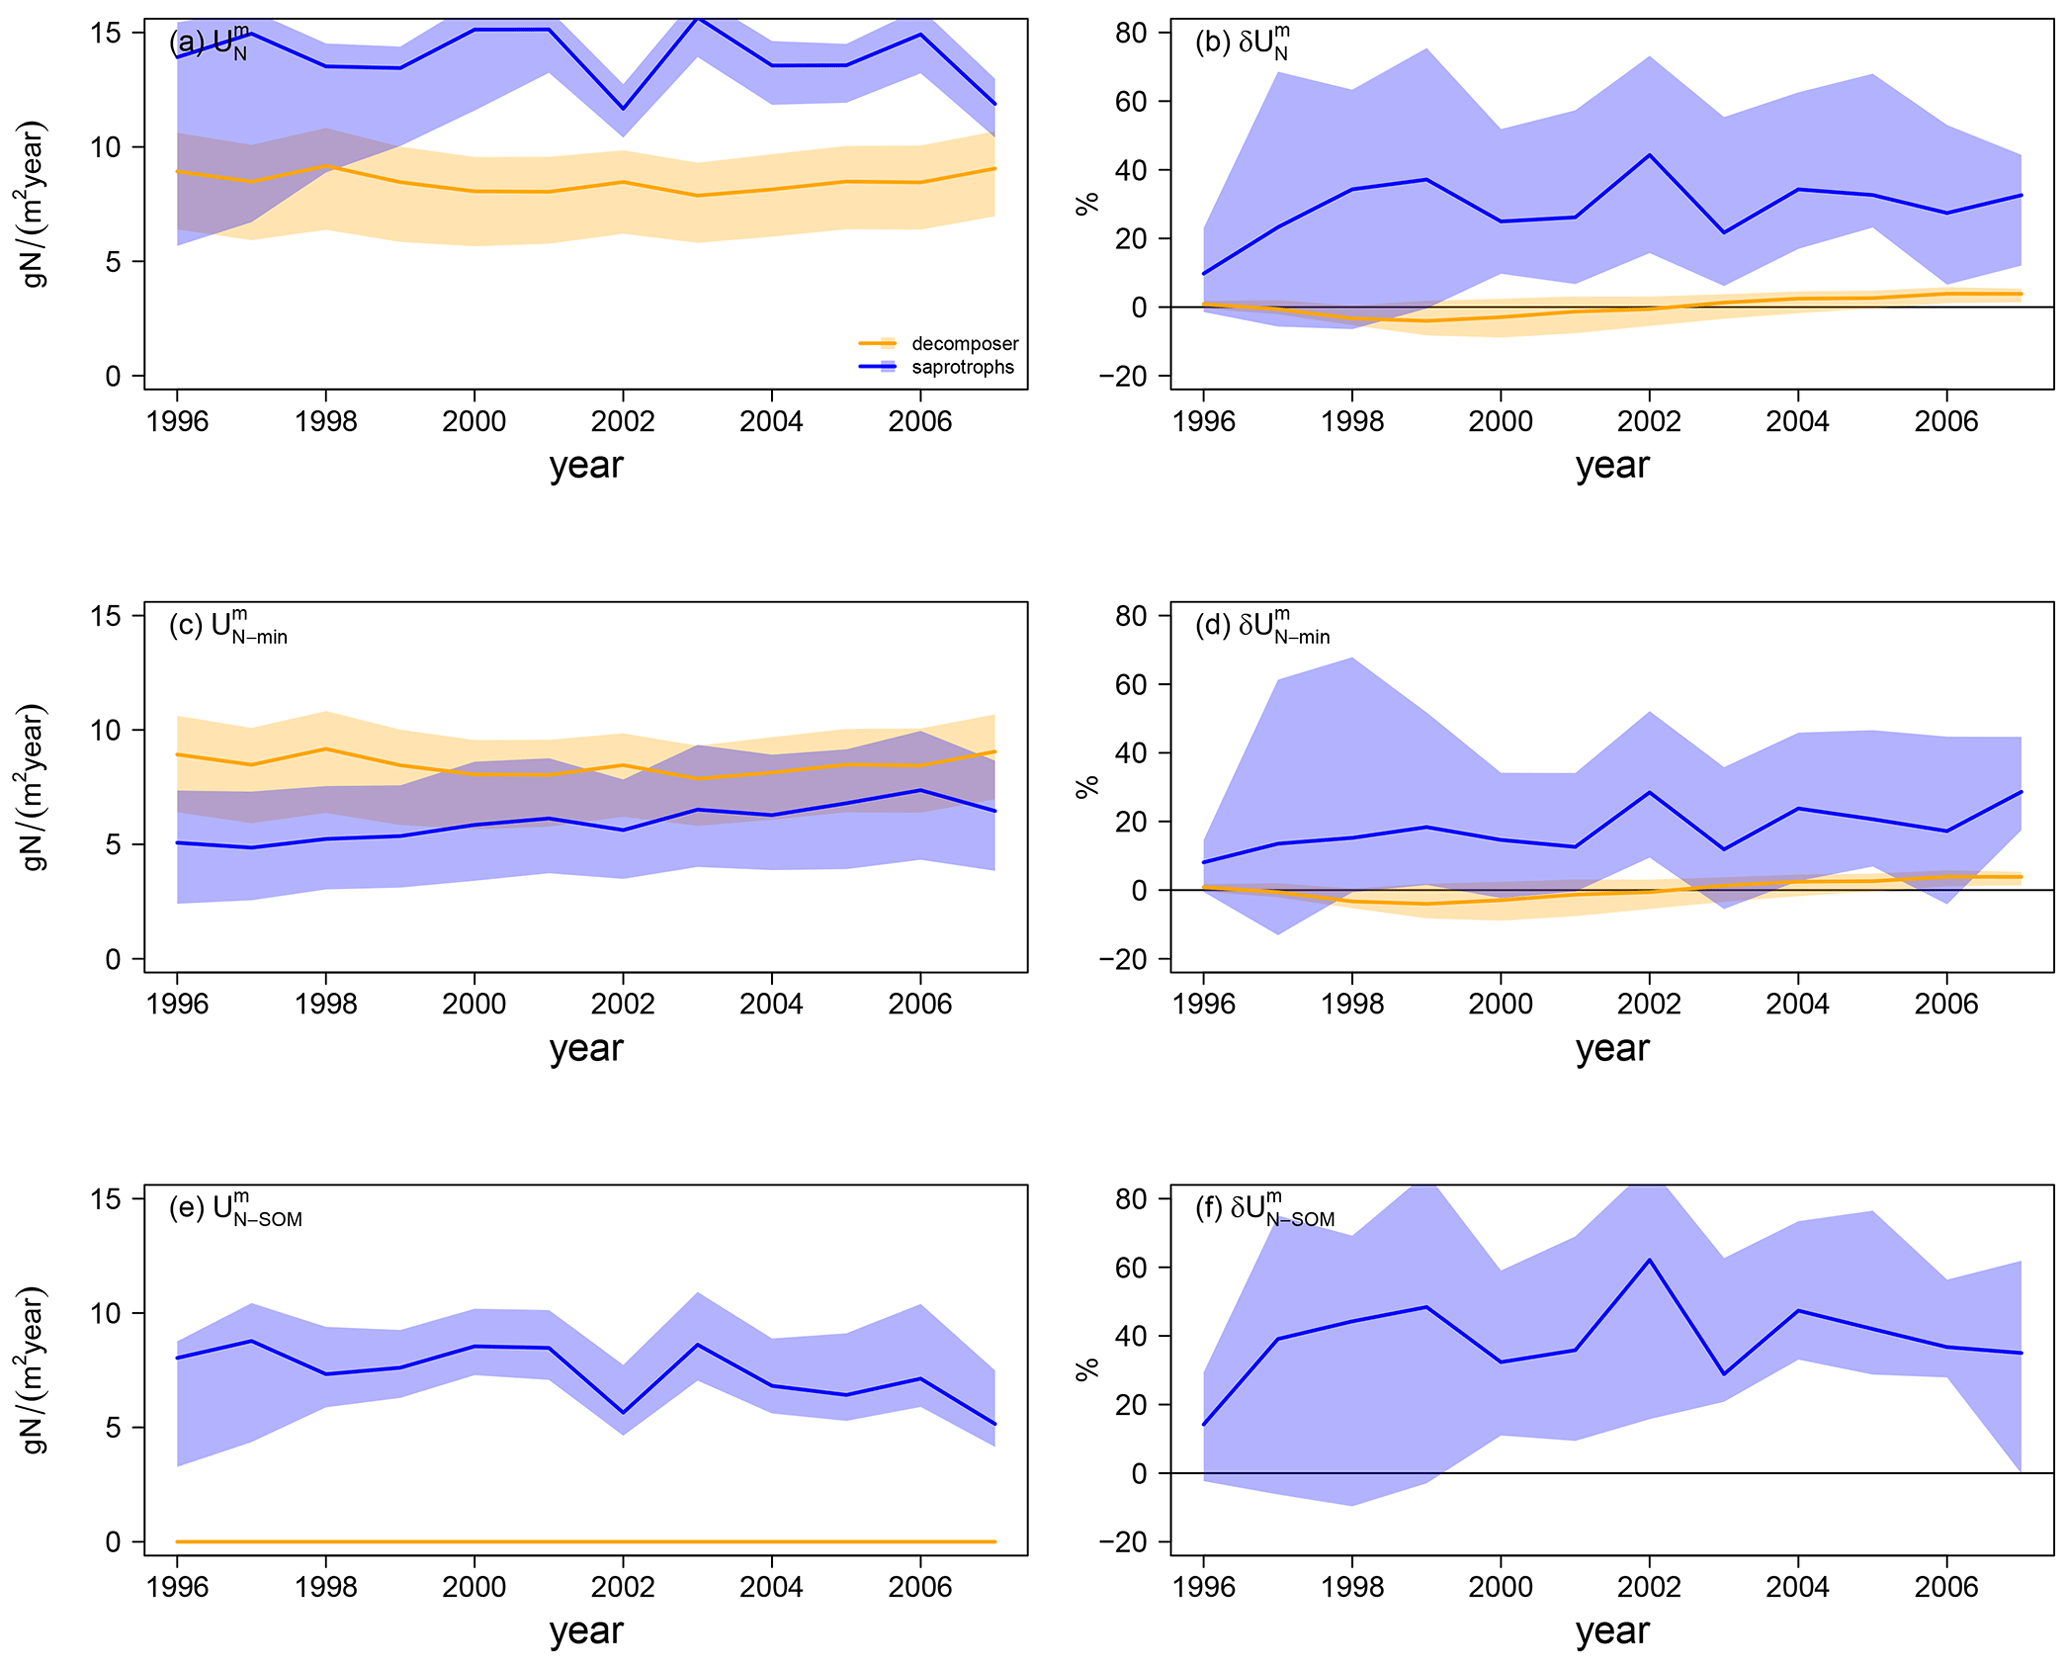
Figure 5Mycorrhizal N uptake simulations for the Duke FACE experiment. Total uptake (; a, b), uptake of mineral N (; c, d), and N uptake from SOM (; e, f) from ambient-CO2 simulations (a, c, e) and in response to elevated CO2 (b, d, f), which is calculated by Eq. (13a). The simulations are presented as follows: orange – QUINCY with decomposing mycorrhizae; blue – QUINCY with saprotrophic mycorrhizae. The line represents the LHS simulation median and shaded areas present the 10 %–90 % quantile range of LHS simulations.
Generally, the model behaviour does not change strongly for either mycorrhizal type if the MYC model parameters are varied by ±10 %. For all analysed time series and responses to eCO2, we find a larger spread among parameter sensitivity simulations for the saprotrophic mycorrhizae than for decomposing mycorrhizae (shaded areas in Figs. 4 and 5). The N efficiency of exudation (i.e. the N gain per unit C that is exuded to mycorrhizal fungi) of saprotrophic mycorrhizae is strongly dependent on their ability to mine N from SOM (Eq. 9), which (in the model) is primarily controlled by the parameter that determines the maximum capacity of organic N uptake per unit mycorrhizal biomass. Increasing can increase the mycorrhizal surplus of N and, thus, the N export of saprotrophic mycorrhizae to plants. This creates a feedback in the model in which an increased return of N increases the amount of C that plants invest in exudation and subsequently also mycorrhizal biomass. Notably, the effect on plant C exudation can be positive (because plants support supportive mycorrhizal fungi) or negative (if mycorrhizal fungi already export enough N to fulfil plant requirements). In contrast, decomposing mycorrhizae always act as competitors for mineral N (Figs. 4e, 5c); thus, plants exude the minimum amount of C required for their N demand. This implies that the modelled magnitude of decomposing mycorrhizae and their effect on plant N nutrition is insensitive to mycorrhizal parameters but mostly controlled by the dynamically varying plant demand.
3.2 Effects on simulated soil dynamics under ambient and elevated CO2
Mycorrhizal fungi also affect soil processes and soil organic C (SOC) stocks, either by taking up and respiring C that was attached to soil organic N in the case of saprotrophic mycorrhizae or by accelerating SOM decomposition in the case of priming mycorrhizae; this caused differences in the amount of SOC and its age during the FACE experiment. Thus, we explore changes in total SOC as well as the δ13C signal of SOM. This gives an indication of (1) how much of the SOC has been accumulated during the experiment in total and (2) the turnover of accumulated C, because a decrease in the δ13C signal of SOM indicates the respiration of younger C and, thus, potentially a faster ecosystem C turnover, as it carries the more negative δ13C signal of artificial fumigation CO2 (Fig. 6a, b).
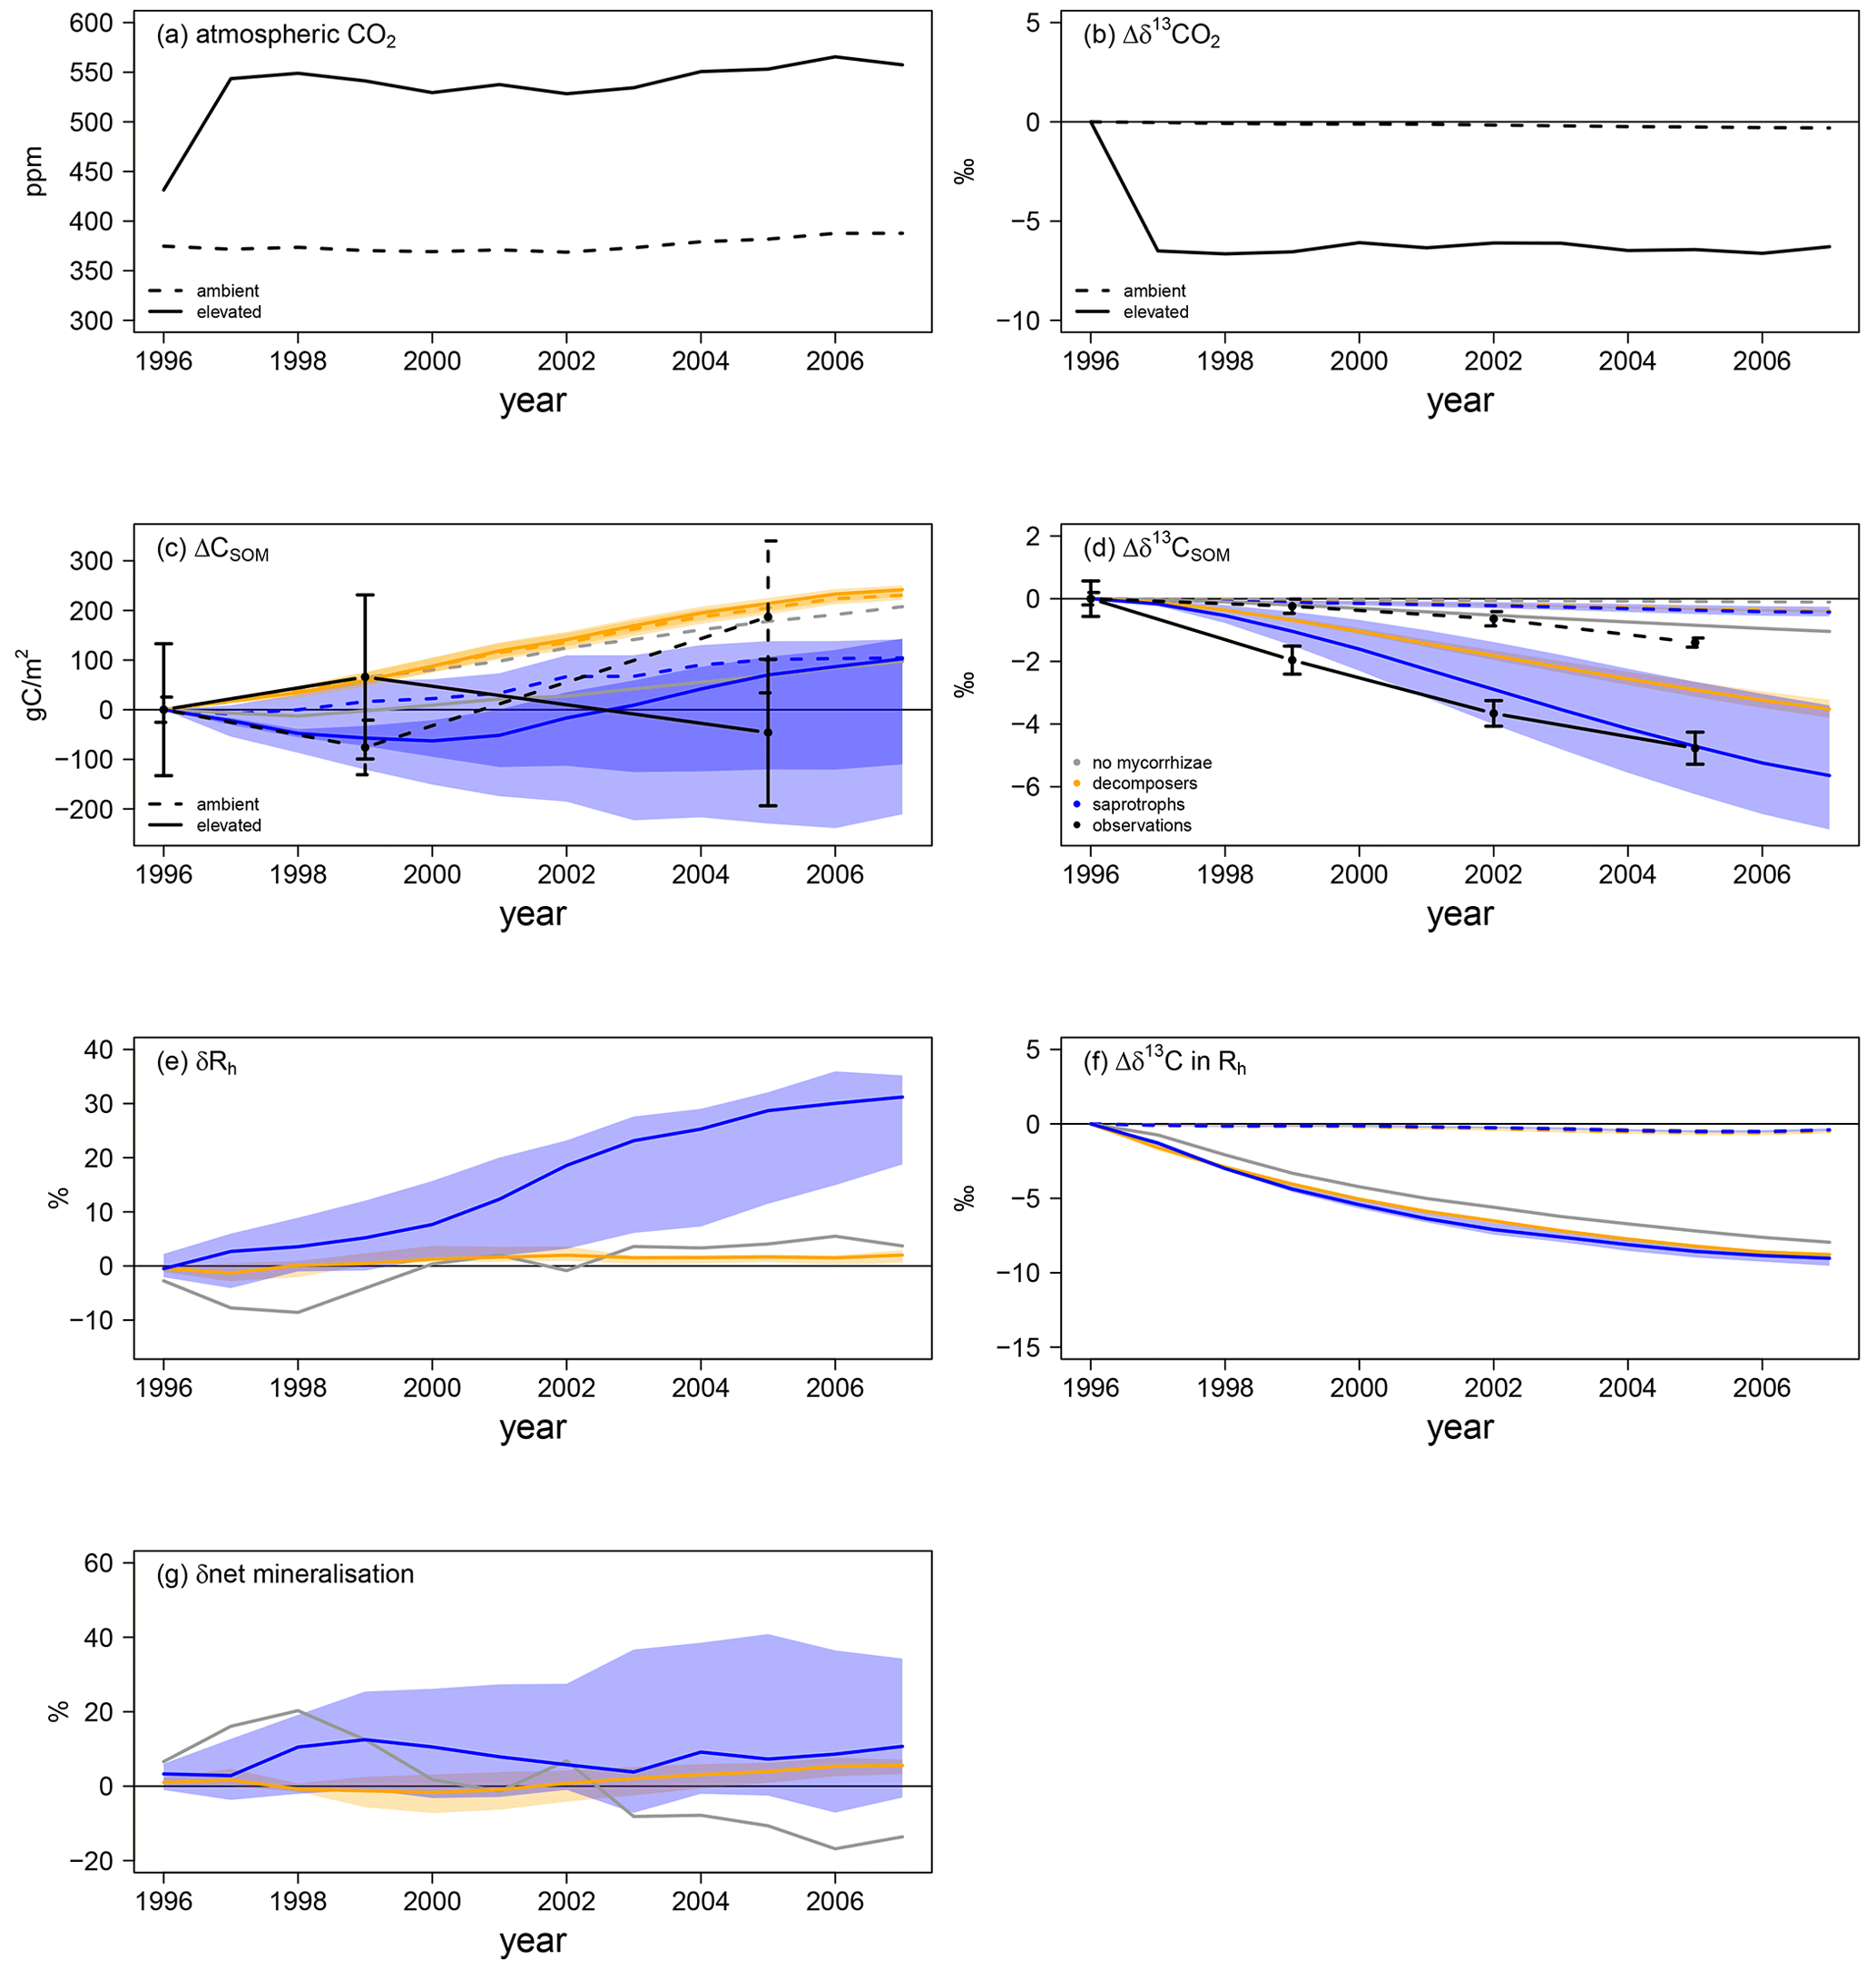
Figure 6Soil C and N dynamics for the Duke FACE experiment. Panels (a) and (b) represent C forcing by the atmospheric CO2 concentration (a) and related δ13C (b) for ambient- and elevated-CO2 simulations. Panels (c)–(g) represent changes in soil-dynamics-related variables from the beginning of the experiment: SOC accumulation (ΔCSOM; c) and changes in the SOM-δ13C (d) responses of heterotrophic respiration and the net mineralisation rate to elevated CO2 (δRh and δnet mineralisation in e and g respectively) and changes in Rh δ13C (f). Absolute changes in δ13C (b), SOC (c), SOM δ13C (d) and Rh δ13C (f) are calculated by Eq. (13b), whereas relative changes in heterotrophic respiration (e) and the net mineralisation rate (g) are calculated by Eq. (13a). Panels (a–d) and (f) show the ambient-CO2 treatment (dashed line) and elevated-CO2 treatment (solid line). Panels (c)–(g) present the simulations: grey – QUINCY without mycorrhizae; orange – QUINCY with decomposing mycorrhizae; blue – QUINCY with saprotrophic mycorrhizae. The line represents the LHS simulation median and the shaded ribbons present the 10 %–90 % quantile range of LHS simulations. Black denotes observations by Lichter et al. (2008), with the error bars indicating ±1 SE.
Observed ambient SOC (SOCa) is increased by 187 gC m−2 from 1996 to 2005, whereas SOC under eCO2 (SOCe) is decreased by 46 gC m−2 (Fig. 6c). Additionally SOCe has a more negative δ13C signal (Fig. 6d), indicating that, even though less SOC is stored, more of this SOC has been created during the experiment. We find a similar pattern for total SOC, i.e. a less strong SOC increase under eCO2 than under aCO2 in the model version without mycorrhizal fungi (ΔSOCa: +136 gC m−2 in 2005; ΔSOCe: +38 gC m−2) and in the version with saprotrophic mycorrhizae (ΔSOCa: +130 gC m−2; ΔSOCe: +24 gC m−2; Fig. 6c). However, both models still suggest an accumulation of SOC over the experimental period, which is contrary to observations. SOC δ13C for the model variant without mycorrhizal fungi shows only a very small response to eCO2 (Δδ13Ca: −0.1 ‰ in 2005; Δδ13Ce: −0.8 ‰), which indicates only minor changes in SOC turnover, whereas the δ13C of SOC in the model variant with saprotrophic mycorrhizae becomes significantly negative (Δδ13Ca: −0.5 ‰; Δδ13Ce: −5.6 ‰). This indicates an accelerated turnover of SOC, which is induced by SOC mining and organic N uptake (Fig. 6d). On the contrary, in the model variant with decomposing mycorrhizae, simulated total SOC evolution from 1996 to 2005 does not differ among CO2 treatments (ΔSOCa: +174 gC m−2; ΔSOCe: +178 gC m−2). This is the consequence of a general tendency of this model variant to allocate below-ground C from plant exudation to mycorrhizal fungi. Although mycorrhizal fungi accelerate SOM decomposition, the effect is too small to prevent an increase in SOCa. SOCe development is similar to SOCa development for the model variant with decomposing mycorrhizae, but the δ13C signal is lower under eCO2 than under aCO2 (Δδ13Ca: −0.3 ‰; Δδ13Ce: −3.7 ‰). This shows again that freshly assimilated CO2 is transferred to the soil via exudation and mycorrhizal fungi and that the turnover of C within the ecosystem becomes faster (Fig. 6c, d).
Concurrent with the accelerated SOC turnover under eCO2 during the experiment, heterotrophic respiration (Rh) is also increased in all model variants (Fig. 6e). In the model variant without mycorrhizal fungi, δRh becomes positive only after 4 years, following the gradual accumulation of SOC (+2.9 ± 1.7 %). The similarity of SOC development under aCO2 and eCO2 gleaned by modelling decomposing mycorrhizae causes a weak response of Rh (+1.0 ± 0.8 %; Fig. 6e, g). However, the response of net N mineralisation to eCO2 increases slightly during the experiment (2.1 ± 1.6 %), suggesting that the decomposing functionality is accelerating soil turnover. While this change is too small to have a strong effect on the vegetation, it still leads to a notable amount of additional mineral N that is taken up by both plants (+4.9 ± 1.6 %; Fig. 4f) and mycorrhizal fungi (1.5 ± 1.5 %; Fig. 5d). Simulated saprotrophic mycorrhizae access SOM as an N source and increase their organic N uptake in response to eCO2 to satisfy their own and plant N demand (Fig. 5f). The model assumes that the mycorrhizae only take up the C associated with amino acids and then respire the remainder of the SOC in order to maintain the SOM C : N ratio (Eq. 10). This parameterisation leads to a strong increase in Rh under eCO2 (+12.3 ± 10.1 %; Fig. 6e), associated with mycorrhizal uptake of N. The SOM decomposition unrelated to mycorrhizae is less affected, resulting in unchanged net N mineralisation (+0.5 ± 3.8 %; Fig. 6g). This is similar to the model variant without any mycorrhizae (−1.3 ± 10.6 %). However, the δ13C signal of Rh is significantly lower when modelling mycorrhizal fungi, resulting from the larger below-ground C flux and faster turnover of mycorrhizal biomass in the soil, in combination with the more negative δ13C of the freshly assimilated C (Fig. 6f).
These results are robust against parameter changes; however, as discussed in the previous section, model simulations show a larger spread among LHS simulations for saprotrophic mycorrhizae. This is due to the sensitivity of the MYC model with saprotrophic mycorrhizae to , which describes the maximum C and N uptake from SOM (Sect. 3.1), and thus directly affects SOC turnover (Eq. 10).
3.3 Effects on ecosystem C storage under ambient and elevated CO2
The linear decomposition method of Rastetter et al. (1992) allows us to better understand the impact of the mycorrhizal parameterisation on the simulated ecosystem dynamics. We attribute the changes in ecosystem C storage under eCO2 to changes in the N cycle induced by mycorrhizae (Fig. 7), namely, (i) a change in total ecosystem N (ΔNEco); (ii) a change in the C : N ratio of vegetation (ΔC:NVeg); (iii) a change in the C : N ratio of SOM (ΔC:NSOM, including mycorrhizal fungi); and (iv) an altered partitioning of N among ecosystem compartments, i.e. between vegetation and SOM ().
We find that ΔNEco is only weakly changed under eCO2 and has only minor effects on ecosystem C storage. This is because none of the model variants change ecosystem N (NEco) gain and the effects on NEco losses are minor.
For the model variant without mycorrhizal fungi, changes in ecosystem C are mainly caused by ΔC:NVeg, which indicates a strong N limitation on plant growth, as increased C input from elevated CO2 cannot be adequately matched by increased N uptake and the model has an insufficient capacity to increase the total below-ground C flux to reduce the excess C uptake (Fig. 7). As a result, the net C uptake response (δNPP) decreases after the initial increase (Fig. 4b).
In the presence of mycorrhizal fungi, the lower attribution of ΔC : NVeg to a change in ecosystem C under eCO2 indicates less N limitation on growth. In the case of the decomposing mycorrhizae, small increases in decomposition due to increased mycorrhizal growth (Table 2) result in only minor changes in soil and vegetation C : N ratios, and they are insufficient to lead to a substantial amount of N transfer from soils to vegetation, thereby leading to a small change in ecosystem C.
The improved N nutrition in the model variant with saprotrophic mycorrhizae that leads to an increase in ecosystem C is caused by a redistribution of N among ecosystem compartments, i.e. between vegetation and soil, due to the mycorrhizal mining of N from SOM and the ensuing export of this N to vegetation ( in Fig. 7). As vegetation C : N ratios are more than 3 times higher than soil C : N ratios (Kattge et al., 2011; Parton et al., 1993), a redistribution of N from soil to vegetation allows vegetation to incorporate much more additional C, thereby exceeding the relative losses that are caused by the loss of SOM N.
As for vegetation and soil compartments individually (Sect. 3.1 and 3.2), the results are robust against parameter variations; this supports the meaning of our findings, especially when focusing on ecosystem responses to eCO2.
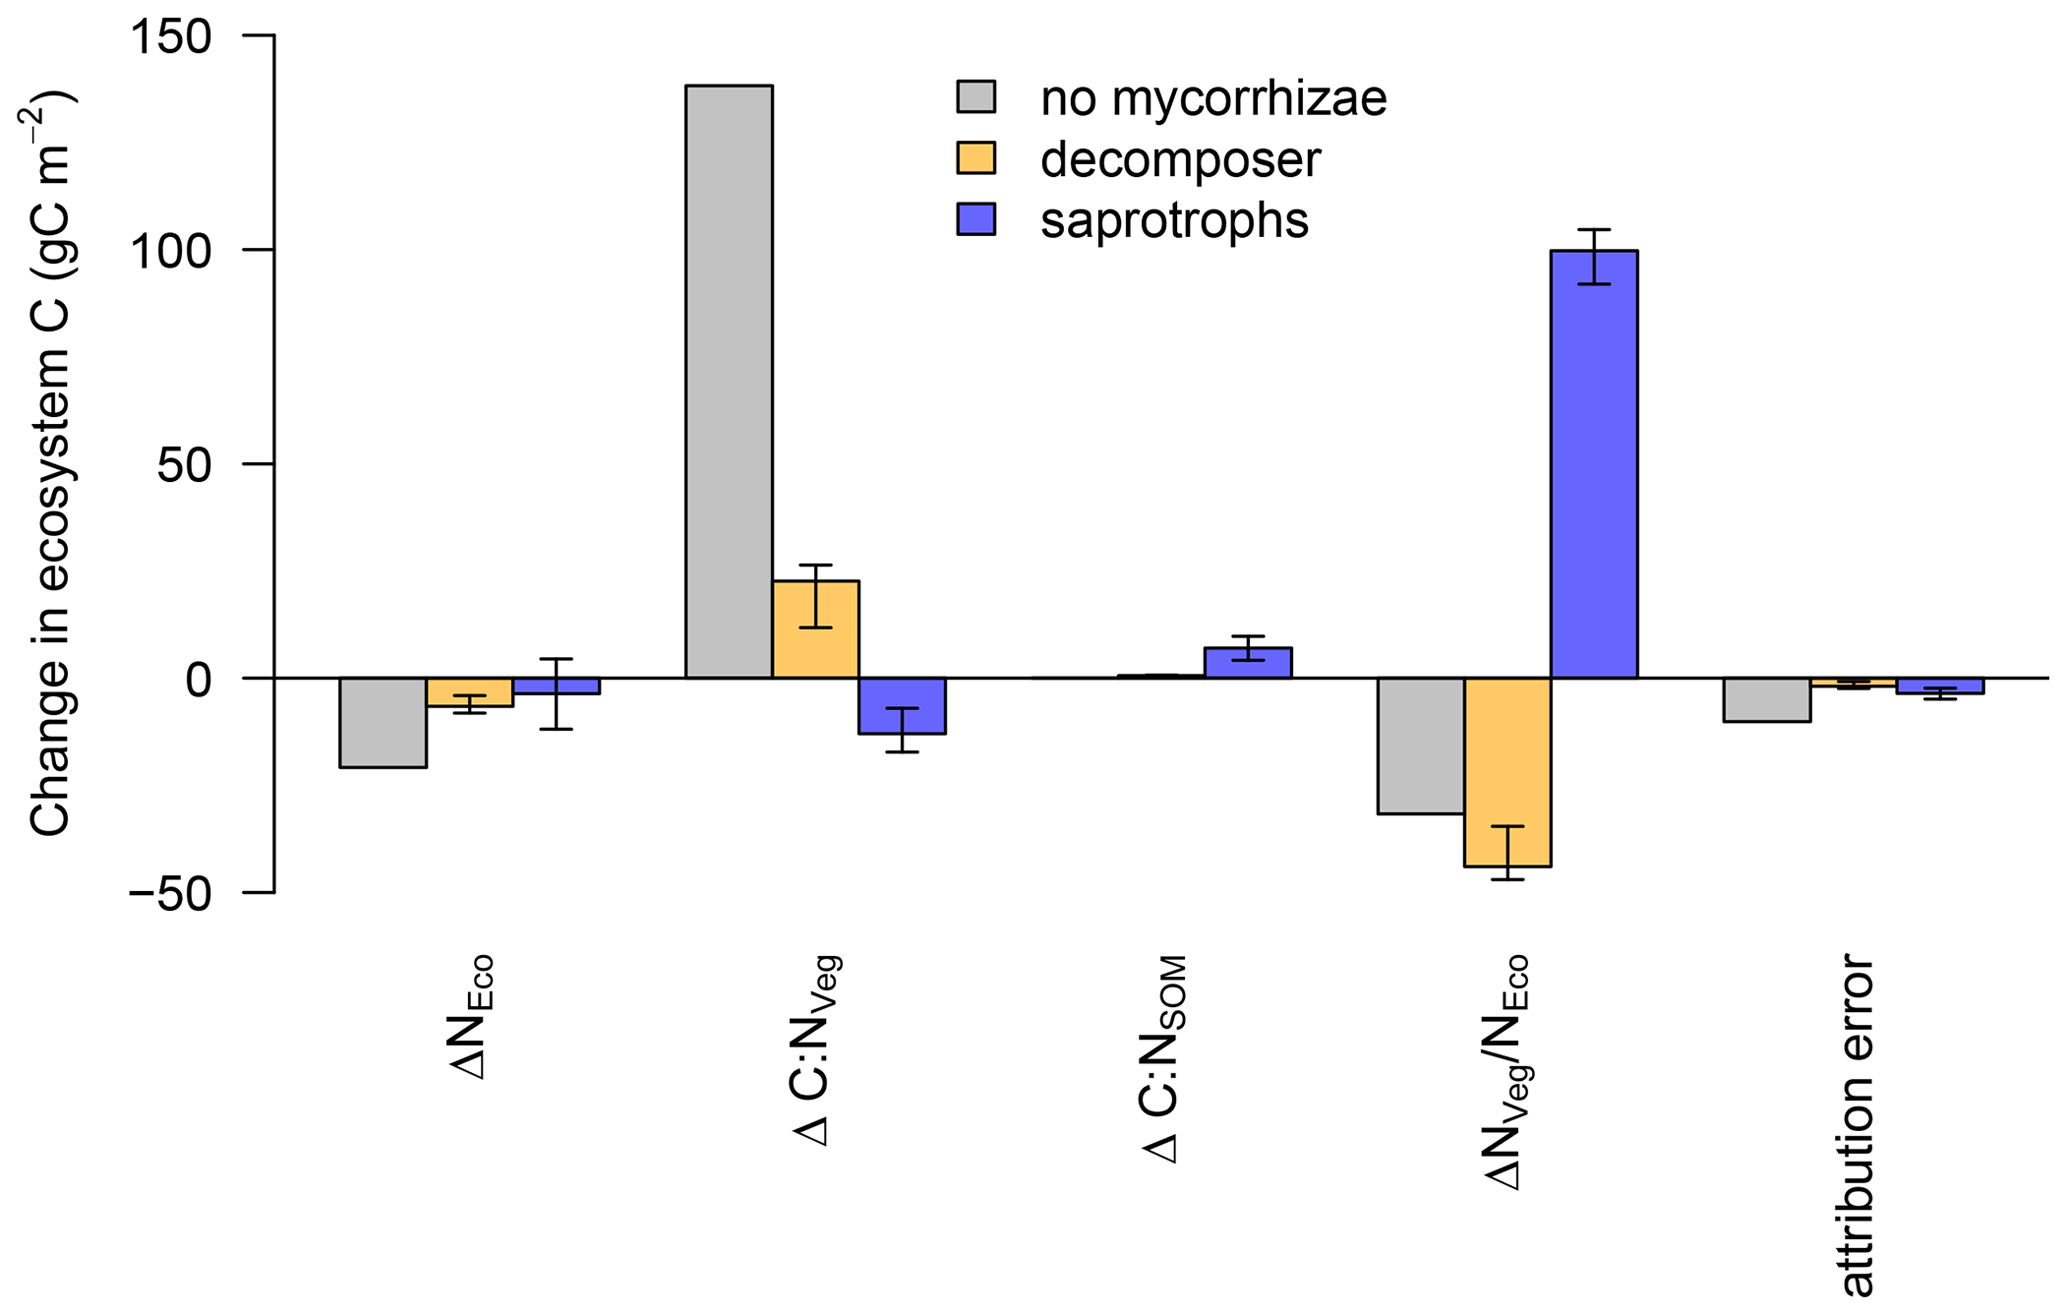
Figure 7Attribution of the simulated change in ecosystem N (ΔNEco), vegetation C : N (ΔC : NVeg), soil C : N (ΔC : NSOM) and ecosystem N distribution () to the simulated change in ecosystem C under elevated CO2 for the model without mycorrhizal fungi (grey), with decomposing mycorrhizal fungi (orange) and with saprotrophic mycorrhizal fungi (blue). Bar heights indicate the median of the attributions and error bars indicate the 10 % and 90 % quantile spread among the LHS simulations.
4.1 Representation of alternative mycorrhizal functional groups
We integrated a dynamic plant–mycorrhiza–soil (MYC) model in the QUINCY TBM to test plausible but parsimonious representations of mycorrhizal effects on ecosystem fluxes based on observational findings. To do so, we incorporated observed mycorrhizal functionalities but did not link them to mycorrhizal types, i.e. arbuscular mycorrhizae (AMs) and ectomycorrhizae (ECMs), nor to their potential ecosystem functioning, owing to contrasting observations and limited knowledge. This is contrary to other modelling studies that have differentiated between AMs and ECMs and linked their proposed effects on plant nutrition to the simulated host plants (e.g. Phillips et al., 2013; Brzostek et al., 2014; Sulman et al., 2014). The advantage of our approach is that it allows us to assess potential generic effects of mycorrhizal dynamics on simulated ecosystems independently of plant species or any prior knowledge of species associations. We also tested the effect of mycorrhizal fungi that only access mineral N in soil (results not shown), which is similar to what plant fine roots do, but the results did not differ from the model version without mycorrhizae, indicating that mycorrhiza–SOM interactions are the key to explaining their significance for plant nutrient nutrition.
We assessed the possible importance of mycorrhizal fungi to predict the future evolution of terrestrial carbon stores under elevated CO2.
We found that only the model variant with saprotrophic mycorrhizae, in which mycorrhizae can directly access organic N bound in SOM, was able to simulate the observed growth response to eCO2 and the underlying change in plant N acquisition consistent with observation-derived estimates from Finzi et al. (2007). The model without mycorrhizae was capable of simulating the observed increase in growth. However, this occurred only because of an overly strong increase in the C : N stoichiometry (Caldararu et al., 2020) and, thus, the nutrient use efficiency of growth, compared with simulations using other TBMs reported in Zaehle et al. (2014). This suggests that the direct access to SOM as an N source is the key feature missing in TBMs when simulating Duke FACE. This result does not provide evidence of a general mycorrhizal saprotrophic or, at least, SOM-mining behaviour, but it does demonstrate that different N uptake strategies need to be explored to improve future projections of ecosystem models. Our study indicates a strong need for both further modelling and experimental research on mycorrhizae, especially as our findings are clearly limited by the use of only one testing site. However, CO2 experiments with this wealth of available data are rare, which is why we decided to use only the Duke FACE site and to extend our analysis to multiple observation streams available at that site, i.e. above-ground biomass observations as well as soil C measurements; due to the multiple ongoing FACE experiments in a variety of ecosystems, our analysis could be extended in the future (e.g. EucFACE, Drake et al., 2016, or BIFoR FACE, MacKenzie et al., 2021).
The model variant in which mycorrhizae do not have direct access to organic N but induce an acceleration of SOM decomposition/priming was unable to reproduce either the observed growth or N acquisition response and predicted progressive N limitation. This result occurred because, on the simulated timescale, the implicit treatment of mycorrhizal effects on SOM decomposition did not provide enough N for the plants, as mycorrhizal fungi, which are more efficient at taking up mineral N, hindered increased N export to plants because they required the additional available N to support their own N demand. This turns the decomposing mycorrhizal fungi into competitors, not facilitators, with respect to N in the short-term and, consequently, results in increased N limitation to plant growth, despite the simulated acceleration of SOM decomposition and net N mineralisation under eCO2. However, the set-up of FACE studies, especially their rapid CO2 enhancement, is artificial, and the observation period is rather short. Therefore, the results presented here may not represent the current environmental change as well as a full adjustment of the observed ecosystem to the change. On longer timescales, the decomposing functionality may work to improve N nutrition of plants successfully.
Furthermore, our analysis clearly showed that the exudation of freshly assimilated C to any mycorrhizal fungi is necessary to explain the observed changes in the δ13C signal in SOC (Lichter et al., 2008). This shows that changes in soil C stocks can only be simulated correctly when models include a form of C exudation to the soil.
4.2 MYC model simplifications and assumptions
4.2.1 MYC model limitations due to observational constraints
The MYC model contains 17 parameters. In total, 13 of these belong to both functionalities, and they control the plant–mycorrhiza interactions (e.g. C export to mycorrhiza) and general mycorrhizal dynamics (e.g. mycorrhizal stoichiometry and biomass turnover). Two parameters each describe the mycorrhizal effects on SOM specific to each functionality. We found observation-based estimates for only five parameters (Table 1). This lack of suitable data is caused by the large difficulties involved with measuring within the rhizosphere without destroying plant–mycorrhiza symbioses (Savage et al., 2018; Vicca et al., 2018; Lang et al., 2021), and it obviously limits the ability to constrain the MYC model. Nevertheless, fluxes within the MYC model, which describe mycorrhizal C and N exchange with host plants and soil, are reasonably robust against changes in parameter values under unperturbed conditions (Figs. 4, 5, 6). This provides some justification to circumvent the explicit representation of mycorrhizae and instead rely on the use of plant root measurements, i.e. plant fine-root biomass or plant C allocation into fine-root growth, as proxy for mycorrhizal biomass or C transfer from the host plant to fungi. However, the resulting systematic underestimation of simulated flux responses to eCO2 clearly points to the need to represent mycorrhizae and, thus, also observational data on mycorrhizal fungi. Our study reveals that the organic N uptake capacity () needs to be better constrained, in particular for saprotrophic mycorrhizae. Even small variations in affect the ability of mycorrhizae to export N to host plants, which feeds back to plant C exudation (Fig. 3, Eq. A3). Consequently, the MYC model is highly sensitive to when modelling saprotrophic mycorrhizae. The most important unknown parameters in the representation of decomposing mycorrhizae are the mycorrhiza-induced decomposition acceleration and the general decelerated soil turnover ( and ). As these factors do not affect plant–mycorrhiza interactions directly, the MYC model itself is less sensitive to variations, which leads to small variations among LHS simulations, but the combination strongly affects the ecosystem dynamics by potentially degrading almost all SOM.
4.2.2 MYC model limitations due to model constraints
In its current version, the MYC model does not consider P and water supply by mycorrhizal fungi, and QUINCY neglects mycorrhizal biomass in plant leaf-to-root ratio calculations, which not only ensures a certain ratio of C to nutrient acquisition but also plant physical stability. Consequently, QUINCY plants grow roots in order to fulfil physiological and physical requirements that also take up N and make mycorrhizae potentially redundant for plant N acquisition. Therefore, the inclusion of mycorrhizal fungi to P and water supply and to plant leaf-to-root ratio calculations would potentially intensify the meaning of mycorrhizal fungi for host plants and probably reduce uncertainty, especially under changing environmental conditions.
Furthermore, the MYC model assumes that mycorrhizal fungi are independent of the PFT and growth state of the host plants, as long as the plants exude sufficient amounts of C, which does not explicitly vary across PFTs in the current form of the model. This is, due to our approach to include mycorrhizal functionalities and test those, instead of including mycorrhizal types, which one could link to PFTs. Having said that, the plant type and growth state can indirectly affect mycorrhizal function via the extent of N limitation and C available for exudation.
The representation of the SOM as a pool with a homogeneous C : N ratio and chemical properties in QUINCY is a conceptual problem in most state-of-the-art TBMs. In reality, SOM is not a homogeneous pool; rather, it is a complex mixture of substrates with varying C : N ratios, microbial accessibility and decomposability. Describing this variability with only two pools is a major limitation and is particularly problematic for modelling SOM-mining mycorrhizae. As the C : N ratio of the slow SOM pool has to be maintained in the model, uptake of organic N requires a loss of SOC, either through respiration or via incorporation into mycorrhizal biomass through the carbon contained in amino acids as well as other substances. Even if saprotrophic behaviour is occasionally observed (Wu et al., 2005; Treseder et al., 2007), most mycorrhizae solely rely on plant C supply and lack saprotrophic abilities (Lindahl and Tunlid, 2015; Frey, 2019). Employing a more sophisticated representation of soil organic material and its composition and dynamics using more physically based pool structures, stabilisation mechanisms and the dependence of decomposition on microbial activity would be a pathway towards a more accurate and mechanistic modelling of organic N uptake from soils (Wutzler et al., 2017; Kyker-Snowman et al., 2020; Wang et al., 2020; Yu et al., 2020).
4.3 Outlook: possible incorporation of mycorrhizal fungi into TBMs
An increasing number of studies show that mycorrhizal fungi are an important factor for understanding vegetation–soil interactions and soil dynamics as well as for predicting plant responses to elevated CO2 (e.g. Cheng et al., 2012; Terrer et al., 2018; Shi et al., 2019; Jiang et al., 2020; Braghiere et al., 2022). Our study underlines the importance of considering mycorrhizal fungi in ecosystem models to explain the observed responses of plant N acquisition under eCO2. Additionally, we show the importance of active plant C exudation to the rhizosphere in order to liberate N from SOM, which allows us to successfully reproduce observed changes in SOC δ13C.
Generally, the effects of mycorrhizal fungi on ambient simulations are minor, but the improved eCO2 simulations suggest that our MYC model can better represent plant control on N acquisition than previous approaches under future conditions. A plant-controlled short-cut of the terrestrial N cycle by accessing SOM as nutrient source is important for reproducing observed responses to eCO2; thus, this indicates the necessity to incorporate the effects of mycorrhizal fungi on SOM decomposition and plant nutrition into TBMs. However, the addition of any new process into the model always comes with the problems of added complexity, an increased number of parameters and the possibility of equifinality. Particularly given the few available data on mycorrhizae, their inclusion into TBMs can lead to increased uncertainty.
One possible solution would be an implicit formulation of mycorrhizal function in the form of active plant C investment into rhizosphere processes that liberate N from SOM, commonly known as plant priming through root exudates. As we show that the interaction with SOM has the biggest effect on model predictions of the ecosystem response under elevated CO2, this may in itself improve the representation of plant N acquisition; thus, it has the potential to reduce current uncertainty in modelled future land C uptake. A similar approach has been tested by Fisher et al. (2010), who included organic N uptake in their model.
Another approach to circumvent the problem of too few data could be exploratory modelling studies, where the MYC model with its default parameters is applied globally to qualitatively evaluate the expected effects in scenarios with rising CO2 (Braghiere et al., 2021). Given the robustness of the MYC model against parameter variations, which we have tested using LHS, we assume that the MYC model would perform well globally. However, we realise that a number of parameters will likely differ with variables such as PFT, soil type and climate; therefore, the quantitative result of such a model experiment would suffer from additional uncertainty given the lack of a suitable source of information for parameters and their global scaling (Braghiere et al., 2022), but the trends and patterns could be a road map for future modelling and data collection.
At the site scale, the inclusion of P acquisition into the MYC model could help to better understand the underlying dynamics and reduce uncertainties, as this would allow us to test the MYC model at P-limited sites or at sites that are both N- and P-limited and, thus, increase the amount of suitable testing sites. We are planning this for future studies.
Here, we implemented a novel representation of mycorrhizal fungi into the QUINCY terrestrial biosphere model by representing mycorrhizal functionalities rather that taxonomic differences. We show that, while it does little to improve predictions under ambient conditions, the MYC model improves our predictions under elevated CO2, most strikingly in the model variant that represents mycorrhizal interactions with soil organic matter. Our study highlights the importance of improving the representation of plant nutrient acquisition strategies in models to improve future predictions of plant growth responses under increased atmospheric CO2 levels as well as the importance of crucial data needed to parameterise and validate such models.
A1 Plant C exudation to mycorrhizal fungi
C exudation () from the host plant to mycorrhizal fungi is constrained by the following, as per the concepts of MYCOFON (Meyer et al., 2010):
-
the amount of available C, which is freshly assimilated C through photosynthesis (Eq. A2);
-
plant N demand, where increasing N demand increases C allocation to mycorrhizal growth (Eq. A3a);
-
an interaction term that allows for a decline in exudation if plants do not receive nutrients in return, which could happen either in the case of satisfied demand by plants or in the case of severe N limitation, thereby turning mycorrhizal fungi into competitors that do not deliver any N to host plants;
-
a minimum and maximum amount of mycorrhizae compared with plant fine roots, to avoid complete mycorrhizal death and to prevent plants overspending C.
C exudation can be defined as follows:
where fm2r,min is a parameter for the minimal amount of mycorrhizae compared with plant fine roots, is plant fine-root biomass, Cm is mycorrhizal biomass and is the maximum exudation.
We determine the maximum exudation rate using available C as well as the optimal ratio between mycorrhizae and fine roots under current conditions.
where is the maximum share of available C that plants can allocate to mycorrhizal fungi, describes the available C, and fm2r,opt is the optimal ratio between mycorrhizal biomass and plant fine-root biomass.
We restrict the optimal ratio between mycorrhizal biomass and fine-root biomass using a minimal and a maximal ratio and then scale it by plant N demand and mycorrhizal N support. Plant N demand and mycorrhizal N support are used to represent current environmental conditions, which drive plant–mycorrhiza interactions, as plant N demand depends on the plant C uptake by photosynthesis, which is linked to stand-related conditions, such as plant type, successional stage, growing season and atmospheric conditions, and on N availability, which is linked to soil properties and is also depicted by mycorrhizal N support.
Here, fm2r,min and fm2r,max are parameters describing the minimal and maximal ratio between mycorrhizal biomass and plant fine-root biomass. and ηN are scaling factors between zero and one to describe plant N demand and N support by mycorrhizae respectively. Support is derived from mycorrhizal N export () and an infinitesimal small number (ϵ) to stop C exudation, in the case that plants do not benefit from mycorrhizae over a time period of a month, to technically ensure numerical stability.
The scientific part of the code is available under a GPL v3 license. The scientific code of QUINCY relies on software infrastructure from the MPI-ESM environment, which is subject to the MPI-M License Agreement in its most recent form (https://www.bgc-jena.mpg.de/en/bsi/projects/quincy/software, last access: 19 March 2024). The source code is available online https://doi.org/10.17871/quincy-model-2019, release 05 (last access: 18 March 2024, Thurner et al., 2023), but its access is restricted to registered users. Readers interested in running the model should request a username and password from the corresponding author or via the Git repository. Model users are strongly encouraged to follow the fair-use policy: https://www.bgc-jena.mpg.de/en/bsi/projects/quincy/software. The forcing data to run the model are stored in the model repository.
MAT and SZ designed the study and performed the analyses. MAT developed the model. MAT, SC and SZ interpreted the results. JE helped with model implementation. All authors contributed to writing the manuscript.
At least one of the (co-)authors is a member of the editorial board of Biogeosciences. The peer-review process was guided by an independent editor, and the authors also have no other competing interests to declare.
Publisher’s note: Copernicus Publications remains neutral with regard to jurisdictional claims made in the text, published maps, institutional affiliations, or any other geographical representation in this paper. While Copernicus Publications makes every effort to include appropriate place names, the final responsibility lies with the authors.
The authors are grateful to the editor and the two reviewers, whose comments greatly improved the manuscript.
This work was supported by the European Research Council (ERC) under the European Union's Horizon 2020 Research and Innovation programme (QUINCY; grant no. 647204) and by the European Cooperation in Science and Technology (COST) within action no. ES1308 (ClimMani; grant no. ES1308 – 39449).
The article processing charges for this open-access publication were covered by the Max Planck Society.
This paper was edited by David McLagan and reviewed by Joshua Fisher and one anonymous referee.
Allen, M., Swenson, W., Querejeta, J., Egerton-Warburton, L., and Treseder, K.: Ecology of mycorrhizae: a conceptual framework for complex interactions among plants and fungi, Annu. Rev. Phytopathol., 41, 271–303, 2003. a
Ames, R., Reid, C., Porter, L., and Cambardella, C.: Hyphal uptake and transport of nitrogen from two 15N-labelled sources by Glomus mosseae, a vesicular-arbuscular mycorrhizal fungus, New Phytol., 95, 381–396, 1983. a
Braghiere, R. K., Fisher, J. B., Fisher, R. A., Shi, M., Steidinger, B., Sulman, B. N., Soudzilovskaia, N. A., Yang, X., Liang, J., Peay, K. G., Crowther, T. W., and Phillips, R. P.: Mycorrhizal distributions impact global patterns of carbon and nutrient cycling, Geophys. Res. Lett., 48, e2021GL094514, https://doi.org/10.1029/2021GL094514, 2021. a
Braghiere, R. K., Fisher, J., Fisher, R. A., Shi, M., Steidinger, B. N., Sulman, B. N., Soudzilovskaia, N., Yang, X., Liang, J., Peay, K. G., Crowther, T. W., and Phillips, R. P.: Climate change impacts on mycorrhizae amplify nitrogen limitation on global plant growth, Authorea [preprint], https://doi.org/10.1029/2021GL094514, 2022. a, b
Brzostek, E., Rebel, K., Smith, K., and Phillips, R.: Integrating mycorrhizas into global scale models: A journey toward relevance in the earth’s climate system, in: Mycorrhizal mediation of soil, edited by: Johnson, N. C., Gehring, C., and Jansa, J., 479–499, Elsevier, https://doi.org/10.1016/B978-0-12-804312-7.00026-7, 2017. a, b
Brzostek, E. R., Fisher, J. B., and Phillips, R. P.: Modeling the carbon cost of plant nitrogen acquisition: Mycorrhizal trade-offs and multipath resistance uptake improve predictions of retranslocation, J. Geophys. Res.-Biogeo., 119, 1684–1697, 2014. a, b
Brzostek, E. R., Dragoni, D., Brown, Z. A., and Phillips, R. P.: Mycorrhizal type determines the magnitude and direction of root-induced changes in decomposition in a temperate forest, New Phytol., 206, 1274–1282, 2015. a
Caldararu, S., Thum, T., Yu, L., and Zaehle, S.: Whole-plant optimality predicts changes in leaf nitrogen under variable CO2 and nutrient availability, New Phytol., 225, 2331–2346, 2020. a
Chapman, S. K., Langley, J. A., Hart, S. C., and Koch, G. W.: Plants actively control nitrogen cycling: uncorking the microbial bottleneck, New Phytol., 169, 27–34, 2006. a, b
Cheng, L., Booker, F. L., Tu, C., Burkey, K. O., Zhou, L., Shew, H. D., Rufty, T. W., and Hu, S.: Arbuscular mycorrhizal fungi increase organic carbon decomposition under elevated CO2, Science, 337, 1084–1087, 2012. a, b, c
Ciais, P., Sabine, C., Bala, G., Bopp, L., Brovkin, V., Canadell, J., Chhabra, A., DeFries, R., Galloway, J., Heimann, M., and Jones, C.: Carbon and other biogeochemical cycles, in: Climate change 2013: the physical science basis. Contribution of Working Group I to the Fifth Assessment Report of the Intergovernmental Panel on Climate Change, Cambridge University Press, 465–570, 2014. a
Corrales, A., Henkel, T. W., and Smith, M. E.: Ectomycorrhizal associations in the tropics–biogeography, diversity patterns and ecosystem roles, New Phytol., 220, 1076–1091, 2018. a
Deckmyn, G., Campioli, M., Muys, B., and Kraigher, H.: Simulating C cycles in forest soils: Including the active role of micro-organisms in the ANAFORE forest model, Ecol. Model., 222, 1972–1985, 2011. a
Drake, J. E., Macdonald, C. A., Tjoelker, M. G., Crous, K. Y., Gimeno, T. E., Singh, B. K., Reich, P. B., Anderson, I. C., and Ellsworth, D. S.: Short-term carbon cycling responses of a mature eucalypt woodland to gradual stepwise enrichment of atmospheric CO2 concentration, Glob. Change Biol., 22, 380–390, 2016. a
Ek, H., Andersson, S., and Söderström, B.: Carbon and nitrogen flow in silver birch and Norway spruce connected by a common mycorrhizal mycelium, Mycorrhiza, 6, 465–467, 1997. a
Finlay, R. D.: Ecological aspects of mycorrhizal symbiosis: with special emphasis on the functional diversity of interactions involving the extraradical mycelium, J. Exp. Bot., 59, 1115–1126, 2008. a
Finzi, A. C., Norby, R. J., Calfapietra, C., Gallet-Budynek, A., Gielen, B., Holmes, W. E., Hoosbeek, M. R., Iversen, C. M., Jackson, R. B., Kubiske, M. E., and Ledford, J.: Increases in nitrogen uptake rather than nitrogen-use efficiency support higher rates of temperate forest productivity under elevated CO2, P. Natl. Acad Sci. USA, 104, 14014–14019, 2007. a, b, c
Fisher, J., Sitch, S., Malhi, Y., Fisher, R., Huntingford, C., and Tan, S.-Y.: Carbon cost of plant nitrogen acquisition: A mechanistic, globally applicable model of plant nitrogen uptake, retranslocation, and fixation, Glob. Biogeochem. Cy., 24, GB1014, https://doi.org/10.1029/2009GB003621, 2010. a
Fleischer, K., Rammig, A., De Kauwe, M. G., Walker, A. P., Domingues, T. F., Fuchslueger, L., Garcia, S., Goll, D. S., Grandis, A., Jiang, M., and Haverd, V.: Amazon forest response to CO2 fertilization dependent on plant phosphorus acquisition, Nat. Geosci., 12, 736–741, 2019. a
Franklin, O., Näsholm, T., Högberg, P., and Högberg, M. N.: Forests trapped in nitrogen limitation – an ecological market perspective on ectomycorrhizal symbiosis, New Phytol., 203, 657–666, 2014. a
Frey, S. D.: Mycorrhizal Fungi as Mediators of Soil Organic Matter Dynamics, Annu. Rev. Ecol. Evol. S., 50, 237–259, 2019. a, b, c, d
Godbold, D. L., Hoosbeek, M. R., Lukac, M., Cotrufo, M. F., Janssens, I. A., Ceulemans, R., Polle, A., Velthorst, E. J., Scarascia-Mugnozza, G., De Angelis, P., and Miglietta, F.: Mycorrhizal hyphal turnover as a dominant process for carbon input into soil organic matter, Plant Soil, 281, 15–24, 2006. a
Göransson, H., Wallander, H., Ingerslev, M., and Rosengren, U.: Estimating the relative nutrient uptake from different soil depths in Quercus robur, Fagus sylvatica and Picea abies, Plant Soil, 286, 87–97, 2006. a, b
Gorka, S., Dietrich, M., Mayerhofer, W., Gabriel, R., Wiesenbauer, J., Martin, V., Zheng, Q., Imai, B., Prommer, J., Weidinger, M., and Schweiger, P.: Rapid transfer of plant photosynthates to soil bacteria via ectomycorrhizal hyphae and its interaction with nitrogen availability, Front. Microbiol., 10, 168, 2019. a, b
Hauptmann, S.: Organische Chemie, Deutscher Verlag für Grundstoffindustrie, 1985. a
Hodge, A. and Storer, K.: Arbuscular mycorrhiza and nitrogen: implications for individual plants through to ecosystems, Plant Soil, 386, 1–19, 2015. a, b
Hodge, A., Campbell, C. D., and Fitter, A. H.: An arbuscular mycorrhizal fungus accelerates decomposition and acquires nitrogen directly from organic material, Nature, 413, 297–299, 2001. a, b, c, d
Jansa, J. and Treseder, K. K.: Introduction: mycorrhizas and the carbon cycle, in: Mycorrhizal Mediation of Soil, edited by: Johnson, N. C., Gehring, C., and Jansa, J., 343–355, Elsevier, https://doi.org/10.1016/B978-0-12-804312-7.00019-X, 2017. a
Jiang, M., Caldararu, S., Zhang, H., Fleischer, K., Crous, K. Y., Yang, J., De Kauwe, M. G., Ellsworth, D. S., Reich, P. B., Tissue, D. T., and Zaehle, S.: Low phosphorus supply constrains plant responses to elevated CO2: A meta-analysis, Glob. Change Biol., 26, 5856–5873, 2020. a, b
Johnson, N. C. and Jansa, J.: Mycorrhizas: at the interface of biological, soil, and earth sciences, in: Mycorrhizal Mediation of Soil, edited by: Johnson, N. C., Gehring, C., and Jansa, J., 1–6, Elsevier, https://doi.org/10.1016/B978-0-12-804312-7.00001-2, 2017. a
Jordy, M., Azemar-Lorentz, S., Brun, A., Botton, B., and Pargney, J.: Cytolocalization of glycogen, starch, and other insoluble polysaccharides during ontogeny of Paxillus involutus–Betula pendula ectomycorrhizas, New Phytol., 140, 331–341, 1998. a
Kattge, J., Diaz, S., Lavorel, S., Prentice, I. C., Leadley, P., Bönisch, G., Garnier, E., Westoby, M., Reich, P. B., Wright, I. J., and Cornelissen, J. H. C.: TRY – a global database of plant traits, Glob. Change Biol., 17, 2905–2935, 2011. a
Knops, J., Bradley, K., and Wedin, D.: Mechanisms of plant species impacts on ecosystem nitrogen cycling, Ecol. Lett., 5, 454–466, 2002. a
Kyker-Snowman, E., Wieder, W. R., Frey, S. D., and Grandy, A. S.: Stoichiometrically coupled carbon and nitrogen cycling in the MIcrobial-MIneral Carbon Stabilization model version 1.0 (MIMICS-CN v1.0), Geosci. Model Dev., 13, 4413–4434, https://doi.org/10.5194/gmd-13-4413-2020, 2020. a
Laczko, E., Boller, T., and Wiemken, V.: Lipids in roots of Pinus sylvestris seedlings and in mycelia of Pisolithus tinctorius during ectomycorrhiza formation: changes in fatty acid and sterol composition, Plant Cell Environ., 27, 27–40, 2004. a
Lamarque, J.-F., Bond, T. C., Eyring, V., Granier, C., Heil, A., Klimont, Z., Lee, D., Liousse, C., Mieville, A., Owen, B., Schultz, M. G., Shindell, D., Smith, S. J., Stehfest, E., Van Aardenne, J., Cooper, O. R., Kainuma, M., Mahowald, N., McConnell, J. R., Naik, V., Riahi, K., and van Vuuren, D. P.: Historical (1850–2000) gridded anthropogenic and biomass burning emissions of reactive gases and aerosols: methodology and application, Atmos. Chem. Phys., 10, 7017–7039, https://doi.org/10.5194/acp-10-7017-2010, 2010. a
Lamarque, J.-F., Kyle, G. P., Meinshausen, M., Riahi, K., Smith, S. J., van Vuuren, D. P., Conley, A. J., and Vitt, F.: Global and regional evolution of short-lived radiatively-active gases and aerosols in the Representative Concentration Pathways, Climatic Change, 109, 191–212, 2011. a
Lang, A. K., Jevon, F. V., Vietorisz, C. R., Ayres, M. P., and Hatala Matthes, J.: Fine roots and mycorrhizal fungi accelerate leaf litter decomposition in a northern hardwood forest regardless of dominant tree mycorrhizal associations, New Phytol., 230, 316–326, 2021. a, b, c
Le Quéré, C., Andrew, R. M., Friedlingstein, P., Sitch, S., Pongratz, J., Manning, A. C., Korsbakken, J. I., Peters, G. P., Canadell, J. G., Jackson, R. B., Boden, T. A., Tans, P. P., Andrews, O. D., Arora, V. K., Bakker, D. C. E., Barbero, L., Becker, M., Betts, R. A., Bopp, L., Chevallier, F., Chini, L. P., Ciais, P., Cosca, C. E., Cross, J., Currie, K., Gasser, T., Harris, I., Hauck, J., Haverd, V., Houghton, R. A., Hunt, C. W., Hurtt, G., Ilyina, T., Jain, A. K., Kato, E., Kautz, M., Keeling, R. F., Klein Goldewijk, K., Körtzinger, A., Landschützer, P., Lefèvre, N., Lenton, A., Lienert, S., Lima, I., Lombardozzi, D., Metzl, N., Millero, F., Monteiro, P. M. S., Munro, D. R., Nabel, J. E. M. S., Nakaoka, S., Nojiri, Y., Padin, X. A., Peregon, A., Pfeil, B., Pierrot, D., Poulter, B., Rehder, G., Reimer, J., Rödenbeck, C., Schwinger, J., Séférian, R., Skjelvan, I., Stocker, B. D., Tian, H., Tilbrook, B., Tubiello, F. N., van der Laan-Luijkx, I. T., van der Werf, G. R., van Heuven, S., Viovy, N., Vuichard, N., Walker, A. P., Watson, A. J., Wiltshire, A. J., Zaehle, S., and Zhu, D.: Global Carbon Budget 2017, Earth Syst. Sci. Data, 10, 405–448, https://doi.org/10.5194/essd-10-405-2018, 2018. a, b, c
Lichter, J., Billings, S. A., Ziegler, S. E., Gaindh, D., Ryals, R., Finzi, A. C., Jackson, R. B., Stemmler, E. A., and Schlesinger, W. H.: Soil carbon sequestration in a pine forest after 9 years of atmospheric CO2 enrichment, Glob. Change Biol., 14, 2910–2922, 2008. a, b, c
Lindahl, B. D. and Tunlid, A.: Ectomycorrhizal fungi–potential organic matter decomposers, yet not saprotrophs, New Phytol., 205, 1443–1447, 2015. a, b, c, d, e
MacKenzie, A. R., Krause, S., Hart, K. M., Thomas, R. M., Blaen, P. J., Hamilton, R. L., Curioni, G., Quick, S. E., Kourmouli, A., Hannah, D. M., and Comer‐Warner, S. A.: BIFoR FACE: Water–soil–vegetation–atmosphere data from a temperate deciduous forest catchment, including under elevated CO2, Hydrol. Process., 35, e14096, https://doi.org/10.1002/hyp.14096, 2021. a
Malcolm, G. M., López-Gutiérrez, J. C., Koide, R. T., and Eissenstat, D. M.: Acclimation to temperature and temperature sensitivity of metabolism by ectomycorrhizal fungi, Glob. Change Biol., 14, 1169–1180, 2008. a
Marschner, H. and Dell, B.: Nutrient uptake in mycorrhizal symbiosis, Plant Soil, 159, 89–102, 1994. a, b, c, d
McCarthy, H. R., Oren, R., Kim, H.-S., Johnsen, K. H., Maier, C., Pritchard, S. G., and Davis, M. A.: Interaction of ice storms and management practices on current carbon sequestration in forests with potential mitigation under future CO2 atmosphere, J. Geophys. Res.-Atmos., 111, D15103, https://doi.org/10.1029/2005JD006428, 2006. a, b, c
McCarthy, H. R., Oren, R., Finzi, A. C., Ellsworth, D. S., Kim, H.-S., Johnsen, K. H., and Millar, B.: Temporal dynamics and spatial variability in the enhancement of canopy leaf area under elevated atmospheric CO2, Glob. Change Biol., 13, 2479–2497, 2007. a, b, c
Meyer, A., Grote, R., Polle, A., and Butterbach-Bahl, K.: Simulating mycorrhiza contribution to forest C- and N cycling-the MYCOFON model, Plant Soil, 327, 493–517, 2010. a, b, c, d, e
Nehls, U.: Mastering ectomycorrhizal symbiosis: the impact of carbohydrates, J. Exp. Bot., 59, 1097–1108, 2008. a
Norby, R. J., DeLucia, E. H., Gielen, B., Calfapietra, C., Giardina, C. P., King, J. S., Ledford, J., McCarthy, H. R., Moore, D. J., Ceulemans, R., and De Angelis, P. Forest response to elevated CO2 is conserved across a broad range of productivity, P. Natl. Acad. Sci. USA, 102, 18052–18056, 2005. a
Norby, R. J., Warren, J. M., Iversen, C. M., Medlyn, B. E., and McMurtrie, R. E.: CO2 enhancement of forest productivity constrained by limited nitrogen availability, P. Natl. Acad. Sci. USA, 107, 19368–19373, 2010. a
Orwin, K. H., Kirschbaum, M. U., St John, M. G., and Dickie, I. A.: Organic nutrient uptake by mycorrhizal fungi enhances ecosystem carbon storage: a model-based assessment, Ecol. Lett., 14, 493–502, 2011. a
Parton, W., Scurlock, J., Ojima, D., Gilmanov, T., Scholes, R. J., Schimel, D. S., Kirchner, T., Menaut, J.-C., Seastedt, T., Garcia Moya, E., and Kamnalrut, A.: Observations and modeling of biomass and soil organic matter dynamics for the grassland biome worldwide, Global Biogeochem. Cy., 7, 785–809, 1993. a, b
Paterson, E., Sim, A., Davidson, J., and Daniell, T. J.: Arbuscular mycorrhizal hyphae promote priming of native soil organic matter mineralisation, Plant Soil, 408, 243–254, 2016. a, b
Pérez-Tienda, J., Valderas, A., Camañes, G., García-Agustín, P., and Ferrol, N.: Kinetics of NH uptake by the arbuscular mycorrhizal fungus Rhizophagus irregularis, Mycorrhiza, 22, 485–491, 2012. a, b
Phillips, R. P., Brzostek, E., and Midgley, M. G.: The mycorrhizal-associated nutrient economy: a new framework for predicting carbon–nutrient couplings in temperate forests, New Phytol., 199, 41–51, 2013. a, b, c
Pritsch, K., Raidl, S., Marksteiner, E., Blaschke, H., Agerer, R., Schloter, M., and Hartmann, A.: A rapid and highly sensitive method for measuring enzyme activities in single mycorrhizal tips using 4-methylumbelliferone-labelled fluorogenic substrates in a microplate system, J. Microbiol. Meth., 58, 233–241, 2004. a
Rastetter, E., McKane, R., Shaver, G., and Melillo, J.: Changes in C storage by terrestrial ecosystems: How CN interactions restrict responses to CO2 and temperature, Water Air Soil Poll., 64, 327–344, 1992. a, b
Read, D. J.: Mycorrhizas in ecosystems, Experientia, 47, 376–391, 1991. a, b, c, d, e
Saltelli, A., Chan, K., and Scott, M.: Handbook of sensitivity analysis. Probability and Statistics Series, Wiley, New York, 2000. a
Savage, K., Davidson, E., Abramoff, R., Finzi, A., and Giasson, M.-A.: Partitioning soil respiration: quantifying the artifacts of the trenching method, Biogeochemistry, 140, 53–63, 2018. a
Shi, M., Fisher, J. B., Phillips, R. P., and Brzostek, E. R.: Neglecting plant–microbe symbioses leads to underestimation of modeled climate impacts, Biogeosciences, 16, 457–465, https://doi.org/10.5194/bg-16-457-2019, 2019. a, b
Smith, S. E. and Read, D. J. (Eds.): Mycorrhizal symbiosis, 3rd Edn., Academic Press, New York, 2010. a
Soudzilovskaia, N. A., van Bodegom, P. M., Terrer, C., Zelfde, M. v., McCallum, I., Luke McCormack, M., Fisher, J. B., Brundrett, M. C., de Sá, N. C., and Tedersoo, L.: Global mycorrhizal plant distribution linked to terrestrial carbon stocks, Nat. Commun., 10, 5077, https://doi.org/10.1038/s41467-019-13019-2, 2019. a
Sulman, B. N., Phillips, R. P., Oishi, A. C., Shevliakova, E., and Pacala, S. W.: Microbe-driven turnover offsets mineral-mediated storage of soil carbon under elevated CO2, Nat. Clim. Change, 4, 1099–1102, 2014. a
Sulman, B. N., Brzostek, E. R., Medici, C., Shevliakova, E., Menge, D. N., and Phillips, R. P.: Feedbacks between plant N demand and rhizosphere priming depend on type of mycorrhizal association, Ecol. Lett., 20, 1043–1053, 2017. a
Tedersoo, L. and Bahram, M.: Mycorrhizal types differ in ecophysiology and alter plant nutrition and soil processes, Biol. Rev., 94, 1857–1880, 2019. a
Terrer, C., Vicca, S., Hungate, B. A., Phillips, R. P., and Prentice, I. C.: Mycorrhizal association as a primary control of the CO2 fertilization effect, Science, 353, 72–74, 2016. a
Terrer, C., Vicca, S., Stocker, B. D., Hungate, B. A., Phillips, R. P., Reich, P. B., Finzi, A. C., and Prentice, I. C.: Ecosystem responses to elevated CO2 governed by plant–soil interactions and the cost of nitrogen acquisition, New Phytol., 217, 507–522, 2018. a, b
Thum, T., Caldararu, S., Engel, J., Kern, M., Pallandt, M., Schnur, R., Yu, L., and Zaehle, S.: A new model of the coupled carbon, nitrogen, and phosphorus cycles in the terrestrial biosphere (QUINCY v1.0; revision 1996), Geosci. Model Dev., 12, 4781–4802, https://doi.org/10.5194/gmd-12-4781-2019, 2019. a, b, c, d, e, f, g, h, i, j, k, l, m
Thurner, M. A., Caldararu, S., Engel, J., Rammig, A., and Zaehle, S.: Releases of the QUINCY terrestrial ecosystem model, registration required, release 05, Max Planck Institute for Biogeochemistry (MPI-BGC) [code, data set], https://doi.org/10.17871/quincy-model-2019, 2023. a
Treseder, K. K., Turner, K. M., and Mack, M. C.: Mycorrhizal responses to nitrogen fertilization in boreal ecosystems: potential consequences for soil carbon storage, Glob. Change Biol., 13, 78–88, 2007. a, b
Vicca, S., Stocker, B. D., Reed, S., Wieder, W. R., Bahn, M., Fay, P. A., Janssens, I. A., Lambers, H., Peñuelas, J., Piao, S., and Rebel, K. T.: Using research networks to create the comprehensive datasets needed to assess nutrient availability as a key determinant of terrestrial carbon cycling, Environ. Res. Lett., 13, 125006, https://doi.org/10.1088/1748-9326/aaeae7, 2018. a
Viovy, N.: CRUNCEP Version 7 – Atmospheric Forcing Data for the Community Land Model, NCAR Research Data Archive, https://doi.org/10.5065/PZ8F-F017, 2016. a
Walker, A. P., Hanson, P. J., De Kauwe, M. G., Medlyn, B. E., Zaehle, S., Asao, S., Dietze, M., Hickler, T., Huntingford, C., Iversen, C. M., and Jain, A.: Comprehensive ecosystem model-data synthesis using multiple data sets at two temperate forest free-air CO2 enrichment experiments: Model performance at ambient CO2 concentration, J. Geophys. Res.-Biogeo., 119, 937–964, 2014. a
Walker, A. P., De Kauwe, M. G., Bastos, A., Belmecheri, S., Georgiou, K., Keeling, R. F., McMahon, S. M., Medlyn, B. E., Moore, D. J., Norby, R. J., and Zaehle, S.: Integrating the evidence for a terrestrial carbon sink caused by increasing atmospheric CO2, New Phytol., 229, 2413–2445, 2021. a
Wallander, H., Nilsson, L. O., Hagerberg, D., and Rosengren, U.: Direct estimates of C : N ratios of ectomycorrhizal mycelia collected from Norway spruce forest soils, Soil Biol. Biochem., 35, 997–999, 2003. a
Wang, G., Huang, W., Zhou, G., Mayes, M. A., and Zhou, J.: Modeling the processes of soil moisture in regulating microbial and carbon-nitrogen cycling, J. Hydrol., 585, 124777, https://doi.org/10.1016/j.jhydrol.2020.124777, 2020. a
Wieder, W. R., Cleveland, C. C., Lawrence, D. M., and Bonan, G. B.: Effects of model structural uncertainty on carbon cycle projections: biological nitrogen fixation as a case study, Environ. Res. Lett., 10, 044016, https://doi.org/10.1088/1748-9326/10/4/044016, 2015. a
Wu, T., Kabir, Z., and Koide, R.: A possible role for saprotrophic microfungi in the N nutrition of ectomycorrhizal Pinus resinosa, Soil Biol. Biochem., 37, 965–975, 2005. a, b, c
Wutzler, T., Zaehle, S., Schrumpf, M., Ahrens, B., and Reichstein, M.: Adaptation of microbial resource allocation affects modelled long term soil organic matter and nutrient cycling, Soil Biol. Biochem., 115, 322–336, 2017. a
Yu, L., Ahrens, B., Wutzler, T., Schrumpf, M., and Zaehle, S.: Jena Soil Model (JSM v1.0; revision 1934): a microbial soil organic carbon model integrated with nitrogen and phosphorus processes, Geosci. Model Dev., 13, 783–803, https://doi.org/10.5194/gmd-13-783-2020, 2020. a
Zaehle, S. and Dalmonech, D.: Carbon–nitrogen interactions on land at global scales: current understanding in modelling climate biosphere feedbacks, Curr. Opin. Env. Sust., 3, 311–320, 2011. a
Zaehle, S. and Friend, A. D.: Carbon and nitrogen cycle dynamics in the O-CN land surface model: 1 Model description, site-scale evaluation, and sensitivity to parameter estimates, Global Biogeochem. Cy., 24, GB1005, https://doi.org/10.1029/2009GB003521, 2010. a
Zaehle, S., Medlyn, B. E., De Kauwe, M. G., Walker, A. P., Dietze, M. C., Hickler, T., Luo, Y., Wang, Y.-P., El-Masri, B., Thornton, P., and Jain, A.: Evaluation of 11 terrestrial carbon–nitrogen cycle models against observations from two temperate Free-Air CO2 Enrichment studies, New Phytol., 202, 803–822, 2014. a, b, c
Zerihun, A., McKenzie, B. A., and Morton, J. D.: Photosynthate costs associated with the utilization of different nitrogen–forms: influence on the carbon balance of plants and shoot–root biomass partitioning, New Phytol., 138, 1–11, 1998. a