the Creative Commons Attribution 4.0 License.
the Creative Commons Attribution 4.0 License.
 | 03 Aug 2021
Patterns in recent and Holocene pollen accumulation rates across Europe – the Pollen Monitoring Programme Database as a tool for vegetation reconstruction
Vojtěch Abraham
Sheila Hicks
Helena Svobodová-Svitavská
Elissaveta Bozilova
Sampson Panajiotidis
Mariana Filipova-Marinova
Christin Eldegard Jensen
Spassimir Tonkov
Irena Agnieszka Pidek
Joanna Święta-Musznicka
Marcelina Zimny
Eliso Kvavadze
Anna Filbrandt-Czaja
Martina Hättestrand
Nurgül Karlıoğlu Kılıç
Jana Kosenko
Maria Nosova
Elena Severova
Olga Volkova
Margrét Hallsdóttir
Laimdota Kalniņa
Agnieszka M. Noryśkiewicz
Bożena Noryśkiewicz
Heather Pardoe
Areti Christodoulou
Tiiu Koff
Sonia L. Fontana
Teija Alenius
Elisabeth Isaksson
Heikki Seppä
Siim Veski
Anna Pędziszewska
Martin Weiser
Thomas Giesecke
The collection of modern, spatially extensive pollen data is important for the interpretation of fossil pollen assemblages and the reconstruction of past vegetation communities in space and time. Modern datasets are readily available for percentage data but lacking for pollen accumulation rates (PARs). Filling this gap has been the motivation of the pollen monitoring network, whose contributors monitored pollen deposition in modified Tauber traps for several years or decades across Europe. Here we present this monitoring dataset consisting of 351 trap locations with a total of 2742 annual samples covering the period from 1981 to 2017. This dataset shows that total PAR is influenced by forest cover and climate parameters, which determine pollen productivity and correlate with latitude. Treeless vegetation produced PAR values of at least 140 grains cm−2 yr−1. Tree PAR increased by at least 400 grains cm−2 yr−1 with each 10 % increase in forest cover. Pollen traps situated beyond 200 km of the distribution of a given tree species still collect occasional pollen grains of that species. The threshold of this long-distance transport differs for individual species and is generally below 60 grains cm−2 yr−1. Comparisons between modern and fossil PAR from the same regions show similar values. For temperate taxa, modern analogues for fossil PARs are generally found downslope or southward of the fossil sites. While we do not find modern situations comparable to fossil PAR values of some taxa (e.g. Corylus), CO2 fertilization and land use may cause high modern PARs that are not documented in the fossil record. The modern data are now publicly available in the Neotoma Paleoecology Database and aid interpretations of fossil PAR data.
- Article
(9193 KB) -
Supplement
(5902 KB) - BibTeX
- EndNote


1.1 The need for a dataset of modern absolute pollen deposition
Pollen analysis has became the most widely used method for the reconstruction of the Holocene vegetation. Pollen percentages are a simple representation of pollen analytical results but have a number of well-known limitations and biases that are often ignored. One of these is separating locally produced from long-distance-transported pollen (Davis, 2000), which is paramount for mapping past changes in plant distributions. Also reconstructing the position of treelines from pollen percentage data may be misleading as local treeless vegetation (e.g. tundra) produces few pollen grains, while distant woodlands (e.g. consisting of boreal trees) produce much pollen. In such situations absolute pollen data are very informative as was already realized by Hesselman (1919) and Malmström (1923). Pollen accumulation rates (PARs), or the number of pollen grains deposited on the sediment surface over a set period of time, are in theory superior to pollen percentages as they do not suffer the closure effect of percentage data. Thus by using absolute data it is possible to differentiate between small quantities of long-distance-transported pollen versus large quantities of locally produced pollen. In a seminal publication Davis and Deevey (1964) document the power of using absolute pollen deposition for the interpretation of the spread of trees during the postglacial afforestation around Rogers Lake in Connecticut, United States. Another bias in percentage data is the interdependence of values obscuring the quantification in the amount of change of a single taxon. PARs are therefore required when studying the population dynamics of individual trees (Bennett, 1983). While absolute pollen data do not share the artefacts of percentage data, they are often difficult to obtain and subject to a different set of limitations.
One limitation for obtaining reliable PAR from sediment cores is the requirement for accurate chronologies. Lake internal processes such as re-deposition and sediment focusing and also catchment erosion may bias the resulting values (Bennett and Buck, 2016; Davis and Brubaker, 1973; Giesecke and Fontana, 2008; Davis et al., 1984). These are some reasons why advances in interpreting PAR have been slow. The other reason is that collecting modern PAR values is not as simple as collecting mosses, soil litter or the top sediment of lakes for obtaining modern pollen percentages for a particular vegetation type. Modern rates of pollen accumulation can be obtained from monitoring pollen deposition using pollen traps (Hicks, 1994), as well as from carefully sampling the top sediment of lakes that are either annually laminated or precisely dated (Matthias and Giesecke, 2014). Due to the high inter-annual variability in pollen production (Andersen, 1980; Haselhorst et al., 2020), it is necessary to conduct pollen monitoring over several years to enable comparisons with estimates from sediment cores (Hicks, 1974; Hicks and Hyvärinen, 1999).
For these reasons there are only a few investigations of the pollen vegetation relationship using absolute pollen deposition, while there are numerous studies using percentage data. Nevertheless, investigations using pollen traps yielded invaluable insights into the mode of pollen transport (Tauber, 1967). Also, the construction of representation factors for common European trees by Andersen (1970), which are still used, was based on pollen monitoring data from pollen traps. In this way pollen monitoring studies have contributed to the development of models of pollen dispersal and deposition (Gaillard et al., 2008).
Several aspects of PAR data have not been exhaustively explored in modern comparison studies, and here we will focus on the following three: (1) the influence of climate in combination with forest biomass, (2) the application of PAR to indicate the local presence of trees versus long-distance transport of pollen, and (3) using modern PAR values of single taxa to interpret fossil situations.
1.2 Climate and biomass
Recent investigations demonstrate the linear response of absolute pollen deposition to absolute tree abundance (Matthias and Giesecke, 2014; Seppä et al., 2009; Sugita et al., 2009), which may be used to reconstruct past standing tree biomass of different trees. However, at an annual time resolution, variability in PAR can be explained by weather conditions during the time of flowering as well as during the previous year (Hicks, 1999; Nielsen et al., 2010; van der Knaap et al., 2010). Thus the question arises: if weather is determining annual pollen production, could climate determine average PAR? Comparing Pinus PAR between two pine-dominated forest regions in central Sweden and northeast Germany shows much higher values in the south, suggesting that PAR may not correspond to tree biomass alone (Matthias and Giesecke, 2014). The relationship between pollen production and weather suggests that more pollen is produced when the primary productivity of the tree is higher. This is also true for fertilization with CO2 (LaDeau and Clark, 2006). Therefore, climate and even the amount of CO2 in the atmosphere may determine the pollen productivity of a tree at a given site. Welten (1944) already interpreted the first fossil PAR in this way, suggesting that climate deteriorations may not immediately lead to a decline in forest cover but to the amount of pollen produced. This interpretation of changing PAR was however forgotten. If climate and CO2 determine pollen productivity, then the postglacial increase in PAR at Rodgers Lake could also be due to a change in these parameters. It is, therefore, important to investigate the possible relationship between climate and average PAR in more detail.
1.3 Local presence versus long-distance transport
Also, the initial question on the amount of pollen that may arrive at a site from long-distance sources has not been addressed in a systematic way using modern absolute pollen deposition data. Identification of the local presence of taxa in the past, by comparison of different proxies, produces ambiguous results. Some studies show that the rise of PAR is able to mirror the first occurrence of a macrofossil (e.g. Giesecke, 2005a); others show an increase in PAR and percentage values thousands of years after the first appearance of stomata (Froyd, 2005; Parshall, 1999). So, the modern comparisons of PAR thresholds and recent vegetation are needed. While percentage data are not well suited for detecting distribution limits, a continental-scale comparison (Lisitsyna et al., 2011a) provides some guidance on values that can be used for mapping past distribution changes (Giesecke et al., 2017). The Pollen Monitoring Programme (PMP) dataset presented here provides a continental-scale dataset permitting such a comparison with PAR data.
1.4 Modern analogues
Spatially extensive modern pollen percentage datasets provide the possibility of searching for modern analogues for fossil pollen proportions and in this way reconstructing past vegetation and environmental conditions (Jackson and Williams, 2004; Overpeck et al., 1985; Davis et al., 2013). Modern datasets of absolute pollen deposition are hitherto rarely used to reconstruct past tree abundances or environmental conditions. By using a network of pollen traps across the latitudinal treeline in Finland, Hicks et al. (2001) showed that average modern PAR values can be obtained, representing the gradual transition from the boreal forest to tundra. These “modern analogues” were successfully applied to reconstructing Holocene shifts of the latitudinal treeline (Seppä and Hicks, 2006). This idea of building a modern dataset of absolute pollen deposition that can be used as a reference to interpret fossil PAR was the motivation for the establishment of the Pollen Monitoring Programme (PMP; Hicks et al., 1996, 1999, 2001).
1.5 The Pollen Monitoring Programme (PMP)
The programme was launched in August 1996 at a meeting in Finland, bringing mainly European researchers together. Members of the network changed over the years, and monitoring experiments were discontinued or newly started. Although pollen monitoring studies were and are carried out in other continents (e.g. Jantz et al., 2013), the PMP had little success in attracting researchers working outside Europe. The standardization of the monitoring protocol allowed for easy comparisons between the results in different regions, which were discussed at the International Union for Quaternary Research (INQUA) in 1999 and led to a special volume published in 2001 (Tinsley and Hicks, 2001), collecting results based on several initial time series (Koff, 2001; Tinsley, 2001; Tonkov et al., 2001; van der Knaap et al., 2001), as well as a first comparative study (Hicks et al., 2001). More individual results were published in the following years (e.g. Kvavadze, 2001; Pidek, 2007; Giesecke and Fontana, 2008; Gerasimidis et al., 2006; Jensen et al., 2007; Hättestrand et al., 2008), and comparative studies followed in a second special volume published in 2010 (Giesecke et al., 2010). The data produced by contributors to the PMP were analysed for different questions, including weather parameters determining the amount of pollen production (van der Knaap et al., 2010) and its correlation to masting years in Fagus (Pidek et al., 2010). The programme established a database collecting the original data for individual years, as well as general information on the pollen traps installed in the different regions (Fig. 1). The database was developed offline and was thus difficult to access by individual researchers. The paleoecology database Neotoma (Williams et al., 2018) offers a platform to store the PMP data and make it available to researchers worldwide, allowing them to interrogate the data and potentially identify modern analogues to interpret fossil pollen accumulation rates.
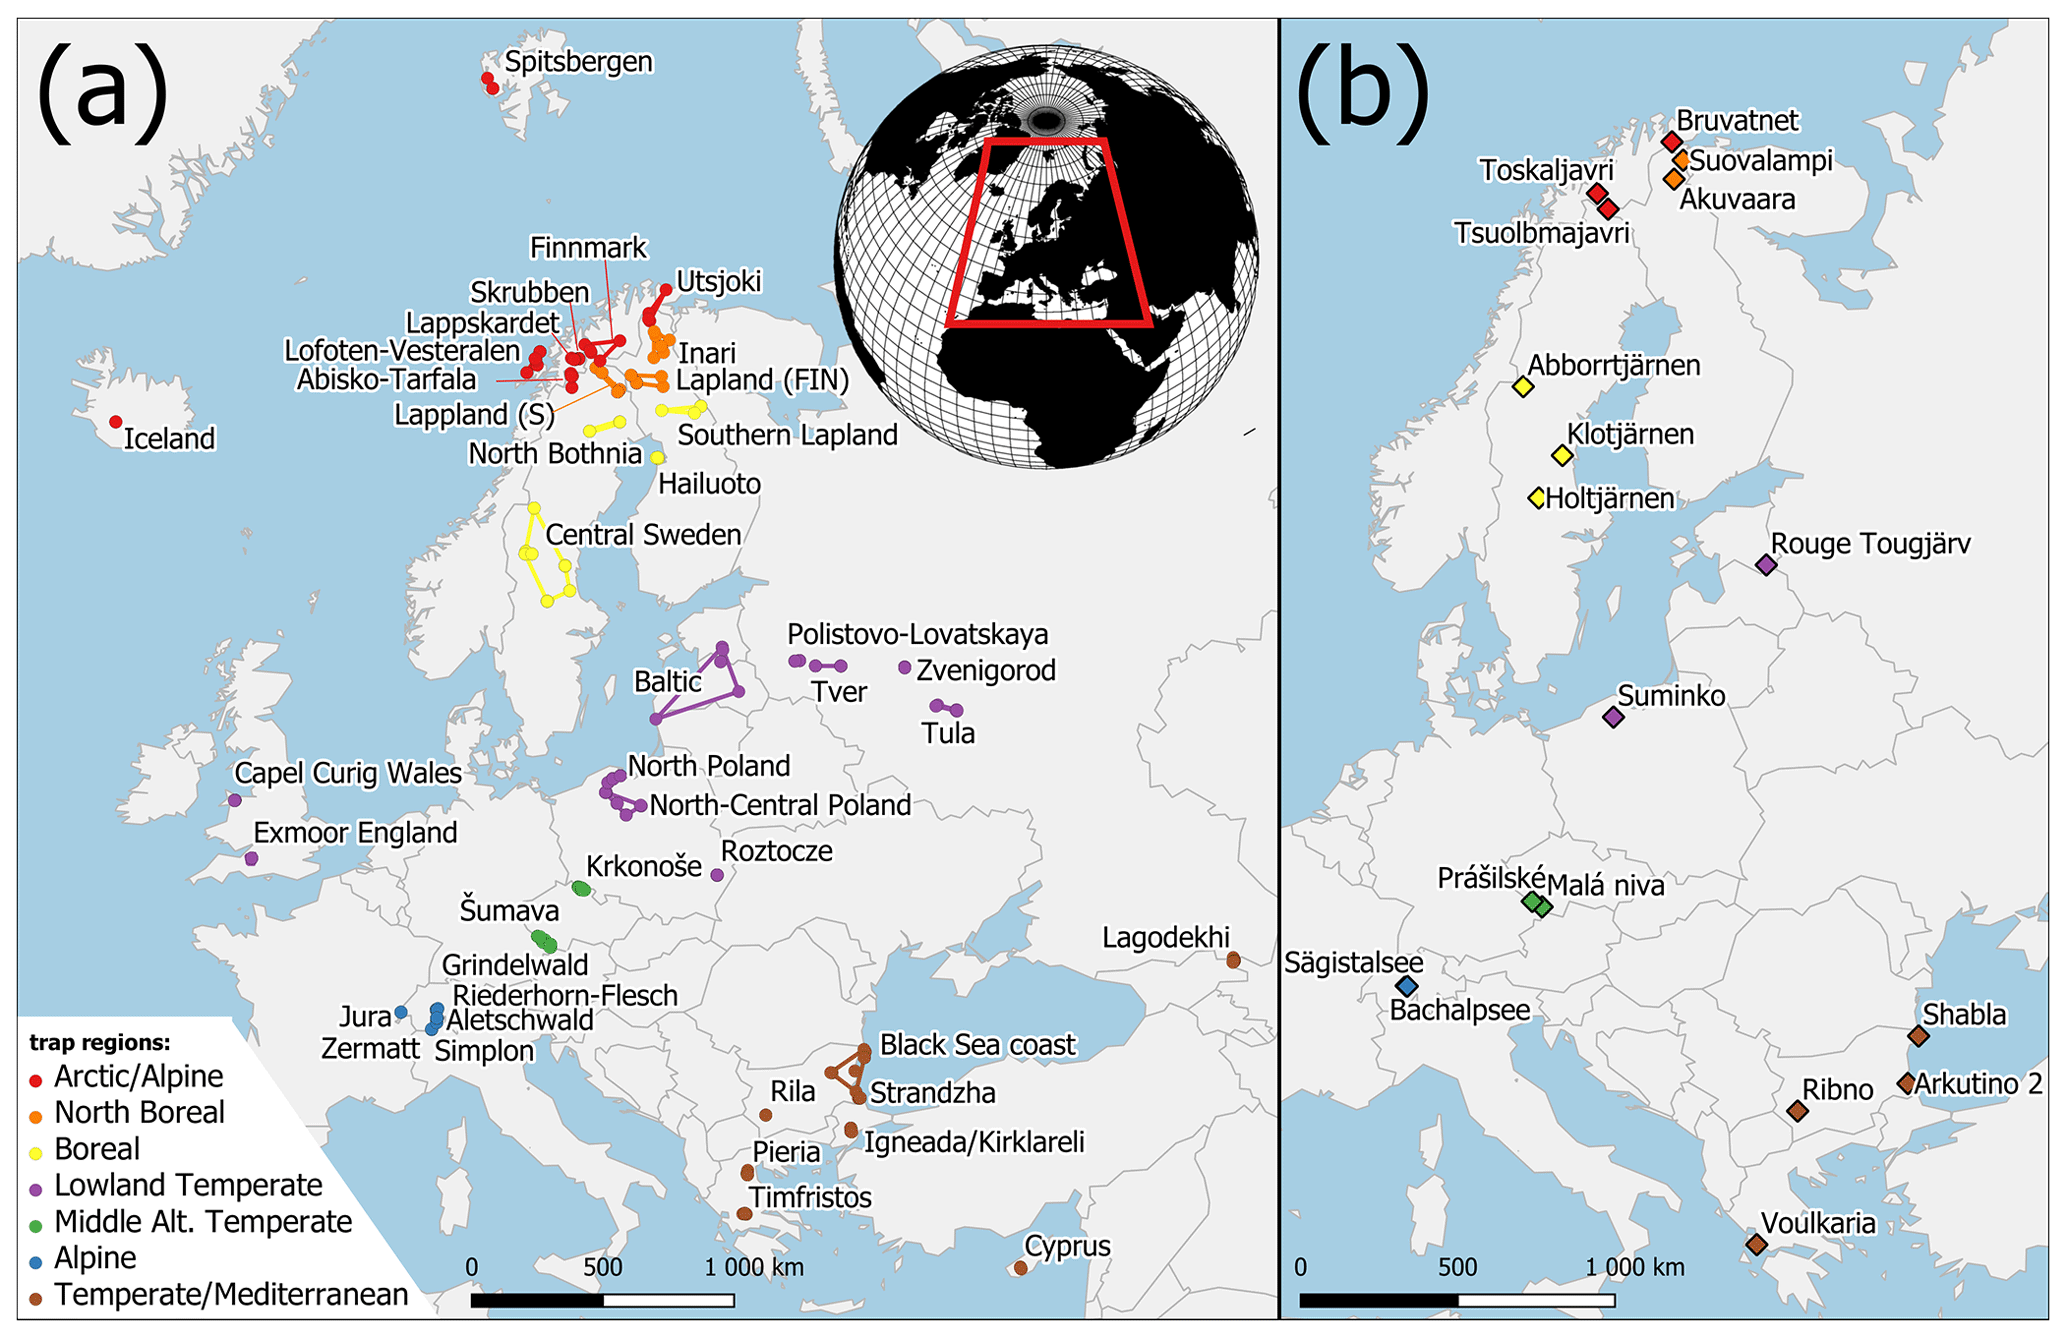
Figure 1Map of the study area with trap areas (a) and Holocene pollen sites (b). Both datasets are divided into trap regions (colours). Colours correspond to Fig. 5.
The overall purpose of this paper is to present an overview of the data in the PMP database and to interrogate this continental-scale dataset of modern PAR with the following aims
- a.
to examine the hypothesis that climate as well as regional biomass explain the variability in PAR.
- b.
to study the absolute amount of long-distance-dispersed pollen encountered in pollen traps beyond the known distribution limits of the parent trees.
- c.
to compare modern and fossil pollen accumulation rates by collecting fossil datasets with estimates of PAR from the same regions where the pollen traps were installed. For the most abundant pollen types we explore how the modern situations can provide a reference for the interpretation of the fossil data.
2.1 Study area
Sites in the PMP database were divided into seven “trap regions” according to their latitude and altitude. These regions were further divided into “trap areas”, by grouping 2–10 trap locations according to their spatial proximity. The arctic/alpine region includes distant trap areas in Spitsbergen and Iceland, northernmost traps in Finland (Utsjoki) and Norway (Lofoten–Vesterålen), and traps in the Scandinavian mountains above the local treeline (Finnmark, Abisko–Tarfala, Skrubben and Lappskardet). The landscape around these traps is often treeless or covered by sparse birch shrubland with Betula nana and B. pubescens in some locations. The north boreal region includes traps in northern Lapland in Finland, Norway and Sweden with a vegetation dominated by Betula and Pinus sylvestris. The northern limit of P. sylvestris occurs between traps from this region. The traps are situated at altitudes below 500 m a.s.l. The boreal region includes trap areas situated in southern Lapland, around the Bay of Bothnia and in central Sweden. The vegetation is dominated by Picea abies, P. sylvestris and Betula species, with the occurrence of Alnus incana. The northernmost populations of Alnus glutinosa occur near some sites, and the southernmost traps in central Sweden are situated near the northern outpost populations of Corylus avellana and Ulmus glabra. Traps from the temperate lowland region have the widest longitudinal extent including the British Isles, Poland, the Baltic countries and European Russia. Vegetation at trapping locations below 500 m a.s.l. is characterized by Quercus and Fraxinus excelsior in the west and P. sylvestris, P. abies and Betula with an admixture of Quercus, Tilia, Ulmus and C. avellana in the east. Fagus sylvatica and Carpinus betulus occur in Poland and Abies alba only in southeastern Poland. Trapping locations in the mid-altitude temperate region were separated from the temperate lowland sites and include the Krkonoše and Šumava mountains. Traps in both areas are placed on an elevation gradient from 500 m and 1200 m a.s.l. The lower slopes of the mountains are dominated by Fagus sylvatica, while the traps are situated on a gradient from Picea abies-dominated forest to the onset of alpine vegetation in Krkonoše. In the Alps and Jura mountains (alpine region), traps were placed at even higher elevations, between 1200 m and 3000 m a.s.l., crossing the altitudinal treeline. Trapping locations in the temperate/Mediterranean region in southeastern Europe represent diverse landscapes and vegetation types including grasslands, evergreen and deciduous forests. Some traps are situated in high-mountain regions around treeline situations or within the upper mountain forests including Rila (Bulgaria), Pieria (Greece), Tymfristos (Greece), Lagodekhi (Georgia) and Cyprus. Traps at lower elevations are situated near the Black Sea coast, within the low Strandzha Mountains and European Turkey.
2.2 Data collection
The pollen traps used in the PMP network generally consist of a bucket or bottle with an opening of 19.6 cm2 usually (5 cm diameter opening).
The bottle or bucket must be large enough to hold the annual surplus precipitation that falls into the trap. Many traps had a sloping collar inspired by the design of pollen traps by Tauber (1974), although few collars were truly aerodynamic. The collection of the trap content was generally carried out annually, and any special circumstances potentially affecting the annual pollen deposition were noted and stored in the database. For the analyses presented here and data overview, we excluded traps where the pollen record is 2 years or less, as averages may be affected by high inter-annual variability. The only exception is the trap situated in Spitsbergen where there is a 2-year record. Pollen accumulation from the 2-year record shows little variation and, being the only analogue for a truly arctic and treeless environment, provides important information on long-distance pollen transport. We also excluded annual samples with records shorter than 8 months and, in addition, traps or years with spurious values due to particular events or local conditions (Table S1 in the Supplement).
Most of the traps in the PMP network were placed in the open vegetation or in forest openings in order to avoid an unrepresentative contribution of individual trees, e.g. due to anthers dropping into the traps. Traps were generally installed at ground level, mimicking collection conditions relevant for sedimentary archives. Consequently, tall herbs or grasses might have overgrown or covered some of the traps, potentially leading to higher pollen deposition of grasses and reduced pollen deposition of trees caused by leaves temporally blocking the opening. Traps not equipped with a mesh occasionally trapped pollen-collecting insects, leading to enormous counts of insect-pollinated taxa, e.g. Calluna and Erythranthe guttata. The presence of insects in the traps is usually noted for the collection year so that careful evaluation of the information in the database can also inform on herbaceous pollen types (Jensen et al., 2007). Including this information in comprehensive database queries is currently not possible, and a manual screening of datasets is required when analysing herbaceous pollen types. This problem does not seem to occur in tree pollen taxa. The occurrence of phytophagous insects in the traps was not accompanied by unusual peaks in tree pollen taxa, indicating that the insects inadvertently trapped were primarily collecting pollen from the herbaceous vegetation around the traps. Comprehensive database queries were restricted to tree pollen, Poaceae and Cyperaceae. Those taxa should not be affected by the occurrence of insects in the trap and mainly represent pollen transport via wind, the rainout of pollen from the atmosphere and the gravity component (Tauber, 1967).
Concentrating the content of the traps was carried out either using filter paper or centrifugation and decanting the supernatant. In many cases the trap content was washed onto a paper filter, which was later digested using acetolysis. Pollen quantity was assessed by adding Lycopodium spore tablets (Stockmarr, 1971) to each trap before processing. Pollen concentration was obtained from the ratios between pollen grains counted to Lycopodium spike counted and Lycopodium spike added. Details about Lycopodium spike data, as well as details of the pollen trap such as the exact size of the opening are stored in the database. The PMP database was created in the PostgreSQL database system. Names of pollen taxa were unified using the accepted variable names from the European Pollen Database (Giesecke et al., 2019).
2.3 Investigated taxa, climate and forest cover
We selected the common tree and shrub taxa of Europe. Pollen taxa generally refer to all the species within the genus. Pollen taxa allowing higher taxonomical resolution, which were consistently separated and excluded from the genus in the whole dataset, are marked as “excl.”. Pollen taxa potentially including pollen grains from another genus are indicated by “incl.”: Abies, Alnus (excl. A. viridis), Betula (excl. B. nana type), Carpinus type (incl. C. orientalis/Ostrya type), Corylus, Fagus, Fraxinus (incl. F. ornus), Juniperus type (incl. Cupressus, Tetraclinis, Thuja), Picea, Pinus (excl. P. cembra type), Tilia, Quercus (incl. Q. robur type, Q. cerris type and Q. ilex type). Pollen accumulation rates of trees and shrubs were summed as tree pollen accumulation (hereafter as “tree PAR”). We also included pollen from the plant families Cyperaceae and Poaceae (excluding cereals). For the purpose of the analysis in this paper we refer to the sum of tree PAR plus Cyperaceae and Poaceae as “total PAR”.
The climate parameters mean annual temperature (MAT) and annual precipitation (APrecip) for the trapping locations were obtained from WorldClim 2 (Fick and Hijmans, 2017). For site altitude we used the information supplied by the individual investigator. Comparisons between PAR and forest cover were conducted using the data of the Forest Map of Europe (Kempeneers et al., 2012), which has a grid resolution of 1 km2. Forest cover was extracted as a mean of all grid cells within a 10 km radius. We used regression analysis to explore whether individual or combinations of these environmental parameters describing the trapping location can explain the variance in average pollen accumulation of total and tree PAR. To balance the contribution of high and low pollen producers in the assessment of the PAR, we applied correction factors (Table S2, Andersen, 1970). Average modern PAR has a large variance of values between traps of the same region, with the smaller numbers often being the focus of information. For this reason, we often log-transformed PAR values in the different analyses.
2.4 Distribution limits and PAR
Pollen deposition beyond the distribution area of the parent plant was studied by merging the distribution maps of the relevant species included in each of the pollen types listed above (San-Miguel-Ayanz et al., 2016; Caudullo et al., 2017). These comparisons were not possible for Alnus, Betula, Cyperaceae, Juniperus, Pinus and Poaceae as these taxa are widely distributed in Europe, and few traps are located beyond their distribution area.
For each trap location and each pollen taxon we calculated the distance to the nearest area of distribution using GIS (GRASS Development Team, 2018). Initial observations showed that PAR dropped rapidly away from the distribution of the parent tree and did not decline at the same rate at larger distances. We therefore compared distance to the decadic logarithm of PAR, applying linear regression to explore thresholds of long-distance transport (hereafter also as “LDT”) at 200 km from their mapped distribution limits. This distance was chosen as a compromise accounting for uncertainties in the information on distribution limits and available pollen trap data. Pollen traps in the UK are situated beyond the natural distribution limits of several of these trees but were excluded from the comparison as the target taxa may be planted in the area.
2.5 Comparison between modern and Holocene PAR
To enable the comparison of modern with fossil PAR values, the pollen trap data were extracted from the PMP database with the above-described constraints and all annual samples were averaged within traps. For each trap region we selected at least one and a maximum of three Holocene PAR records (Table 1). Holocene PAR estimates often show high variation between samples due to changes in the sedimentary environment. To reduce this effect in this comparison, Holocene data were averaged in 500-year bins. Site and sample compilation resulted in a fossil dataset containing 354 Holocene samples.
Hyvärinen (1975)Seppä et al. (2002)Seppä and Weckström (1999)Hyvärinen (1975)Hyvärinen (1975)Giesecke (2005c)Giesecke and Fontana (2008)Giesecke (2005a)Veski et al. (2012)Pędziszewska et al. (2015)Carter et al. (2018)Svobodová et al. (2002)van der Knaap et al. (2000)van der Knaap et al. (2000)Filipova-Marinova (1985)Bozilova and Beug (1992)Tonkov et al. (2016)Jahns (2004)Table 1Fossil sequences including type and size of the deposit.

We compared trap and fossil PAR datasets in two ways. For a general comparison of the distribution of fossil and modern values, we plotted the frequency of log-transformed PAR values over all regions and traps per taxon. For each region and taxon we compared the frequency distribution of fossil and modern PAR values using a t test at the 5 % level of alpha to identify situations where modern and fossil values are comparable. Secondly, we compared trap and fossil PAR at the level of individual sites or trap areas. To facilitate this comparison average trap and fossil PAR values per taxon were submitted to one-dimensional clustering using the R-package Ckmeans.1d.dp (Wang and Song, 2011). This method splits the univariate data in such a way that the total of within-cluster sums of squares is always kept to a minimum. These classes helped us compare trap and fossil data and to link the highest fossil PARs with the trap PARs. We dealt only with the highest class in each fossil sequence because maximum abundance of several of our target taxa was used as a stratigraphic marker of the Holocene period, and thus their timing is well known. However, time windows did not smooth out all spuriously high value variation. In order to remove this remaining variation in individual time windows, we ignored some high fossil values (Table S3). Thus, we aimed to find modern analogues for fossil situations represented by several bins (more than 500 years). We linked these periods containing high fossil PAR to the closest pollen trap, using a matrix of geographical distances between fossil sites and pollen traps. All statistical analysis and data visualizations were produced in R (R Core Team, 2019).
3.1 Overview of the PMP database and the environments sampled
The PMP database version 02.02.2020 contains data from 351 trap locations with a total of 2742 annual samples covering the period from 1981 to 2017. Considering the trap records with 3 years and more, we obtained 271 mean trap assemblages. Trapping sites cover a range of altitudes from 0 to 3000 m a.s.l. with annual precipitation ranging from 402 to 1549 mm. Mean annual temperatures (MATs) for the sites fall between −5.7 and 14.1 ∘C. The forest cover within a 10 km radius of the trapping sites ranges from 0 % to 98 %. This range of environmental situations has yielded tree pollen accumulation rates from 5 to 86 000 grains cm−2 yr−1, with a median value of 5400 grains cm−2 yr−1 (Fig. 2). An overview of the taxonomic composition of the traps (Fig. S1 in the Supplement) shows a dominance of pollen from Pinus and Betula in the traps from boreal and hemiboreal environments, with Betula as the taxon with the highest PAR overall. In most northern traps from open environments, Cyperaceae is the dominant NAP pollen type, while Poaceae is dominant in traps from open environments in the south, where they also contribute much higher absolute amounts. The diversity of landscapes and forest types in central and southern Europe is well represented in the pollen composition of traps from this area (Fig. S1b). Dominance of oak and hornbeam at temperate/Mediterranean sites in the lowland and pine and birch at arctic/alpine and north boreal sites shows similar stability from a Holocene perspective. Vegetation history at the rest of the fossil sites shows a more dynamic development (Fig. S2).
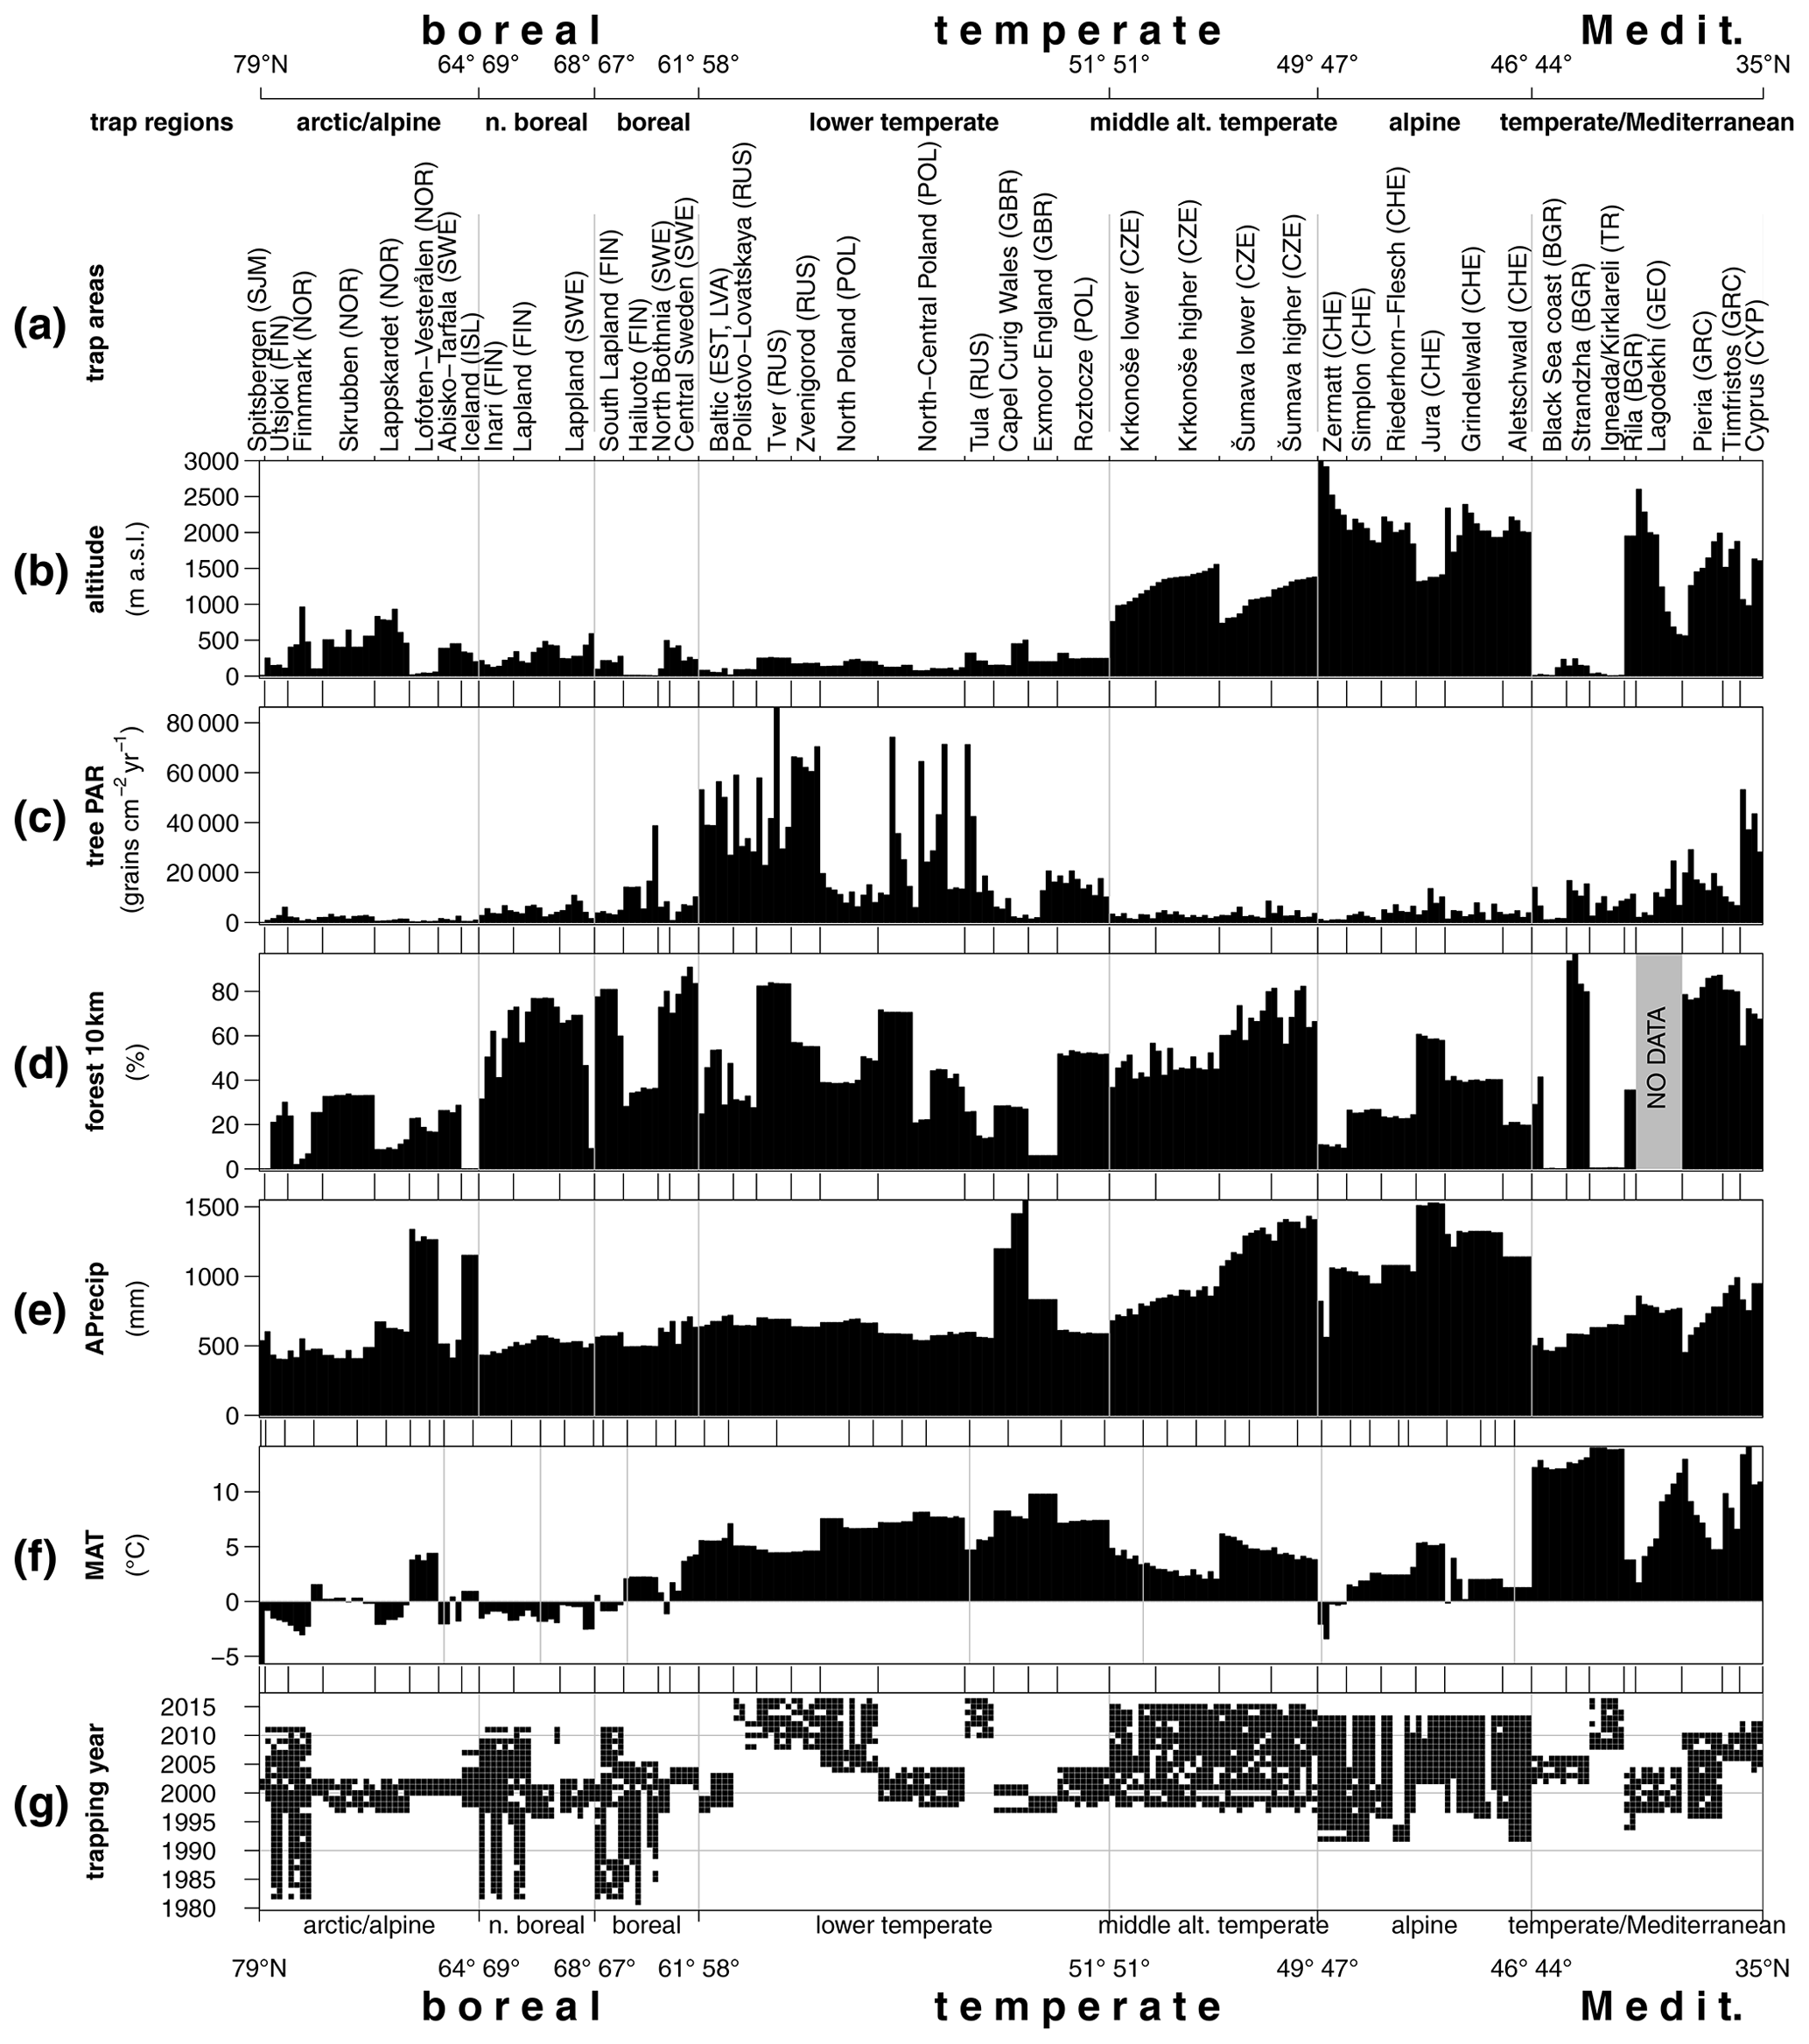
Figure 2Environmental setting of the trap dataset. (a) Trap areas ordered from north (left) to south (right), (b) altitude, (c) mean annual tree PAR, (d) forest cover within a 10 km radius, (e) annual precipitation, (f) temperature: MAT – mean annual temperature and (g) temporal coverage of the PMP database.
3.2 Dependence of variation in PAR on regional forest cover and climate
Total PAR is generally lower at high latitudes, with the lowest values in the arctic/alpine region (trap area Spitsbergen), where no trees can grow. However, the highest absolute values of tree PAR are not from the southernmost traps but from the lowland temperate region (trap area Tver; Fig. 2). Latitude alone explains about 11 % of the variance in log-transformed tree PAR, while MAT and forest cover within 10 km explain 21 % and 19 % respectively. In combination, these three variables explain 37 % of the variation in log-transformed absolute tree pollen deposition. The addition of elevation increased the amount of variance explained to 50 % (Table S4a).
Large differences in the pollen productivity between different trees affect this relationship. Adjusting the PAR from individual taxa by Andersen factors reduces the bias of differential pollen production between different plants and makes it possible to consider the total amount of pollen deposition including grasses. This adjustment increases the amount of variance explained by the regression model with all four explanatory variables to 56 % (Table S4b). Due to the inclusion of grasses, the explanatory power of forest cover within 10 km is reduced, while latitude alone explains 37 % of the Andersen adjusted log-transformed total PAR (Fig. 3a, Table S4b).
The regression models consider the full range of the data while, due to local factors, there is often a spread of average trap values for different traps in the same region. The traps with the highest regional values do not follow a latitudinal pattern, so the distribution of the minimum average trap values is more informative (Fig. 3a). These lower values closely follow a latitudinal trend. The average PAR south of 62∘ latitude and below the altitudinal treeline or close to forests is generally higher than 1000 grains cm−2 yr−1. The coastal grassland in northern Bulgaria is a southern area with a particularly low PAR. The rendzina soils formed on limestone rock in this area host only sparse vegetation which produces generally low PAR. Adjusting the PAR values by Andersen factors increases the values for this region so that they fit the general latitudinal trend (Fig. 3a). Traps with minimum average PAR values per region also correspond well with the forest cover within 10 km (Fig. 3b). The traps with the lowest PAR per 3 % wide bin of forest cover provide a regression model. The relationship predicts a PAR of at least 140 grains cm−2 yr−1 in a treeless vegetation. With each 10 % of forest cover within 10 km of the trap, tree PAR increases at least by 400 grains cm−2 yr−1.
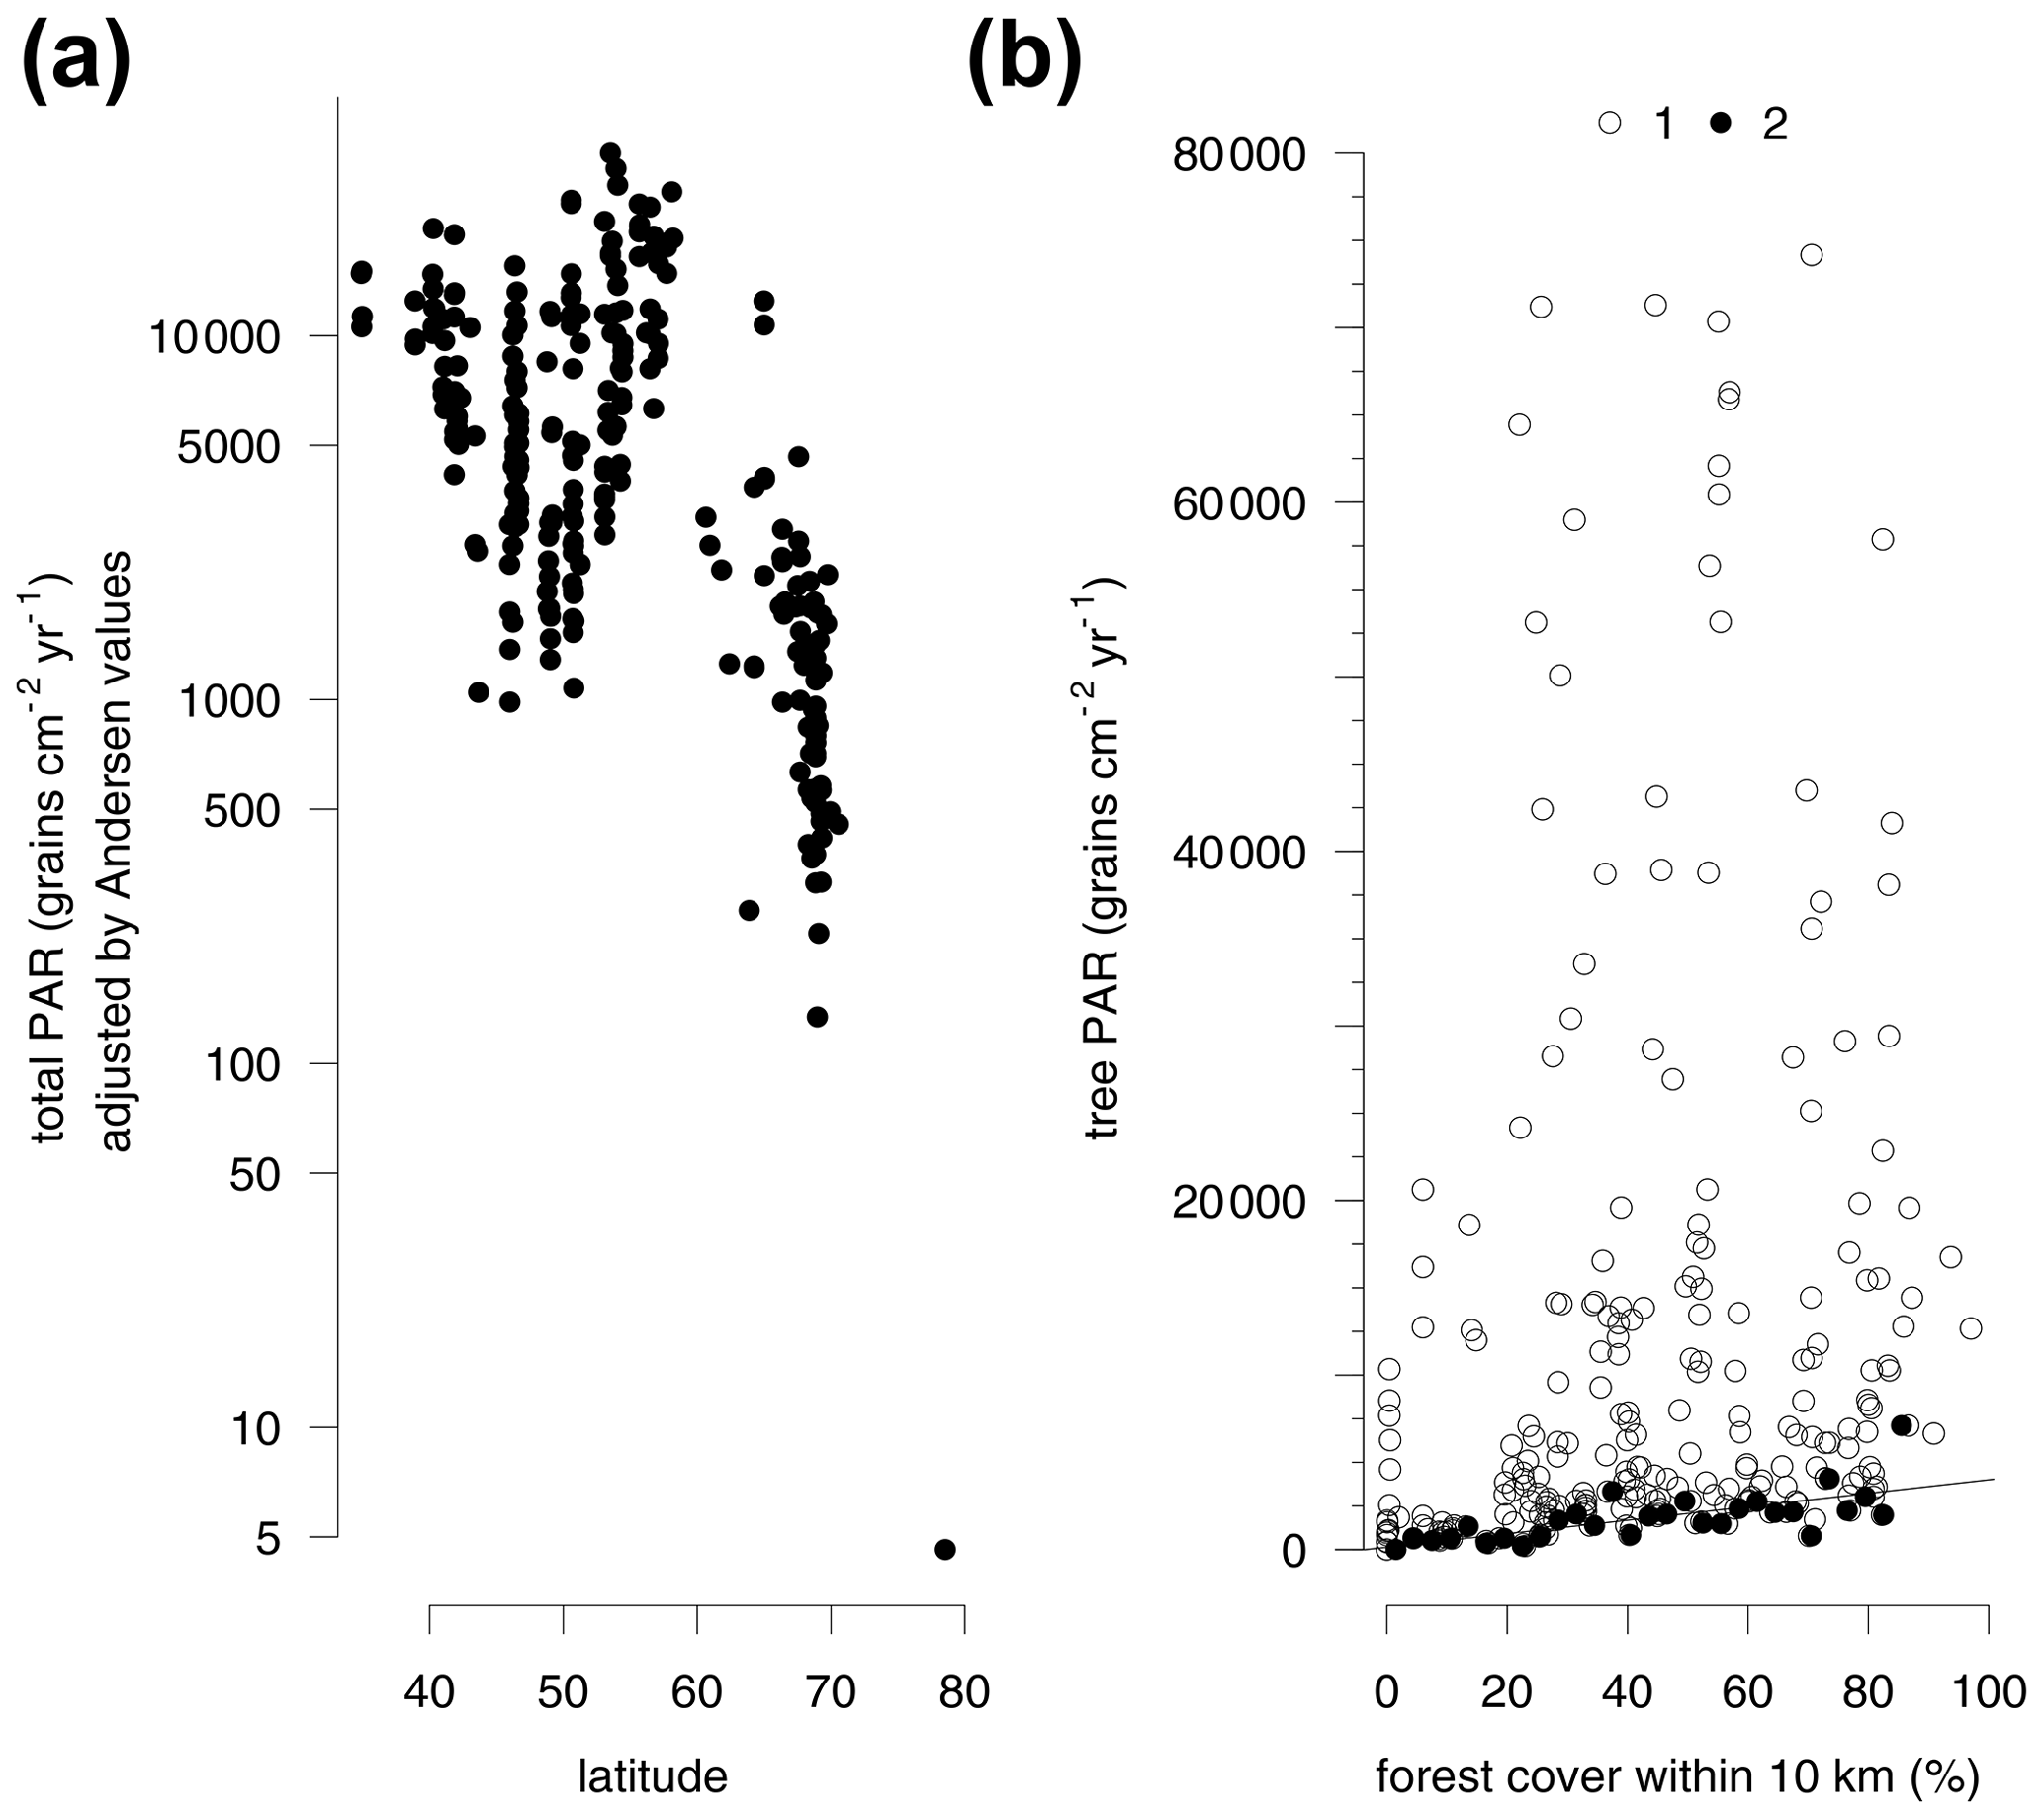
Figure 3Latitudinal gradient in pollen accumulation rates of major tree taxa and Poaceae and Cyperaceae (total PAR) adjusted by Andersen values (see Table S2) of pollen representation (a). Relationship between forest cover within 10 km radius and tree PAR (b). All trap sites (1) and minimum tree PAR for every 3 % of forest cover (2).
3.3 Long-distance-dispersed pollen
The comparison of PAR with the distribution limits of different tree taxa shows that PAR generally declines with distance (Fig. 4). A gradual decline is best documented for Quercus where traps cover different distances from the distribution area. This analysis also documents the long-distance transport of many tree pollen, including the heavy pollen of Picea. For better comparison of the absolute values between taxa, we fitted a linear relationship, also to compare the amount of pollen at 200 km from the distribution limit (Fig. 4b). This comparison indicates that fewer than 80 grains cm−2 yr−1 are deposited beyond 200 km of the distribution of the parent trees of Carpinus, Corylus, Fagus, Fraxinus, Quercus and Tilia. For Picea alone the values drop rapidly so that less than 1 grain cm−2 yr−1 may be expected beyond 200 km of the distribution range. In the case of Fagus the interpolation yielded the highest values for the distance of 200 km; however, this is based on few data points and the interpolation procedure. Only one trap beyond 200 km of the distribution of the tree recorded more than 30 grains cm−2 yr−1. Three remaining traps beyond 1000 km have PAR of Fagus <1 grain cm−2 yr−1, and such values are biased by the size of the pollen count, while still influencing the regression.
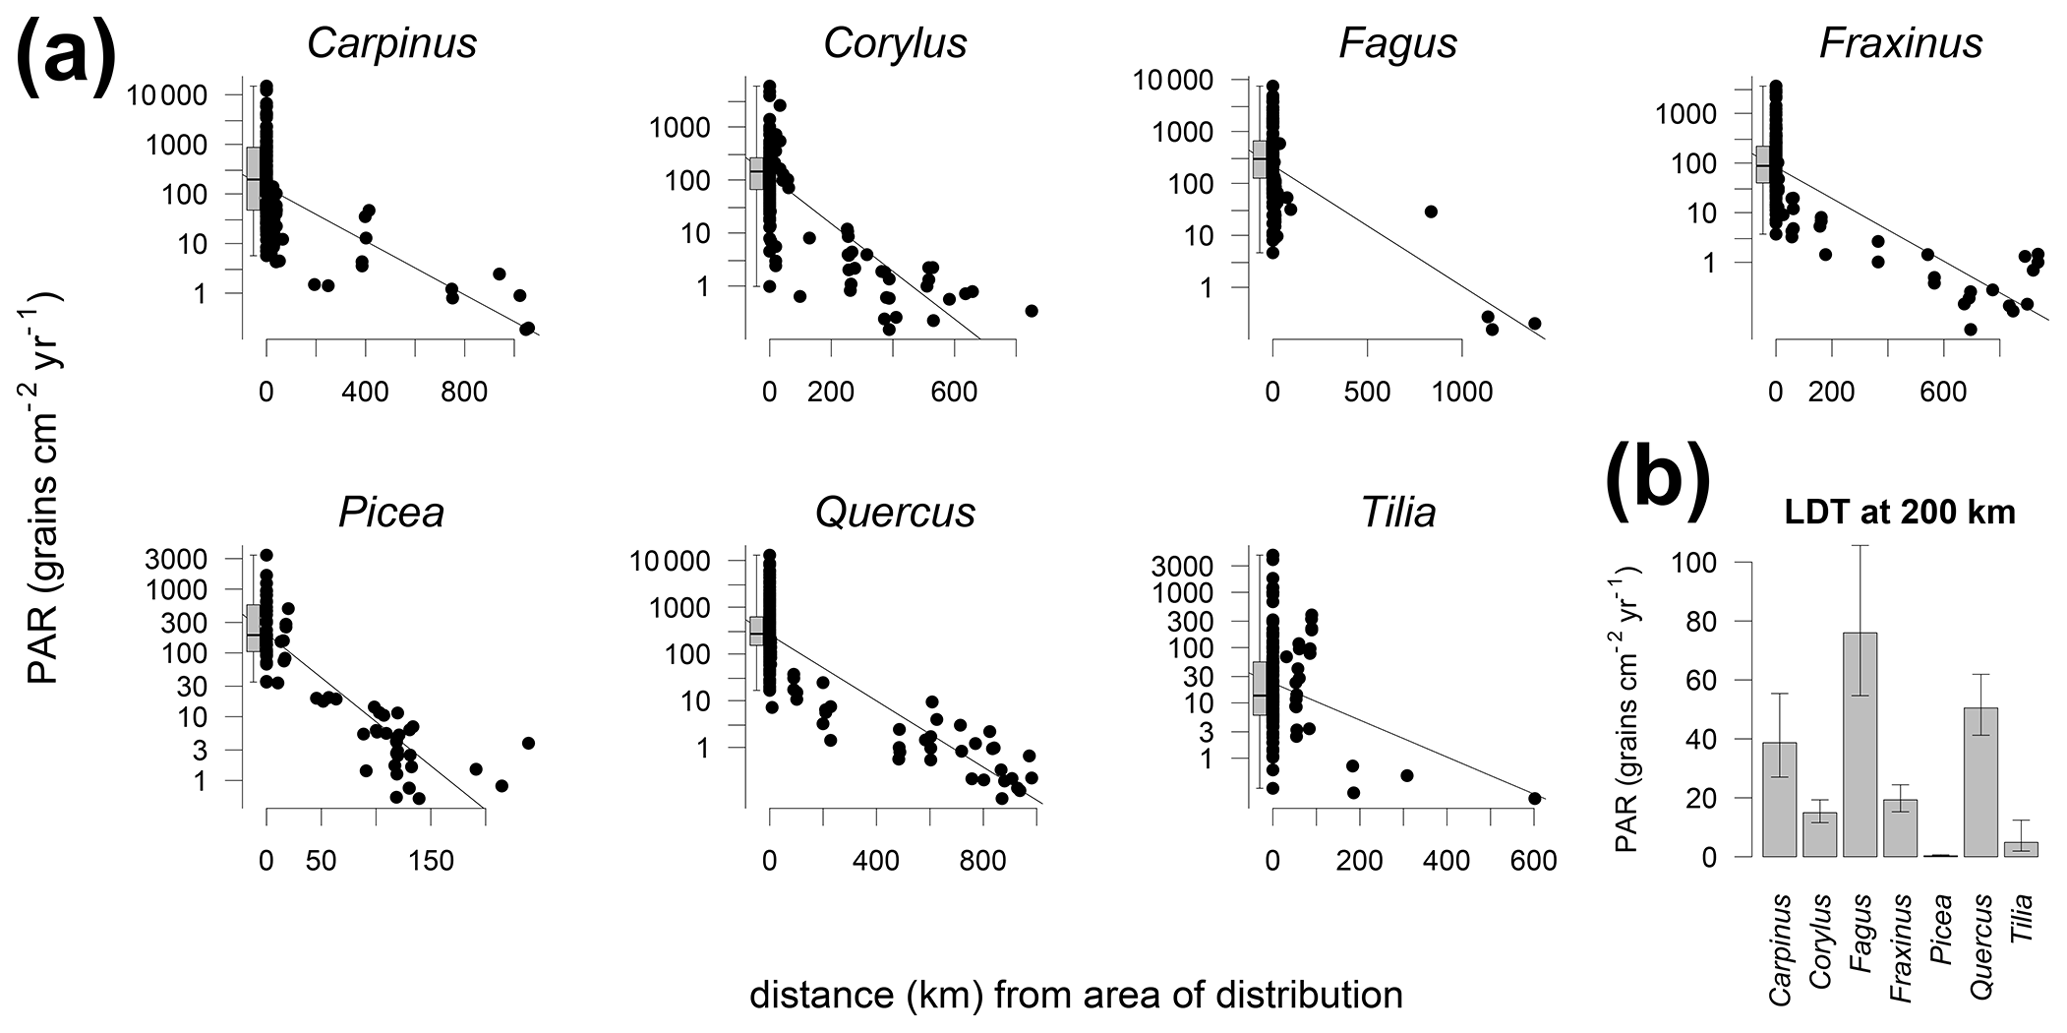
Figure 4Relationship between the distance from the trap site to the nearest area of species distribution and PAR for selected trees. Zero distance represents edge of distribution area. Traps within the distribution area are aggregated in boxplots (a). PAR of the long-distance transport (b) calculated from linear regression at 200 km (a).
3.4 Ranges of modern and fossil PAR values
The comparison of modern and fossil PAR values shows good agreement for tree PAR. The highest frequency of tree PAR values ranges between 2000 and 10 000 grains cm−2 yr−1 in both datasets (Fig. 5). Maximum PARs of the trap dataset are higher (often 10 times) for all species compared to maximum PAR in the fossil dataset, with the exception of Corylus. The frequency distribution of PAR is log-normal for Alnus, Tilia and Fraxinus. A strong bimodal distribution of values can be recognized for fossil samples of Picea and Poaceae (Fig. 5). Such a bimodality, but less clear, occurs for the modern samples of Pinus and for fossil samples of Abies and Fagus. The highest frequency of trap values for Carpinus, Fagus and Tilia is very close to the line of the LDT threshold. The LDT threshold for Corylus, Fraxinus and Quercus separates values of the three boreal regions from the rest of the regions. The trap values of Picea from the arctic/alpine region are above the LDT threshold. The frequency distribution of modern and fossil PAR shows the best correspondence for Corylus, with most values falling between 100–300 grains cm−2 yr−1 and recent and fossil maxima at around 3000 grains cm−2 yr−1. The greatest difference in the distribution of modern versus fossil PAR occurs for Juniperus, where maximum values are around 100 times larger in the traps. Minimum PARs are about 10 times higher in the traps for Poaceae and Cyperaceae, in particular, and the right side of the distribution is shifted upwards.
Using the 15 selected taxa in seven trap regions and the occurrence of the pollen types, we obtained 92 pairs of trap and fossil data. The frequency distribution of PAR values is similar between modern and fossil samples in 31 of these pairs based on a t test and a p value >0.05 (Fig. 5, Table S6). In this regional comparison, Betula shows the best agreement between modern and fossil values. Values are similar in four regions across the gradient, with the highest values of 5400 grains cm−2 yr−1 in the lowland temperate region and the lowest values of 34 grains cm−2 yr−1 in the temperate/Mediterranean region, where the parent trees are generally absent. Modern and fossil PARs generally correspond well for the lowland temperate region where, in addition to Betula, Alnus, Carpinus, Cyperaceae, Fraxinus, Picea, Pinus and Quercus also have similar values. Although Corylus has a good overall agreement, the regions with similar modern to fossil data are shifted, with Holocene values in the boreal region corresponding to modern PAR in the lowland temperate region.

Figure 5Difference (differ.) between the mean fossil (−) and the mean trap (∘) PAR per trap region is shown by length of the vertical segment. Paired histograms of mean annual PAR from the fossil record (on the left) and from traps (on the right). Colours denote different trap regions and correspond to Fig. 1. Note log-transformed y axis. Horizontal lines and numbering on the secondary y axis denote classes of PAR. For more detail see Fig. 6b and d. LDT is the threshold for long-distance transport.
3.5 Taxa-specific linkage of the highest average PAR at fossil sites with individual trap values
To facilitate the comparison of modern and fossil PAR, the combined taxa-specific values were submitted to a one-dimensional cluster analysis, which resulted in between five and nine classes of PAR values per taxon. Comparing the highest class of fossil PAR to modern trap data on a site-by-site basis shows that it is possible to find modern comparisons for all fossil situations. We demonstrate the main linkage. Detailed descriptions are presented in the Supplement (Fig. S3).
Abies declined in most of the populations; thus Roztocze is the only trap area analogous to fossil sites in central Europe, and similarly the Tymfristos trap area is analogous for fossil sites in southern Europe (Fig. 6). Alnus retreated from Scandinavia; thus the fossil sites are most closely related to the more southerly sites, on the island of Hailuoto or in north Poland. Corylus, Quercus and Tilia (Fig. 7) also declined; thus modern values in north Poland provide analogues for fossil situations in central and northern Europe. Poaceae and Cyperaceae exceed values from fossil examples; thus analogous traps are close to the fossil site. Similarly, Betula and Juniperus have high PARs at only a few trap sites (11 900–73 900 and 870–8300 grains cm−2 yr−1 respectively), whereas the fossil PAR and the rest of the trap dataset are lower, fitting within the first two or three classes. Both taxa find an analogous trap record within the same area; most of the distant links are for the lowest classes (0–5600 and 0–90 grains cm−2 yr−1 respectively). Fossil PARs of Carpinus in north Poland and the Black Sea coast fall within the range of trap records from the same area. Trap areas in the Baltics, Šumava and central Sweden indicate higher fossil than trap PAR of Carpinus. All fossil sites within the recent distribution of Fagus and Picea have the closest analogous trap in the same or adjacent trap area and fossil–trap links are short. Fossil and trap PAR of tree pollen and Pinus are comparable within the trap areas, with the exception of the Baltics and Rila mountains respectively, where the fossil is lower than the trap record. On the other hand, their record from the early Holocene at Prášilské Lake is higher than any trap record from the Šumava mountains.
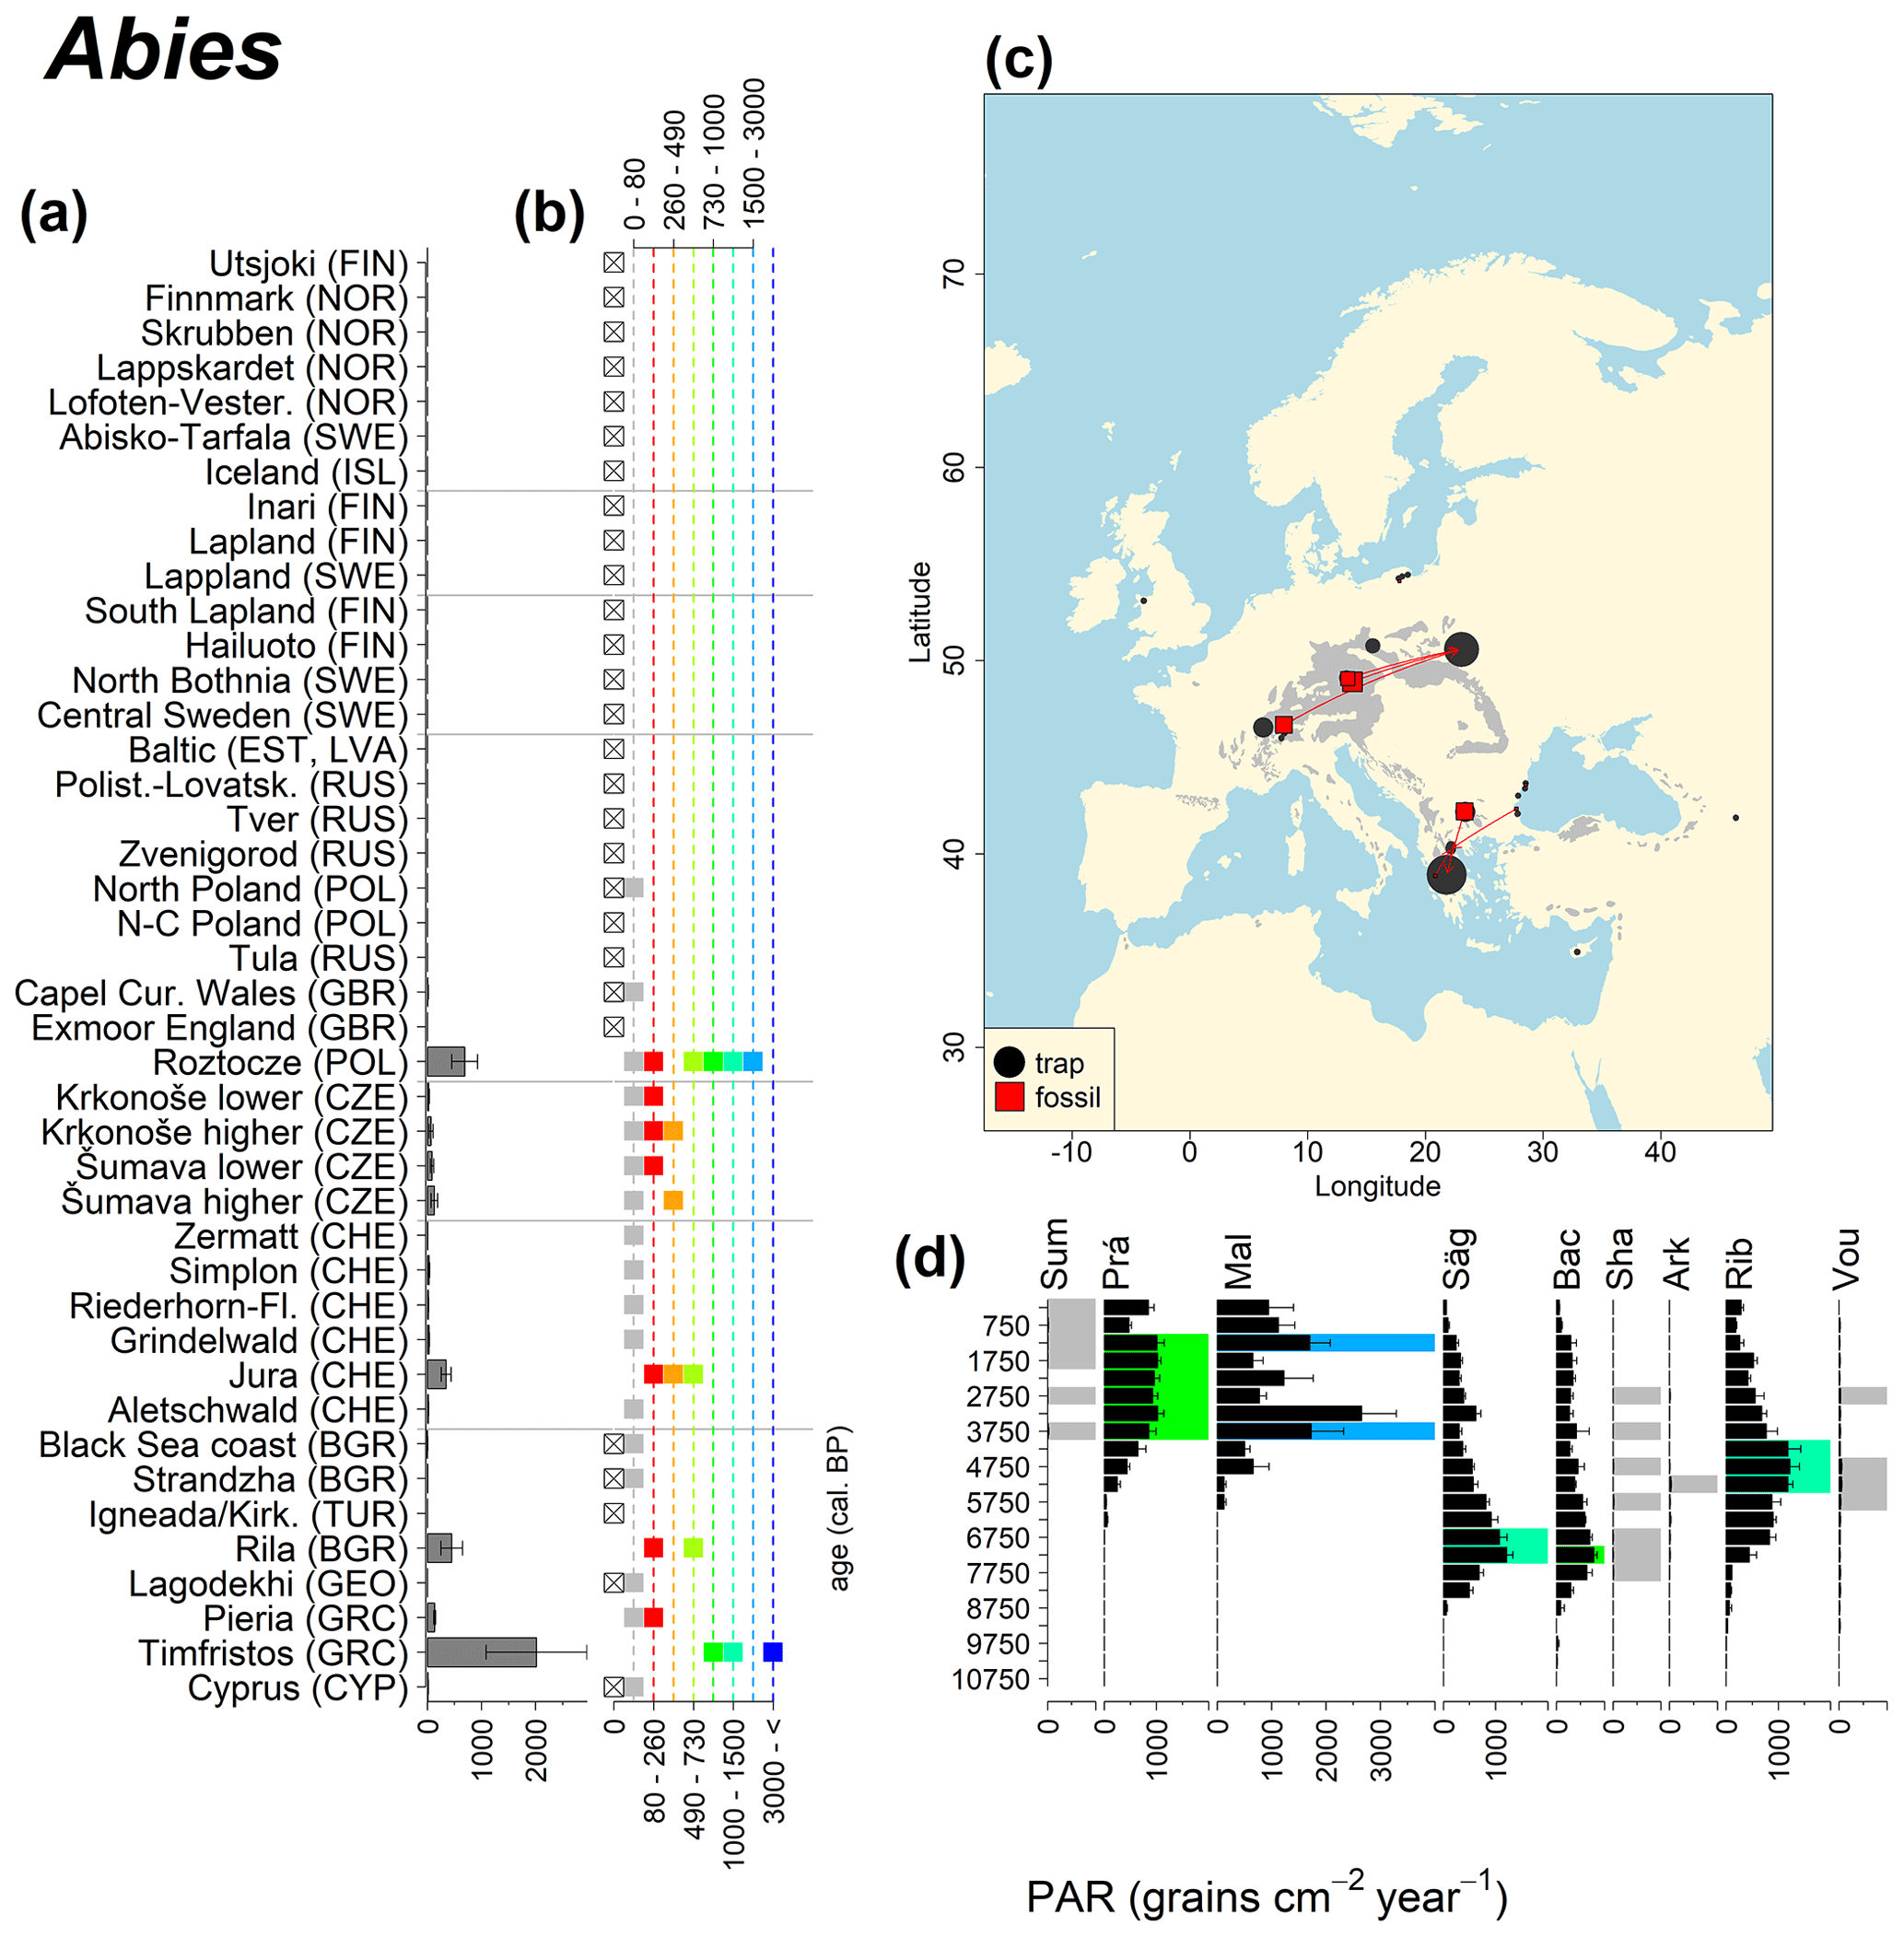
Figure 6(a) Mean modern PAR for selected tree taxa averaged for each trap area. (b) Range of mean individual trap values classified by one-dimensional clustering. Crossed squares indicate that pollen of the taxon was absent from at least one trap from the area. (c) Map of Europe with the distribution of the species (gray; San-Miguel-Ayanz et al., 2016) from the pollen taxa. Size of symbols show classes of PAR in trap record and the highest PAR per fossil record. Arrows show the closest trap with the same class of PAR. (d) Fossil PAR values with the highest PAR class per each record (see Table 1 for full name) highlighted by the corresponding colour for the class (see b). Note the scale of the x axis corresponds to the x-axis scale of graph (a).
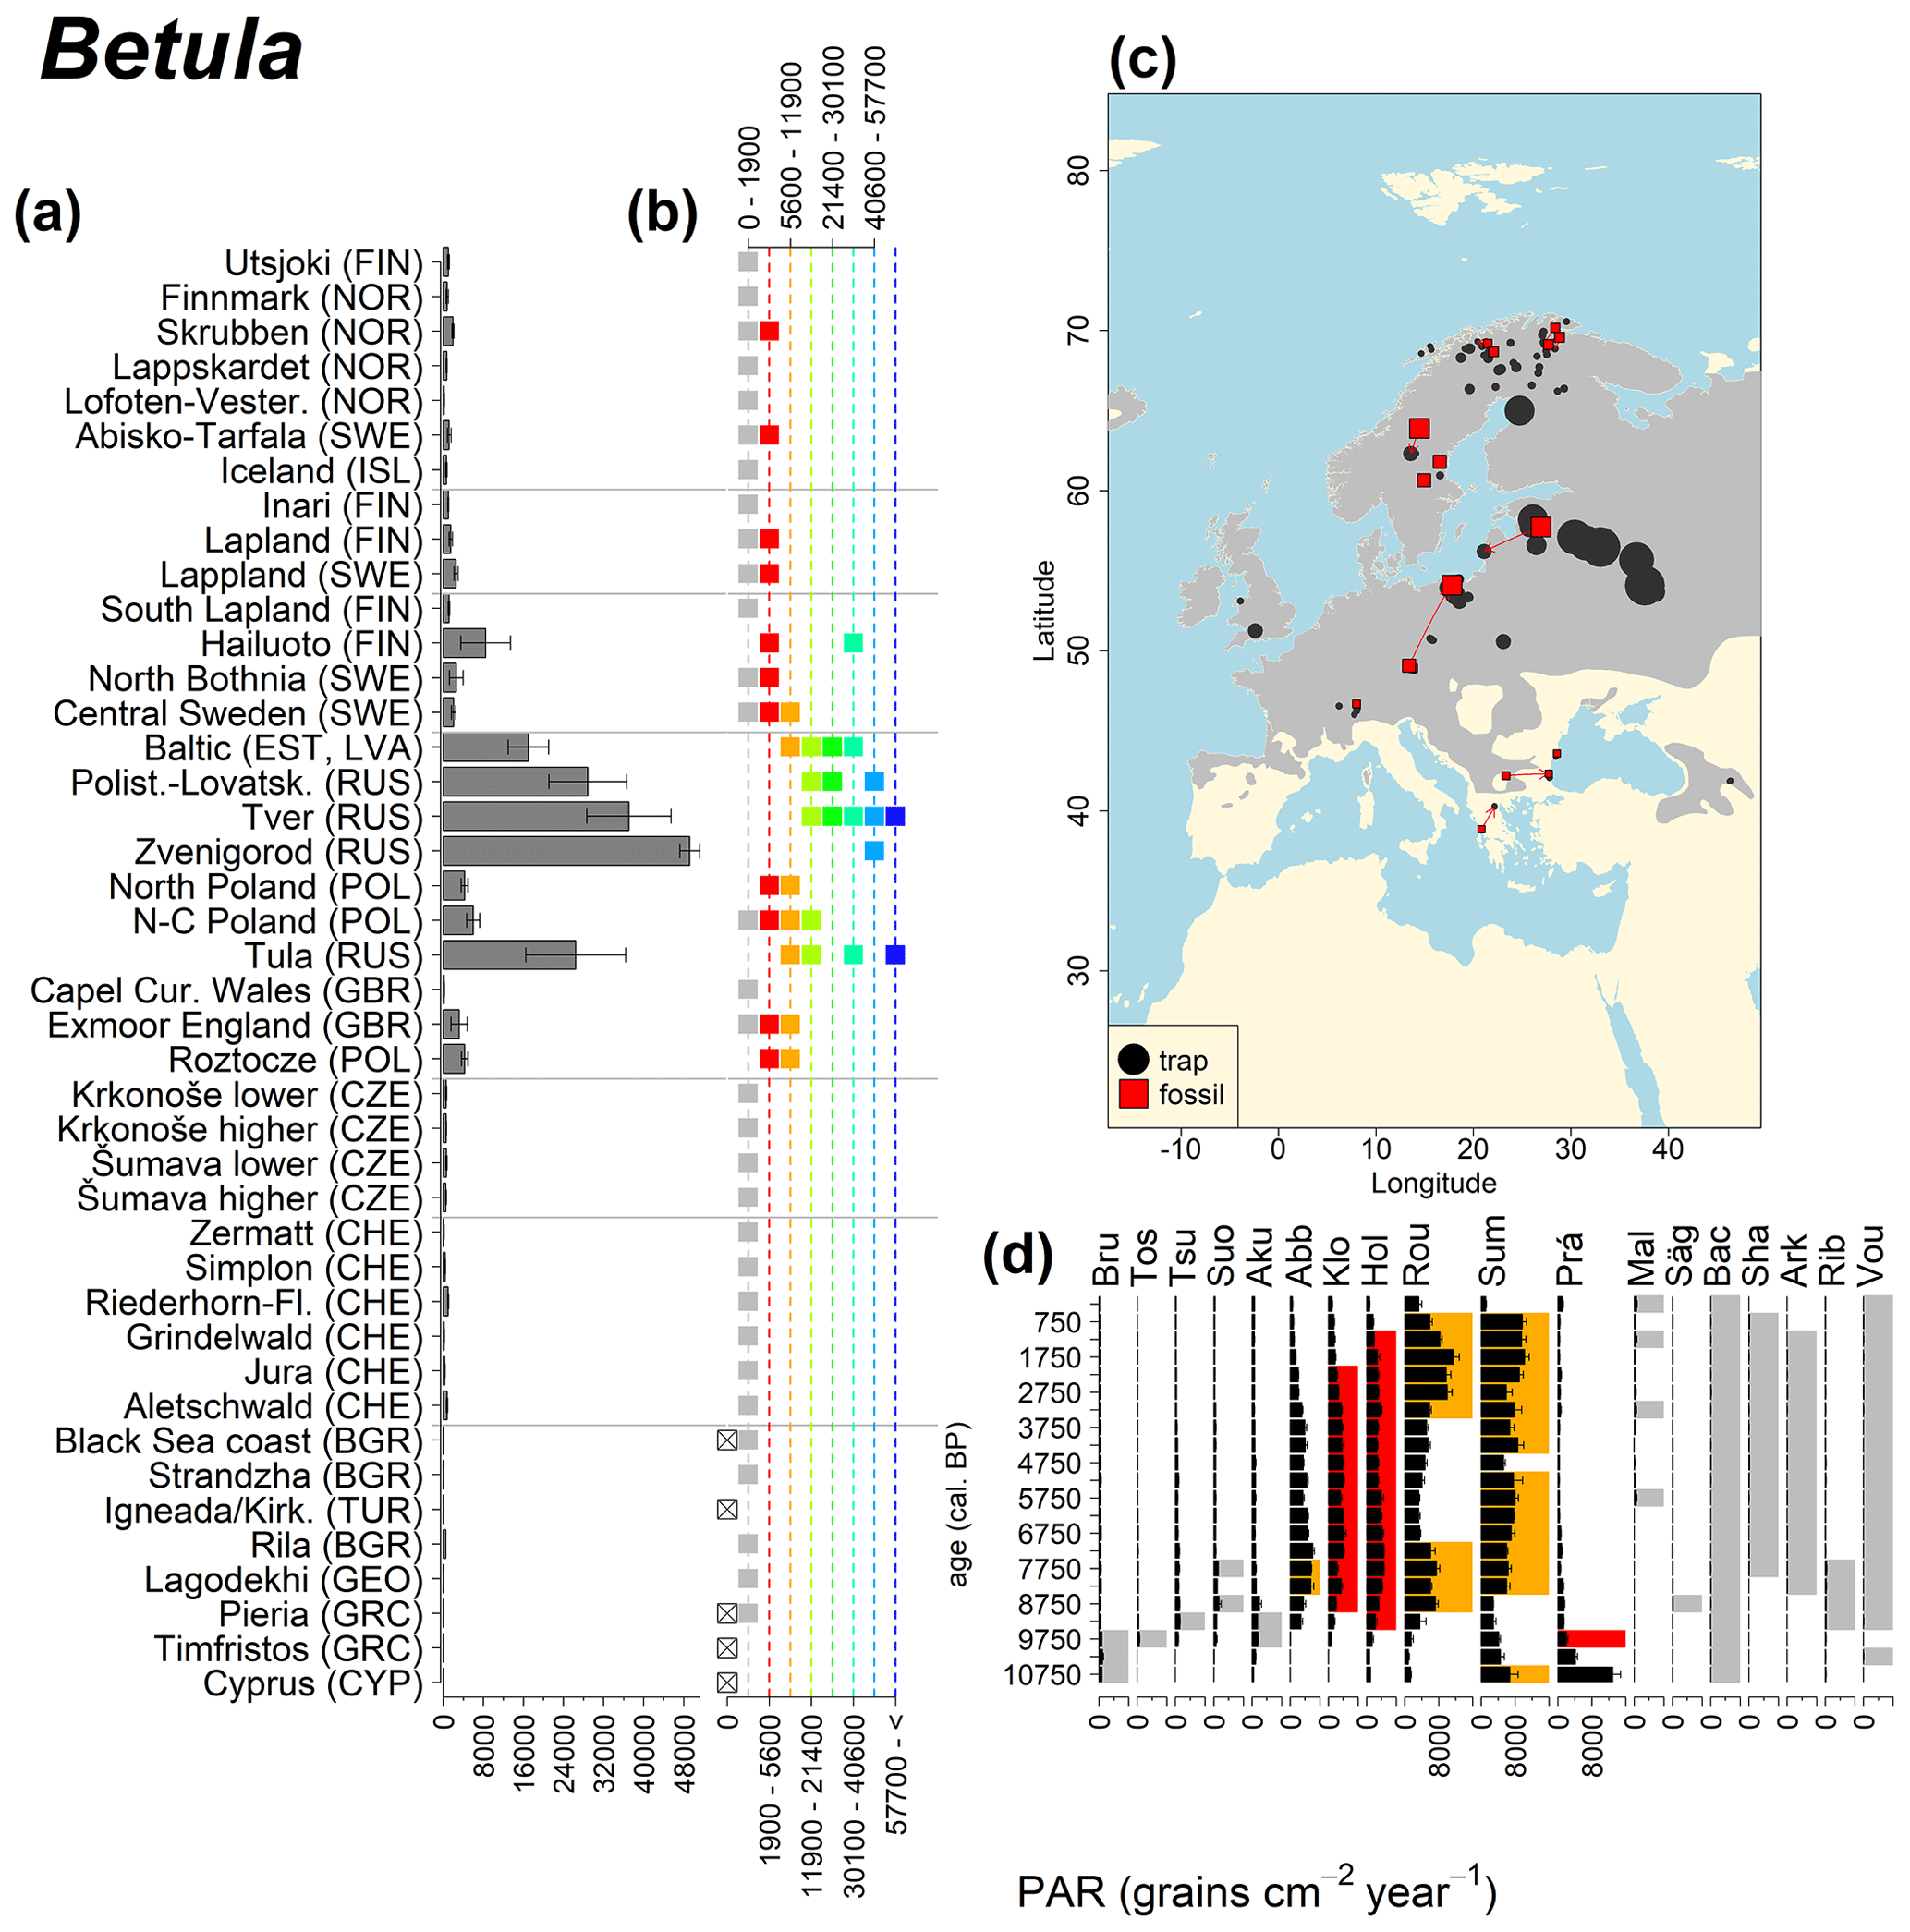
Figure 7See caption Fig. 6 (San-Miguel-Ayanz et al., 2016; Caudullo et al., 2017).
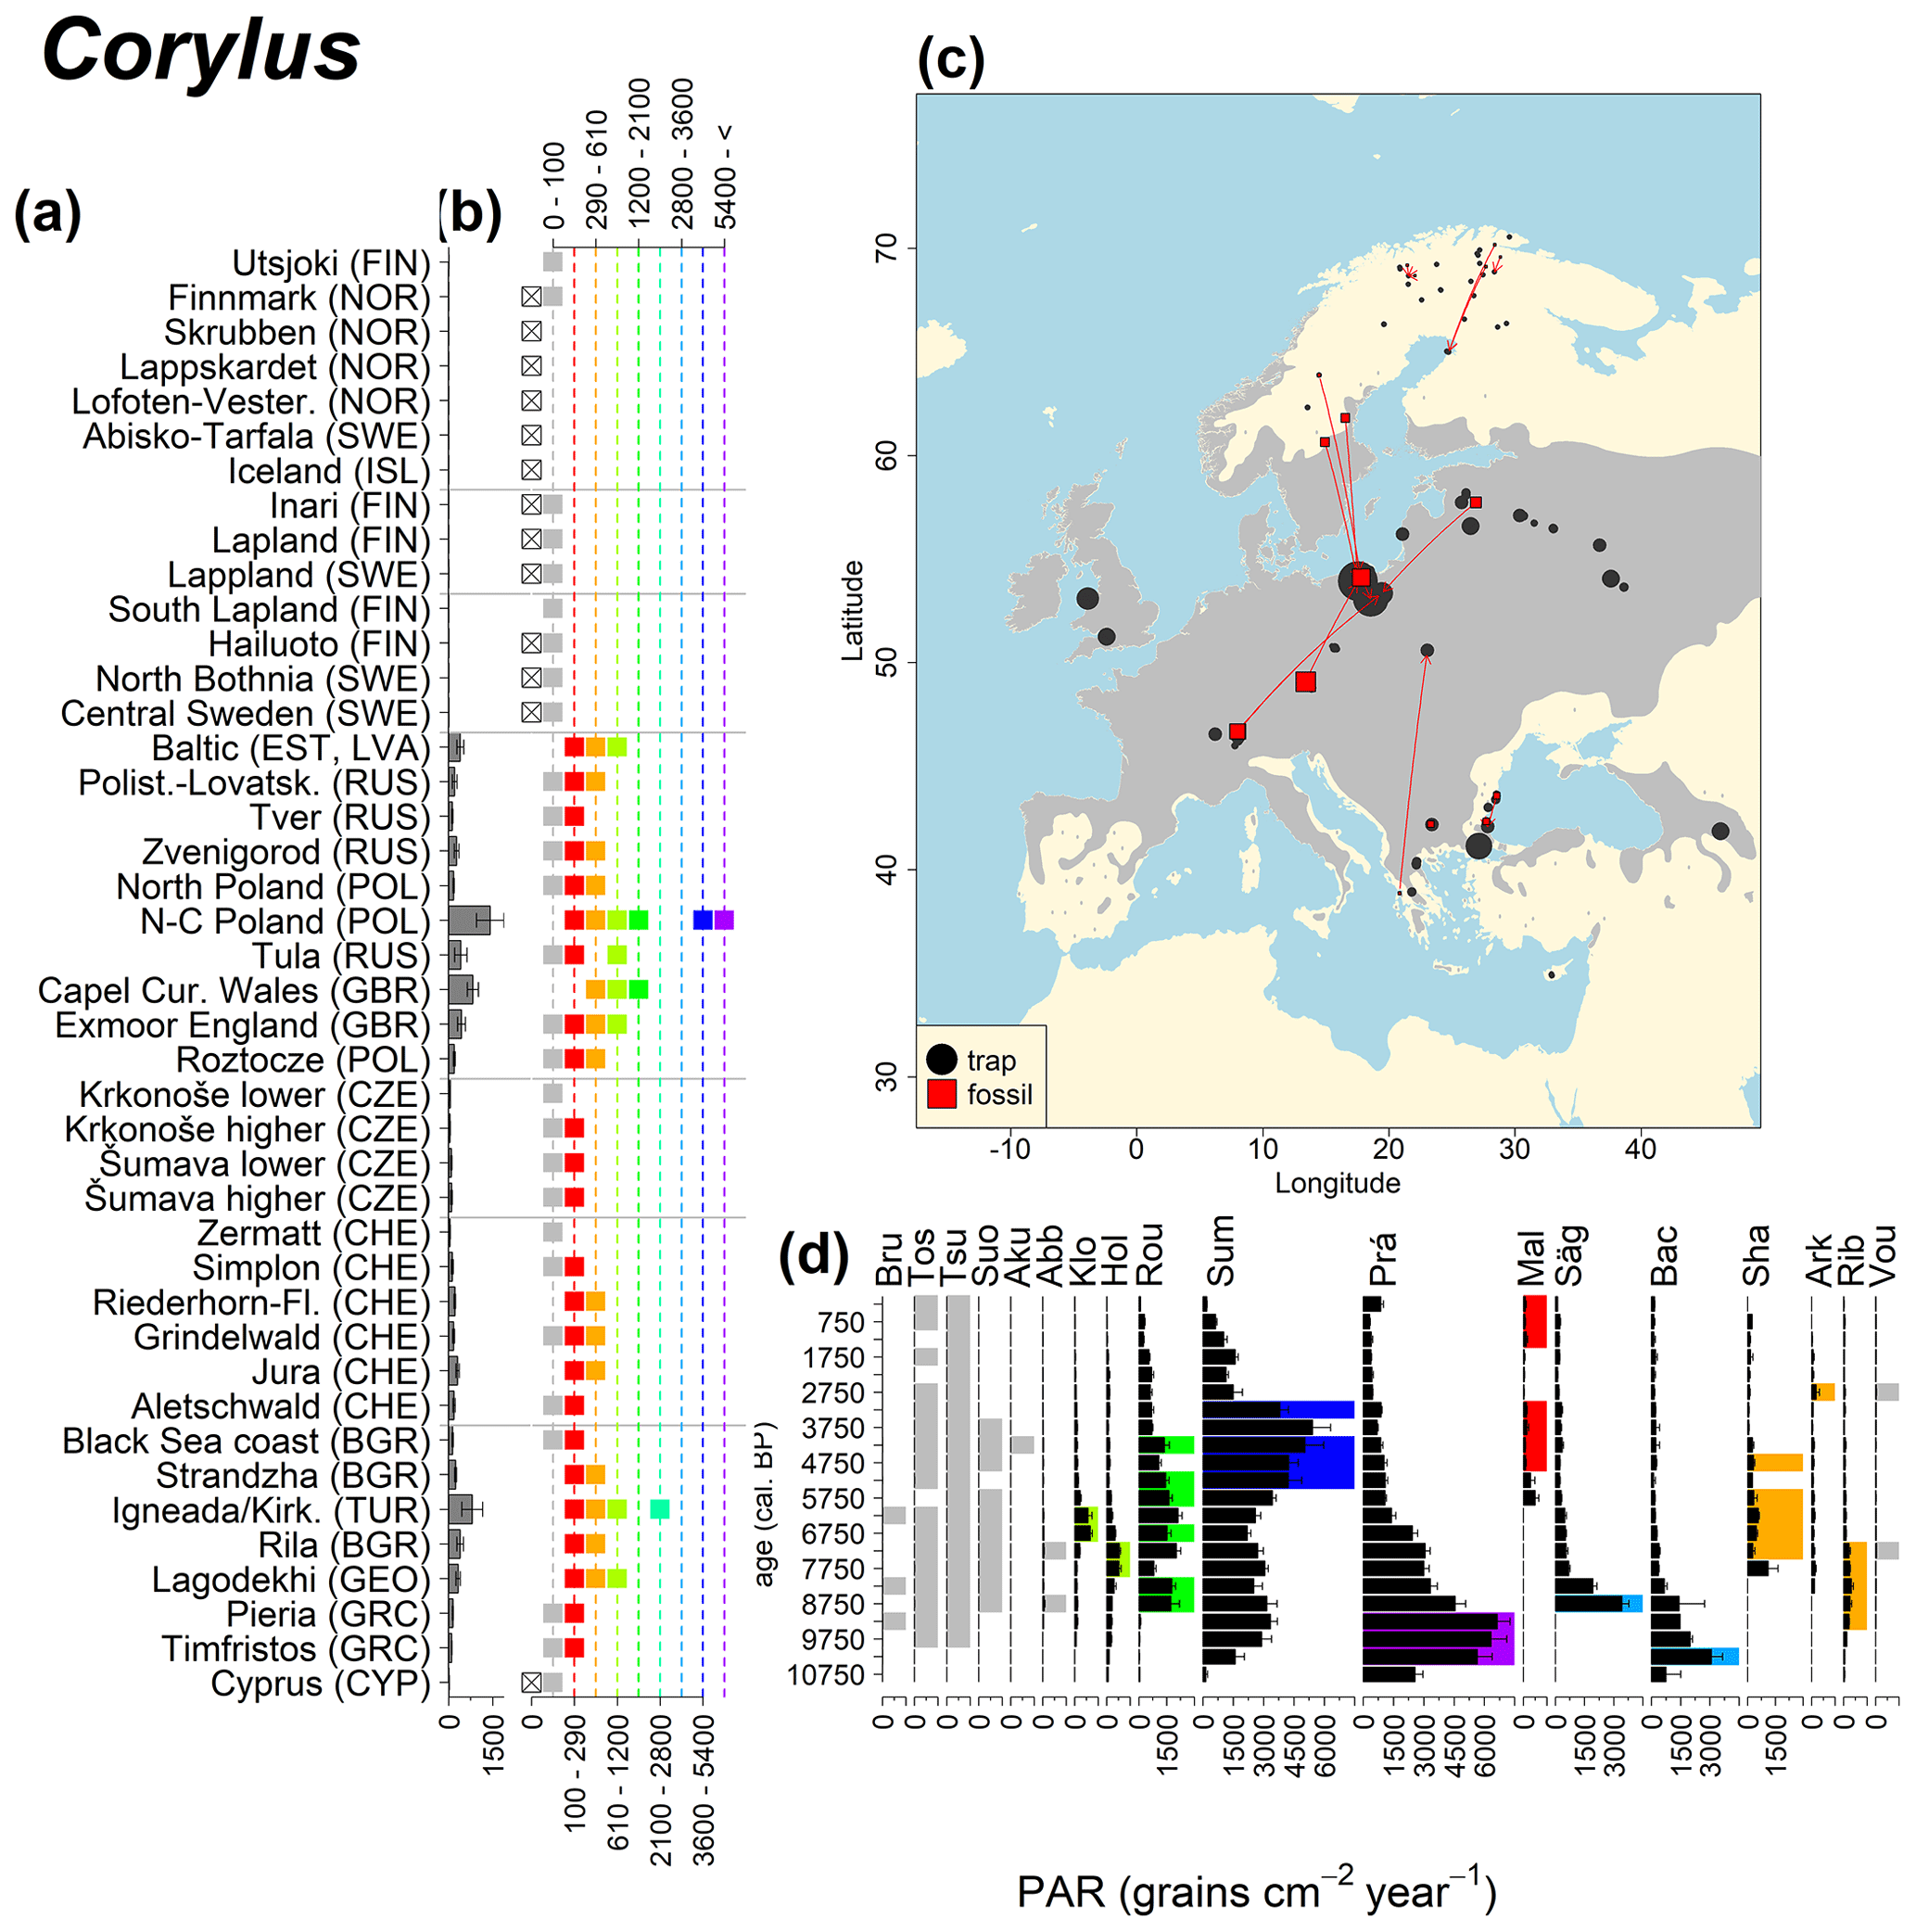
Figure 8See caption Fig. 6 (Caudullo et al., 2017).
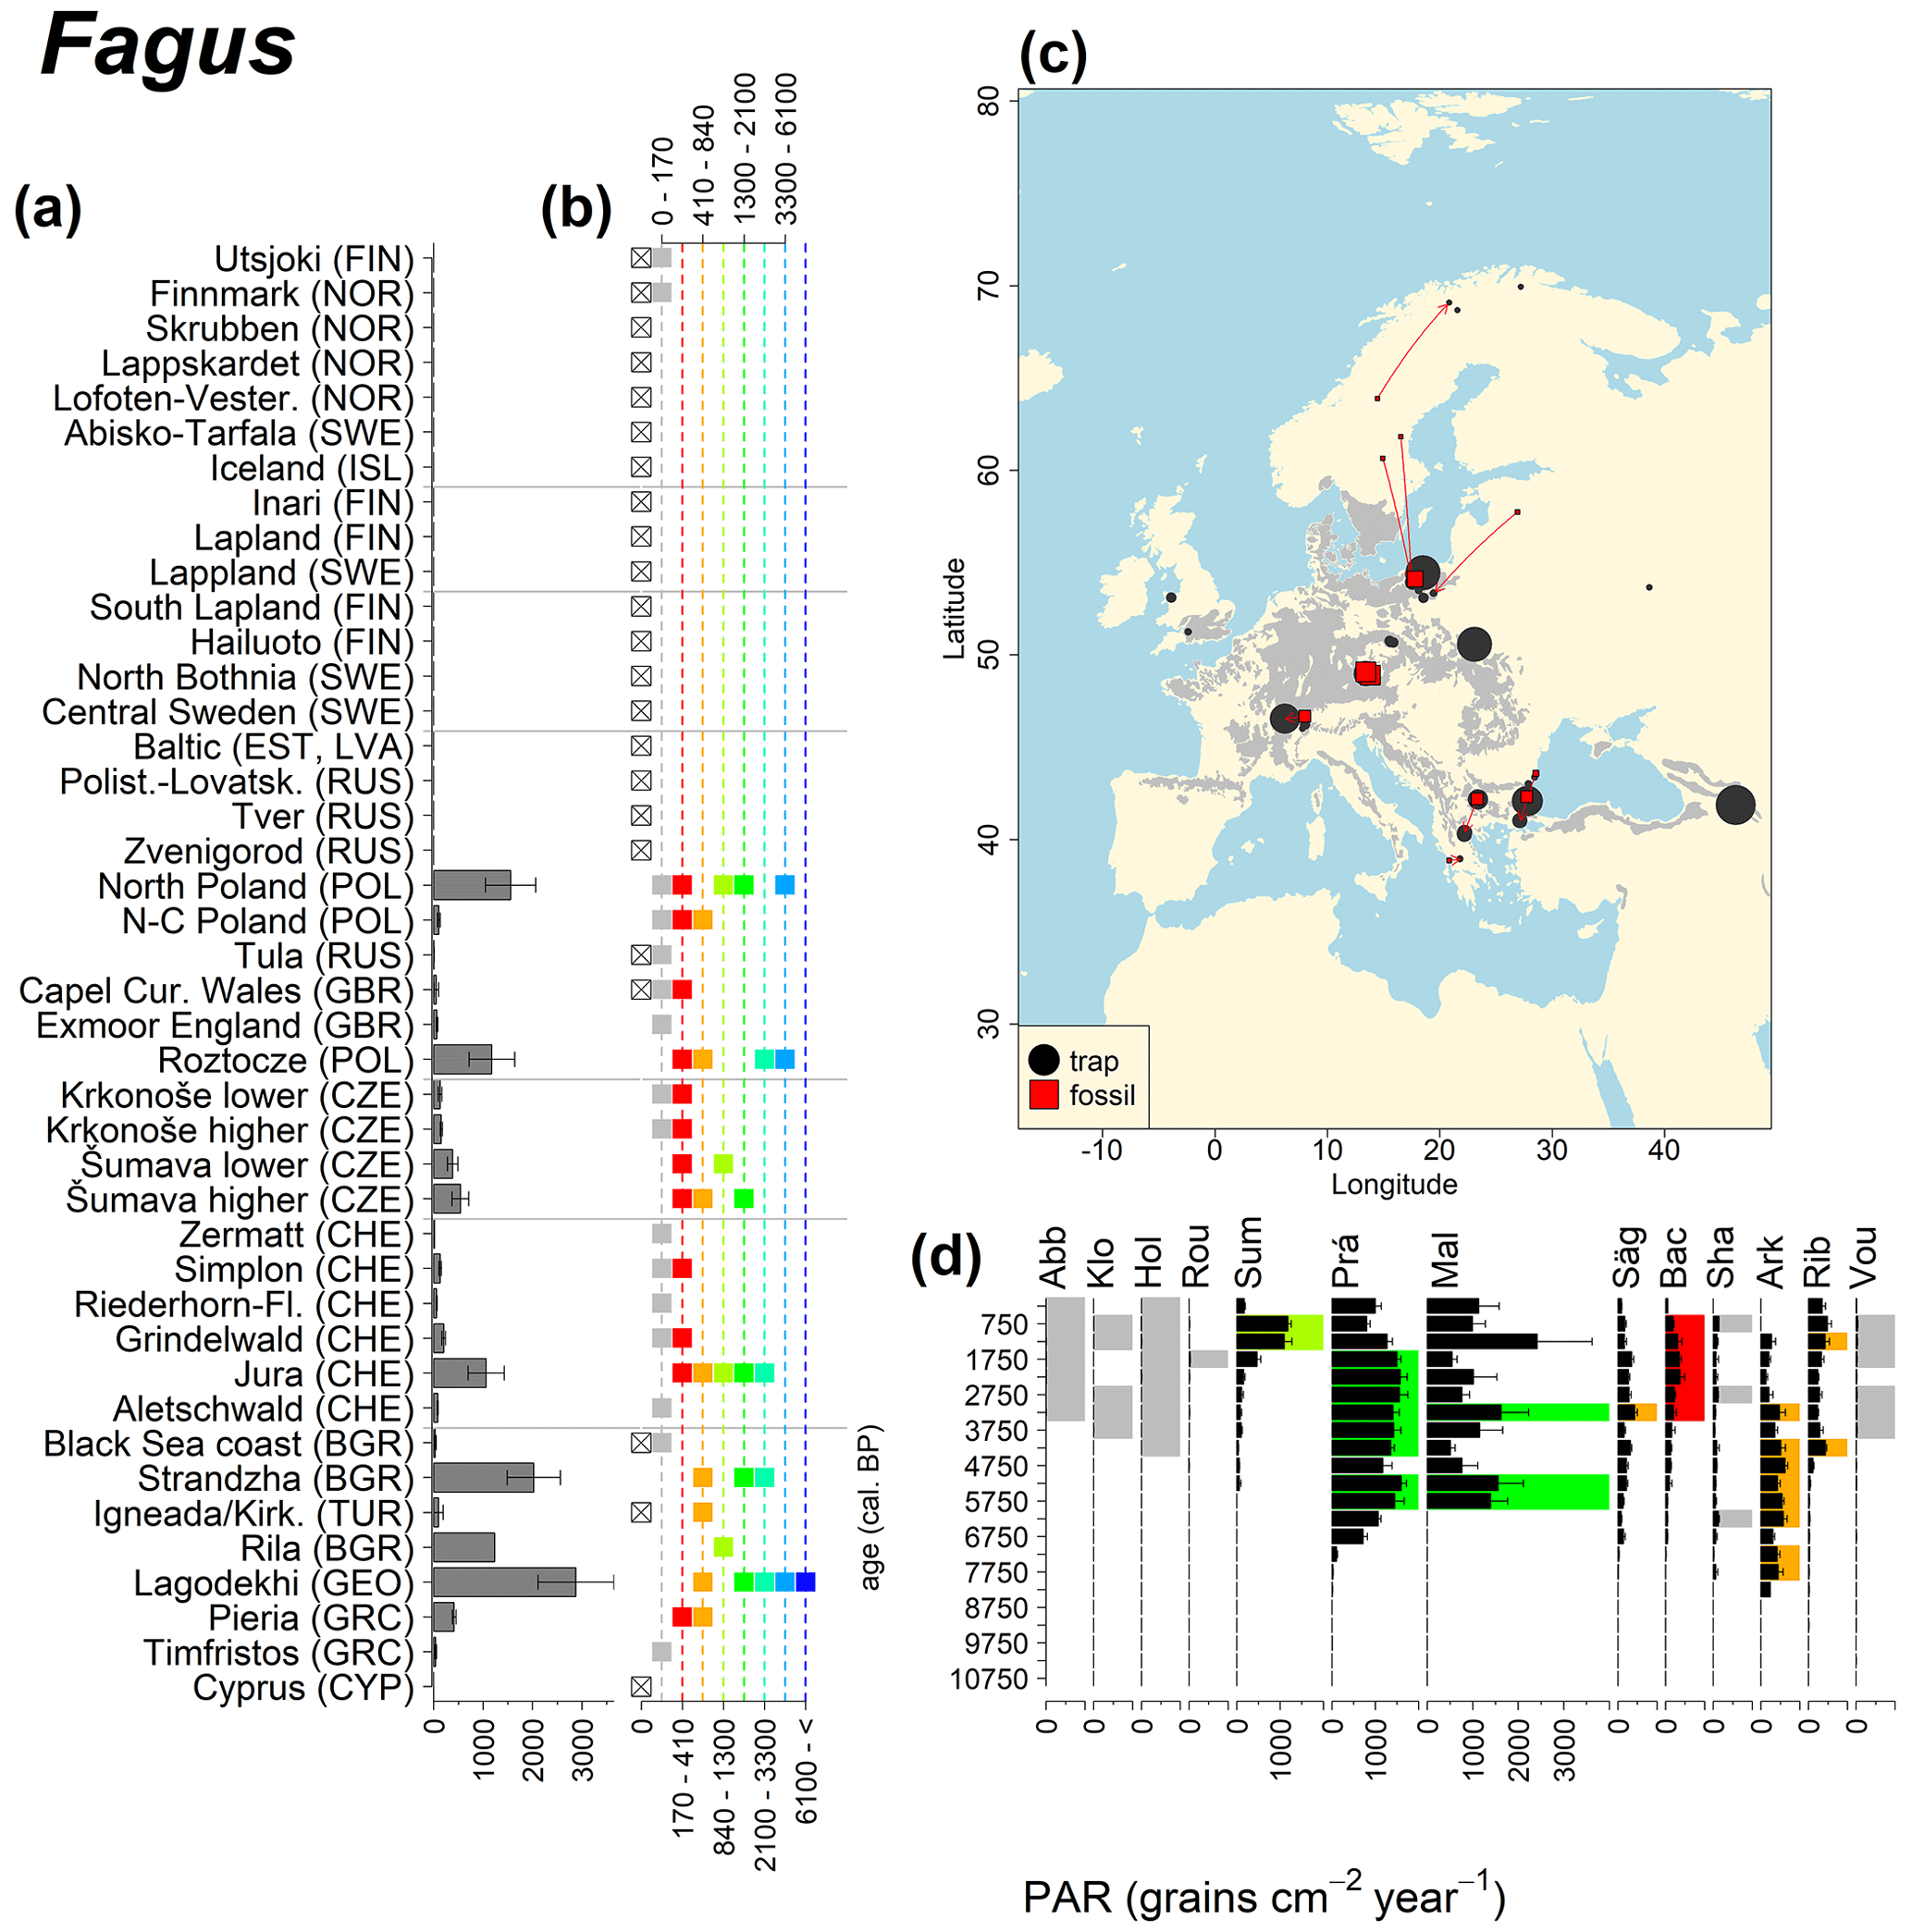
Figure 9See caption Fig. 6 (San-Miguel-Ayanz et al., 2016).
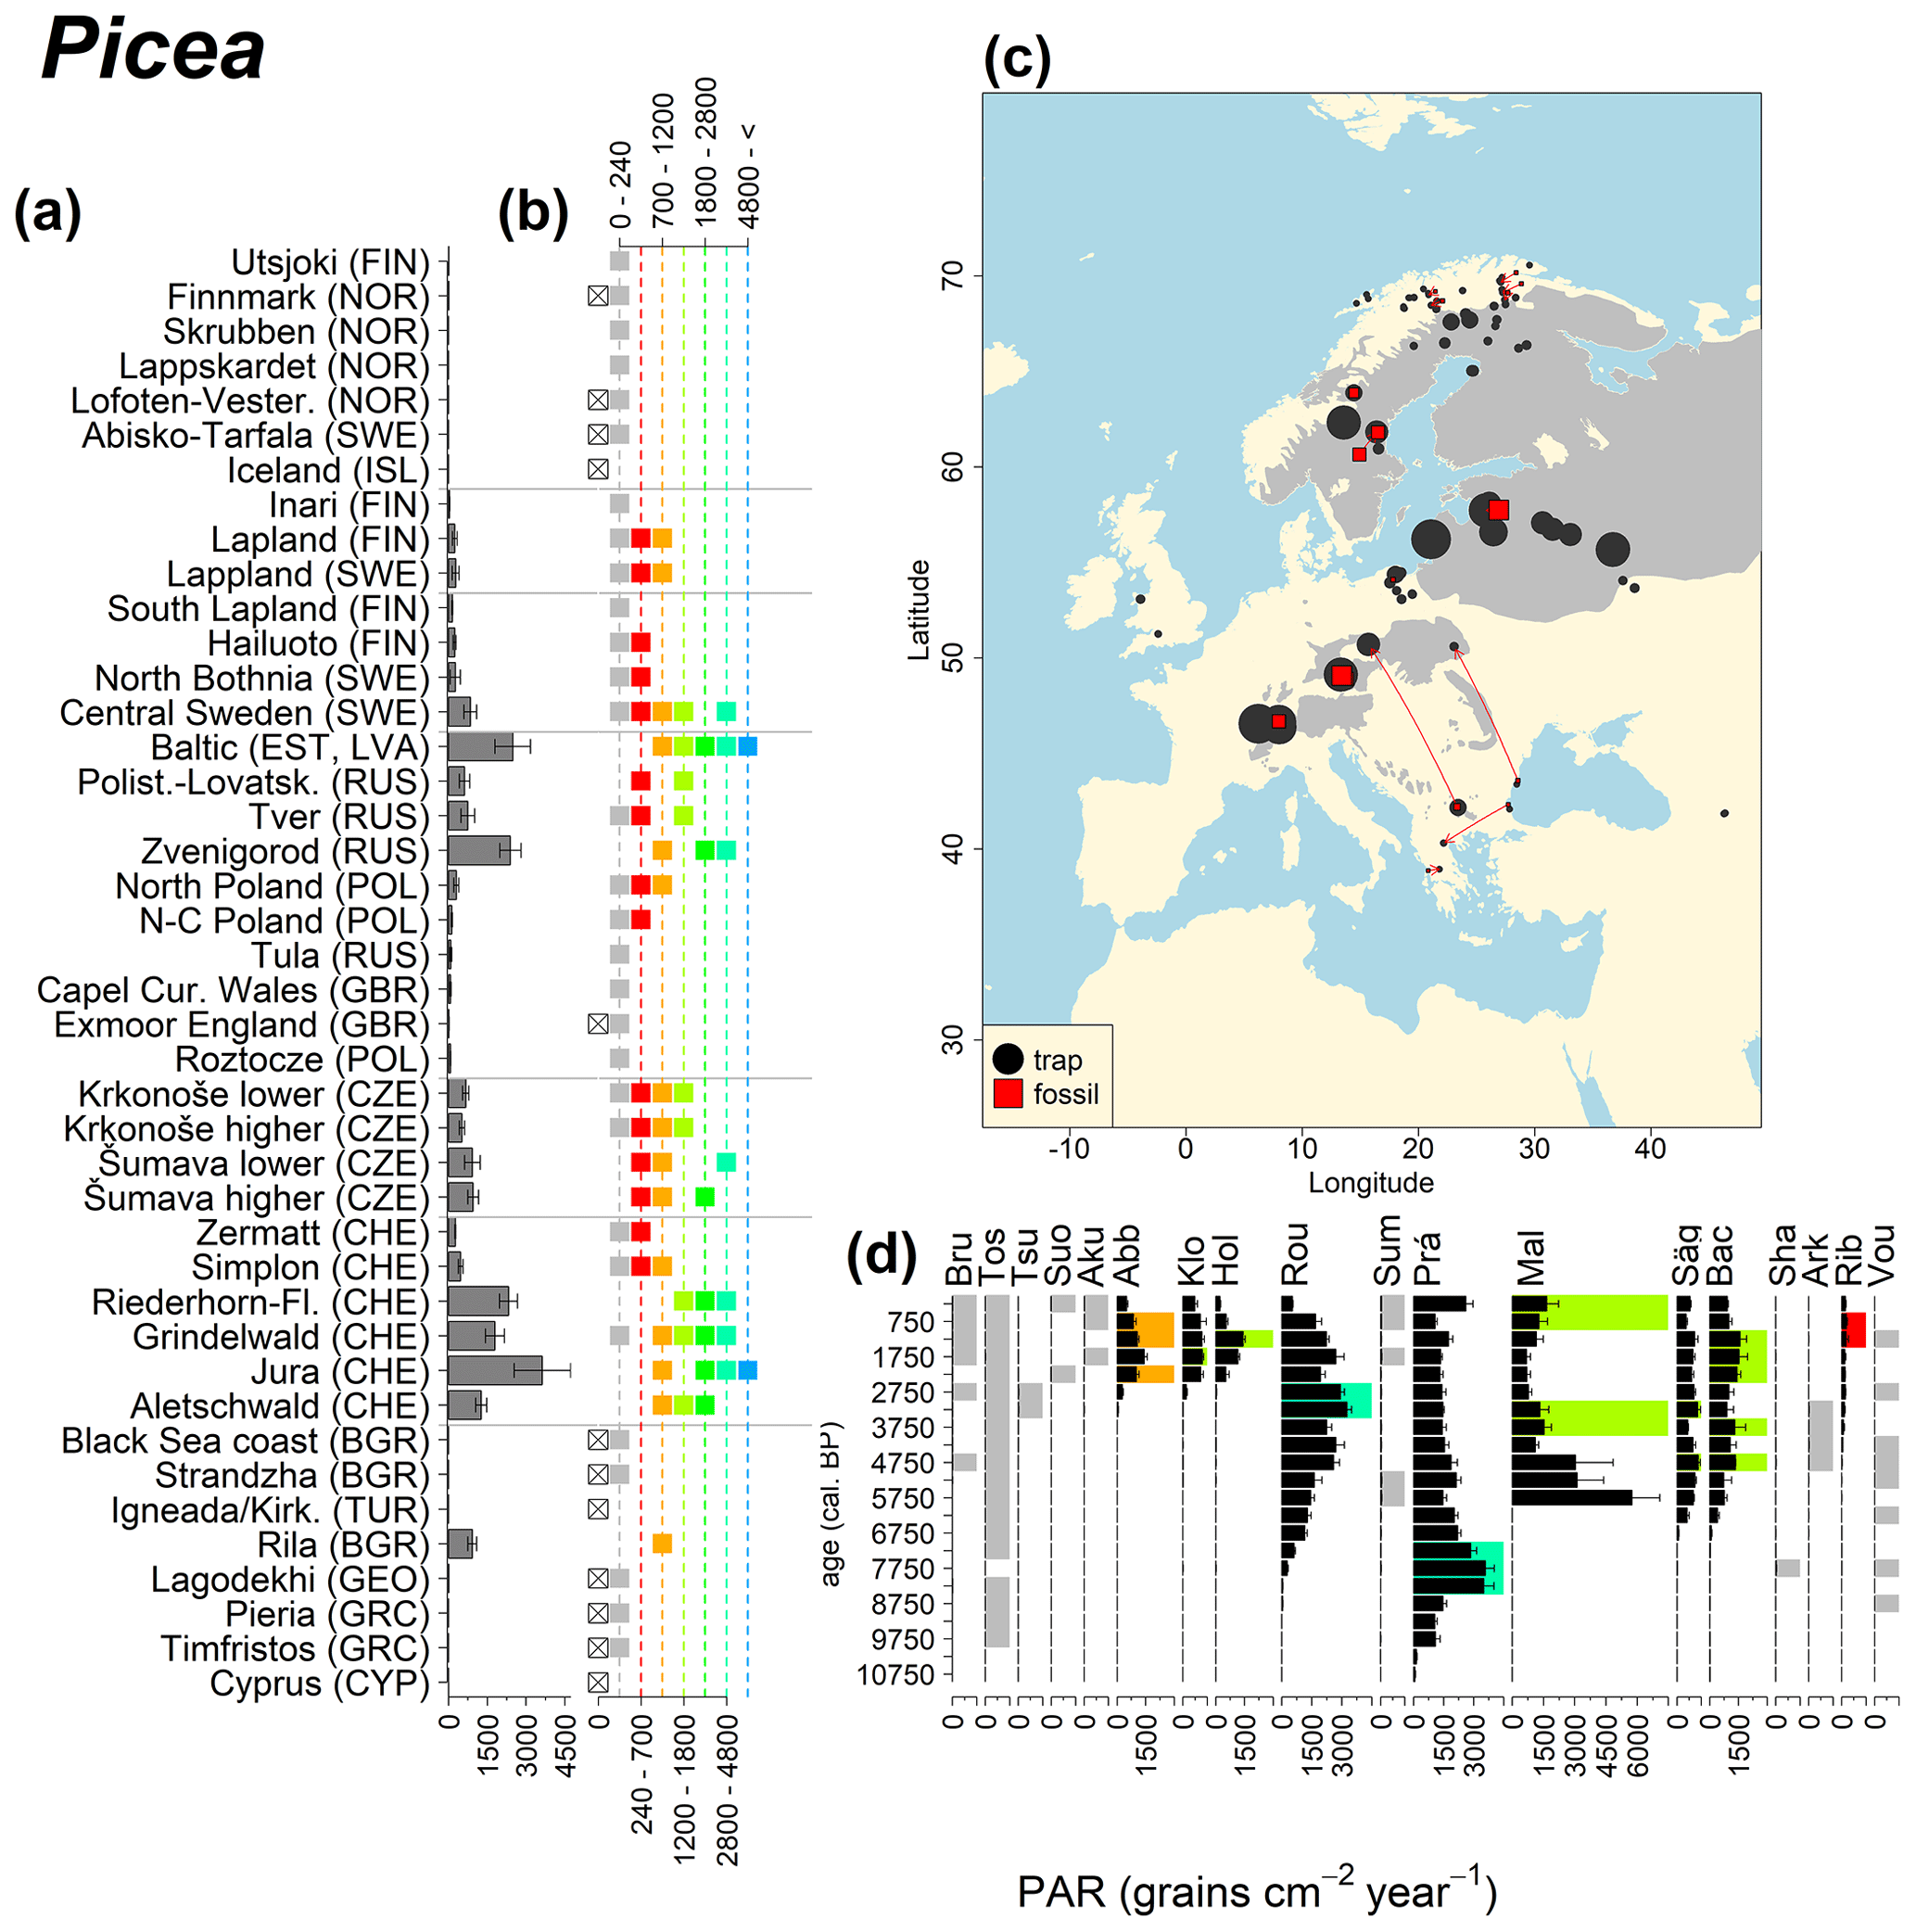
Figure 10See caption Fig. 6 (San-Miguel-Ayanz et al., 2016).
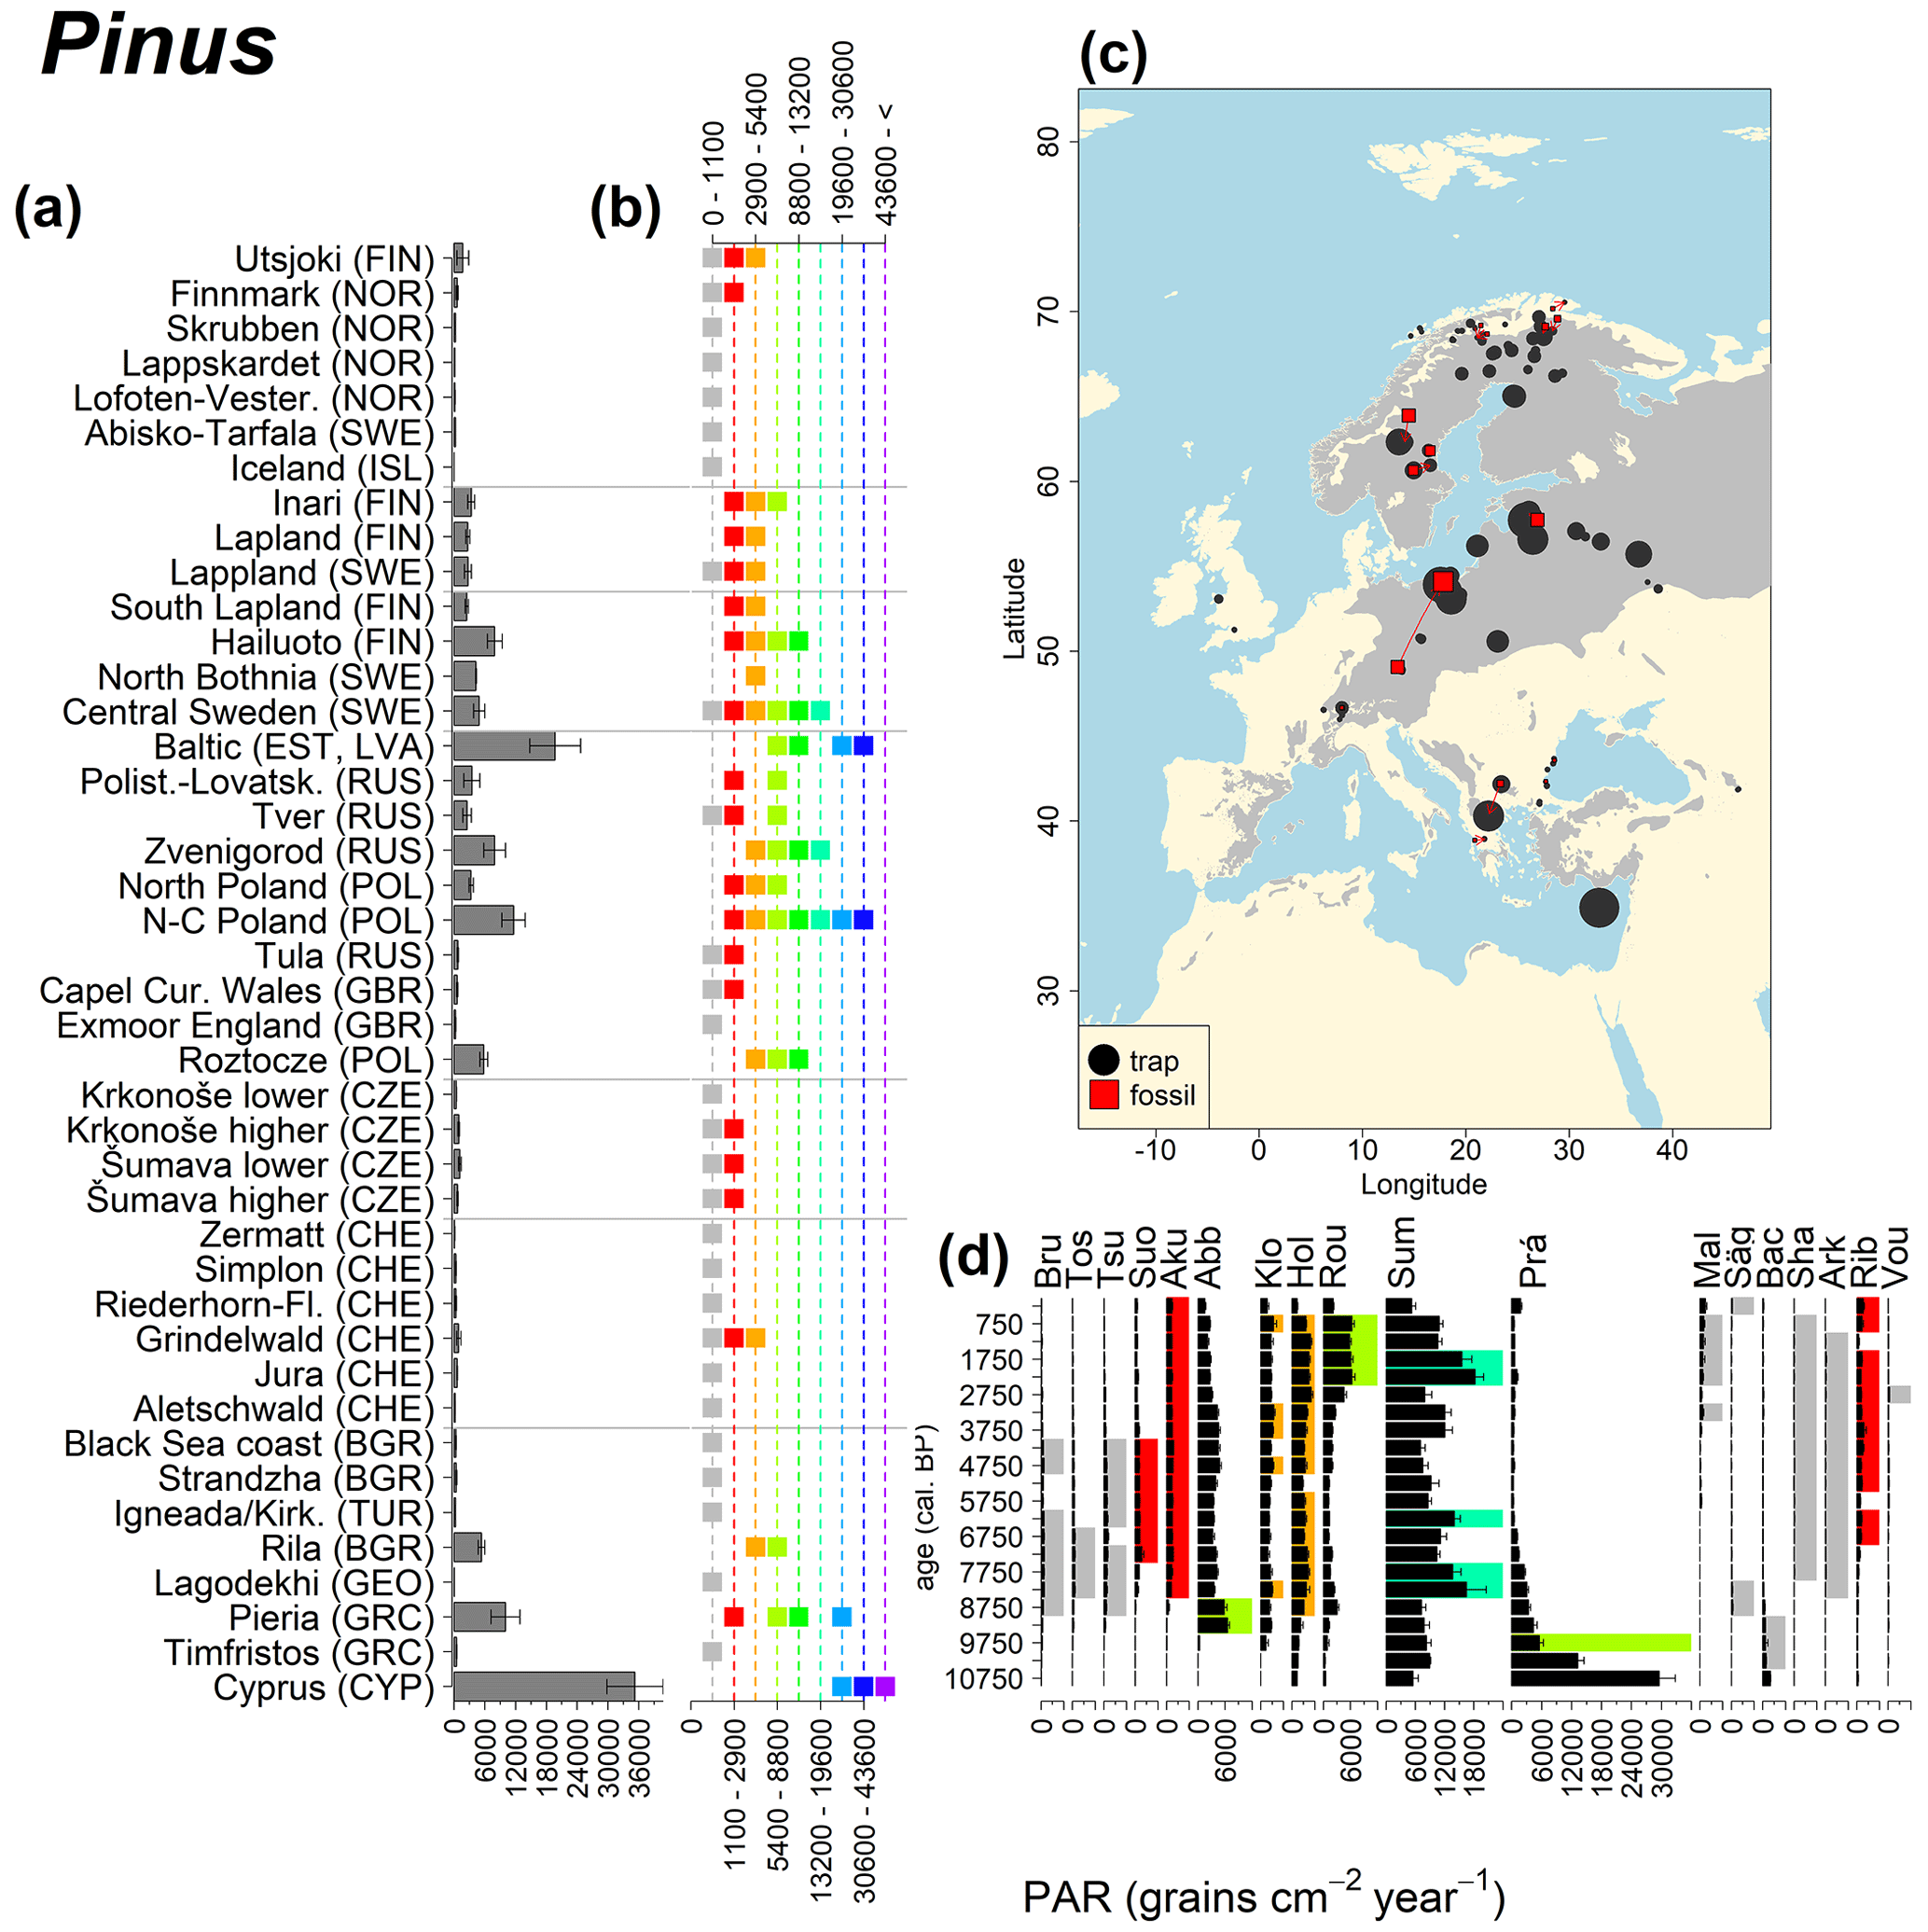
Figure 11See caption Fig. 6 (San-Miguel-Ayanz et al., 2016).
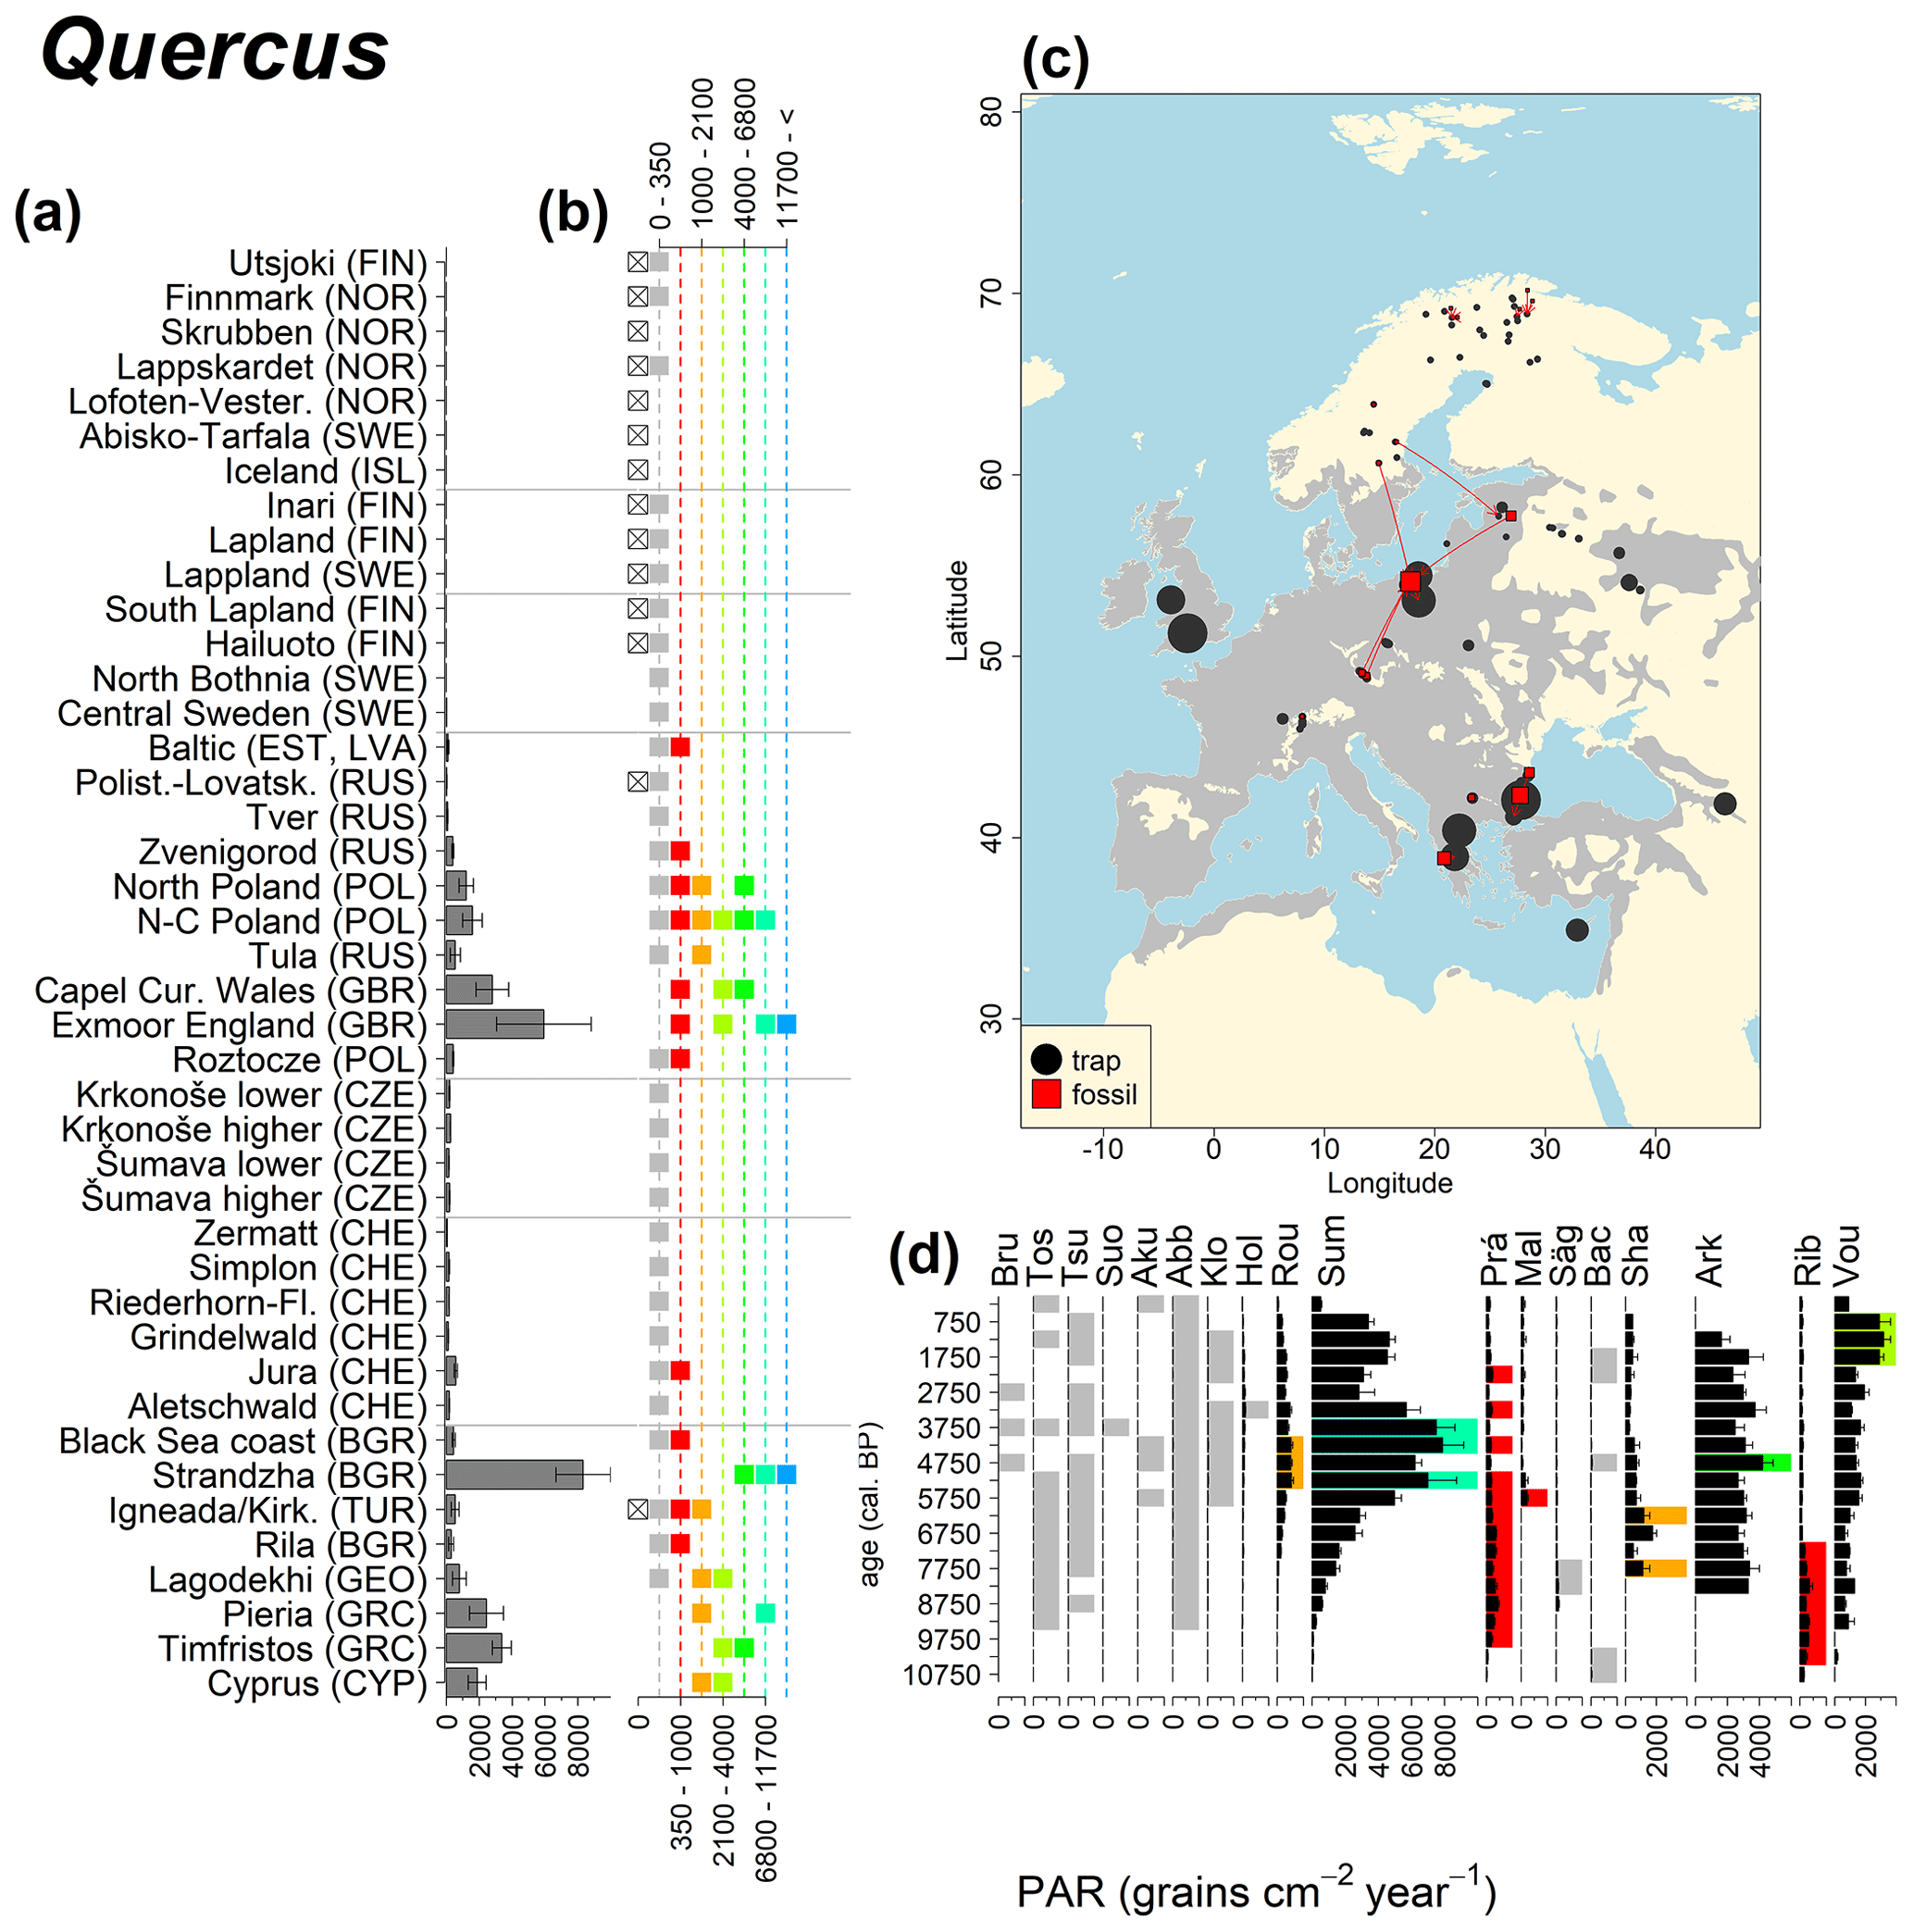
Figure 12See caption Fig. 6 (San-Miguel-Ayanz et al., 2016; Caudullo et al., 2017).
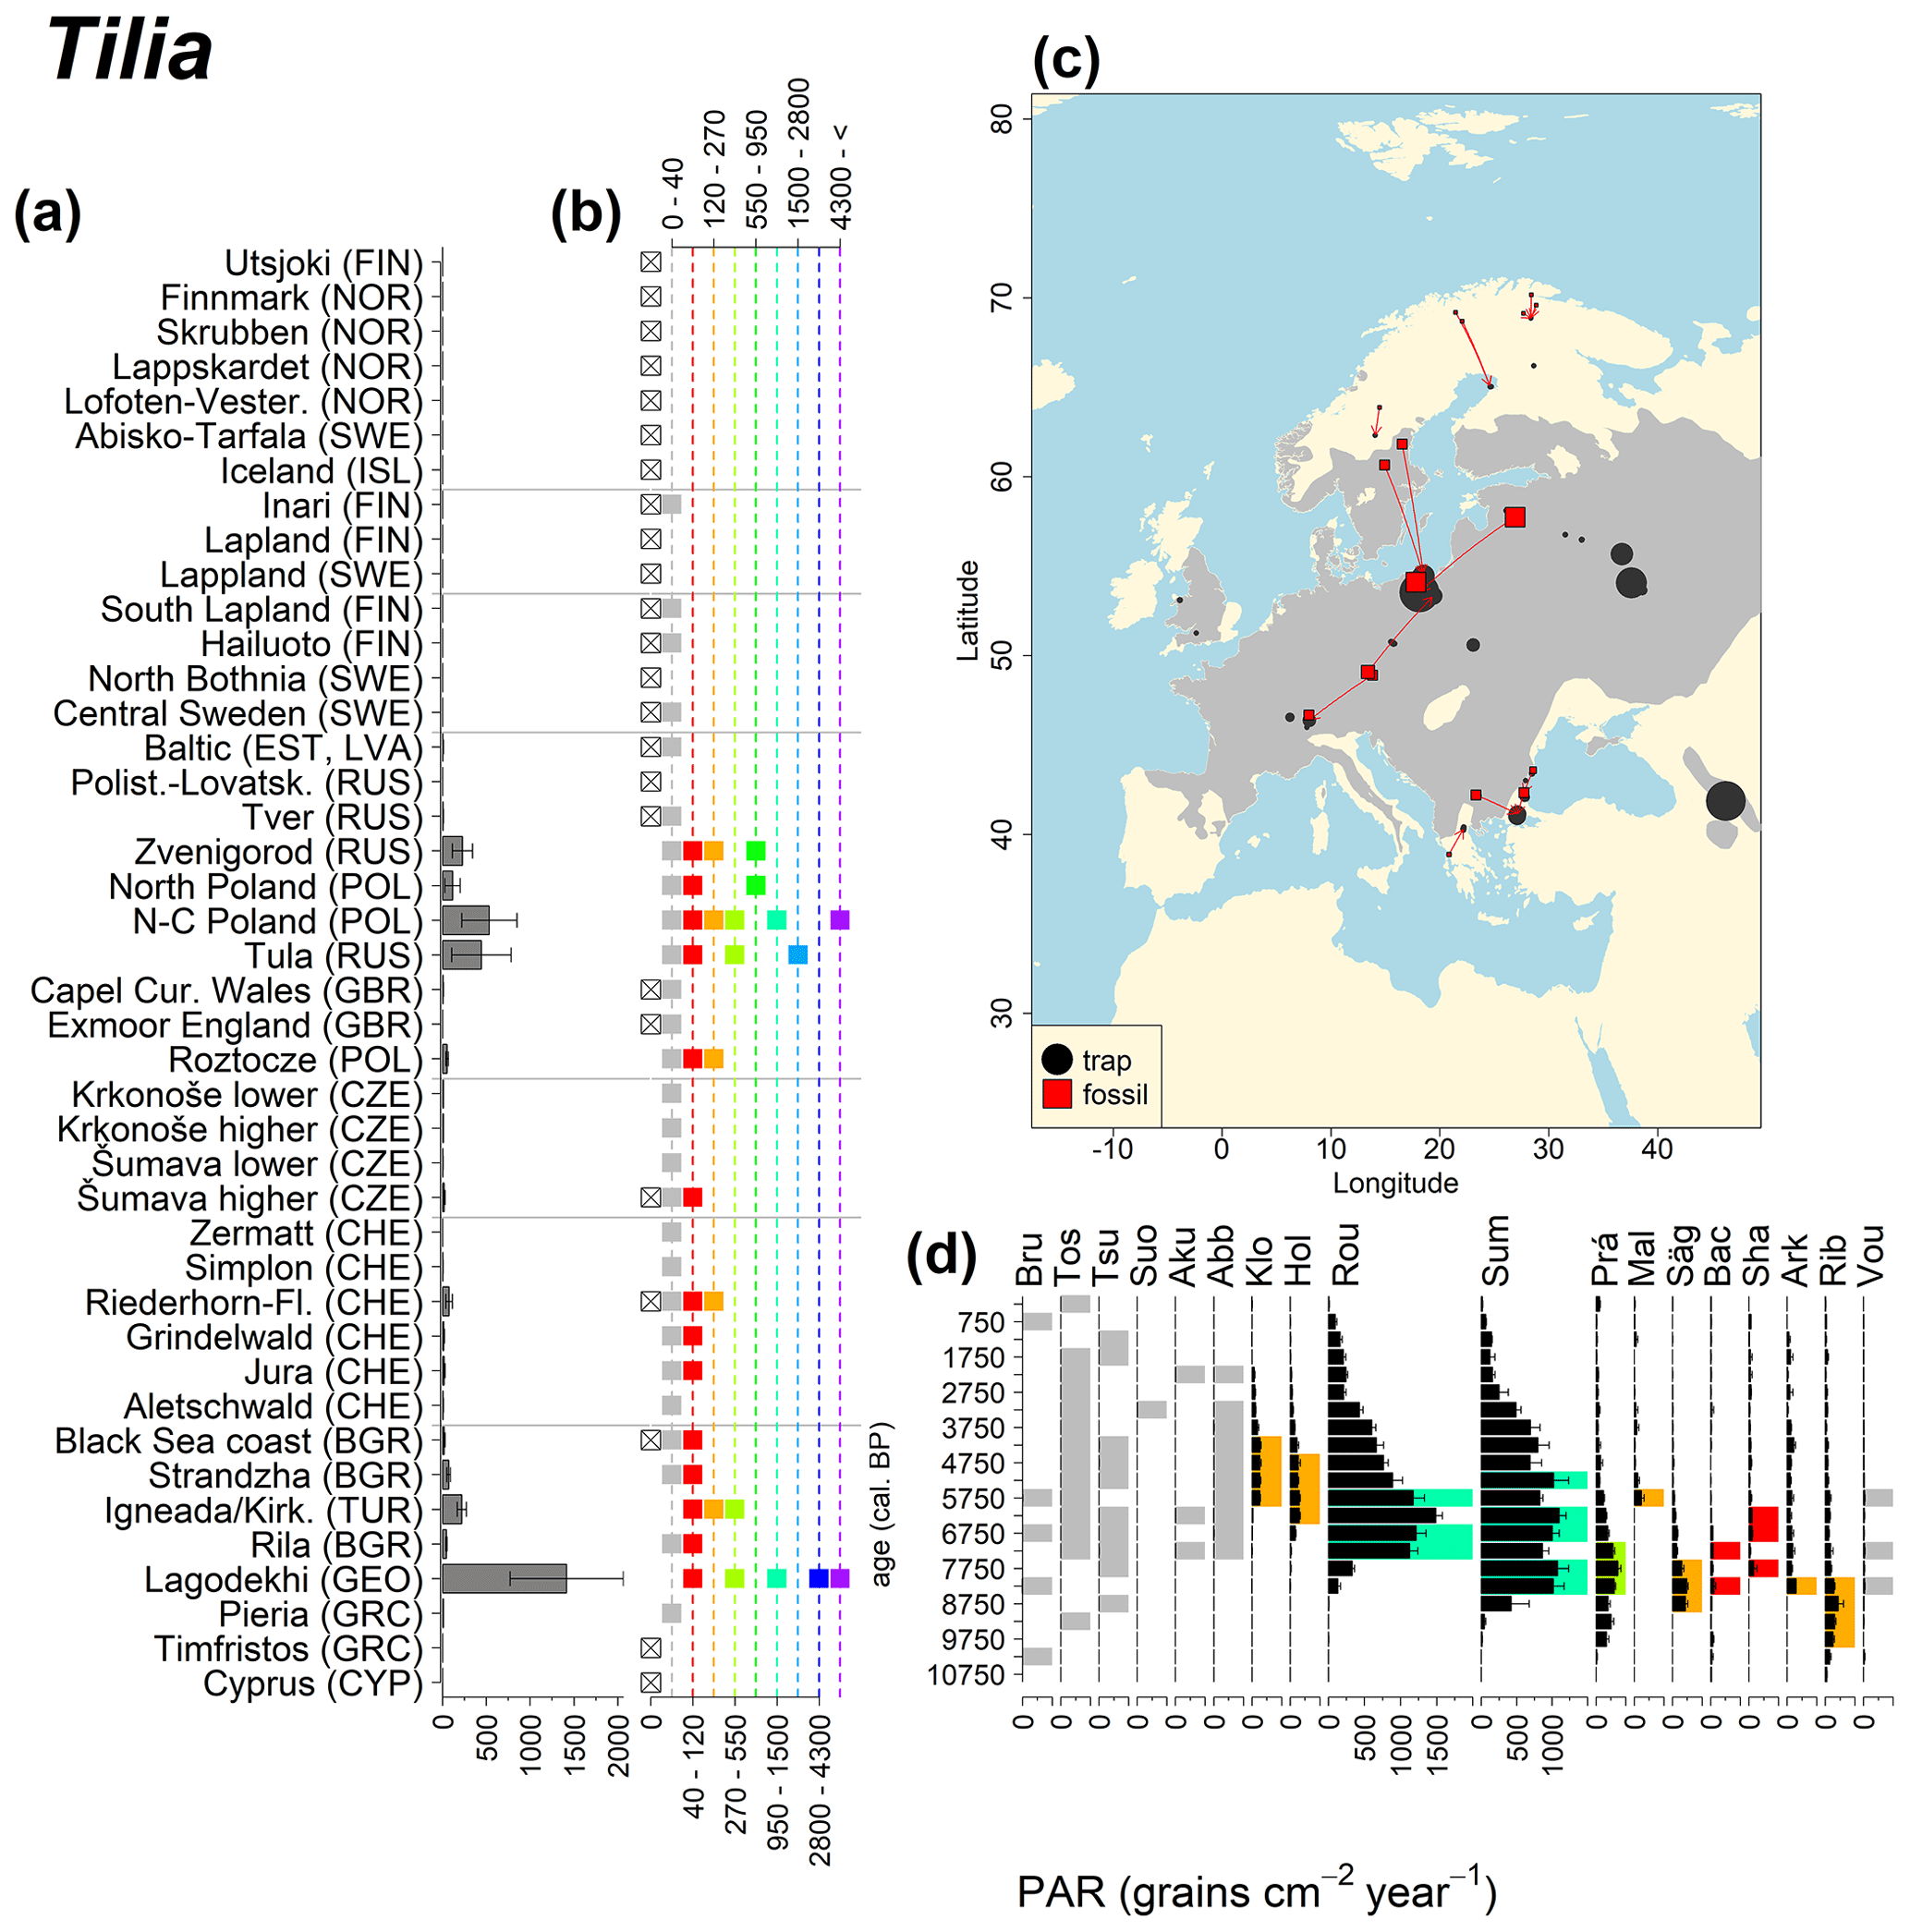
Figure 13See caption Fig. 6 (San-Miguel-Ayanz et al., 2016).
4.1 Trap PAR and environmental conditions
This overview of European pollen trap data collected by the PMP network provides an important reference to investigate continental-scale patterns in absolute pollen deposition. Different taphonomic processes influence PAR values in pollen traps versus lake sediments or moss surface samples (Giesecke and Fontana, 2008; Pardoe et al., 2010; Lisitsyna et al., 2011b). Processes involving differences in the efficiency of capture and deposition of pollen on a surface are important in explaining local variability, while the added uncertainty is generally smaller than the overall signal. On the other hand, internal lake processes like focusing, bank erosion or riverine pollen input may alter the fossil signal substantially, and here careful site selection and site-specific interpretation are needed to allow comparisons (Giesecke and Fontana, 2008). The pollen trap dataset extends across the European latitudinal and altitudinal range and documents general patterns. The latitudinal gradient in PAR is clearly visible in this dataset. Although data on plant biomass and primary productivity are not available for all trapping locations, the regression analysis indicates that mean annual temperature has an influence on the quantity of pollen deposition. The July temperature of the previous year determines the amount of pollen production in Pinus near the treeline (Autio and Hicks, 2004; McCarroll et al., 2003). Evidence from other European regions (Nielsen et al., 2010; van der Knaap et al., 2010) suggests that the warmth of the growing season and other climate variables also explain the interannual variability of pollen deposition. On a regional scale, PAR corresponds to plant biomass of the parent tree (Matthias and Giesecke, 2014; Seppä et al., 2009). However, differences in forest cover cannot explain the latitudinal gradient in PAR described here, which may, at least in part, result from the latitudinal gradient in primary productivity of trees (Gillman et al., 2015). An increase in primary productivity and pollen production has been shown in a carbon dioxide fertilization experiment (Wayne et al., 2002) and in an increase in temperature due to global warming (Frei and Gassner, 2008). Both factors support the interpretation that average PAR of the same species may vary due to environmental parameters determining productivity.
4.2 Long-distance transport (LDT)
Modern PAR from traps near the latitudinal limit of Pinus and Betula has been used previously to reconstruct past changes in the northern distribution limits of these trees (Seppä and Hicks, 2006). The maximum LDT estimate of 80 grains cm−2 yr−1 presented here is slightly lower than the range of PAR values for Pinus and Betula in the arctic/alpine zone of 100–200 grains cm−2 yr−1. This analysis investigated PAR values of a given taxon in traps located several hundred kilometres away from the distribution limit of the parent tree. Therefore, Pinus and Betula had to be ignored as all traps are within or close to their distribution limits. Using approximate distribution data in combination with a large distance of 200 km provides thresholds for most dominant European trees.
The lowest LDT threshold was obtained for Picea (0.3 grain cm−2 yr−1) and with a good number of traps documenting the decline of Picea PAR values away from the distribution limit. The most distant trap for Picea is only 250 km from the distribution limit so that no elevated values in traps at even larger distances influenced the regression. On the other hand, the highest values of 80 grains cm−2 yr−1 for Fagus may be biased by the availability of only limited data. While three traps from beyond 1000 km of the distribution limit of Fagus registered less than 1 grain cm−2 yr−1, these traps strongly influence the regression due to the large distance. Consequently, the value of 80 grains cm−2 yr−1 may be an overestimate. Also, the threshold for Fagus is high in comparison to the size of the pollen grain and associated fall speed. A higher threshold would be expected for Corylus compared to Fagus. Corylus pollen is lighter than Fagus pollen and able to travel greater distances (Table S5).
The LDT threshold for Picea seems low in comparison to the fossil PAR value of Picea (50 grains cm−2 yr−1) found in a sample at Klotjärnen just after the occurrence of the first Picea bud scale (Giesecke, 2005b). However, the thresholds suggested here represent long-distance transport at 200 km, while macrofossil evidence indicates local presence.
Pollen deposition beyond the area of distribution is analogous with high elevations. Decreasing temperatures with elevation cause a reduction in the pollen production of trees (Markgraf, 1980; van der Knaap et al., 2010).
4.3 Analogues for vegetation reconstruction
The comparisons of modern and fossil PAR values show that pollen traps can characterize the population density of particular taxa in modern situations and thus provide analogues aiding in the interpretation of fossil situations. One caveat of the comparisons conducted here is the lack of fossil sites in the oceanic climate of western Europe. Reliable fossil PAR records were not available from the areas of trapping locations in the UK, and pollen trapping locations from northern France or Spain are not available. Moreover, no sites with fossil PAR from western Europe or from low elevations in the Alps are included in this comparison. This omission has consequences for some of the comparisons. A particular case where PAR could in theory aid in the interpretation of the fossil situation are the large quantities of Corylus pollen in early Holocene samples of west European sites. However, there are no or limited modern analogues for the highest early Holocene values. Among the fossil sites considered here, the highest values are around 7000 Corylus grains cm−2 yr−1 at Prášilské. Average early Holocene Corylus PAR at Soppensee in northern Switzerland are 12 000 grains cm−2 yr−1 (Lotter, 1999), and at Meerfelder Maar (Kubitz, 2000) in western Germany they are 18 000 grains cm−2 yr−1. Judging from pollen percentages, even higher early Holocene values should be found in more oceanic situations, and the Corylus PAR at Hockham Mere in eastern England may be as high as 40 000 grains cm−2 yr−1 for the early Holocene (Bennett, 1983). Modern values in pollen traps from Wales at around 2000 grains cm−2 yr−1 are far below these early Holocene figures, and it is likely that modern analogues of sites with high Corylus PAR no longer exist in Europe.
Conversely, the high modern PAR values for Pinus and Betula from Poland and Latvia are not found in the fossil examples. Pinus PAR values around 30 000 grains cm−2 yr−1 were also obtained from 210Pb-dated modern lake sediment samples in northeastern Brandenburg (Matthias and Giesecke, 2014). This study evaluated the PAR for the years 1993 and 2009. The increase in Pinus PAR values between the first and the second sampling periods corresponded with an increase in the amount of standing pine volume in the region. Forestry practices aimed at increasing yield could account for the high Pinus values. Pinus was extensively planted after the 1950s, even on soils where trees with a lower pollen production would have grown naturally. Pollen production, including that of Pinus, could be increased by fertilization due to increased nitrogen deposition (Pers-Kamczyc et al., 2020), as well as increased atmospheric carbon dioxide. A carbon dioxide enrichment experiment of 19-year old Pinus taeda resulted in a twofold probability of reproductive maturity after 3 years (LaDeau and Clark, 2001). The continued experiment also showed that carbon dioxide fertilization increased the number of pollen cones and therefore pollen grains produced per tree (LaDeau and Clark, 2006).
In the case of Pinus, the modern dataset includes trap data from Cyprus, where Pinus brutia dominates at 1600 m a.s.l., resulting in even higher Pinus PAR values compared to those found in the Polish and Baltic regions. The highest Betula values come mainly from Russia, where values frequently exceed 30 000 grains cm−2 yr−1. We previously discussed such high fossil PAR values for Corylus, which is assumed to produce a similar amount of pollen. However, fossil Betula PARs in the examples considered here are consistently below 6000 grains cm−2 yr−1, and published early Holocene values rarely exceed 6000 grains cm−2 yr−1 (but see Theuerkauf et al., 2014). Pollen diagrams from the forest steppe ecotone in European Russia are often characterized by high Betula percentages (Shumilovskikh et al., 2018; Nosova et al., 2019). However, there are no suitable diagrams with reliable PAR estimates from that region. It is thus difficult to judge whether high modern trap values are associated with recent land-use change or are characteristic of eastern European forests.
The comparison of regional PAR between traps and fossil estimates indicates higher fossil PAR of Picea, Fagus and Abies in middle altitudes of the temperate zone (Fig. 5), which, in the case of Abies, represents the Europe-wide decline in A. alba (Tinner et al., 2013). Picea and Fagus dominate central European forests today, and Picea is planted well beyond its natural range. However, both trees start flowering rather late in their lives, and harvesting the trees at a young age may contribute to lower modern PAR values. Fossil and modern PAR for these trees in Šumava are similar, while only the highest trap values match the Holocene high values. On average there are lower modern PAR values; this may be explained by a lowering of the treeline over the last millennia. This interpretation agrees with REVEALS reconstructions for this region, indicating a decline in the cover abundance of Picea and Fagus (Abraham et al., 2016; Carter et al., 2018). Within a 60 km radius of the fossil sites, Picea decreased in abundance from 70 % during the middle Holocene to 43 %, compared to modern abundance. Fagus and Abies declined from late Holocene values of 22 % and 3 % to currently 20 % to 1 % respectively (Abraham et al., 2016). The abundance of Abies in the Roztocze region (SE Poland; Fig.6) provides a good analogue for the past abundance of the tree in Šumava with maximum PAR of 1000–3000 grains cm−2 yr−1. Abies disappeared from the Czech Republic during the medieval period due to forest management methods (Kozáková et al., 2011), which were not practised in southeast Poland.
Directly comparing fossil and modern PAR values facilitates the interpretation of the fossil record of individual sites. For instance, the central Swedish sites Holtjärnen and Klotjärnen provide excellent examples. These sites are situated north of the modern distribution of Tilia, Corylus, Quercus and near the limit of Alnus glutinosa. The fossil PAR values are higher for these taxa than those found in pollen traps at or near these lakes (Giesecke, 2005a; Giesecke and Fontana, 2008). Modern reference values for the PAR of these taxa can be found in northern Poland and Estonia. Moreover, this analogue matching indicates that 3000 years ago the PAR values for Quercus at Holtjärnen were sufficiently high to indicate the occurrence of small populations of Quercus trees near the lake. Those taxa at both sites of the paired histogram (Fig. 5) also nicely illustrate the potential use of LDT for the interpretation of the fossil record. Fossil PAR values of Tilia, Corylus and Quercus in the boreal region are above LDT threshold, whereas all trap PAR values are well below the threshold (Fig. 5).
4.4 Limitations and problems
There are significant differences between the accumulation of pollen in traps and on peatlands and lakes (Pardoe et al., 2010; Lisitsyna et al., 2011b). Differences in pollen trap design and placement in the landscape will influence the values. Trap values are also affected by modern processes that have no impact on the fossil signal, such as the inclusion of pollen brought into the trap by trapped insects. These biases appear minor as indicated by the large consistency of the data collected in the PMP database. The comparison of values over this large environmental gradient results in the signal being stronger than the noise. Some traps or individual years have unusual values and were removed from the comparison (Table S1). The uncertainty of fossil PAR values is much greater than pollen traps, which is primarily due to the added uncertainty caused by sampling a sediment core, combined with the uncertainty of the age model (Maher, 1981). PAR from lake sediment has additional biases due to differential sedimentation of pollen grains in lakes (Davis and Brubaker, 1973), sediment re-deposition and focussing and catchment erosion (Pennington, 1979; Davis et al., 1984). Although we carefully selected the best available fossil sites, PAR in particular from the Suminko lake and Rõuge Tõugjärv may be biased by internal lake processes and the addition of stream-borne pollen. Here fossil PAR estimates are still in the range of values found in pollen traps, while lake internal processes often lead to PAR values exceeding modern ranges. Such biased fossil PAR estimates can in turn be used to elucidate the sedimentation history. Where detailed knowledge of the sedimentation process is available, the bias of sediment focussing may be reduced, as in the example of Hockham Mere cited above (see also Bennett, 1983; Bennett and Buck, 2016). Peatlands may thus seem the better choice for obtaining fossil PAR, which may be the case in northern Scandinavia (Barnekow et al., 2007; Finsinger et al., 2013), but frequent changes in the rate of peat growth lead to difficulties assessing the time represented in individual samples at many sites.
Detailed comparisons of vegetation data to PAR hold the potential for a better understanding of the spatial representation and processes shaping the pollen signal (Matthias and Giesecke, 2014) and allow estimates of absolute pollen productivity (Sugita et al., 2009) or test pollen dispersal models. However, for this continental-scale dataset, available vegetation data have limited precision. Forest inventory data with the detail essential for this type of study are not available for all traps. The forest cover data presented here have a resolution of 1 km2, which is insufficient as the abundance of trees within hundreds of metres of the traps is important. Moreover, without information on standing volume or age structure, the percentage cover used here is a crude measure of the vegetation producing the pollen. Forestry practices like harvesting trees that start flowering at a later age (e.g. Picea 30–40 years) reduce the number of trees producing pollen (Matthias et al., 2012) and bias the search for modern analogues. Also, there are large uncertainties associated with the available mapped distribution limits of trees, precluding more detailed assessments of the quantity of long-distance-transported pollen using this continental dataset.
Comparison of the mean annual PAR from traps and fossil sites showed similar ranges for the common European trees at the continental scale. Fossil PAR values can be linked to modern analogues in Europe, opening up possibilities for using fossil PARs to reconstruct past changes in plant biomass and primary productivity. However, careful selection of fossil sites is necessary to avoid biases of absolute pollen deposition in the fossil record, which may be caused by lake internal processes such as focusing or the addition of pollen from the catchment or bank erosion.
Modern absolute pollen deposition values clearly show that climate parameters correlate with latitude, supporting earlier findings that growing season warmth determines pollen productivity. The effect of regional forest cover is discernible in the data. Minimum PAR values rise with increasing forest cover (measured within 10 km of the trap), while the maximum values are determined by local site conditions. Fossil PAR data, which incorporate both these components, require careful interpretation when aiming to reconstruct regional forest cover. At least 140 grains cm−2 yr−1 of tree pollen may be found in treeless vegetation and, with each 10 % of forest cover, tree PAR increases by at least 400 grains cm−2 yr−1.
Absolute pollen deposition decreases gradually away from the distribution limit of common trees. Generally, less than 60 grains cm−2 yr−1 are found at a distance of 200 km from the distribution limit. The following thresholds of PAR were obtained for a distance of 200 km from a distribution limit: Quercus (50), Carpinus (39), Fraxinus (20), Corylus (15), Tilia (5) and Picea (0.3). The obtained threshold of 80 grains cm−2 yr−1 for Fagus is likely too high. The application of these taxon-specific values holds the potential to refine and adjust reconstructions of tree distributions.
Primary trap and fossil pollen data are in progress; see Abraham (2021) (https://github.com/vojtechabraham/PMPdatabase, last access: 19 March 2021). Analyses are based on the WorldClim 2 dataset of Fick and Hijmans (2017, https://doi.org/10.1002/joc.5086) available at http://worldclim.org/version2 (last access: 20 January 2019; WorldClim, 2019). Chorological data for the main European woody species, version 2, by Caudullo et al. (2017, https://doi.org/10.17632/hr5h2hcgg4.2) and the European atlas of forest tree species of San-Miguel-Ayanz et al. (2016, https://doi.org/10.2788/4251) are available at http://www.euforgen.org/species (last access: 20 May 2018; EUFORGEN, 2018). Forest Map of Europe of Kempeneers et al. (2012, https://doi.org/10.1109/TGRS.2011.2158548) is available on request to the authors.
Code for analysis, derived data and code for figures are available at https://github.com/vojtechabraham/PMPdatabase (last access: 19 March 2021, Abraham, 2021).
The supplement related to this article is available online at: https://doi.org/10.5194/bg-18-4511-2021-supplement.
TG and VA designed the analysis. VA, TG and MW analysed the data. VA and TG drafted the manuscript. HP, SH, CEJ, HSS, HS, SV, SH, MN, MW, SP, ST, TK, AMN and JŚM commented on the manuscript. All authors except VA and MW collected the primary data.
The authors declare that they have no conflict of interest.
Publisher’s note: Copernicus Publications remains neutral with regard to jurisdictional claims in published maps and institutional affiliations.
We thank all the collaborators of pollen trapping, especially those who contributed to the PMP dataset: Pim van der Knaap, Jacqueline van Leeuwen, Karl-Dag Vorren, Heather Tinsley, Lena Barnekow, Małgorzata Latałowa, Enikő Magyari, Larissa Savelieva, Elena Pavlova, Heidi Hyyppä, Mari Kuoppamaa and Gunhild Rosqvist. We thank Simon Connor for his detailed review which helped to improve the paper as well as the two anonymous reviewers for their comments.
This research has been supported by the Czech Science Foundation (GAČR) (grant no. 17-17909S), the Czech Academy of Sciences (grant no. RVO 67985939), the Charles University Research Centre (grant no. 204069), and the ETAG (grant no. PUT323).
This paper was edited by Anja Rammig and reviewed by Simon Connor and two anonymous referees.
Abraham, V.: PMPdatabase, GitHub [code], available at: https://github.com/vojtechabraham/PMPdatabase, last access: 19 March 2021. a, b
Abraham, V., Kuneš, P., Petr, L., Svitavská-Svobodová, H., Kozáková, R., Jamrichová, E., Švarcová, M. G., and Pokorný, P.: A pollen-based quantitative reconstruction of the Holocene vegetation updates a perspective on the natural vegetation in the Czech Republic and Slovakia, Preslia, 88, 409–434, 2016. a, b
Andersen, S.: The relative pollen productivity and representation of north European trees, and correction factors for tree pollen spectra, Danmarks Geologiske Undersøgelse Række II, 96, 1–99, 1970. a, b
Andersen, S. T.: Influence of Climatic Variation on Pollen Season Severity in Wind-Pollinated Trees and Herbs, Grana, 19, 47–52, https://doi.org/10.1080/00173138009424986, 1980. a
Autio, J. and Hicks, S.: Annual variations in pollen deposition and meteorological conditions on the fell Aakenustunturi in northern Finland: Potential for using fossil pollen as a climate proxy, Grana, 43, 31–47, https://doi.org/10.1080/00173130310017409, 2004. a
Barnekow, L., Loader, N. J., Hicks, S., Froyd, C. A., and Goslar, T.: Strong correlation between summer temperature and pollen accumulation rates for Pinus sylvestris, Picea abies and Betula spp. in a high-resolution record from northern Sweden, J. Quaternary Sci., 22, 653–658, https://doi.org/10.1002/jqs.1096, 2007. a
Bennett, K. and Buck, C. E.: Interpretation of lake sediment accumulation rates, Holocene, 26, 1092–1102, https://doi.org/10.1177/0959683616632880, 2016. a, b
Bennett, K. D.: Devensian Late-Glacial and Flandrian Vegetational History at Hockham Mere, Norfolk, England, New Phytol., 95, 489–504, https://doi.org/10.1111/j.1469-8137.1983.tb03513.x, 1983. a, b, c
Bozilova, E. and Beug, H.-J.: On the Holocene history of vegetation in SE Bulgaria (Lake Arkutino, Ropotamo region), Veg. Hist. Archaebot., 1, 19–32, https://doi.org/10.1007/BF00190698, 1992. a
Carter, V. A., Chiverrell, R. C., Clear, J. L., Kuosmanen, N., Moravcová, A., Svoboda, M., Svobodová-Svitavská, H., van Leeuwen, J. F. N., van der Knaap, W. O., and Kuneš, P.: Quantitative Palynology Informing Conservation Ecology in the Bohemian/Bavarian Forests of Central Europe, Front. Plant Sci., 8, 2268, https://doi.org/10.3389/fpls.2017.02268, 2018. a, b
Caudullo, G., Welk, E., and San-Miguel-Ayanz, J.: Chorological data for the main European woody species, V2, Mendeley Data [data set], https://doi.org/10.17632/hr5h2hcgg4.2, 2017. a, b, c, d, e
Davis, B. A. S., Zanon, M., Collins, P., Mauri, A., Bakker, J., Barboni, D., Barthelmes, A., Beaudouin, C., Bjune, A. E., Bozilova, E., Bradshaw, R. H. W., Brayshay, B. A., Brewer, S., Brugiapaglia, E., Bunting, J., Connor, S. E., de Beaulieu, J.-L., Edwards, K., Ejarque, A., Fall, P., Florenzano, A., Fyfe, R., Galop, D., Giardini, M., Giesecke, T., Grant, M. J., Guiot, J., Jahns, S., Jankovská, V., Juggins, S., Kahrmann, M., Karpińska-Kołaczek, M., Kołaczek, P., Kühl, N., Kuneš, P., Lapteva, E. G., Leroy, S. A. G., Leydet, M., Guiot, J., Jahns, S., López Sáez, J. A., Masi, A., Matthias, I., Mazier, F., Meltsov, V., Mercuri, A. M., Miras, Y., Mitchell, F. J. G., Morris, J. L., Naughton, F., Nielsen, A. B., Novenko, E., Odgaard, B., Ortu, E., Overballe-Petersen, M. V., Pardoe, H. S., Peglar, S. M., Pidek, I. A., Sadori, L., Seppä, H., Severova, E., Shaw, H., Święta-Musznicka, J., Theuerkauf, M., Tonkov, S., Veski, S., van der Knaap, W. O., van Leeuwen, J. F. N., Woodbridge, J., Zimny, M., and Kaplan, J. O.: The European Modern Pollen Database (EMPD) project, Veg. Hist. Archaebot., 22, 521–530, https://doi.org/10.1007/s00334-012-0388-5, 2013. a
Davis, M. B.: Palynology after Y2K–Understanding the Source Area of Pollen in Sediments, Annu. Rev. Earth Pl. Sc., 28, 1–18, https://doi.org/10.1146/annurev.earth.28.1.1, 2000. a
Davis, M. B. and Brubaker, L. B.: Differential Sedimentation of Pollen Grains in Lakes, Limnol. Oceanogr., 18, 635–646, https://doi.org/10.4319/lo.1973.18.4.0635, 1973. a, b
Davis, M. B. and Deevey, E. S.: Pollen Accumulation Rates: Estimates from Late-Glacial Sediment of Rogers Lake, Science, 145, 1293–1295, https://doi.org/10.1126/science.145.3638.1293, 1964. a
Davis, M. B., Moeller, R., and Ford, J.: Sediment focusing and pollen influx, in: Lake sediments and environmental history: studies in palaeolimnology and palaeoecology in honour of Winifred Tutin, edited by: Haworth, E. Y., Lund, J. W. G., and Tutin, W., Leicester University Press, Leicester, 261–293, ISBN: 978-0-7185-1220-0, 1984. a, b
EUFORGEN: http://www.euforgen.org/species, last access: 20 May 2018. a
Fick, S. E. and Hijmans, R. J.: WorldClim 2: new 1-km spatial resolution climate surfaces for global land areas, Int. J. Climatol., 37, 4302–4315, https://doi.org/10.1002/joc.5086, 2017. a, b
Filipova-Marinova, M.: Palaeoecological investigations of lake Shabla-Ezeretz in NE Bulgaria, Ecologia Mediterranea, 11, 147–158, 1985. a
Finsinger, W., Schoning, K., Hicks, S., Lücke, A., Goslar, T., Wagner-cremer, F., and Hyyppä, H. : Climate change during the past 1000 years: a high-temporal-resolution multiproxy record from a mire in northern Finland, J. Quaternary Sci., 28, 152–164, https://doi.org/10.1002/jqs.2598, 2013. a
Frei, T. and Gassner, E.: Climate change and its impact on birch pollen quantities and the start of the pollen season an example from Switzerland for the period 1969–2006, Int. J. Biometeorol., 52, 667, https://doi.org/10.1007/s00484-008-0159-2, 2008. a
Froyd, C. A.: Fossil Stomata Reveal Early Pine Presence in Scotland: Implications for Postglacial Colonization Analyses, Ecology, 86, 579–586, https://doi.org/10.1890/04-0546, 2005. a
Gaillard, M.-J., Sugita, S., Bunting, M. J., Middleton, R., Broström, A., Caseldine, C., Giesecke, T., Hellman, S. E. V., Hicks, S., Hjelle, K., Langdon, C., Nielsen, A.-B., Poska, A., Stedingk, H., Veski, S., and members, P.: The use of modelling and simulation approach in reconstructing past landscapes from fossil pollen data: a review and results from the POLLANDCAL network, Veget Hist Archaeobot, 17, 419–443, https://doi.org/10.1007/s00334-008-0169-3, 2008. a
Gerasimidis, A., Panajiotidis, S., Hicks, S., and Athanasiadis, N.: An eight-year record of pollen deposition in the Pieria mountains (N. Greece) and its significance for interpreting fossil pollen assemblages, Rev. Palaeobot. Palyno., 141, 231–243, https://doi.org/10.1016/j.revpalbo.2006.04.004, 2006. a
Giesecke, T.: Holocene dynamics of the southern boreal forest in Sweden, Holocene, 15, 858–872, https://doi.org/10.1191/0959683605hl859ra, 2005a. a, b, c
Giesecke, T.: Moving front or population expansion: How did Picea abies (L.) Karst. become frequent in central Sweden?, Quaternary Sci. Rev., 24, 2495–2509, https://doi.org/10.1016/j.quascirev.2005.03.002, 2005b. a
Giesecke, T.: Holocene forest development in the central Scandes Mountains, Sweden, Veg. Hist. Archaebot., 14, 133–147, https://doi.org/10.1007/s00334-005-0070-2, 2005c. a
Giesecke, T. and Fontana, S. L.: Revisiting pollen accumulation rates from Swedish lake sediments, Holocene, 18, 293–305, https://doi.org/10.1177/0959683607086767, 2008. a, b, c, d, e, f
Giesecke, T., Fontana, S. L., Knaap, W. O., Pardoe, H. S., and Pidek, I. A.: From early pollen trapping experiments to the Pollen Monitoring Programme, Veg. Hist. Archaebot., 19, 247–258, https://doi.org/10.1007/s00334-010-0261-3, 2010. a
Giesecke, T., Brewer, S., Finsinger, W., Leydet, M., and Bradshaw, R. H. W.: Patterns and dynamics of European vegetation change over the last 15,000 years, J. Biogeogr., 44, 1441–1456, https://doi.org/10.1111/jbi.12974, 2017. a
Giesecke, T., Wolters, S., van Leeuwen, J. F. N., van der Knaap, P. W. O., Leydet, M., and Brewer, S.: Postglacial change of the floristic diversity gradient in Europe, Nat. Commun., 10, 1–7, https://doi.org/10.1038/s41467-019-13233-y, 2019. a
Gillman, L. N., Wright, S. D., Cusens, J., McBride, P. D., Malhi, Y., and Whittaker, R. J.: Latitude, productivity and species richness, Global Ecol. Biogeogr., 24, 107–117, https://doi.org/10.1111/geb.12245, 2015. a
GRASS Development Team: Geographic Resources Analysis Support System (GRASS GIS) Software, Version 7.2, Open Source Geospatial Foundation, https://grass.osgeo.org/ (last access: 18 July 2021), 2018. a
Haselhorst, D. S., Moreno, J. E., and Punyasena, S. W.: Assessing the influence of vegetation structure and phenological variability on pollen-vegetation relationships using a 15-year Neotropical pollen rain record, J. Veg. Sci., 31, 606–615, https://doi.org/10.1111/jvs.12897, 2020. a
Hättestrand, M., Jensen, C., Hallsdóttir, M., and Vorren, K.-D.: Modern pollen accumulation rates at the north-western fringe of the European boreal forest, Rev. Palaeobot. Palyno., 151, 90–109, https://doi.org/10.1016/j.revpalbo.2008.03.001, 2008. a
Hesselman, H.: Om pollenregn på hafvet och fjärrtransport af barrträdspollen, Geologiska Föreningens i Stockholm Förhandlingar, 41, 89–99, 1919. a
Hicks, S.: A method of using modern pollen rain values to provide a timescale for pollen diagrams from peat deposits, Memoranda Societas Fauna Flora Fennica, 49, 21–33, 1974. a
Hicks, S.: Present and past pollen records of Lapland forests, Rev. Palaeobot. Palyno., 82, 17–35, https://doi.org/10.1016/0034-6667(94)90017-5, 1994. a
Hicks, S.: The relationship between climate and annual pollen deposition at northern tree-lines, Chemosphere – Global Change Science, 1, 403–416, https://doi.org/10.1016/S1465-9972(99)00043-4, 00034, 1999. a
Hicks, S. and Hyvärinen, H.: Pollen influx values measured in different sedimentary environments and their palaeoecological implications, Grana, 38, 228–242, https://doi.org/10.1080/001731300750044618, 1999. a
Hicks, S., Ammann, B., Latałowa, M., Pardoe, H. S., and Tinsley, H.: European Pollen Monitoring Programme: Project Description and Guidelines, Oulu University Press, Oulu, 1996. a
Hicks, S., Tinsley, H., Pardoe, H. S., and Cundill, P. R.: European Pollen Monitoring Programme: Supplement to the Guidelines, Oulu University Press, Oulu, 1999. a
Hicks, S., Tinsley, H., Huusko, A., Jensen, C., Hättestrand, M., Gerasimides, A., and Kvavadze, E.: Some comments on spatial variation in arboreal pollen deposition: first records from the Pollen Monitoring Programme (PMP), Rev. Palaeobot. Palyno., 117, 183–194, https://doi.org/10.1016/S0034-6667(01)00086-0, 2001. a, b, c
Hyvärinen, H.: Absolute and relative pollen diagrams from northernmost Fennoscandia, Fennia – International Journal of Geography, Vol. 142, 1975. a, b, c
Jackson, S. T. and Williams, J. W.: Modern analogs in Quaternary paleoecology: Here Today, Gone Yesterday, Gone Tomorrow?, Annu. Rev. Earth Pl. Sc., 32, 495–537, https://doi.org/10.1146/annurev.earth.32.101802.120435, 2004. a
Jahns, S.: The Holocene history of vegetation and settlement at the coastal site of Lake Voulkaria in Acarnania, western Greece, Veg. Hist. Archaebot., 14, 55–66, https://doi.org/10.1007/s00334-004-0053-8, 2004. a
Jantz, N., Homeier, J., León-Yánez, S., Moscoso, A., and Behling, H.: Trapping pollen in the tropics – Comparing modern pollen rain spectra of different pollen traps and surface samples across Andean vegetation zones, Rev. Palaeobot. Palyno., 193, 57–69, https://doi.org/10.1016/j.revpalbo.2013.01.011, 2013. a
Jensen, C., Vorren, K.-D., and Mørkved, B.: Annual pollen accumulation rate (PAR) at the boreal and alpine forest-line of north-western Norway, with special emphasis on Pinus sylvestris and Betula pubescens, Rev. Palaeobot. Palyno., 144, 337–361, https://doi.org/10.1016/j.revpalbo.2006.08.006, 2007. a, b
Kempeneers, P., Sedano, F., Seebach, L. M., Strobl, P., and San-Miguel-Ayanz, J.: Data Fusion of Different Spatial Resolution Remote Sensing Images Applied to Forest-Type Mapping, IEEE T. Geosci. Remote, 49, 4977–4986, https://doi.org/10.1109/TGRS.2011.2158548, 2012. a, b
Koff, T.: Pollen influx into Tauber traps in Estonia in 1997–1998, Rev. Palaeobot. Palyno., 117, 53–62, https://doi.org/10.1016/S0034-6667(01)00076-8, 2001. a
Kozáková, R., Šamonil, P., Kuneš, P., Novák, J., Kočár, P., and Kočárová, R.: Contrasting local and regional Holocene histories of Abies alba in the Czech Republic in relation to human impact: Evidence from forestry, pollen and anthracological data, Holocene, 21, 431–444, https://doi.org/10.1177/0959683610385721, 2011. a
Kubitz, B.: Die holozäne Vegetations- und Siedlungsgeschichte in der Westeifel am Beispiel eines hochauflösenden Pollendiagrammes aus dem Meerfelder Maar [History of Holocene vegetation and settlement of the Western Eifel region (Germany) using a high resolution pollenprofile from the Meerfeld Maar], Dissertationes Botanicae, Band 339, ISBN: 978-3-443-64251-8, 2000 (in German). a
Kvavadze, E.: Annual modern pollen deposition in the foothills of the Lagodekhi Reservation (Caucasus, East Georgia), related to vegetation and climate, Acta Palaeobotanica, 41, 355–364, 2001. a
LaDeau, S. L. and Clark, J. S.: Rising CO2 Levels and the Fecundity of Forest Trees, Science, 292, 95–98, https://doi.org/10.1126/science.1057547, 2001. a
LaDeau, S. L. and Clark, J. S.: Pollen production by Pinus taeda growing in elevated atmospheric CO2, Funct. Ecol., 20, 541–547, https://doi.org/10.1111/j.1365-2435.2006.01133.x, 2006. a, b
Lisitsyna, O. V., Giesecke, T., and Hicks, S.: Exploring pollen percentage threshold values as an indication for the regional presence of major European trees, Rev. Palaeobot. Palyno., 166, 311–324, https://doi.org/10.1016/j.revpalbo.2011.06.004, 2011a. a
Lisitsyna, O. V., Hicks, S., and Huusko, A.: Do moss samples, pollen traps and modern lake sediments all collect pollen in the same way? A comparison from the forest limit area of northernmost Europe, Veg. Hist. Archaebot., 21, 187–199, https://doi.org/10.1007/s00334-011-0335-x, 2011b. a, b
Lotter, A. F.: Late-glacial and Holocene vegetation history and dynamics as shown by pollen and plant macrofossil analyses in annually laminated sediments from Soppensee, central Switzerland, Veg. Hist. Archaebot., 8, 165–184, https://doi.org/10.1007/BF02342718, 1999. a
Maher Jr., L. J.: Statistics for microfossil concentration measurements employing samples spiked with marker grains, Rev. Palaeobot. Palyno., 32, 153–191, https://doi.org/10.1016/0034-6667(81)90002-6, 1981. a
Malmström, C.: Degerö Stormyr–en botanisk, hydrologisk och utvecklingshistorisk undersökning över ett nordsvenskt myrkomplex, Meddelanden från Statens Skogsförsöksanstalt, 20, 1–2, 1923. a
Markgraf, V.: Pollen Dispersal in a Mountain Area, Grana, 19, 127–146, https://doi.org/10.1080/00173138009424995, 1980. a
Matthias, I. and Giesecke, T.: Insights into pollen source area, transport and deposition from modern pollen accumulation rates in lake sediments, Quaternary Sci. Rev., 87, 12–23, https://doi.org/10.1016/j.quascirev.2013.12.015, 2014. a, b, c, d, e, f
Matthias, I., Nielsen, A. B., and Giesecke, T.: Evaluating the effect of flowering age and forest structure on pollen productivity estimates, Veg. Hist. Archaebot., 21, 471–484, https://doi.org/10.1007/s00334-012-0373-z, 2012. a
McCarroll, D., Jalkanen, R., Hicks, S., Tuovinen, M., Gagen, M., Pawellek, F., Eckstein, D., Schmitt, U., Autio, J., and Heikkinen, O.: Multiproxy dendroclimatology: a pilot study in northern Finland, Holocene, 13, 829–838, https://doi.org/10.1191/0959683603hl668rp, 2003. a
Nielsen, A. B., Möller, P. F., Giesecke, T., Stavngaard, B., Fontana, S. L., and Bradshaw, R. H. W.: The effect of climate conditions on inter-annual flowering variability monitored by pollen traps below the canopy in Draved Forest, Denmark, Veg. Hist. Archaebot., 19, 309–323, https://doi.org/10.1007/s00334-010-0253-3, 2010. a, b
Nosova, M. B., Novenko, E. Y., Severova, E. E., and Volkova, O. A.: Vegetation and climate changes within and around the Polistovo-Lovatskaya mire system (Pskov Oblast, north-western Russia) during the past 10,500 years, Veg. Hist. Archaebot., 28, 123–140, https://doi.org/10.1007/s00334-018-0693-8, 2019. a
Overpeck, J. T., Webb, T., and Prentice, I. C.: Quantitative interpretation of fossil pollen spectra: Dissimilarity coefficients and the method of modern analogs, Quaternary Res., 23, 87–108, https://doi.org/10.1016/0033-5894(85)90074-2, 1985. a
Pardoe, H. S., Giesecke, T., Knaap, W. O., Svitavská-Svobodová, H., Kvavadze, E. V., Panajiotidis, S., Gerasimidis, A., Pidek, I. A., Zimny, M., Święta-Musznicka, J., Latałowa, M., Noryśkiewicz, A. M., Bozilova, E., Tonkov, S., Filipova-Marinova, M. V., Leeuwen, J. F. N., and Kalniṇa, L.: Comparing pollen spectra from modified Tauber traps and moss samples: examples from a selection of woodlands across Europe, Veg. Hist. Archaebot., 19, 271–283, https://doi.org/10.1007/s00334-010-0258-y, 2010. a, b
Parshall, T.: Documenting forest stand invasion: fossil stomata and pollen in forest hollows, Can. J. Botany, 77, 1529–1538, https://doi.org/10.1139/b99-133, 1999. a
Pennington, W.: The Origin of Pollen in Lake Sediments: An Enclosed Lake Compared with One Receiving Inflow Streams, New Phytol., 83, 189–213, https://doi.org/10.1111/j.1469-8137.1979.tb00741.x, 1979. a
Pers-Kamczyc, E., Tyrała-Wierucka, Ż., Rabska, M., Wrońska-Pilarek, D., and Kamczyc, J.: The higher availability of nutrients increases the production but decreases the quality of pollen grains in Juniperus communis L., J. Plant Physiol., 248, 153156, https://doi.org/10.1016/j.jplph.2020.153156, 2020. a
Pidek, I. A.: Nine-year record of Alnus pollen deposition in the Roztocze region (SE Poland) with relation to vegetation data, Acta Agrobot., 60, 57–64, 2007. a
Pidek, I. A., Svitavská-Svobodová, H., van der Knaap, W. O., Noryśkiewicz, A. M., Filbrandt-Czaja, A., Noryśkiewicz, B., Latałowa, M., Zimny, M., Święta-Musznicka, J., Bozilova, E., Tonkov, S., Filipova-Marinova, M., Poska, A., Giesecke, T., and Gikov, A.: Variation in annual pollen accumulation rates of Fagus along a N–S transect in Europe based on pollen traps, Veg. Hist. Archaebot., 19, 259–270, https://doi.org/10.1007/s00334-010-0248-0, 2010. a
Pędziszewska, A., Tylmann, W., Witak, M., Piotrowska, N., Maciejewska, E., and Latałowa, M.: Holocene environmental changes reflected by pollen, diatoms, and geochemistry of annually laminated sediments of Lake Suminko in the Kashubian Lake District (N Poland), Rev. Palaeobot. Palyno., 216, 55–75, https://doi.org/10.1016/j.revpalbo.2015.01.008, 2015. a
R Core Team: R: A Language and Environment for Statistical Computing, R Foundation for Statistical Computing, Vienna, Austria, 2019. a
San-Miguel-Ayanz, J., de Rigo, D., Caudullo, G., Houston Durrant, T., and Mauri, A.: European atlas of forest tree species, Publication Office of the European Union, Luxembourg, 2016th edn., https://doi.org/10.2788/4251, 2016. a, b, c, d, e, f, g, h, i
Seppä, H. and Hicks, S.: Integration of modern and past pollen accumulation rate (PAR) records across the arctic tree-line: a method for more precise vegetation reconstructions, Quaternary Sci. Rev., 25, 1501–1516, https://doi.org/10.1016/j.quascirev.2005.12.002, 2006. a, b
Seppä, H. and Weckström, J.: Holocene vegetational and limnological changes in the Fennoscandian tree-line area as documented by pollen and diatom records from Lake Tsuolbmajavri, Finland, Écoscience, 6, 621–635, https://doi.org/10.1080/11956860.1999.11682562, 1999. a
Seppä, H., Nyman, M., Korhola, A., and Weckström, J.: Changes of treelines and alpine vegetation in relation to post-glacial climate dynamics in northern Fennoscandia based on pollen and chironomid records, J. Quaternary Sci., 17, 287–301, https://doi.org/10.1002/jqs.678, 2002. a
Seppä, H., Alenius, T., Muukkonen, P., Giesecke, T., Miller, P. A., and Ojala, A. E.: Calibrated pollen accumulation rates as a basis for quantitative tree biomass reconstructions, Holocene, 19, 209–220, https://doi.org/10.1177/0959683608100565, 2009. a, b
Shumilovskikh, L. S., Novenko, E., and Giesecke, T.: Long-term dynamics of the East European forest-steppe ecotone, J. Veg. Sci., 29, 416–426, https://doi.org/10.1111/jvs.12585, 2018. a
Stockmarr, J.: Tablets with spores used in absolute pollen analysis, Pollen et Spores, 13, 615–621, 1971. a
Sugita, S., Hicks, S., and Sormunen, H.: Absolute pollen productivity and pollen-vegetation relationships in northern Finland, J. Quaternary Sci., 25, 724–736, https://doi.org/10.1002/jqs.1349, 2009. a, b
Svobodová, H., Soukupová, L., and Reille, M.: Diversified development of mountain mires, Bohemian Forest, Central Europe, in the last 13,000 years, Quatern. Int., 91, 123–135, https://doi.org/10.1016/S1040-6182(01)00106-9, 2002. a
Tauber, H.: Investigations of the mode of pollen transfer in forested areas, Rev. Palaeobot. Palyno., 3, 277–286, https://doi.org/10.1016/0034-6667(67)90060-7, 1967. a, b
Tauber, H.: A Static Non-overload Pollen Collector, New Phytol., 73, 359–369, https://doi.org/10.1111/j.1469-8137.1974.tb04770.x, 1974. a
Theuerkauf, M., Bos, J. A. A., Jahns, S., Janke, W., Kuparinen, A., Stebich, M., and Joosten, H.: Corylus expansion and persistent openness in the early Holocene vegetation of northern central Europe, Quaternary Sci. Rev., 90, 183–198, https://doi.org/10.1016/j.quascirev.2014.03.002, 2014. a
Tinner, W., Colombaroli, D., Heiri, O., Henne, P. D., Steinacher, M., Untenecker, J., Vescovi, E., Allen, J. R. M., Carraro, G., Conedera, M., Joos, F., Lotter, A. F., Luterbacher, J., Samartin, S., and Valsecchi, V.: The past ecology of Abies alba provides new perspectives on future responses of silver fir forests to global warming, Ecol. Monogr., 83, 419–439, https://doi.org/10.1890/12-2231.1, 2013. a
Tinsley, H.: Modern pollen deposition in traps on a transect across an anthropogenic tree-line on Exmoor, southwest England: a note summarising the first three years of data, Rev. Palaeobot. Palyno., 117, 153–158, https://doi.org/10.1016/S0034-6667(01)00083-5, 2001. a
Tinsley, H. and Hicks, S.: Preface, Rev. Palaeobot. Palyno., 117, vii–x, https://doi.org/10.1016/S0034-6667(01)00073-2, 2001. a
Tonkov, S., Hicks, S., Bozilova, E., and Atanassova, J.: Pollen monitoring in the central Rila Mountains, Southwestern Bulgaria: comparisons between pollen traps and surface samples for the period 1993–1999, Rev. Palaeobot. Palyno., 117, 167–182, https://doi.org/10.1016/S0034-6667(01)00085-9, 2001. a
Tonkov, S., Bozilova, E., Pavlova, D., and Raev, I.: Long-term pollen monitoring experiments for the period 1994–2008 in the Rila Mountains, Bulgaria, Eurasian Journal of Forest Science, 4, 1–16, https://doi.org/10.31195/ejejfs.258621, 2016. a
van der Knaap, W. O., van Leeuwen, J. F. N., Fankhauser, A., and Ammann, B.: Palynostratigraphy of the last centuries in Switzerland based on 23 lake and mire deposits: chronostratigraphic pollen markers, regional patterns, and local histories, Rev. Palaeobot. Palyno., 108, 85–142, https://doi.org/10.1016/S0034-6667(99)00035-4, 2000. a, b
van der Knaap, W. O., van Leeuwen, J. F. N., and Ammann, B.: Seven years of annual pollen influx at the forest limit in the Swiss Alps studied by pollen traps: relations to vegetation and climate, Rev. Palaeobot. Palyno., 117, 31–52, https://doi.org/10.1016/S0034-6667(01)00075-6, 2001. a
van der Knaap, W. O., van Leeuwen, J. F. N., Svitavská-Svobodová, H., Pidek, I. A., Kvavadze, E., Chichinadze, M., Giesecke, T., Kaszewski, B. M., Oberli, F., Kalniṇa, L., Pardoe, H. S., Tinner, W., and Ammann, B.: Annual pollen traps reveal the complexity of climatic control on pollen productivity in Europe and the Caucasus, Veg. Hist. Archaebot., 19, 285–307, https://doi.org/10.1007/s00334-010-0250-6, 2010. a, b, c, d
Veski, S., Amon, L., Heinsalu, A., Reitalu, T., Saarse, L., Stivrins, N., and Vassiljev, J.: Lateglacial vegetation dynamics in the eastern Baltic region between 14,500 and 11,400 cal yr BP: A complete record since the Bølling (GI-1e) to the Holocene, Quaternary Sci. Rev., 40, 39–53, https://doi.org/10.1016/j.quascirev.2012.02.013, 2012. a
Wang, H. and Song, M.: Ckmeans.1d.dp: Optimal k-means Clustering in One Dimension by Dynamic Programming, The R Journal, 3, 29–33, https://doi.org/10.32614/RJ-2011-015, 2011. a
Wayne, P., Foster, S., Connolly, J., Bazzaz, F., and Epstein, P.: Production of allergenic pollen by ragweed (Ambrosia artemisiifolia L.) is increased in CO2-enriched atmospheres, Ann. Allerg. Asthma Im., 88, 279–282, https://doi.org/10.1016/S1081-1206(10)62009-1, 2002. a
Welten, M.: Pollenanalytische, stratigraphische und geochronologische Untersuchungen aus dem Faulenseemoos bei Spiez, in: Veröffentlichungen des Geobotanischen Instituts Rübel in Zürich, H. Huber, Bern, vol. 21, 1944 (in German). a
Williams, J. W., Grimm, E. C., Blois, J. L., Charles, D. F., Davis, E. B., Goring, S. J., Graham, R. W., Smith, A. J., Anderson, M., Arroyo-Cabrales, J., Ashworth, A. C., Betancourt, J. L., Bills, B. W., Booth, R. K., Buckland, P. I., Curry, B. B., Giesecke, T., Jackson, S. T., Latorre, C., Nichols, J., Purdum, T., Roth, R. E., Stryker, M., and Takahara, H.: The Neotoma Paleoecology Database, a multiproxy, international, community-curated data resource, Quaternary Res., 89, 156–177, https://doi.org/10.1017/qua.2017.105, 2018. a
WorldClim: available at: http://worldclim.org/version2, last access: 20 January 2019. a