the Creative Commons Attribution 4.0 License.
the Creative Commons Attribution 4.0 License.
 | 25 Oct 2019
CO2 and CH4 budgets and global warming potential modifications in Sphagnum-dominated peat mesocosms invaded by Molinia caerulea
Fabien Leroy
Sébastien Gogo
Christophe Guimbaud
Léonard Bernard-Jannin
Xiaole Yin
Guillaume Belot
Wang Shuguang
Fatima Laggoun-Défarge
Plant communities play a key role in regulating greenhouse gas (GHG) emissions in peatland ecosystems and therefore in their ability to act as carbon (C) sinks. However, in response to global change, a shift from Sphagnum-dominated to vascular-plant-dominated peatlands may occur, with a potential alteration in their C-sink function. To investigate how the main GHG fluxes (CO2 and CH4) are affected by a plant community change (shift from dominance of Sphagnum mosses to vascular plants, i.e., Molinia caerulea), a mesocosm experiment was set up. Gross primary production (GPP), ecosystem respiration (ER) and CH4 emission models were used to estimate the annual C balance and global warming potential under both vegetation covers. While the ER and CH4 emission models estimated an output of, respectively, 376±108 and 7±4 g C m−2 yr−1 in Sphagnum mesocosms, this reached 1018±362 and 33±8 g C m−2 yr−1 in mesocosms with Sphagnum rubellum and Molinia caerulea. Annual modeled GPP was estimated at and g C m−2 yr−1 in Sphagnum and Sphagnum + Molinia plots, respectively, leading to an annual CO2 and CH4 budget of −30 g C m−2 yr−1 in Sphagnum plots and of −223 g C m−2 yr−1 in Sphagnum + Molinia ones (i.e., a C sink). Even if CH4 emissions accounted for a small part of the gaseous C efflux (ca. 3 %), their global warming potential value makes both plant communities have a climate warming effect. The shift of vegetation from Sphagnum mosses to Molinia caerulea seems beneficial for C sequestration at a gaseous level. However, roots and litter of Molinia caerulea could provide substrates for C emissions that were not taken into account in the short measurement period studied here.
- Article
(1199 KB) -
Supplement
(266 KB) - BibTeX
- EndNote


Peatlands are wetlands that act as a carbon (C) sink at a global scale. They cover only 3 % of the land area but have accumulated between 473 to 621 Gt C (Yu et al., 2010), representing 30 % of the global soil C. The C-storage capacity of northern peatlands is closely linked to environmental conditions and plant cover characteristics which limit the activity of soil decomposers. As a result, in spite of the relatively small net ecosystem production in peatlands, the imbalance between primary production and decomposition is enough to allow high organic matter (OM) accumulation as peat (Bragazza et al., 2009). Accumulating Sphagnum litter forms a major component of peat (Turetsky, 2003) and creates acidic, nutrient-poor, wet and anoxic conditions that favor the peat accumulation. Thus, Sphagnum species are able to outcompete vascular plants and reduce microbial decomposition (van Breemen, 1995). However, due to global change, environmental modifications (nutrient input, water table drop, warmer climate, etc.) are expected to cause a plant community shift in peatlands, with an increase in vascular plants (especially graminoids) to the detriment of Sphagnum species (Berendse et al., 2001; Buttler et al., 2015; Dieleman et al., 2015). Vascular plant invasion could lead to a faster decomposition of peat OM due to a change in litter quality as a substrate for decomposers, thereby decreasing C sequestration (Strakova et al., 2011). Furthermore, OM already stored in deep peat may be subject to increased decomposition through the stimulating effect of rhizospheric C input (Girkin et al., 2018). If these losses are not compensated by increased gross primary productivity, peatlands could shift from a sink to a source of C and could increase greenhouse gas emissions, mainly carbon dioxide (CO2) and methane (CH4). Vascular plant invasion in peatlands has mostly been studied through a change in decomposition rates (Moore et al., 2007; Gogo et al., 2016) and modification in decomposer activities (Krab et al., 2013; Strakova et al., 2011). Some studies have paid attention to CH4 emissions with and without the presence of Carex or Eriophorum (Noyce et al., 2014; Green and Baird, 2012; Greenup et al., 2000) and to CO2 fluxes with different plant community compositions (Neff and Hooper, 2002; Ward et al., 2013). In spite of observed changes in C fluxes, the role of vascular-plant invasion in the C balance in peatlands remains to be elucidated. The aim of this study was to investigate how an invading graminoid species, Molinia caerulea, can affect the greenhouse gas C budget (GGCB) of a Sphagnum-dominated peatland. Molinia caerulea encroachment is a well-acknowledged problem in Europe linked to anthropogenic pressures such as nutrient deposition and management practices, but studies of the effects on peatland ecosystem are still limited (Ritson et al., 2017; Berendse et al., 2001; Chambers et al., 1999). Here, CO2 fluxes and CH4 emissions were regularly measured in mesocosms entirely covers by Sphagnum rubellum with or without Molinia caerulea during 14 months and were related to biotic and abiotic factors to estimate the annual C budget. The experimental design and a part of the data have been used in Leroy et al. (2017, 2019) to explore different questions than those explored in the present paper: the temperature sensitivity and N-deposition effect on the C and N cycle with two different plant communities in peatlands, respectively. In this paper, the novelty was (1) treatment of the GPP data (which was not done in any of the other two published papers) and (2) the modeling of the C fluxes (GPP, ecosystem respiration – ER – and CH4 emissions) to estimate, in fine, the C balance under these two plants communities. Such C budget calculation allowed the estimation of the global warming potential, a key feature of the paper, which was not studied in the previous papers and deserves attention on its own.
2.1 Experimental design, sampling and methods
Twelve cylindrical peat mesocosms (30 cm in thickness and diameter) and water were collected in La Guette peatland (France) in March 2015. The site is a Sphagnum-dominated transitional fen that was invaded by Molinia caerulea and Betula spp. (Betula verrucosa and Betula pubescens), promoted by hydrological disturbances and nutrient inputs (Gogo et al., 2011). The mesocosms were buried near the laboratory in mineral soil, with a waterproof tarpaulin containing peat water surrounding them. Environmental conditions were monitored with a weather station, including solar radiation, relative humidity, and air and soil temperature at the 5 and 20 cm depth every 15 min. The mesocosms were separated into two treatment groups: six mesocosms containing only Sphagnum rubellum (called “Sphagnum” plots) and six containing both Sphagnum rubellum and Molinia caerulea (called “Sphagnum + Molinia” plots). All mesocosms were entirely and exclusively covered by Sphagnum rubellum. Molinia caerulea appeared in May and increased up to 60 % of mesocosms on average until its senescence in November (Leroy et al., 2017) and did not affect Sphagnum cover (unpublished data). Molinia caerulea seedlings (roots and stems) were manually removed from Sphagnum plots. The water table level (WTL) was measured by a piezometer installed within each mesocosm and was maintained between 5 and 10 cm depth with addition of peat water when necessary. The number and height of Molinia caerulea leaves were measured.
2.2 Greenhouse gas measurements
Measurements were performed with the static chamber method from May 2015 to June 2016. The global principle of this method is to pose a hermetic chamber on the mesocosms in order to monitor the gas concentrations inside this chamber from which gas fluxes between soil and atmosphere can be calculated. Here, CO2 and CH4 fluxes were measured once or twice per week during the growing season (April–October 2015 and April–June 2016) and every 2 weeks during the winter (November 2015–March 2016). The measurement was usually performed between 09:00 and 17:00 LT. Here, the effect of diurnal cycle on fluxes that is supposed to be taking the modeling processes into account because of this diurnal variation seems related to the environmental parameters (Wright et al., 2013). The CO2 and CH4 emissions reported here are also used in Leroy et al. (2017) to discuss their temperature sensitivity but used for only 1 year of measurement (from May 2015 to April 2016). Here, these emissions are used to establish a C balance to complement the GPP. CO2 concentrations were estimated using a GMP343 Vaisala probe inserted into a transparent PVC chamber (D'Angelo et al., 2016; Leroy et al., 2017). This clear chamber was used to measure the net ecosystem exchange (NEE), the balance between gross primary production (GPP; absorption of CO2 by photosynthesis) and ER (release of CO2 into the atmosphere). ER was measured by placing an opaque cover on the chamber to block photosynthesis. The difference between NEE and ER corresponded to the GPP. The measurements lasted a maximum of 5 min, and CO2 concentration was recorded every 5 s. The slope of the relationship between CO2 concentration and time allowed for fluxes (in µmol CO2 m−2 s−1) to be calculated. CH4 emissions were measured using SPIRIT, a portable infrared laser spectrometer (Guimbaud et al., 2016), measuring CH4 concentration in a transparent chamber. Measurements take several to 20 min, with a time resolution of 1.5 s (Guimbaud et al., 2011).
2.3 Carbon flux modeling
2.3.1 Ecosystem respiration
The ER increased with increasing air temperature and decreasing WTL in both vegetation covers (Supplement), as found by Bortoluzzi et al. (2006). Here, in order to improve the data analysis from Leroy et al. (2017) and establish a C balance, the ER was derived for the entire year by using the equation from Bortoluzzi et al. (2006) for Sphagnum plots (Eq. 1):
ER is the ecosystem respiration flux (µmol CO2 m−2 s−1). Tref is the reference air temperature and Tmin the minimum air temperature. These two parameters were set as in Bortoluzzi et al. (2006) at 15 and −5 ∘C, respectively. Ta refers to the measured air temperature (∘C). The reference for the WTL (WTLref) was set at −15 cm, corresponding to the deepest WTL recorded in the mesocosms. The coefficients a, b and c (temperature sensitivity parameters) are empirical parameters.
In Sphagnum + Molinia plots, ER was significantly correlated to the number of Molinia caerulea leaves (r2=0.44; Supplement). Following Bortoluzzi et al. (2006) and Kandel et al. (2013), we included, in addition to WTL and temperature, a vegetation index based on the number of Molinia caerulea leaves in the ER model for Sphagnum + Molinia plots (Eq. 2):
Mcleaves is the number of Molinia caerulea leaves.
2.3.2 Gross primary production
The relationship between GPP and photosynthetic photon flux density (PPFD) is often described by a rectangular hyperbolic saturation curve with
where i (µmol CO2 µmol−1 per photon) is the initial slope of the hyperbola, GPPmax is the maximum GPP (µmol m−2 s−1) and PPFD is the photosynthetic photon flux density (µmol m−2 s−1). This approach was modified by Mahadevan et al. (2008) and Kandel et al. (2013) to include the effect of temperature and vegetation on the GPP model. The vegetation index was implemented (Mcleaves) in the models after studying the relationship between GPP and photosynthetic photon flux density at different vegetation stages (described in Results; Figs. 2 and S1). The same equation was used in this study (Eq. 4):
where GPPmax (µmol m−2 s−1) represents the GPP at light saturation, the parameter k (µmol m−2 s−1; Eq. 4) is the half-saturation value, and Mcleaves is the number of Molinia caerulea leaves. Tscale is the temperature sensitivity of photosynthesis based on Kandel et al. (2013) and calculated as
where T is the air temperature measured with the weather station, and Tmin, Topt and Tmax represent the minimum, optimum and maximum air temperature for photosynthesis, which were set at 0, 20 and 40 ∘C, respectively.
2.3.3 CH4 emissions
The CH4 emissions were significantly correlated to the soil temperature and the water table level (Leroy et al., 2017; Supplement). An equation similar to Eq. (1) was used to model the emissions (Eq. 6):
where WTLref, Tmin, Tref and Tmin were set as for the ER equation. Ts refers to the measured soil temperature (∘C).
2.3.4 Model calibration and validation
Two-thirds of the ER and CH4 emission measurements (randomly selected) were used to calibrate the equations, and the other third was used for validation in order to verify the calibrated model. Calibration of the GPP models was done using additional measurements, with nets decreasing the PPFD (allowing six GPP measurements under different luminosity per mesocosm) in order to calibrate the GPPmax and k parameters based on the Michaelis–Menten equation. In this way, all measurement points were used to validate the model. Model quality was evaluated using the determination coefficient (r2) and the normalized root-mean-square error (NRMSE), calculated as
where y is the measured value, the computed value, n the number of values and the average of the measured value. The NRMSE indicates the percentage of variance between the measured and the predicted values.
The parameters of ER (a, b and c) and CH4 emissions (d, e and f) models were calibrated by minimizing the NRMSE using the “SANN” method of the optim function in R (R Core Team, 2016).
2.3.5 Greenhouse gas C budget and global warming potential
The net ecosystem C balance (NECB) represents the net rate of C accumulation or release in or from the ecosystem (Chapin et al., 2006) and is calculated as
where GPP is the gross primary production (µmol m−2 s−1); ER is the ecosystem respiration (µmol m−2 s−1); and , FCO, FVOC, FDIC, FDOC and FPC are the fluxes (in mµmol m−2 s−1) of methane (CH4), C monoxide (CO), volatile organic C (VOC), dissolved inorganic C (DIC), dissolved organic C (DOC) and particulate C (PC), respectively. In this study, we used a simplified approach based on the GPP, ER and CH4 emissions that we referred to as the GGCB (g C m−2 yr−1). To calculate annual emissions, we run our models with a 15 min time step using continuous weather and vegetation data.
The global warming potential over 100 years (GWP100; g CO2 eq. m−2 yr−1) was calculated for both plant communities based on the annual greenhouse gas (GHG) fluxes (GPP and ER and the CH4 emissions) with Eq. (9):
with x and y representing the annual GPP and ER fluxes (in g C m−2 yr−1) and z representing the annual CH4 emissions (in g C m−2 yr−1). The radiative force (GWP100) of CH4 is 34 times that of CO2 (Myhre et al., 2013).
2.4 Statistics
The effects of Molinia caerulea were assessed by comparing Sphagnum + Molinia plots to Sphagnum plots, with two-way repeated-measure ANOVAs (with plant cover and date as factors).
3.1 Environmental conditions
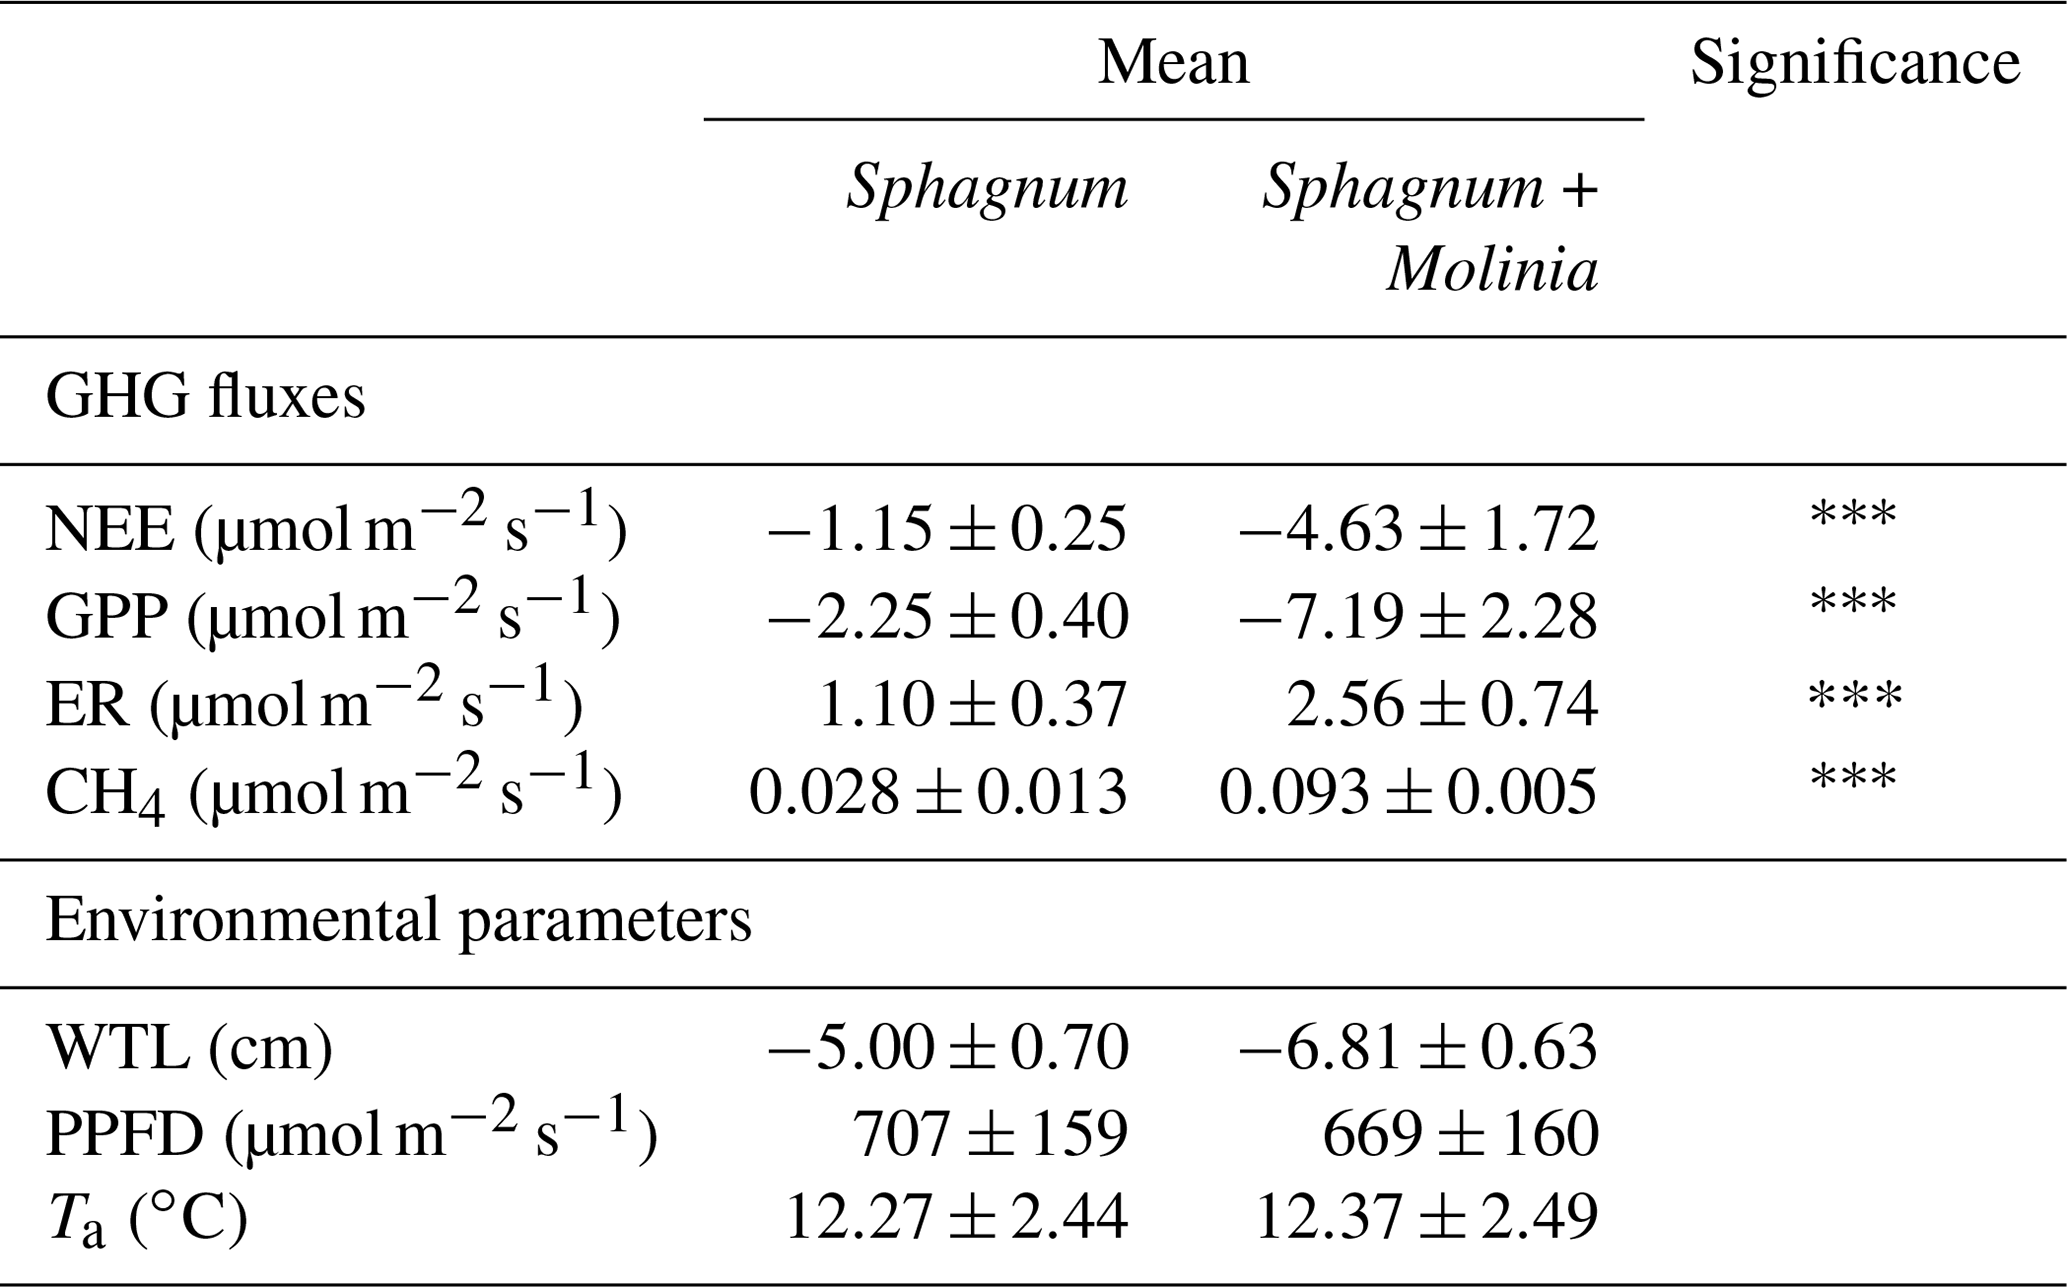
The environmental conditions of our measurements did not significantly differ between Sphagnum + Molinia and Sphagnum plots (Table 1). The only significant differences concern the GHG fluxes, with higher fluxes in Sphagnum + Molinia plots compared to the Sphagnum plots.
Table 1Mean values of measurements of net ecosystem exchange (NEE), gross primary production (GPP), ecosystem respiration (ER), CH4 emissions (CH4), photosynthetic photon flux density (PPFD), water table level (WTL) and air temperature (Ta) in Sphagnum + Molinia and Sphagnum plots. Significant differences of two-way repeated-measure ANOVAs are expressed as , with p<0.001 (n=6). Data are presented as mean ±SE, where n=12.
3.2 Measured GHG fluxes
ER was significantly higher in Sphagnum + Molinia plots compared to Sphagnum ones. In both vegetation covers, the ER was maximum in July and minimum in January–February (Fig. 1a). GPP increased during the vegetation period (linked to the number of Molinia leaves), whereas in Sphagnum plots the GPP was relatively constant (Fig. 1b). After the senescence of Molinia caerulea, the GPP did not differ between the two treatments, unlike ER, which remained higher in Molinia plots compared to Sphagnum ones. As a result, the NEE was higher in Sphagnum + Molinia plots than in Sphagnum ones during the growing season but was lower the rest of the time (Fig. 1c). CH4 emissions significantly increased in Sphagnum + Molinia plots, with a peak of emissions in summer (June–August) and the lowest emissions in winter (Fig. 1d).
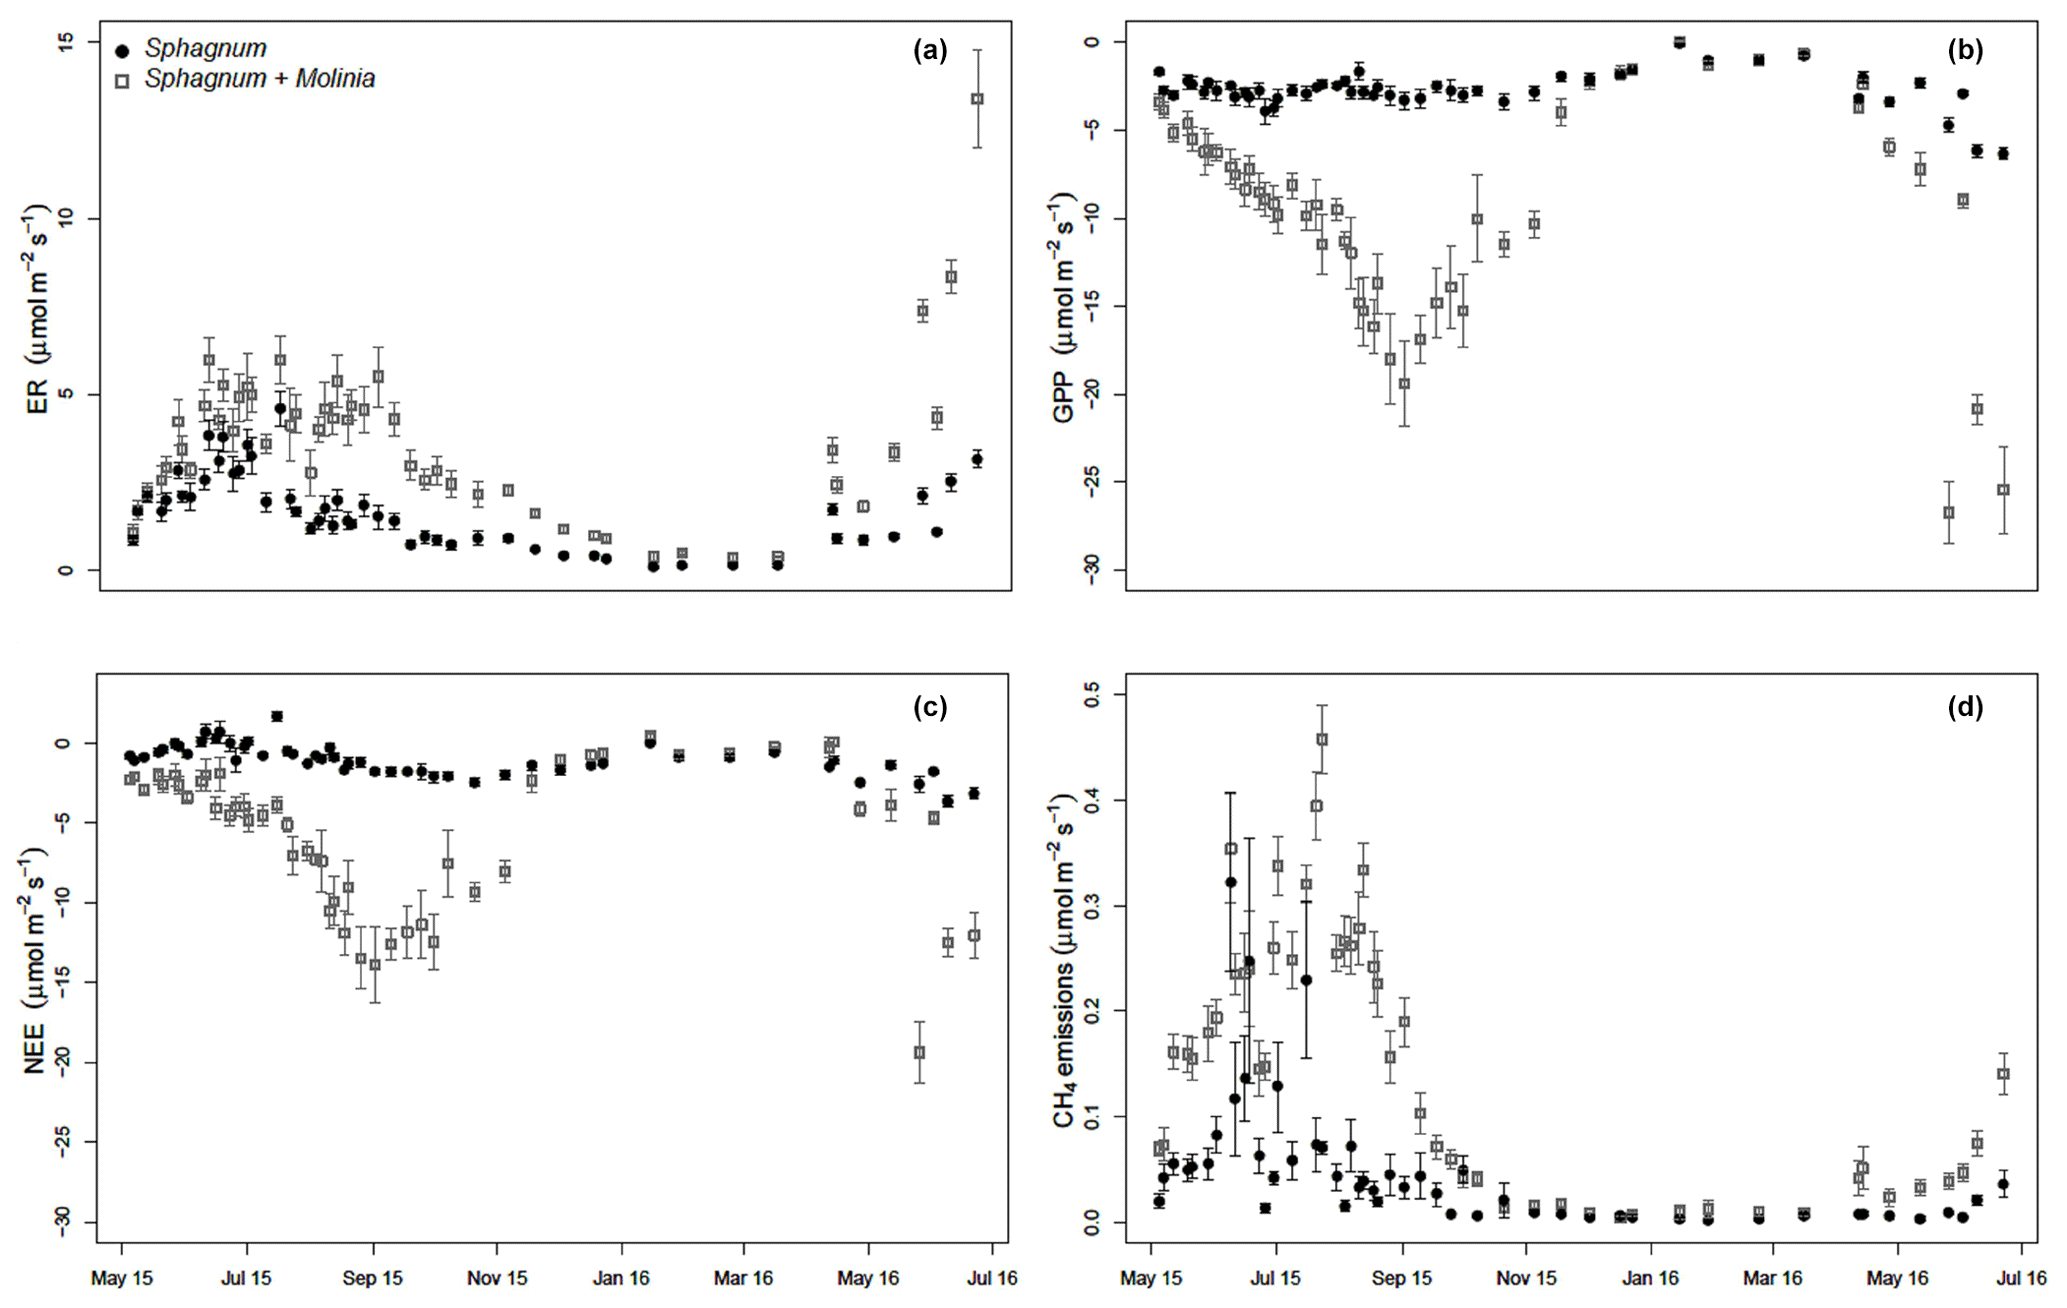
Figure 1Measurements of ecosystem respiration (ER; a), gross primary production (GPP, b), net ecosystem exchange (NEE, c) and CH4 emissions (d) in Sphagnum and Sphagnum + Molinia plots (±SE; n=6) from May 2015 to June 2016.
3.3 Calibration and validation of the GPP models
GPP parameters were calibrated using the photosynthesis–PPFD curves based on the Michaelis–Menten equation using four additional measurements (Fig. 2). The GPPmax decreased from −4.6 to −7.4 µmol m−2 s−1 in Sphagnum plots and from −7.2 in April to −25.7 µmol m−2 s−1 at the end of June in Sphagnum + Molinia plots.
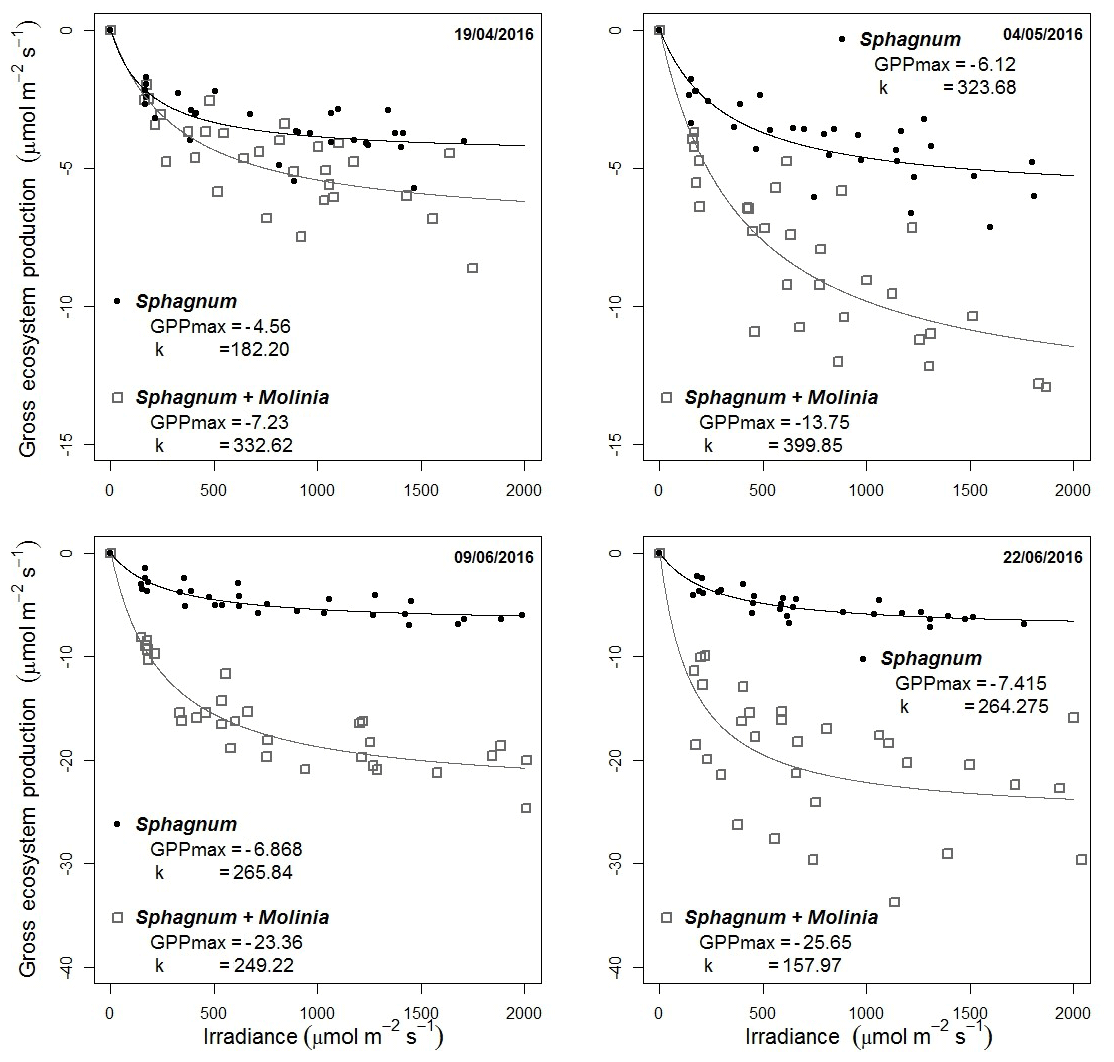
Figure 2Dependence of gross primary production (GPP) on PPFD on four dates. The photosynthesis–PPFD curve shows the maximum rate of photosynthesis (GPPmax) and the half-saturation value (k).
These increases are linked to Sphagnum growth and the number of Molinia caerulea leaves, respectively (Supplement). The parameter k (µmol m−2 s−1; Eq. 4) is the half-saturation value and was set at the mean k value of the four dates, with k equal to 259 µmol m−2 s−1 for Sphagnum plots and 285 µmol m−2 s−1 for Sphagnum + Molinia ones.
Models validations were done using all the measurement points and showed good reproduction of the GPP measurements even if the relatively constant GPP in Sphagnum plots had a NRMSE close to 70.
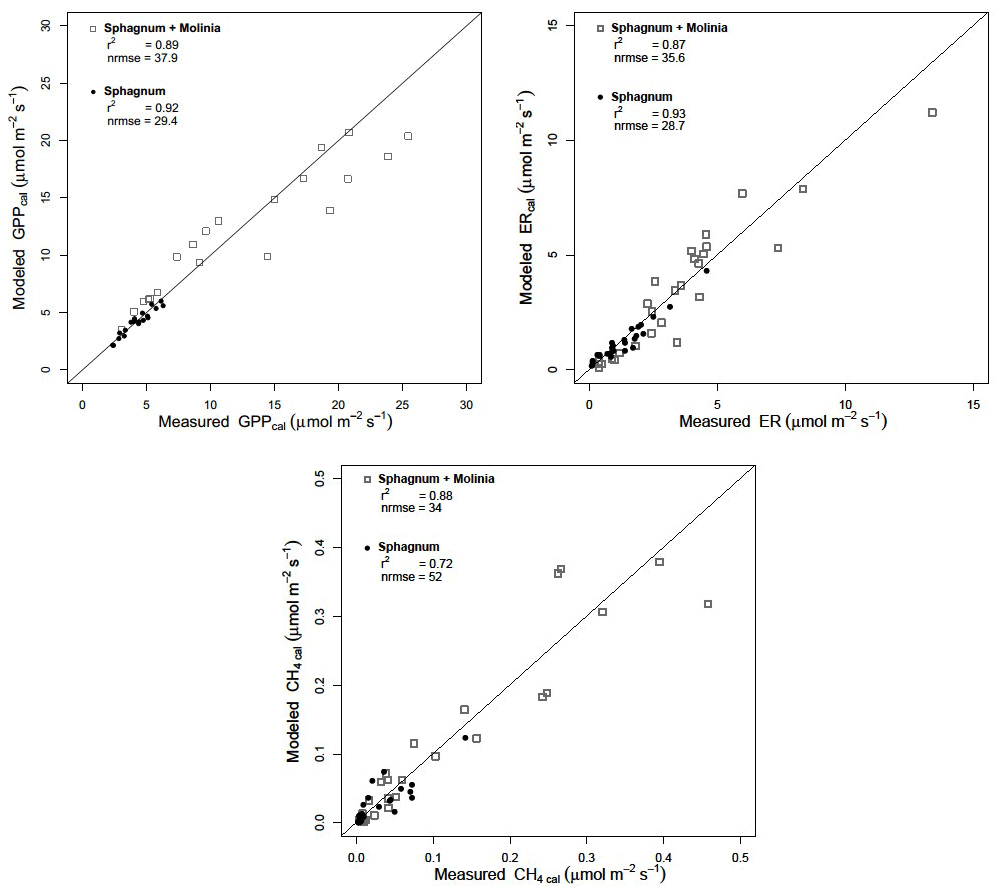
Figure 3Calibration of the models by comparison of simulated and measured ecosystem respiration (ER), gross primary production (GPP) and CH4 emission (CH4) in Sphagnum and Sphagnum + Molinia plots. The diagonal lines represent the 1:1 correlation.
3.4 Calibration and validation of the ER and CH4 emission models
Calibration of the models showed a good agreement between the modeled and measured ER and CH4 emissions, with a high r2 and low NRMSE for both plant communities (Fig. 3). Regarding the model evaluation, the validation data represented the ER measurements well, especially in Sphagnum plots, with a r2 of 0.82 and a NRMSE of 46.8 (Table 2). However, in Sphagnum + Molinia plots, the ER model validation showed a r2 close to 0.6, but with a higher NRMSE. The validation of the CH4 models explained a good proportion of the variance, with a r2 of 0.66 in Sphagnum plots and of 0.83 in Sphagnum + Molinia plots (Table 2).
Table 2r2, normalized root-mean-square errors (NRMSEs) and adjusted model parameters for calibration of ecosystem respiration (ER), gross primary production (GPP), net ecosystem exchange (NEE) and CH4 emissions (CH4) in Sphagnum + Molinia and Sphagnum plots.

The model parameters a and c, respectively, related to the WTL and temperature sensitivity for ER models, were close for both plant communities, ranging for a from 2.50 to 1.77 and for c from 1.49 to 1.43 in Sphagnum and Sphagnum + Molina plots, respectively (Table 2). Concerning the parameters of the CH4 models, d and f differed between the two treatments. The parameter d connected to WTL was positive, at 0.041, in Sphagnum plots but negative, at −0.065, in Sphagnum + Molinia plots. The f value, representing the temperature sensitivity, rose from 3.32 in Sphagnum plots to 5.08 in Sphagnum + Molinia plots.
3.5 Greenhouse gas carbon budget and global warming potential
Table 3Modeled annual gross primary production (GPP; g C m−2 yr−1), ecosystem respiration (ER; g C m−2 yr−1) and CH4 emissions (CH4; g C m−2 yr−1) in Sphagnum + Molinia and Sphagnum plots.
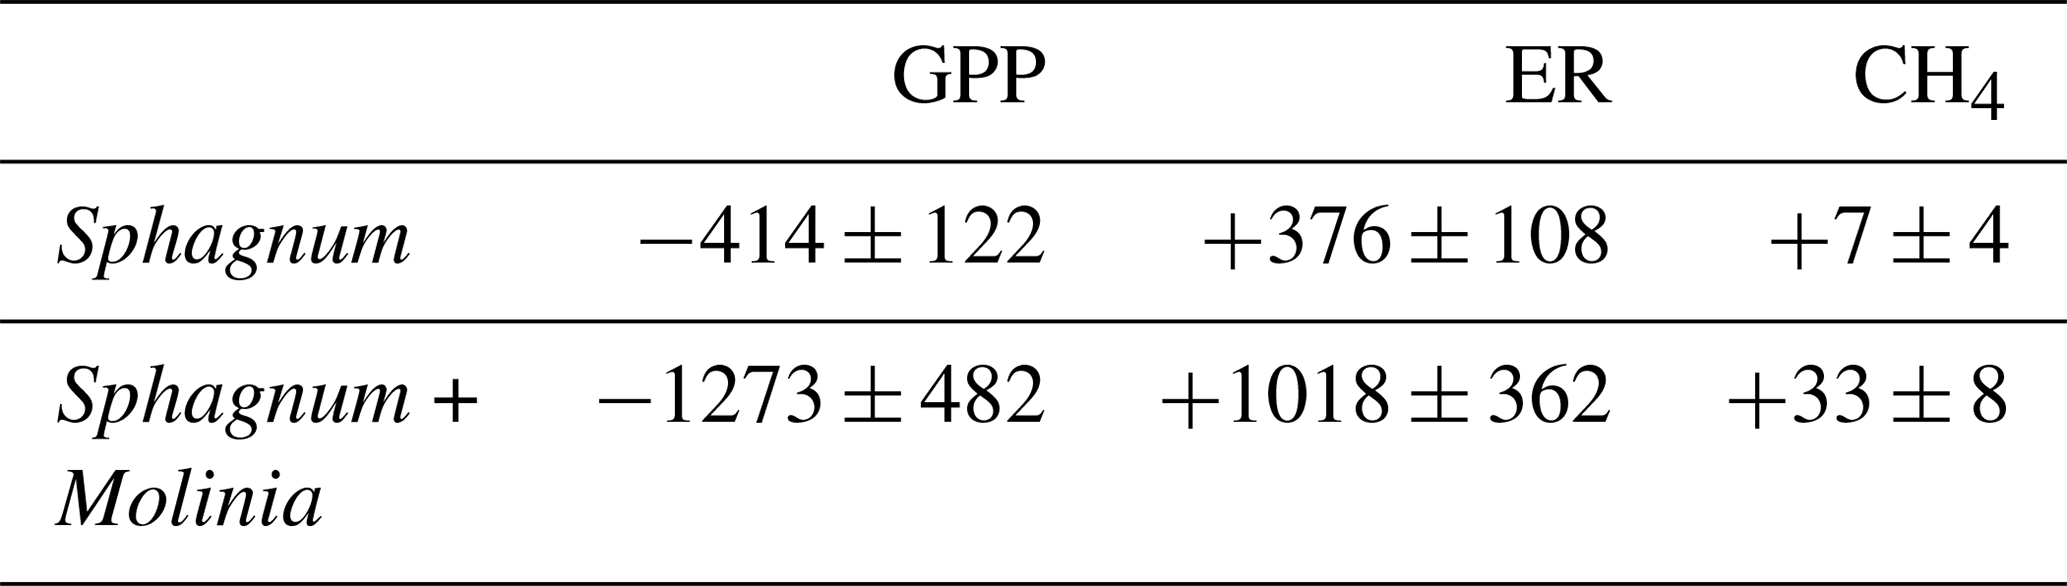
The modeled annual GPP over the studied period represented an input of 414±122 g C m−2 yr−1 in Sphagnum plots and of 1273±482 g C m−2 yr−1 in Sphagnum + Molinia plots (Table 3). The ER and CH4 emissions showed, respectively, an output of 376±108 and 7±4 g C m−2 yr−1 in Sphagnum plots and of 1078±362 and 33±8 g C m−2 yr−1 in Sphagnum + Molinia plots (Table 3).
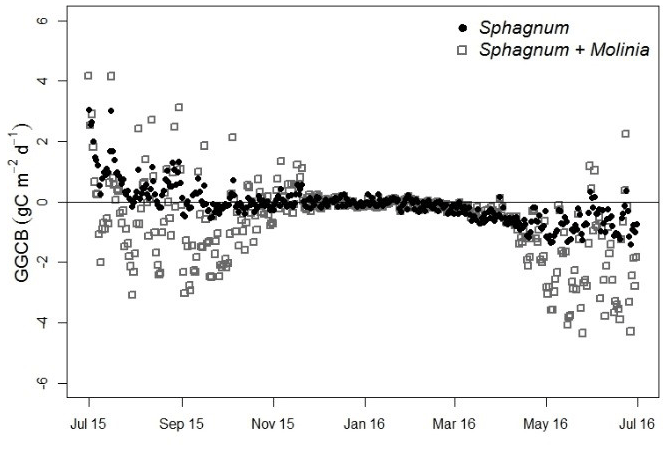
Figure 4Greenhouse gas carbon budget (GGCB) average per day in Sphagnum and Sphagnum + Molinia plots.
From July to December the GGCB was positive in Sphagnum plots, which means that these plots released more C than they absorbed, but the GGCB became negative from January to June (Fig. 4). In contrast, the GGCB in Sphagnum + Molinia plots was mostly negative, with positive values only in October and November. In the results, the annual GGCB of Sphagnum plots absorbed 30 g C m−2 yr−1, whereas the Sphagnum + Molinia plots absorbed 223 g C m−2 yr−1. The GWP100 for Sphagnum and Sphagnum + Molinia plots was, respectively, +195 and +547 g CO2 eq. m−2 yr−1.
4.1 Gaseous C emissions
The presence of Molinia caerulea increased the gaseous C fluxes in the Sphagnum-dominated peat mesocosms. Compared to these, the GPP was higher with Molinia caerulea, with a C uptake close to 1300 g C m−2 yr−1 against 400 g C m−2 yr−1 with Sphagnum alone. This increase is linked to the large leaf area of Molinia caerulea, which increases the photosynthesizing plant material and so the GPP. The estimated GPP of Sphagnum mosses is consistent with studies conducted in boreal peatlands, with a GPP close to 350 g C m−2 yr−1 (Peichl et al., 2014; Trudeau et al., 2014). The GPP calculated with Molinia caerulea was higher than that measured in the site at the La Guette peatland, with an average of 1052 g C m−2 yr−1 (D'Angelo, 2015). Such a difference can be explained by the fact that field vegetation in collars contained other types of plants, such as shrubs and woody chamaephytes, that exhibited a lower GPP (D'Angelo, 2015). A higher GPP of vascular plants is expected to modify the belowground interactions that are not taken into account in our models. Indeed, in comparison to Sphagnum mosses, vascular plants have an extensive root system which is able to release C and fuel microbial communities to optimize resource allocation (Fenner et al., 2007). It has been shown that up to 40 % of photosynthates can be allocated to root exudates in peatland (Crow and Wieder, 2005), and half of that can be mineralized into CO2 in a week and promote the ER (Kuzyakov et al., 2001) as the root decomposition (Ouyang et al., 2017). The higher ER in mesocosms with Molinia caerulea can also be linked to the metabolism of this vascular plant itself, in which leaf respiration can account for more than 40 % of the total assimilated C (Kuzyakov et al., 2001). Furthermore, after Molinia caerulea senescence, the leaves enhance CO2 emissions through decomposition. Higher CH4 emissions with graminoids compared to mosses or shrubs have been explained by the differences in root exudate quality and the aerenchyma of this plant type (e.g., Armstrong et al., 2015).
4.2 Models evaluation and sensitivities to parameters
Evaluation showed that our statistical models were efficient in representing ER and GPP for both plant communities. GPP in Sphagnum plots was the most difficult variable to represent (Table 2; Fig. 3). It was quite constant in time, and only a small decrease was observed in winter, when the solar radiation was low. In accordance with Tuittila et al. (2004), the Sphagnum growth or cover controlled the photosynthesis. These authors also reported that water saturation of Sphagnum governs its photosynthetic capacity and could further improve GPP models (Tuittila et al., 2004). However, with our stable Sphagnum moisture and Sphagnum cover, GPP in Sphagnum plots was mostly controlled by the photosynthetic active radiation. The ER models showed a similar sensitivity in both plant communities to abiotic factors, with an empirical factor related to WTL at 2.1 and a temperature sensitivity close to 1.45 (Table 2). The parameters were similar for both plant communities, and ER differences were mainly due to the contribution of Molinia leaves to aboveground and belowground respiration (Kandel et al., 2013). Modeling CH4 explained a good proportion of the variance (between 70 % and 80 %). The parameters of the CH4 models differed with vegetation cover. The presence of Molinia caerulea increased the temperature sensitivity of CH4 emissions. Such an increase in the temperature sensitivity could result from modification of methanogenesis pathways. Acetoclastic methanogenesis often dominated in minerotrophic peatlands, as the La Guette peatland, and required less energy than hydrogenotrophic methanogenesis pathways (Beer and Blodau, 2007). An explication of vascular plants to influence the methane fluxes is often reported for their capacity to supply easily available substrates for the methanogenic microbes and with high variability in substrate quality and availability depending on plants species (Ström et al., 2012). While root exudates are a source of acetate and thus suggested to favor acetoclastic methanogenesis (Saarnio et al., 2004), the root exudates also stimulate the decomposition of recalcitrant organic matter, favoring hydrogenotrophic methanogenesis (Hornibrook et al., 1997) and, maybe more than acetates, promoting acetoclastic methanogenesis. A shift from acetoclastic to hydrogenotrophic methanogenesis pathways could explain the increase in the temperature sensitivity observed here. Contributions of methanogens pathways to methane release could be explored by using mechanistic models. Such models could obtain new insight with additional measurements as substrate supply or microbial community response that could be considered in future studies.
4.3 Annual C fluxes and GGCB
The shift from Sphagnum-dominated to Molinia-dominated peat mesocosms increased the C fixation through the GPP but also led to an increase in the annual C output with CO2 and CH4 emissions. The gaseous C balance shows that both plant communities act as C sinks, with storage of 30 g C m−2 yr−1 in Sphagnum plots and 223 g C m−2 yr−1 in Sphagnum + Molinia plots. These results contrast with the assumption mentioned in the Introduction that vascular plants could lead to a decrease in C sequestration (Strakova et al., 2011). Nevertheless, the C-sink function of Molinia-dominated peat mesocosms can be questioned in view of the biomass production of Molinia caerulea. The root production, estimated by Taylor et al. (2001) at 1080 g m−2 yr−1, was produced with current-year photosynthates, meaning that the C allocation in roots could account for 540 g C m−2 yr−1. Such an amount corresponds to a larger proportion than the C stored in Sphagnum + Molinia plots (223 g C m−2 yr−1) and could represent emission of the C already stored. Furthermore, C stored in roots, litter and leaves of Molinia caerulea could contribute to future C emissions by decomposition or respiration not taken into account here. Even with this C-sink function, GWP100 is positive for both vegetation covers. Although Sphagnum + Molinia plots act more as a C sink than Sphagnum ones, the higher GWP100 of CH4 compared to CO2 combined with the high emissions of CH4 for Sphagnum + Molinia plots lead to a higher contribution of these plots to the greenhouse effect than in Sphagnum ones.
The shift from Sphagnum-dominated to Molinia-dominated peatlands enhanced CO2 uptake by photosynthesis, which led to higher CO2 and CH4 emissions. The application of models taking air temperature, water table level and vegetation index into account described these CO2 fluxes and CH4 emissions well. Respiration sensitivity to the two abiotic factors (temperature and WTL) was similar in both communities. However, the presence of Molinia caerulea seems to increase the sensitivity of CH4 emissions to temperature. Modeling the C balance suggested that both Sphagnum and Sphagnum + Molinia plots acted as a C sink. However, belowground C allocation as root C stocks needs further consideration due to its potential role as a substantial C source.
This study demonstrates the implications of Molinia caerulea colonization in Sphagnum peatland on the C fluxes and on the parameters controlling it. The invasion of numerous peatlands by Molinia caerulea will profoundly affect their C cycle at the middle term. However, a better understanding of these effects should be performed by projecting belowground C allocation as root C stocks needs further consideration due to its potential role as a substantial C source.
Research data can be accessed by contacting the authors and, soon, through the database of their institution.
The supplement related to this article is available online at: https://doi.org/10.5194/bg-16-4085-2019-supplement.
FL, SG and FLD designed the experiment. FL, SG, CG, XY, GB and WS collected data. FL, SG, CG, LBJ and FLD performed model simulations and data analysis. FL prepared the paper, with contributions from all co-authors.
The authors declare that they have no conflict of interest.
This work was supported by the Labex VOLTAIRE (ANR-10-LABX-100-01). The authors gratefully acknowledge the financial support provided to the PIVOTS project by the Région Centre – Val de Loire (ARD 2020 program and CPER 2015–2020). They thank Alexis Menneguerre for their contribution to gas measurements and Patrick Jacquet and Claude Robert for their assistance in SPIRIT maintenance. We also thank Elizabeth Rowley-Jolivet for revision of the English version.
This research has been supported by the Labex VOLTAIRE (grant no. ANR-10-LABX-100-01).
This paper was edited by Akihiko Ito and reviewed by Martin Brummell and three anonymous referees.
Armstrong, A., Waldron, S., Ostle, N. J., Richardson, H., and Whitaker, J.: Biotic and abiotic factors interact to regulate northern peatland carbon cycling, Ecosystems, 18, 1395–1409, https://doi.org/10.1007/s10021-015-9907-4, 2015.
Beer, J. and Blodau, C.: Transport and thermodynamics constrain belowground carbon turnover in a northern peatland, Geochim. Cosmochim. Ac., 71, 2989–3002, https://doi.org/10.1016/j.gca.2007.03.010, 2007.
Berendse, F., Van Breemen, N., Rydin, H., Buttler, A., Heijmans, M., Hoosbeek, M. R., Lee, J. A, Mitchell, E., Saarinen, T., Vasander, H., and Wallén, B.: Raised atmospheric CO2 levels and increased N deposition cause shifts in plant species composition and production in Sphagnum bogs. Glob. Change Biol., 7, 591–598, https://doi.org/10.1046/j.1365-2486.2001.00433.x, 2001.
Bortoluzzi, E., Epron, D., Siegenthaler, A., Gilbert, D., and Buttler, A.: Carbon balance of a European mountain bog at contrasting stages of regeneration, New Phytol., 172, 708–718, https://doi.org/10.1111/j.1469-8137.2006.01859.x, 2006.
Bragazza, L., Buttler, A., Siegenthaler, A., and Mitchell, E. A.: Plant litter decomposition and nutrient release in peatlands, Geophys. Monogr. Series, 184, 99–110, https://doi.org/10.1029/2008GM000815, 2009.
Buttler, A., Robroek, B. J., Laggoun-Défarge, F., Jassey, V. E., Pochelon, C., Bernard, G., Delarue, F., Gogo, S., Mariotte, P., Mitchell E. A., and Bragazza, L.: Experimental warming interacts with soil moisture to discriminate plant responses in an ombrotrophic peatland, J. Veg. Sci., 26, 964–974, https://doi.org/10.1111/jvs.12296, 2015.
Chambers, F. M., Mauquoy, D., and Todd, P. A.: Recent rise to dominance of Molinia caerulea in environmentally sensitive areas: new perspectives from palaeoecological data, J. Appl. Ecol., 36, 719–733, https://doi.org/10.1046/j.1365-2664.1999.00435.x, 1999.
Chapin, F., Woodwell, G., Randerson, J., Lovett, G., Rastetter, E., Baldocchi, D., Clark, D., Harman, M., Schimel, D., Valentini, R., Wirth, C., Aber, J., Cole, J., Giblin, A., Goulden, M., Harden, J., Heimann, M., Howarth, R., Matson, P., McGuire, A., Melillo, J., Mooney, H., Neff, J., Houghton, R., Pace, M., Ryan, M., Running, S., Sala, O., Schlesinger, W., and Schulze, E.-D.: Reconciling carbon-cycle concepts, terminology, and methods, Ecosystems, 9, 1041–1050, https://doi.org/10.1007/s10021-005-0105-7, 2006.
Crow, S. E. and Wieder, R. K.: Sources of CO2 emission from a northern peatland: root respiration, exudation, and decomposition, Ecology, 86, 1825–1834, https://doi.org/10.1890/04-1575, 2005.
D'Angelo, B.: Variabialité spatio-temporelle des émissions de GES dans une tourbière à Sphaignes: effets sur le bilan carbone, Doctoral dissertation, Université d'Orléans, 53–108, 2015.
D'Angelo, B., Gogo, S., Laggoun-Défarge, F., Le Moing, F., Jégou, F., and Guimbaud, C.: Soil temperature synchronisation improves representation of diel variability of ecosystem respiration in Sphagnum peatlands, Agr. Forest Meteorol., 223, 95–102, https://doi.org/10.1016/j.agrformet.2016.03.021, 2016.
Dieleman, C. M., Branfireun, B. A., McLaughlin, J. W., and Lindo, Z.: Climate change drives a shift in peatland ecosystem plant community: implications for ecosystem function and stability, Glob. Change Biol., 21, 388–395, https://doi.org/10.1111/gcb.12643, 2015.
Fenner, N., Ostle, N. J., McNamara, N., Sparks, T., Harmens, H., Reynolds, B., and Freeman, C.: Elevated CO2 effects on peatland plant community carbon dynamics and DOC production, Ecosystems, 10, 635–647, https://doi.org/10.1007/s10021-007-9051-x, 2007.
Girkin, N. T., Turner, B. L., Ostle, N., Craigon, J., and Sjögersten, S.: Root exudate analogues accelerate CO2 and CH4 production in tropical peat, Soil Biol. Biochem., 117, 48–55, https://doi.org/10.1016/j.soilbio.2017.11.008, 2018.
Gogo, S., Laggoun-Défarge, F., Delarue, F., and Lottier, N.: Invasion of a Sphagnum-peatland by Betula spp and Molinia caerulea impacts organic matter biochemistry, Implications for carbon and nutrient cycling, Biogeochemistry, 106, 53–69, https://doi.org/10.1007/s10533-010-9433-6, 2011.
Gogo, S., Laggoun-Défarge, F., Merzouki, F., Mounier, S., Guirimand-Dufour, A., Jozja, N., Hughet, A., Delarue, F., and Défarge, C.: In situ and laboratory non-additive litter mixture effect on C dynamics of Sphagnum rubellum and Molinia caerulea litters, J. Soil. Sediment., 16, 13–27, https://doi.org/10.1007/s11368-015-1178-3, 2016.
Green, S. M. and Baird, A. J.: A mesocosm study of the role of the sedge Eriophorum angustifolium in the efflux of methane – including that due to episodic ebullition – from peatlands, Plant Soil, 351, 207–218, https://doi.org/10.1007/s11104-011-0945-1, 2012.
Greenup, A. L., Bradford, M. A., McNamara, N. P., Ineson, P., and Lee, J. A.: The role of Eriophorum vaginatum in CH4 flux from an ombrotrophic peatland, Plant Soil, 227, 265–272, https://doi.org/10.1023/A:1026573727311, 2000.
Guimbaud, C., Catoire, V., Gogo, S., Robert, C., Chartier, M., Laggoun-Défarge, F., Grossel, A., Albéric, P., Pomathiod, L., Nicoullaud, B., and Richard, G.: A portable infrared laser spectrometer for flux measurements of trace gases at the geosphere–atmosphere interface, Meas. Sci. Technol., 22, 075601, https://doi.org/10.1088/0957-0233/22/7/075601, 2011.
Guimbaud, C., Noel, C., Chartier, M., Catoire, V., Blessing, M., Gourry, J. C., and Robert, C.: A quantum cascade laser infrared spectrometer for CO2 stable isotope analysis: Field implementation at a hydrocarbon contaminated site under bio-remediation, J. Environ. Sci., 40, 60–74, https://doi.org/10.1016/j.jes.2015.11.015, 2016.
Hornibrook, E. R., Longstaffe, F. J., and Fyfe, W. S.: Spatial distribution of microbial methane production pathways in temperate zone wetland soils: stable carbon and hydrogen isotope evidence, Geochim. Cosmochim. Ac., 61, 745–753, https://doi.org/10.1016/S0016-7037(96)00368-7, 1997.
Kandel, T. P., Elsgaard, L., and Lærke, P. E.: Measurement and modelling of CO2 flux from a drained fen peatland cultivated with reed canary grass and spring barley, Gcb Bioenergy, 5, 548–561, https://doi.org/10.1111/gcbb.12020, 2013.
Krab, E. J., Berg, M. P., Aerts, R., van Logtestijn, R. S., and Cornelissen, J. H.: Vascular plant litter input in subarctic peat bogs changes Collembola diets and decomposition patterns, Soil Biol. Biochem., 63, 106–115, https://doi.org/10.1016/j.soilbio.2013.03.032, 2013.
Kuzyakov, Y., Ehrensberger, H., and Stahr, K.: Carbon partitioning and below-ground translocation by Lolium perenne, Soil Biol. Biochem., 33, 61–74, https://doi.org/10.1016/S0038-0717(00)00115-2, 2001.
Leroy, F., Gogo, S., Guimbaud, C., Bernard-Jannin, L., Hu, Z., and Laggoun-Défarge, F.: Vegetation composition controls temperature sensitivity of CO2 and CH4 emissions and DOC concentration in peatlands, Soil Biol. Biochem., 107, 164–167, https://doi.org/10.1016/j.soilbio.2017.01.005, 2017.
Leroy, F., Gogo, S., Guimbaud, C., Francez, A. J., Zocatelli, R., Défarge, C., Bernard-Jannin, L., Hu, Z., and Laggoun-Défarge, F.: Response of C and N cycles to N fertilization in Sphagnum and Molinia-dominated peat mesocosms, J. Environ. Sci., 77, 264–272, https://doi.org/10.1016/j.jes.2018.08.003, 2019.
Mahadevan, P., Wofsy, S. C., Matross, D. M., Xiao, X., Dunn, A. L., Lin, J. C., Gerbig, C., Munger, J. W., Chow., V. Y., and Gottlieb, E. W.: A satellite-based biosphere parameterization for net ecosystem CO2 exchange: Vegetation Photosynthesis and Respiration Model (VPRM), Global Biogeochem. Cy., 22, https://doi.org/10.1029/2006GB002735, 2008.
Moore, T. R., Bubier, J. L., and Bledzki, L.: Litter decomposition in temperate peatland ecosystems: the effect of substrate and site, Ecosystems, 10, 949–963, https://doi.org/10.1007/s10021-007-9064-5, 2007.
Myhre, G., Shindell, D., Bréon, F. M., Collins, W., Fuglestvedt, J., Huang, J., ., Koch, D., Lamarque, J.F., Lee, D., Mendoza, B., Nakajima, T., Robock A., Stephens, G., Takemura, T., and Nakajima, T.: Anthropogenic and Natural Radiative Forcing, in: Climate Change 2013: The Physical Science Basis, Contribution of Working Group 1 to the Fifth Assessment Report of the Intergovernmental Panel on Climate Change, 8, 659–740, 2013.
Neff, J. C. and Hooper, D. U.: Vegetation and climate controls on potential CO2, DOC and DON production in northern latitude soils, Glob. Change Biol., 8, 872–884, https://doi.org/10.1046/j.1365-2486.2002.00517.x, 2002.
Noyce, G. L., Varner, R. K., Bubier, J. L., and Frolking, S.: Effect of Carex rostrata on seasonal and interannual variability in peatland methane emissions, J. Geophys. Res.-Biogeo., 119, 24–34, https://doi.org/10.1002/2013JG002474, 2014.
Ouyang, X., Lee, S. Y., and Connolly, R. M.: The role of root decomposition in global mangrove and saltmarsh carbon budgets, Earth-Sci. Rev., 166, 53–63, https://doi.org/10.1016/j.earscirev.2017.01.004, 2017.
Peichl, M., Öquist, M., Löfvenius, M. O., Ilstedt, U., Sagerfors, J., Grelle, A., Lindroth, A., and Nilsson, M. B.: A 12-year record reveals pre-growing season temperature and water table level threshold effects on the net carbon dioxide exchange in a boreal fen, Environ. Res. Lett., 9, 055006, https://doi.org/10.1088/1748-9326/9/5/055006, 2014.
R Core Team: R: A language and environment for statistical computing, R Foundation for Statistical Computing, Vienna, Austria, available at: https://www.R-project.org/ (last access: 24 October 2019), 2016.
Ritson, J. P., Brazier, R. E., Graham, N. J. D., Freeman, C., Templeton, M. R., and Clark, J. M.: The effect of drought on dissolved organic carbon (DOC) release from peatland soil and vegetation sources, Biogeosciences, 14, 2891–2902, https://doi.org/10.5194/bg-14-2891-2017, 2017.
Strakova, P., Niemi, R. M., Freeman, C., Peltoniemi, K., Toberman, H., Heiskanen, I., Fritze, H., and Laiho, R.: Litter type affects the activity of aerobic decomposers in a boreal peatland more than site nutrient and water table regimes, Biogeosciences, 8, 2741–2755, https://doi.org/10.5194/bg-8-2741-2011, 2011.
Ström, L., Tagesson, T., Mastepanov, M., and Christensen, T. R.: Presence of Eriophorum scheuchzeri enhances substrate availability and methane emission in an Arctic wetland, Soil Biol. Biochem., 45, 61–70, https://doi.org/10.1016/j.soilbio.2011.09.005, 2012.
Taylor, K., Rowland, A. P., and Jones, H. E.: Molinia caerulea (L.) Moench, J. Ecol., 89, 126–144, https://doi.org/10.1046/j.1365-2745.2001.00534.x, 2001.
Trudeau, N. C., Garneau, M., and Pelletier, L.: Interannual variability in the CO2 balance of a boreal patterned fen, James Bay, Canada, Biogeochemistry, 118, 371–387, https://doi.org/10.1007/s10533-013-9939-9, 2014.
Tuittila, E. S., Vasander, H., and Laine, J.: Sensitivity of C Sequestration in Reintroduced Sphagnum to Water-Level Variation in a Cutaway Peatland, Restor. Ecol., 12, 483–493, https://doi.org/10.1111/j.1061-2971.2004.00280.x, 2004.
Turetsky, M. R.: The role of bryophytes in carbon and nitrogen cycling, Bryologist, 106, 395–409, https://doi.org/10.1639/05, 2003.
Saarnio, S., Wittenmayer, L., and Merbach, W.: Rhizospheric exudation of Eriophorum vaginatum L. – potential link to methanogenesis, Plant Soil, 267, 343–355, https://doi.org/10.1007/s11104-005-0140-3, 2004.
van Breemen, N.: How Sphagnum bogs down other plants, Trend. Ecol. Evol., 10, 270–275, https://doi.org/10.1016/0169-5347(95)90007-1, 1995.
Ward, S. E., Ostle, N. J., Oakley, S., Quirk, H., Henrys, P. A., and Bardgett, R. D.: Warming effects on greenhouse gas fluxes in peatlands are modulated by vegetation composition, Ecol. Lett., 16, 1285–1293, https://doi.org/10.1111/ele.12167, 2013.
Wright, E. L., Black, C. R., Turner, B. L., and Sjögersten, S.: Environmental controls of temporal and spatial variability in CO2 and CH4 fluxes in a neotropical peatland, Glob. Change Biol., 19, 3775–3789, https://doi.org/10.1111/gcb.12330, 2013.
Yu, Z., Loisel, J., Brosseau, D. P., Beilman, D. W., and Hunt, S. J.: Global peatland dynamics since the Last Glacial Maximum, Geophys. Res. Lett., 37, https://doi.org/10.1029/2010GL043584, 2010.