the Creative Commons Attribution 4.0 License.
the Creative Commons Attribution 4.0 License.
 | 09 Oct 2023
Retrieval of aerosol properties from zenith sky radiance measurements
Roberto Román
David Mateos
Ramiro González
Juan Carlos Antuña-Sánchez
Marcos Herreras-Giralda
Antonio Fernando Almansa
Daniel González-Fernández
Celia Herrero del Barrio
Carlos Toledano
Victoria E. Cachorro
Ángel M. de Frutos
This study explores the potential to retrieve aerosol properties with the GRASP algorithm (Generalized Retrieval of Atmosphere and Surface Properties) using as input measurements of zenith sky radiance (ZSR), which are sky radiance values measured in the zenith direction, recorded at four wavelengths by a ZEN-R52 radiometer. To this end, the ZSR measured at 440, 500, 675 and 870 nm by a ZEN-R52 (ZSRZEN), installed in Valladolid (Spain), is employed. This instrument is calibrated by intercomparing the signal of each channel with coincident ZSR values simulated (ZSRSIM) at the same wavelengths with a radiative transfer model (RTM). These simulations are carried out using the GRASP forward module as RTM and the aerosol information from a co-located CE318 photometer belonging to AERONET (AErosol RObotic NETwork) as input. The dark signal and the signal dependence on temperature are characterized and included in the calibration process. The uncertainties for each channel are quantified by an intercomparison with a co-located CE318 photometer, obtaining lower values for shorter wavelengths; they are between 3 % for 440 nm and 21 % for 870 nm. The proposed inversion strategy for the aerosol retrieval using the ZSRZEN measurements as input, i.e. so-called GRASP-ZEN, assumes the aerosol as an external mixture of five pre-calculated aerosol types. A sensitivity analysis is conducted using synthetic ZSRZEN measurements, pointing out that these measurements are sensitive to aerosol load and type. It also assesses that the retrieved aerosol optical depth (AOD) values in general overestimate the reference ones by 0.03, 0.02, 0.02 and 0.01 for 440, 500, 675 and 870 nm, respectively. The calibrated ZSRZEN measurements, recorded during 2.5 years at Valladolid, are inverted by the GRASP-ZEN strategy to retrieve some aerosol properties like AOD. The retrieved AOD shows a high correlation with respect to independent values obtained from a co-located AERONET CE318 photometer, with determination coefficients (r2) of 0.86, 0.85, 0.79 and 0.72 for 440, 500, 675 and 870 nm, respectively, and finding uncertainties between 0.02 and 0.03 with respect to the AERONET values. Finally, the retrieval of other aerosol properties, like aerosol volume concentration for total, fine and coarse modes (VCT, VCF and VCC, respectively), is also explored. The comparison against independent values from AERONET presents r2 values of 0.57, 0.56 and 0.66 and uncertainties of 0.009, 0.016 and 0.02 µm3 µm−2 for VCT, VCF and VCC, respectively.
- Article
(8459 KB) - Full-text XML
-
Supplement
(2399 KB) - BibTeX
- EndNote


Atmospheric aerosols constitute the biggest source of uncertainty in the assessment of climate change as assessed by Myhre et al. (2013); yet, 1 decade later, this issue still remains (Forster et al., 2021). This is largely due to their high spatial and temporal variability across the globe and the complexity of its interaction with clouds (aerosol–cloud interactions) and solar radiation (aerosol–radiation interactions) (Boucher et al., 2013).
For a better understanding of aerosols and their behaviour and interactions, a high spatial and temporal monitoring coverage is required. Satellite measurements provide, in general, a high spatial resolution covering the whole Earth but with a low temporal resolution. On the other hand, some global ground-based networks, like AERONET (AErosol RObotic NETwork; Holben et al., 1998), were established to monitor aerosols around the globe. AERONET counts with hundreds of stations distributed worldwide and imposes standardization of instruments, calibration, processing and data distribution. The standard instrument of AERONET is the CE318 photometer (manufactured by Cimel Electronique SAS), which records measurements of solar (or lunar if available) irradiance and sky radiance at several wavelengths. Aerosol optical depth (AOD) can be derived using Sun (or lunar) measurements, such as in the case of AERONET, applying the Beer–Lambert–Bouguer law on the instrument's output voltage as described in Holben et al. (1998) and Giles et al. (2019). AERONET also employs an inversion algorithm to retrieve complex aerosol properties, like aerosol size distribution and refractive indices. This algorithm considers sky radiances at different angles and wavelengths, along with the AOD, as input (Sinyuk et al., 2020).
Another inversion algorithm is GRASP (Generalized Retrieval of Atmosphere and Surface Properties; https://www.grasp-open.com, last access: 10 August 2023), which is a free and open-source code that allows for a flexible retrieval of aerosol properties using measurements taken from many different instruments and a combination of them (Dubovik et al., 2014, 2021). The continuous development and versatility of the code enable the exploration of alternatives for its application to different instruments. In this regard, some authors have utilized GRASP to retrieve aerosol properties using as input, among others, data from the following: satellites (Chen et al., 2020; Wei et al., 2021); nephelometers (Espinosa et al., 2017); multi-wavelength AOD (Torres et al., 2017); AOD and sky radiance from photometers with signal from lidars (Lopatin et al., 2013; Benavent-Oltra et al., 2017; Tsekeri et al., 2017; Molero et al., 2020) or ceilometers (Román et al., 2018; Titos et al., 2019; Herreras et al., 2019); stand-alone all-sky cameras (Román et al., 2022); and their combination with lunar photometers (Román et al., 2017) and lidar (Benavent-Oltra et al., 2019).
A new instrument that could be used for GRASP retrievals is the ZEN-R52, manufactured by Sieltec Canarias S.L., which has already been used to retrieve AOD values by other methods (Almansa et al., 2020). The ZEN-R52 measures zenith sky radiance (ZSR) at five different wavelengths every minute, giving continuous ZSR values during daytime at 440, 500, 675, 870 and 940 nm (this latter channel is dedicated to the retrieval of water vapour). One advantage of this instrument is that it does not have moving parts and is cheaper than more complex photometers. This affordability could enable the installation of multiple instruments, thereby achieving a higher spatial coverage. Almansa et al. (2020) presented the ZEN-R52 and developed a method to retrieve AOD values from ZSR using a look-up table (LUT) created for the site of study, Izaña (Canary Islands, Spain), considering uniquely dust aerosol, which is the main aerosol in the area due to the proximity to the Sahara.
In this framework, the main objective of the present work is to develop a new methodology to retrieve AOD and other aerosol properties with GRASP, using calibrated ZSR at 440, 500, 675 and 870 nm from a ZEN-R52 instrument. This retrieval strategy is not linked to the place of study; therefore, it allows us to distribute the instrument worldwide, avoiding the need to create a different LUT for each site. In addition, we propose an in situ method for the calibration of the ZEN-R52.
Following this Sect. 1, dedicated to the introduction, the paper is organized as follows. Section 2 gathers information regarding the instrumentation and retrieval methods employed, as well as a description of the site. The procedure and results of the radiance calibration are explained in Sect. 3. Section 4 is used to drive a sensitivity study of the algorithm employed for the retrieval of aerosol properties. Finally, an analysis of the aerosol properties retrieved using the newly developed methodology is shown in Sect. 5, and Sect. 6 summarizes the main conclusions of the study.
2.1 Site and instrumentation
2.1.1 Valladolid GOA-UVa station
The place of study is located in Valladolid (Spain), a medium-sized city with a population of about 400 000 inhabitants, including the metropolitan area. The city's climate is Mediterranean (Csb Köppen–Geiger climate classification). It presents predominantly “clean continental” aerosol with frequent episodes of Saharan dust intrusions, especially in summer, when the highest AOD monthly-mean values are reached (Bennouna et al., 2013; Román et al., 2014; Cachorro et al., 2016).
The Group of Atmospheric Optics of the University of Valladolid (GOA-UVa) manages an instrumentation platform installed on the rooftop of the science faculty (41.6636∘ N, 4.7058∘ W; 705 m a.s.l.), where diverse remote sensing instruments continuously run, providing complementary information about radiance, clouds, water vapour, trace gases and aerosols. Two instruments from this station are used in this work: the CE318 photometer and the ZEN-R52 radiometer. The corresponding calculations and additional information will be referred to and obtained for this location.
2.1.2 CE318 photometers and AERONET products
Since 2006, GOA-UVa has been one of the calibration facilities in charge of the calibration of AERONET standard instruments and is currently part of the European infrastructure ACTRIS (Aerosols, Clouds and Trace gases Research InfraStructure). The group is also actively contributing to the solar and moon photometry research (Barreto et al., 2019; González et al., 2020; Román et al., 2020). Due to calibration purposes, GOA-UVa always has two reference AERONET photometers (masters) continuously operating on its rooftop platform for the calibration of field instruments by intercomparison with these masters. The CE318 measures direct solar (and lunar for the recent model CE318-T; Barreto et al., 2016) irradiance at several narrow spectral bands by means of a rotating filter wheel. These direct measurements are used to derive the AOD (Giles et al., 2019) for all the available filters with an uncertainty of ±0.01 for wavelengths longer than 440 nm and ±0.02 for the UV (Holben et al., 1998). Sky radiances at several wavelengths are also measured by the CE318 on different scanning scenarios, and these sky radiances are combined with AOD values in the AERONET inversion algorithm to obtain microphysical and optical aerosol properties like aerosol volume size distribution and complex refractive index (Sinyuk et al., 2020). The sky radiances are calibrated against a calibrated integrating sphere following AERONET standards, obtaining an uncertainty of 5 % (Holben et al., 1998).
In this work, we use AOD, sky radiance values and inversion aerosol products from AERONET version 3 level 1.5, which is quality assured. These data can be directly downloaded from the AERONET web page (https://aeronet.gsfc.nasa.gov, last access: 10 August 2023), which include near-real-time automatic cloud-screening and quality control filters (level 1.5). The inversion products with a sky error above 5 % have been rejected in this study to guarantee the quality of the retrievals.
2.1.3 ZEN-R52
The main instrument used in this work is the ZEN-R52 radiometer, installed in the GOA-UVa platform since April 2019. Since that moment, the ZEN-R52 has been continuously operating in Valladolid, except for some short malfunction periods caused by technical issues. This study uses the recorded data from April 2019 until September 2021. The device was jointly developed by Sieltec Canarias S.L. and the Izaña Atmospheric Research Center (IARC) to monitor AOD from sky radiance measurements at the zenith direction and at different spectral bands (Almansa et al., 2017, 2020). The instrument has five filters with nominal wavelengths centred at 440, 500, 675, 870 and 940 nm with a bandwidth of 10 nm and an estimated precision of ±2 nm in the central wavelength. Each filter is placed over a silicon diode with a 16-bit resolution, over a high dynamic acquisition range. The 940 nm filter was recently included in this new version for precipitable water vapour retrieval, but this channel will not be used in this work since it focuses on aerosols. The ZEN-R52 optical configuration achieves a field of view smaller than 2∘. It is equipped with a small aluminium weatherproof container and protected by a thick borosilicate BK7 window, with no moving parts. All of this is mounted in such a way that the collimated sky radiance in the direction of the zenith reaches the sensors. The instrument is very robust and can operate in a wide temperature range, between −40 and 85 ∘C. A more detailed technical description of the instrument can be found in Almansa et al. (2017, 2020).
The zenith sky radiance measurements at all channels are made simultaneously, providing an output signal in analogue-to-digital units (ADUs) every minute. This output is the computed average of 30 samples taken within the minute. For each measurement, it also provides a variability parameter (ZEN variability) that describes both the atmospheric variability and the noise of the ZEN-R52 within the minute of measurement, which is calculated as the standard deviation of the 30 samples.
2.2 GRASP methodology
GRASP contains mainly two independent modules: the “forward model” and the “numerical inversion”. The first one is a radiative transfer model (RTM) used to simulate atmospheric remote sensing observations for a characterized atmosphere. The second module, based on the multi-term least squares method (Dubovik and King, 2000), is used in combination with the RTM for a statistically optimized fitting of the observations to retrieve aerosol properties from radiometric measurements (Dubovik et al., 2014). This provides the algorithm with high flexibility since different constrains can be applied to the retrieval and can be modified to adapt the retrieval for each specific situation. It is important to mention that GRASP works with normalized radiances (IGRASP), which are related with the measured radiances as
where Imeas is the radiance measured by the instrument and E0 is the extraterrestrial solar irradiance, both expressed in the same units. The standard ASTM-E490 solar spectrum has been used in this work for the normalization of Eq. (1). This spectrum was calculated for moderate solar activity and medium Sun–Earth distance; therefore, it has been corrected from Sun–Earth distance for each day of the year. This way, the normalization factor must be applied when using data in radiance units as input to GRASP and to transform the output-normalized radiances from GRASP into radiance units.
2.2.1 Forward module
The GRASP forward module is a RTM based on the “successive orders of scattering” approach (Lenoble et al., 2007; Herreras-Giralda et al., 2022), which requires information about aerosol, gas, site coordinates and date–time together with the solar zenith angle (SZA) to characterize the atmosphere scenario. In this study, gases and aerosol information are extracted from the AERONET direct and inversion products. For the gases, the gases optical depth (GOD) product has been used. For the aerosols, the size distribution (in 22 log-spaced bins of radius), sphere fraction, and complex refractive indices at 440, 675, and 870 nm have been used. Complex refractive index at 500 nm has been interpolated from the values at 440 and 675 nm. The bidirectional reflectance distribution function (BRDF) data are also used as input in GRASP. In this case, the BRDF is extracted from an 8 d climatology created for the place of study using satellite data; specifically, the MCD43C1 product from MODIS V005 collection (Schaaf et al., 2011) for the 2000–2014 period (see Román et al., 2018, for more details about these climatology values).
The ZSR has been simulated at 440, 500, 675 and 870 nm with the GRASP forward module using all the mentioned input data whenever they were available. These simulations have been used for calibration purposes, as can be observed in Sect. 3, but also for the sensitivity analysis with synthetic data of Sect. 4.2. ZSR simulations are also performed for Sect. 4.1, but in this case the aerosol properties have been obtained for precalculated aerosol types instead of real data from AERONET.
2.2.2 Inversion strategy
The present study aims to retrieve aerosol properties with GRASP using as input the calibrated ZSR from the ZEN-R52 at four effective wavelengths. The versatility of GRASP allows for different approaches to model aerosols in order to maximize the possibilities of the different retrieval schemes. Due to the reduced amount of information produced by the ZEN-R52, the approach called “models” has been chosen (denoted “models approach” hereafter; Chen et al., 2020). This is a simple and fast processing approach where aerosol is assumed to be an external mixture of several aerosol models. In this case, the approach assumes five aerosol types which correspond to typical aerosols on Earth: smoke, urban, oceanic, dust and urban polluted. Each model has fixed particle size distribution (log-normal for fine and coarse modes); refractive indices; and sphere fraction, containing the already pre-calculated phase matrix; and the extinction and absorption cross-sections (see Fig. S1 in the Supplement for a representation of the size distribution of each model).
This way, the inversion strategy retrieves only five independent parameters: the total aerosol volume concentration and the fraction of four models in the mixture (the fifth fraction equals one minus the rest of the fractions). All these retrieved parameters allow us to obtain other complex aerosol properties, like size distribution parameters, weighting the individual properties of each model, which are known, by their fraction in the mixture. The size distribution of the five models is defined for fine and coarse modes; hence, the retrieved parameters are also calculated for these modes. Then, the obtained size distribution parameters are volume median radius of fine (RF) and coarse (RC) modes, standard deviation of log-normal distribution for fine (σF) and coarse (σC) modes, and aerosol volume concentration for fine (VCF) and coarse (VCC) modes as well as the total value (VCT). AOD at each wavelength is given directly in GRASP output. Each output, one per retrieval, provides the relative residual differences between the measured ZSR (input) and the ones generated after the inversion (simulated by GRASP forward module under the retrieved scenario) for each wavelength (Román et al., 2022). This residual information will be used to evaluate the goodness of the retrievals; if the residual at one or more wavelengths is above an established threshold, the inversion is rejected (assumed as non-convergent). This threshold, which varies with the wavelength, has been set as the absolute value of the accuracy plus the precision for each channel of the ZEN-R52 (see Sect. 3.5.2).
The proposed strategy requires as input the following: the calibrated ZSR at four wavelengths, the coordinates of the site, date, time, SZA, the BRDF values obtained from the climatology mentioned above, and the GOD at each wavelength to account for the gases effect. The GOD used in this work is obtained from a monthly GOD climatology, which has been created using GOD information extracted from AERONET for the 2012–2021 period in Valladolid for this study. This proposed inversion strategy to retrieve aerosol properties with GRASP using ZEN-R52 measurements has been named “GRASP-ZEN”.
A methodology for the ZEN-R52 calibration is proposed in this section. This methodology can be developed using only field measurements, so it does not require laboratory measurements. It is based on four steps: dark-signal correction, quality data filtering, temperature correction and a final comparison against simulated values to convert the output signal from ADU into radiance units (). With this purpose, ZSR simulations have been performed for the whole dataset of ZEN-R52 measurements (April 2019 to September 2021), using the GRASP forward module fed with the closest AERONET information (Sect. 2.2.1) whenever it was available within ±5 min from the ZEN-R52 measurement, considering in good approximation that aerosol conditions do not change significantly within 5 min. To ensure the quality of the simulations, only AERONET retrievals with a sky error lower than 5 % have been used, obtaining a total of 4725 data pairs.
3.1 Dark-signal correction
For the dark-signal (DS) evaluation, the instrument was fully covered with a black piece and introduced into a thermal chamber in the GOA-UVa facilities. The instrument was subjected to a temperature variation in the range from −10 to 50 ∘C in darkness conditions. The dark signal registered by each channel at each temperature is shown in Fig. 1. It shows a constant behaviour for 440 and 500 nm filters. On the contrary, for the other wavelengths a staggered exponential behaviour can be seen. To characterize this behaviour, the logarithm of the ZEN dark signal has been fitted to a polynomial of degree 3. This fitting is afterwards rounded up to the unit to obtain a staggered fitting. The modelled dark signal is also represented in Fig. 1 by the black lines. This modelling has been used to subtract the corresponding dark-signal value from the raw signal, obtaining dark-signal-corrected ZSR (ZSRDSC). The residuals between the modelled and real DS are shown in Fig. S2 in the Supplement; these residual values are within the instrument resolution for all channels. It has also been verified that the dark-signal behaviour has remained constant over time, comparing the modelled DS against the nighttime measurements. In this work, the DS has been characterized in the laboratory to cover a wide range of temperatures, but it could be calculated from the nighttime measurements (dark sky) or even from daytime measurements (covering the instrument with a black piece), when a thermal chamber is not available.
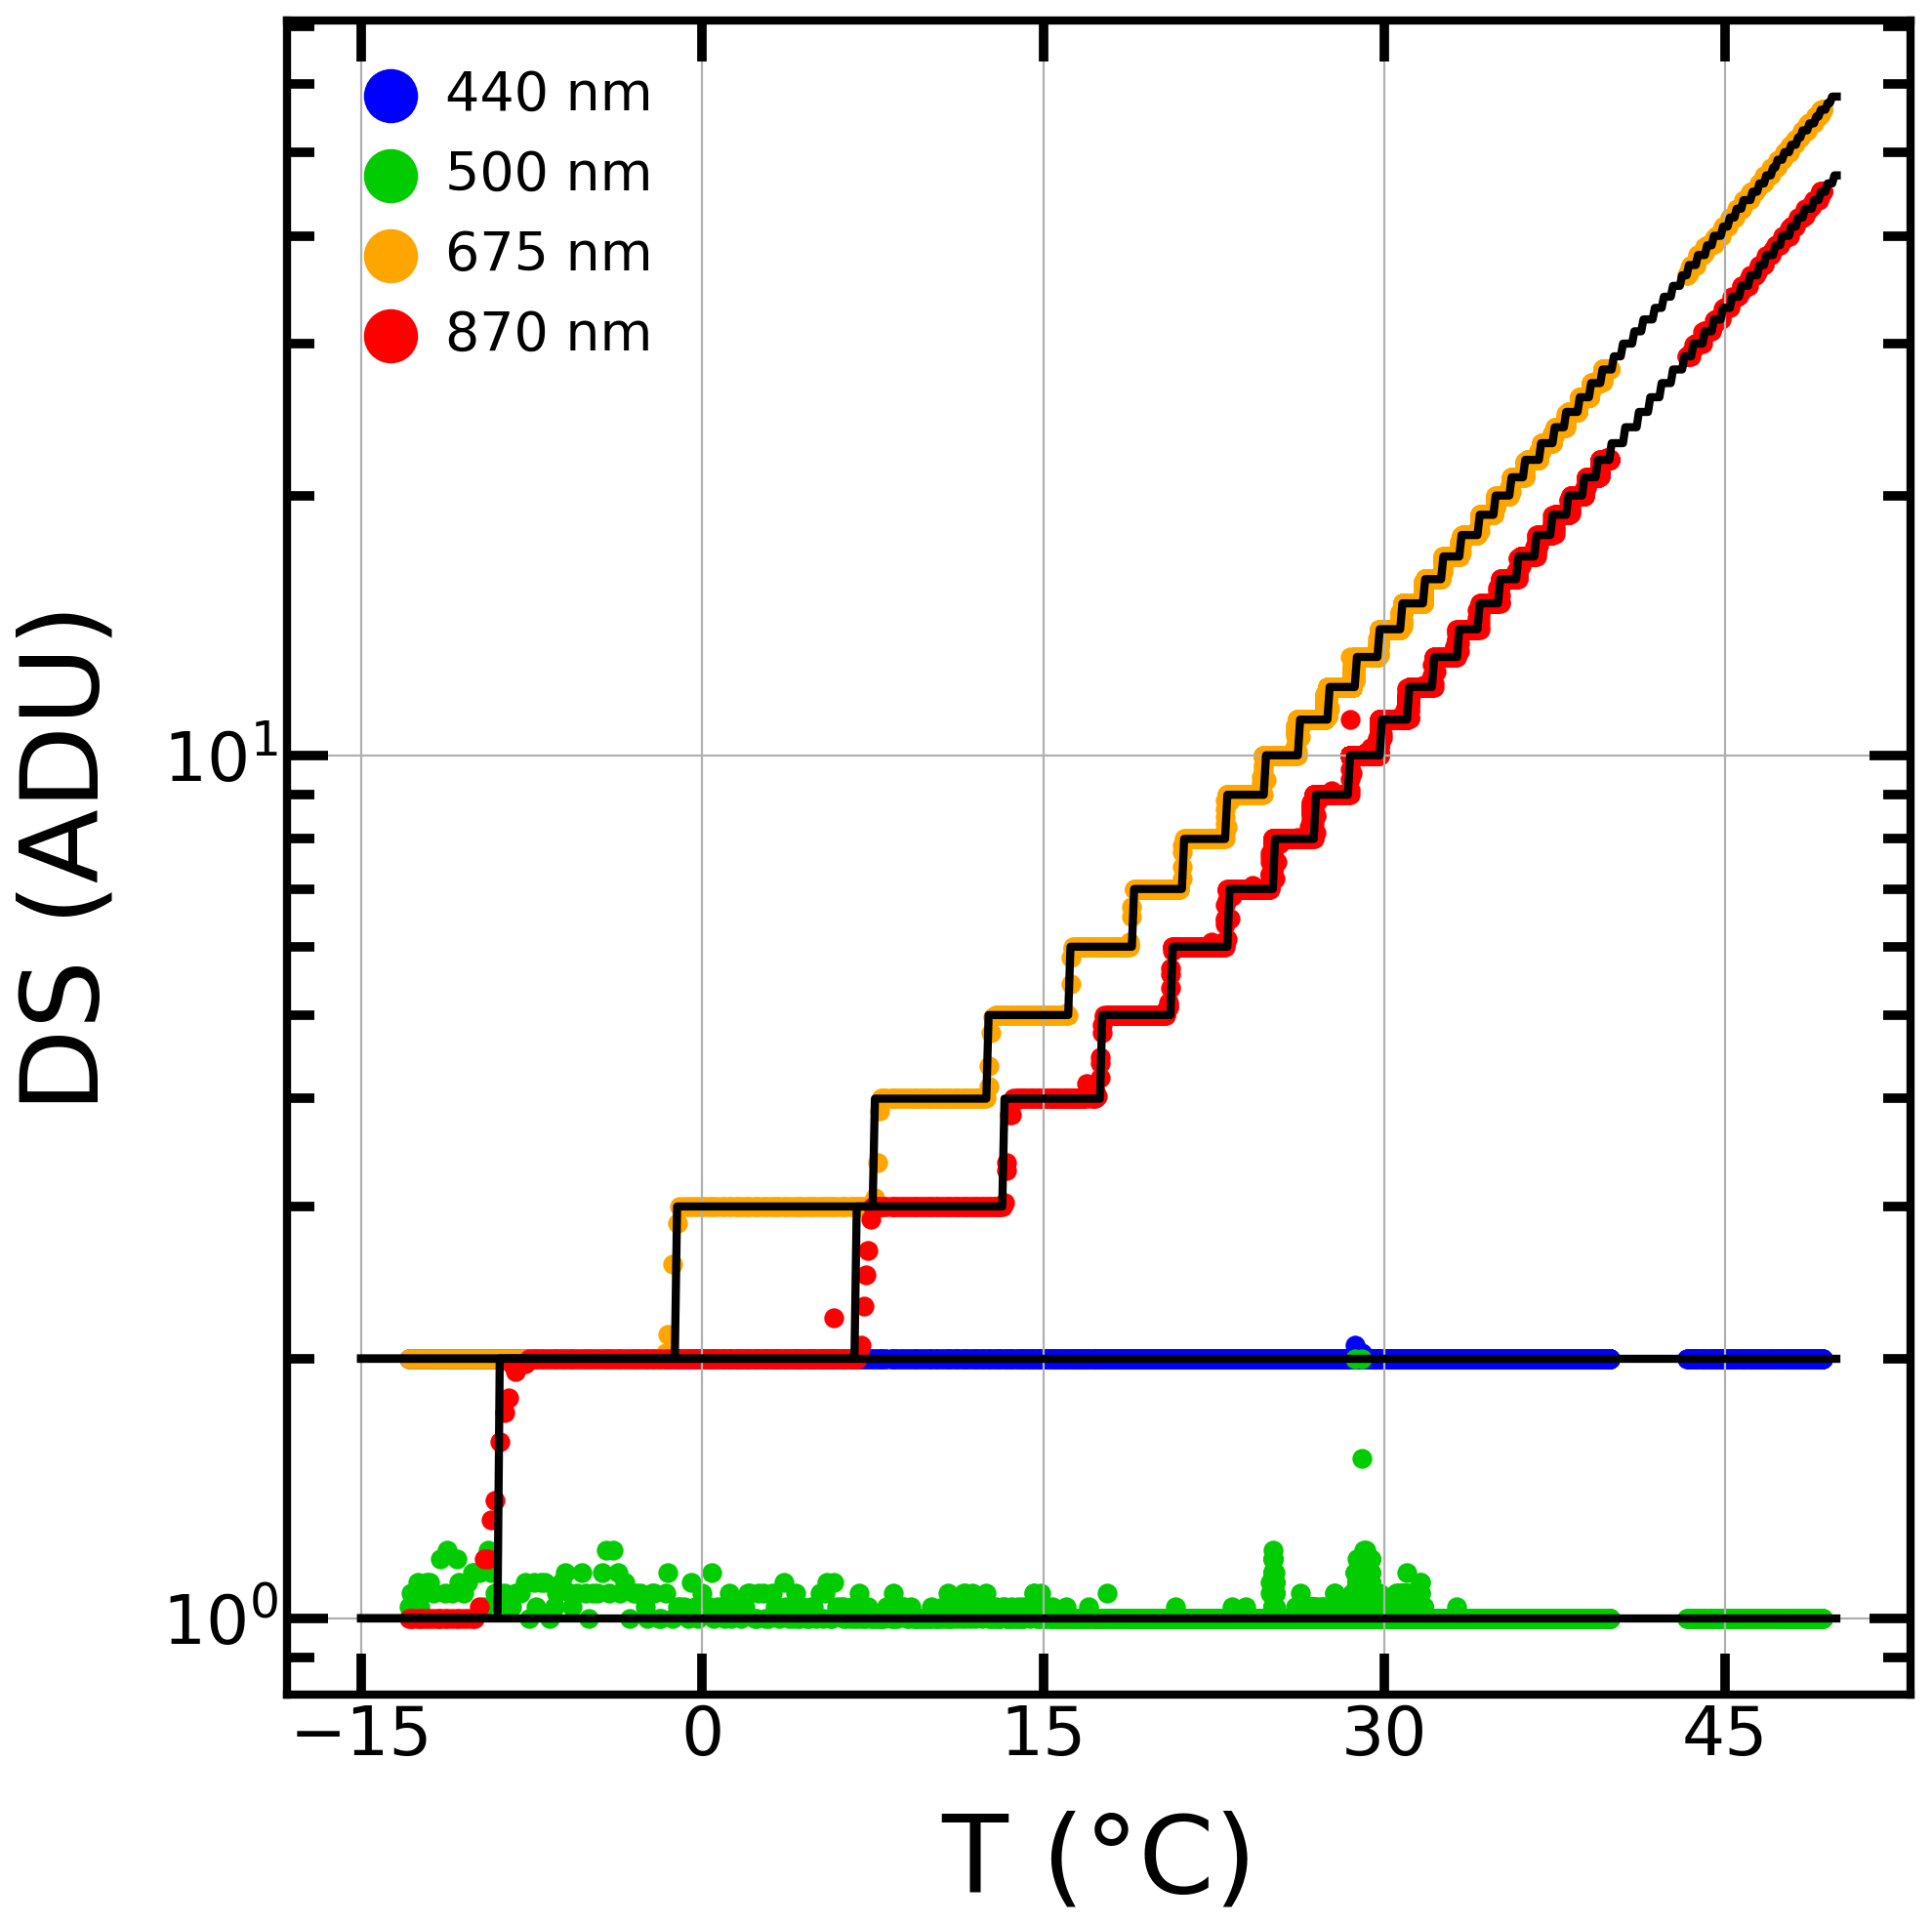
Figure 1ZEN-R52 dark signal (DS) in analogue-to-digital units (ADUs) against the temperature (coloured dots) at 440, 500, 675 and 870 nm. Black lines represent the DS for each channel.
3.2 Quality control filtering criteria
With the dark signal corrected, we compared the field measurements of ZSRDSC against the simulated ZSR (ZSRSIM). This first comparison is shown in the left panels of Fig. 2. The colour of the points in the scatter plots of Fig. 2 represents the density of points per pixel as defined by Eilers and Goeman (2004); all the density scatter plots of this paper were done in this manner. The determination coefficient (r2) is also added in the panels of Fig. 2, showing in general good agreement for each channel between ZSRDSC and ZSRSIM but with some outliers regarding the linear trend (see left panels a, c, e and g). These outliers present higher ZSRDSC values than expected, and they could be caused by the presence of clouds in the zenith, instrument malfunction or other reasons.
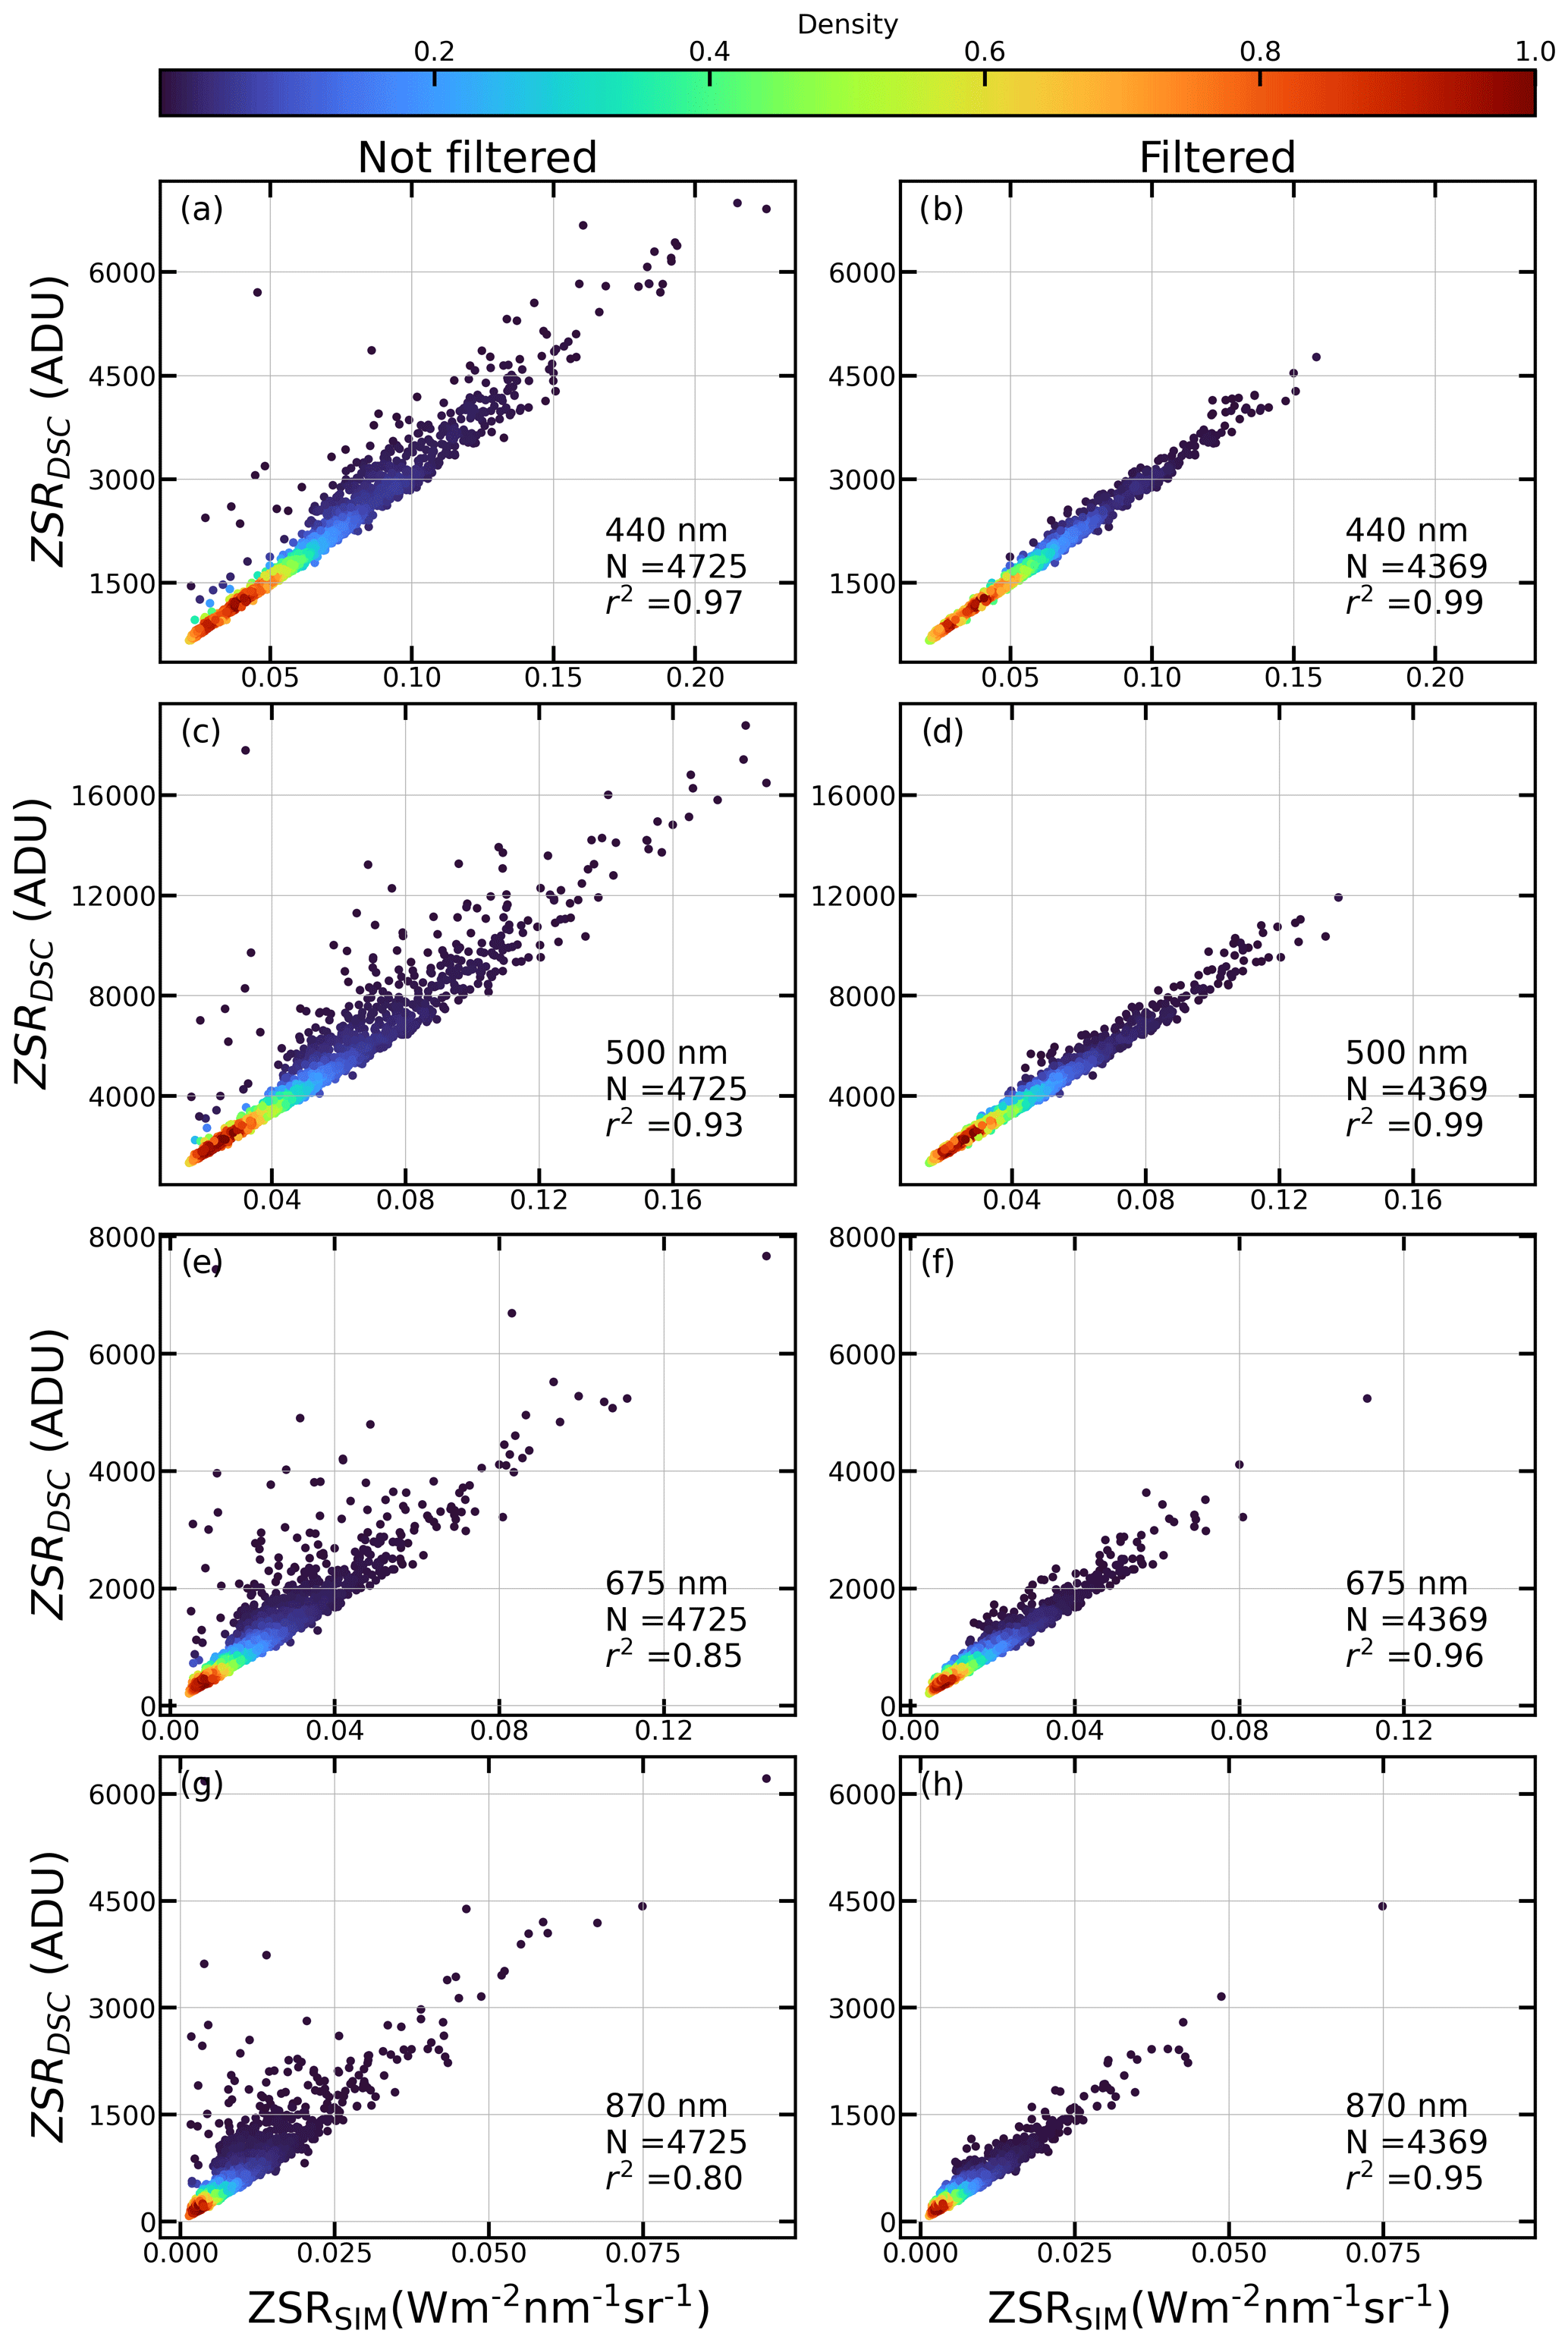
Figure 2Density scatter plot of the measured zenith sky radiances corrected from dark signal (ZSRDSC), in analogue-to-digital units (ADUs), against the zenith sky radiances simulated by GRASP (ZSRSIM), both at 440 (a, b), 500 (c, d), 675 (e, f) and 870 nm (g, h). Left (a, c, e, g) and right (b, d, f, h) panels show these data before and after applying a quality control filtering, respectively. Determination coefficient (r2) and number of data pairs (N) are also shown.
The ZEN-R52 measurements can be affected in different ways. For example, a possible stray sunlight intromission when the Sun is very elevated can increase the measured signal, the presence of clouds can also affect it, or the variation in temperature can introduce some dependency. To identify and reject the cloud-contaminated or wrong measurements, different thresholds have been identified after the visual analysis of some parameters in the scatter plots. For the SZA, the signal of the instrument is higher than the expected for SZA values below 30∘, which could be explained by solar stray sunlight intromission. Then, ZSRDSC values recorded under SZAs below 30∘ were discarded, as well as the values with SZAs above 80∘ due to the low signal registered for these SZAs (see Fig. S3 in the Supplement for a clear overview). The ZEN variability parameter (Sect. 2.1.3) can be assumed as a cloud presence indicator, since measurements affected by clouds should register a high ZEN variability due to the high fluctuation of the sky radiances during the 1 min measurement. An evaluation of Fig. 2 but with points classified by its ZEN variability at 440 nm led us to establish a threshold of 4 % for this parameter at the four channels (see Fig. S4 in the Supplement).
No other clear dependence of the outliers has been observed. The results after applying the mentioned filters (; ZEN variability<4 %) are represented in the right panels (b, d, f and h) of Fig. 2. The number of coincident measurements is reduced to 4369 points after applying the quality control, but a significant improvement in the determination coefficients is observed, rising from 0.97, 0.93, 0.85 and 0.8 to 0.99, 0.99, 0.96 and 0.95 for 440, 500, 675 and 870 nm, respectively. From now on, all the ZSRDSC measurements will satisfy this quality control unless otherwise specified.
3.3 Temperature correction
In order to check the dependence with temperature of each channel, the ZSRDSC ZSRSIM ratio normalized by the mean ratio has been plotted against the temperature in Fig. 3. In the left panels (a, c, e and g) of Fig. 3, all data points are represented together with the linear fit, showing a negligible dependence on temperature for 440 and 500 nm. For the 675 and 870 nm channels, this dependency presents slopes of the linear fitting of 0.008 and 0.0036 , respectively. These values are higher than the 0.0002 obtained for the other two channels, which led us to consider a temperature correction for 675 and 870 nm. In order to disregard outliers, the ratios were grouped by 2 ∘C bins, and its median was calculated whenever the group had at least 40 points. These median values are plotted against the mean temperature of the group's temperatures in Fig. 3 right panels (b, d, f and h). The corresponding linear fit coefficients obtained in Fig. 3f and h are used for the temperature dependency correction following Eq. (2):
where ZSRDSC is the ZEN signal after dark-signal correction, and ZSRTC is this signal with the temperature correction applied; a and b represent the intercept and slope of the final linear fits, respectively; y20 is the correspondent y-axis value of the linear fit at the temperature T of 20 ∘C (arbitrary value chosen to normalize). For 440 and 500 nm, ZSRDSC and ZSRTC are equivalent since no temperature correction is applied.
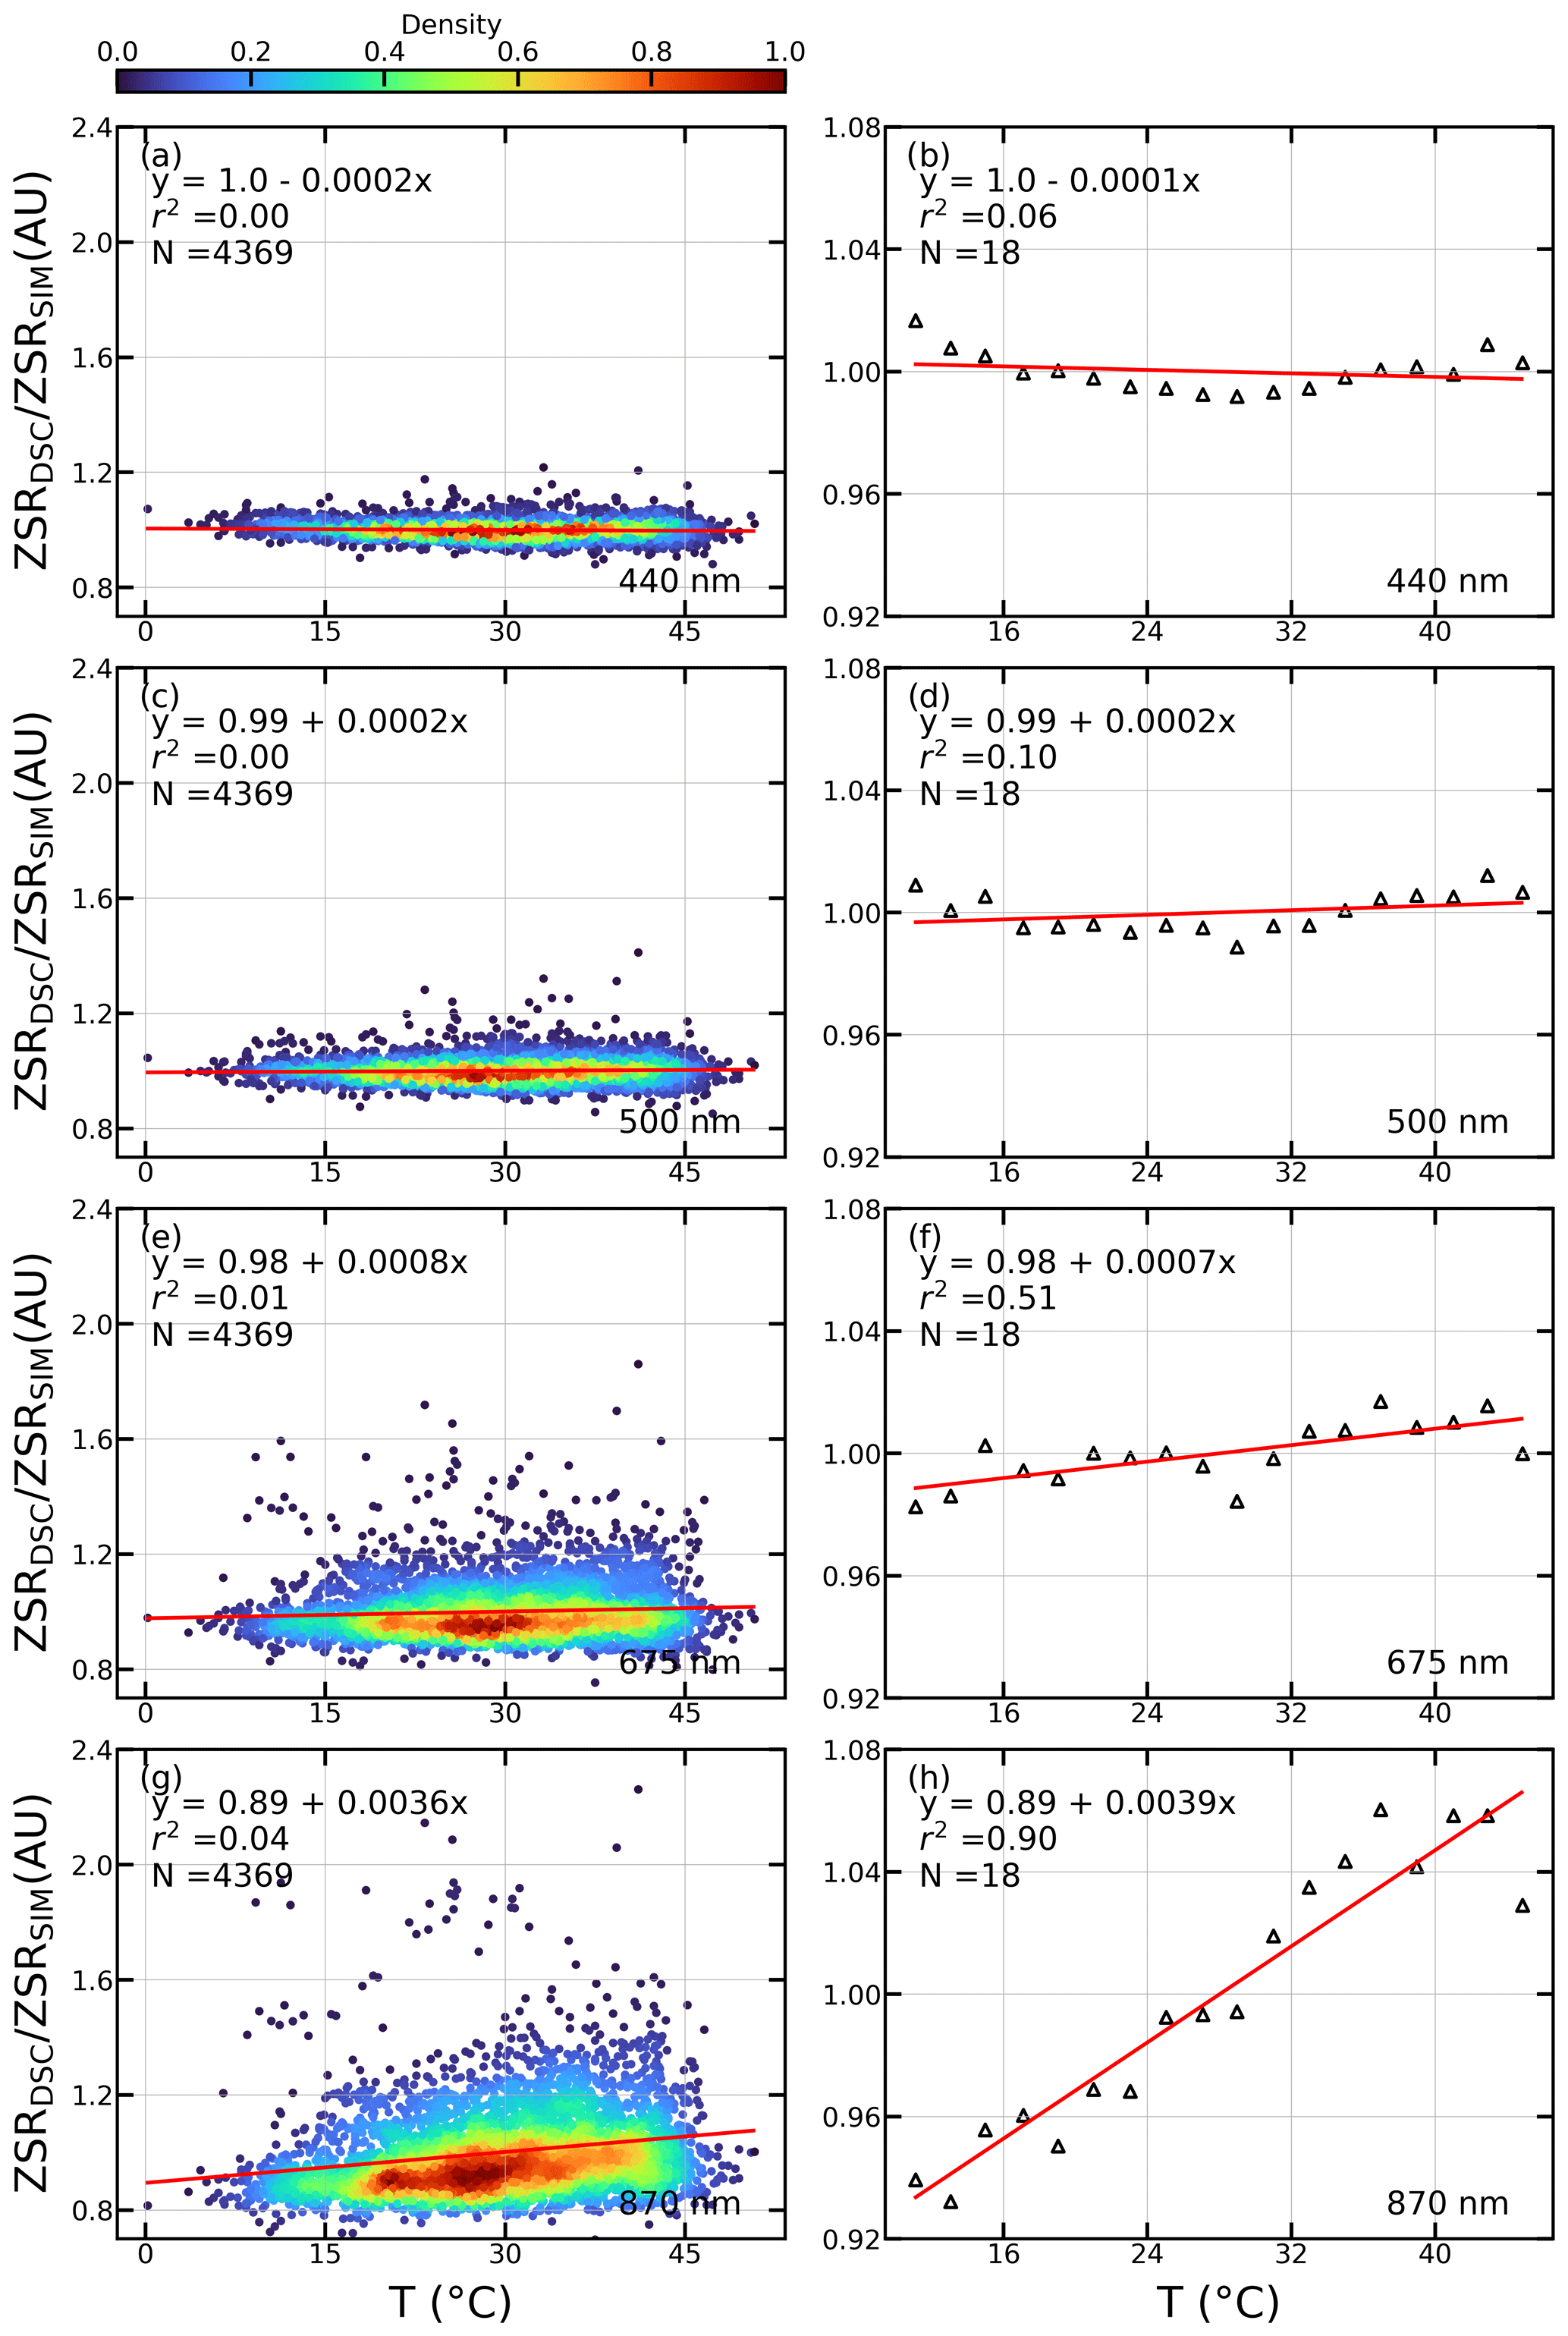
Figure 3Left panels (a, c, e, g): density scatter plots for the normalized ratios ZSRDSC ZSRSIM in arbitrary units (AU) against the temperature at (a) 440, (c) 500, (e) 675 and (g) 870 nm. Right panels (b, d, f, h): scatter plots of the median value for the ratios ZSRDSC ZSRSIM grouped in 2 ∘C ranges against mean temperature of the group at (b) 440, (d) 500, (f) 675 and (h) 870 nm. The Linear fit (red line), its equation, determination coefficient (r2) and number of data points (N) are also shown.
3.4 Calibration coefficients
The calibration factors can be directly obtained by comparing the dark and temperature-corrected ZSR from the ZEN-R52 against the values simulated by GRASP. The density scatter plots between ZSRSIM values and ZSRTC are shown in Fig. 4. The slope of the linear fit directly represents the calibration coefficients obtained to transform the ZSRTC signal into radiance units () for each channel. The calibrated ZSR data are named ZSRZEN hereafter.
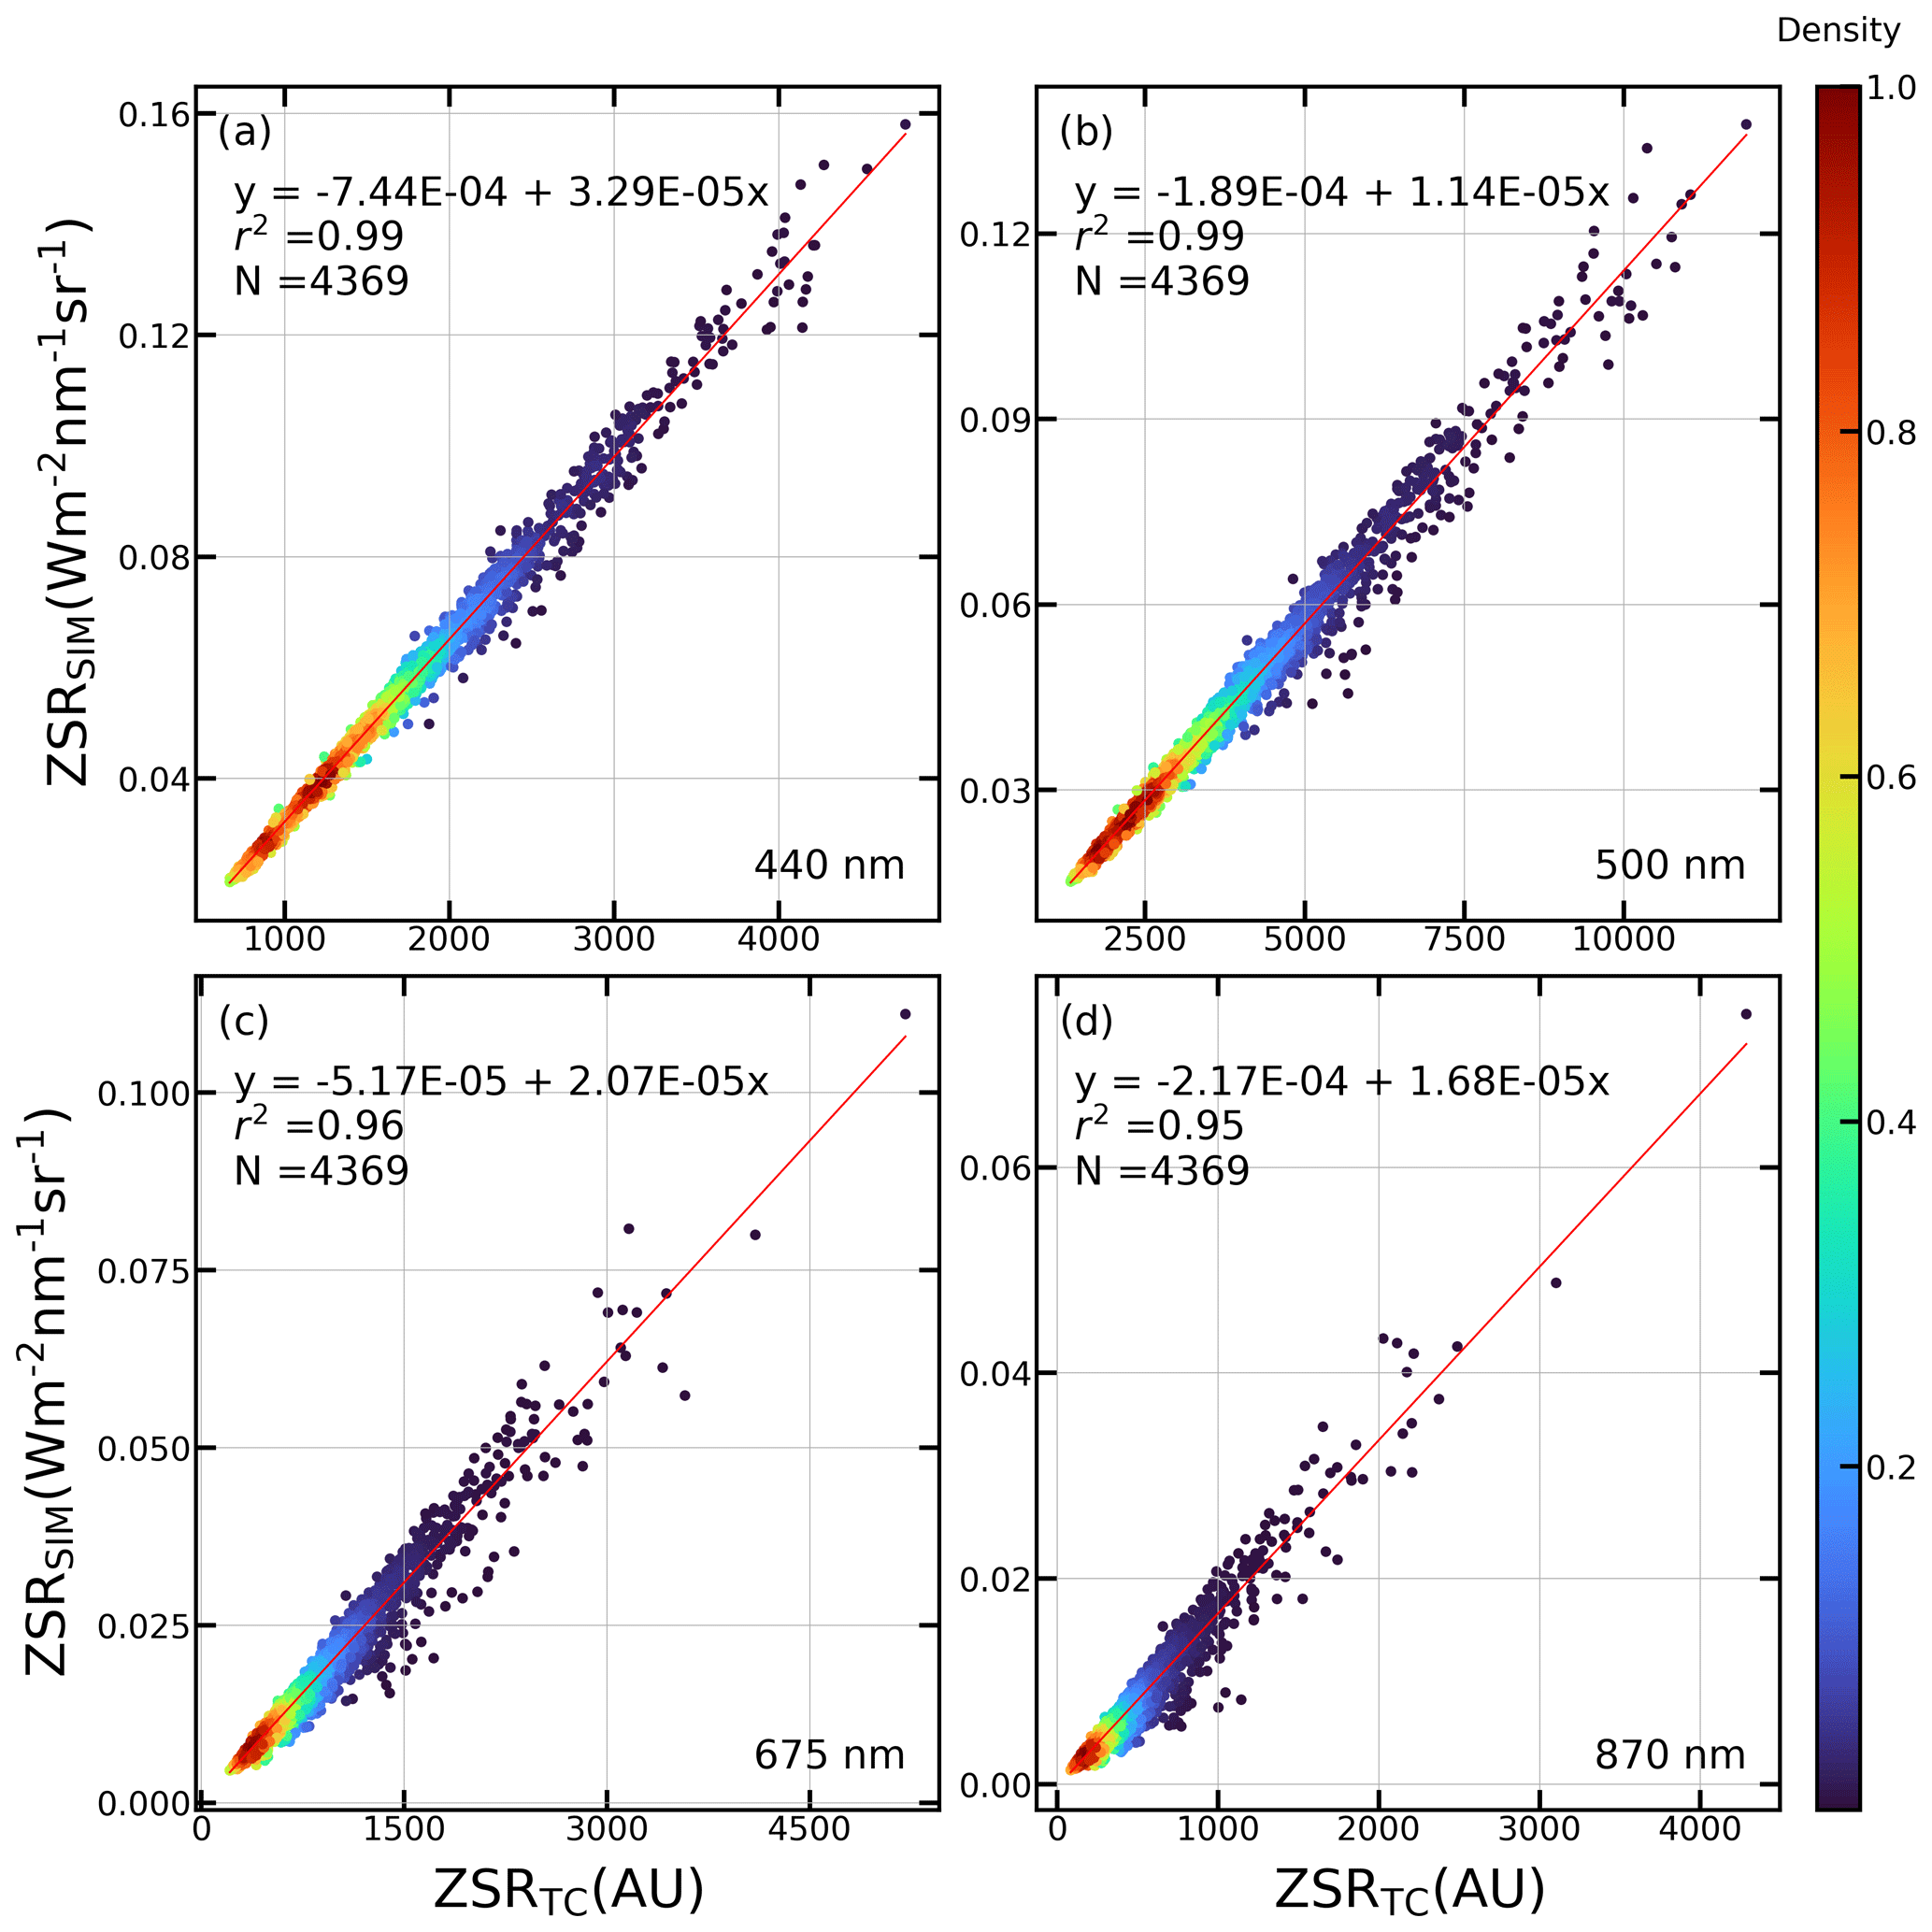
Figure 4Density scatter plot of the zenith sky radiance simulated (ZSRSIM) in radiance units against the ZEN-R52 measurements in arbitrary units (AU) corrected in dark signal and temperature (ZSRDSC_TC) at (a) 440, (b) 500, (c) 675 and (d) 870 nm. The Linear fit (red line) and its equation, determination coefficient, (r2), and number of data points (N) are also shown.
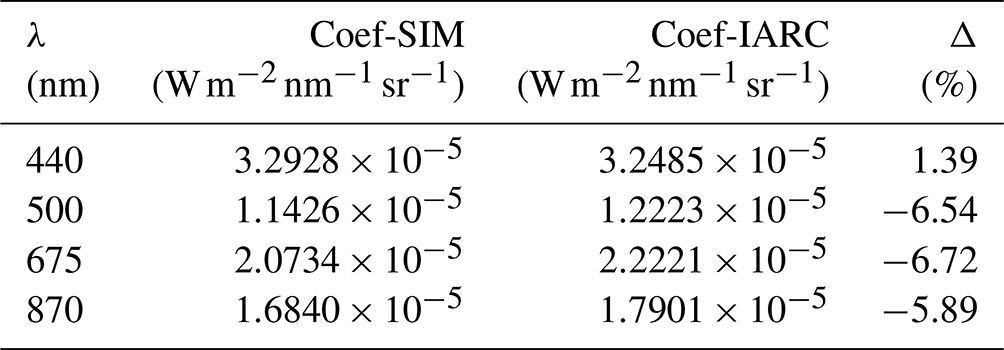
These calibration coefficients are compared to the ones obtained by intercomparison with a calibrated integrating sphere at IARC facilities in Table 1. Table 1 also presents the relative differences between both calibration coefficients using the coefficients from IARC as reference; the uncertainty involved in the latter calibration method procedure is estimated to be 5 % by Walker et al. (1991). These differences are 1.39 %, −6.54 %, −6.72 % and −5.89 % for 440, 500, 675 and 870 nm, respectively. The proposed calibration method uses the standard ASTM-E490 solar spectrum to transform the unitless output radiances from GRASP, as indicated in Eq. (1). This fact can increase the relative differences between the two calibration methods, together with the lack of temperature correction in the second one. However, when using the calibration method developed in this study, the same normalization factor applied to the ZSR simulated by GRASP (ZSRSIM) can be applied to the calibrated ZEN-R52 measurements when using them as input to GRASP for the inversion. This way, the introduction of a systematic error due to the normalization required by the GRASP inversion algorithm can be avoided. This means that this calibration method is better suited when using the ZSRZEN values as input for GRASP to retrieve aerosol properties, since we could work directly with the normalized radiances from GRASP. For this work, it has been assumed that during the period of study the calibration has not decayed, since it is not a long dataset. Nevertheless, a recalibration must be considered, especially if there is any maintenance or repair task. From now on, ZSRZEN will stand for the calibrated zenith sky radiances measured by the ZEN-R52, satisfying the stabilized quality controls (; ZEN variability<4 %).
Table 1Calibration coefficients obtained using simulations of zenith sky radiance (Coef-SIM) and the ones obtained at the IARC against a calibrated integrating sphere (Coef-IARC). The relative difference (Δ) between both coefficients is included assuming Coef-IARC as reference.
3.5 ZEN-R52 vs. CE318 photometer comparison
In order to check the goodness of the calibrated ZEN-R52 measurements, the ZSRZEN observations have been compared against measurements recorded by co-located CE318 instruments for the whole available dataset of ZEN-R52 measurements (April 2019 to September 2021). For the comparison, measurements extracted from two different scenarios are used: the cloud mode (CM) and principal plane (PPL) scanning.
3.5.1 Cloud mode
The CE318 Sun–sky photometer allows us to perform measurements in the “cloud mode” scenario. It is carried out when the direct Sun measurement indicates an obscured Sun and therefore the aerosol retrieval is not possible. This scenario orientates the sensor head into the zenith direction and takes zenith radiance measurements at 9 s intervals for each wavelength, which are obtained by successively rotating an interference filter in front of the detector. The cloud mode scenario was originally implemented to obtain, during this idle time, cloud optical depth from zenith sky radiances at the spectral wavelengths employed by the Sun–sky photometer (Chiu et al., 2010) as suggested by Marshak et al. (2000) and Barker and Marshak (2001).
The zenith sky radiances measured under the cloud mode (ZSRCM) have been directly downloaded from the AERONET web page. For the comparison with ZEN-R52, quasi-coincident (the closest within ±1 min) ZSRZEN and ZSRCM measurements have been paired and plotted in Fig. 5, showing a good correlation between both datasets. The deviation between them is high, likely due to the short-time variation in the cloud radiative field. Figure 5 includes all the ZSRZEN measurements; the filtering to SZA values and ZEN variability is not applied, since the cloud mode measurements are under cloud presence. In this case, there is no dependence on SZA; outliers do not appear for values. Hence, the ZSRZEN values do not correlate with reference values for when the Sun is cloud free, which confirms the suggested explanation that ZSRZEN measurements are contaminated by stray sunlight under cloud-free conditions when the Sun elevation is high (). In addition, it was checked that 86 % of the ZEN-52 measurements used in this comparison (which are known to be affected by clouds) present a ZEN variability>4 % at least for one channel. This also validates the proposed use of the ZEN variability as a rough “cloud screening”.
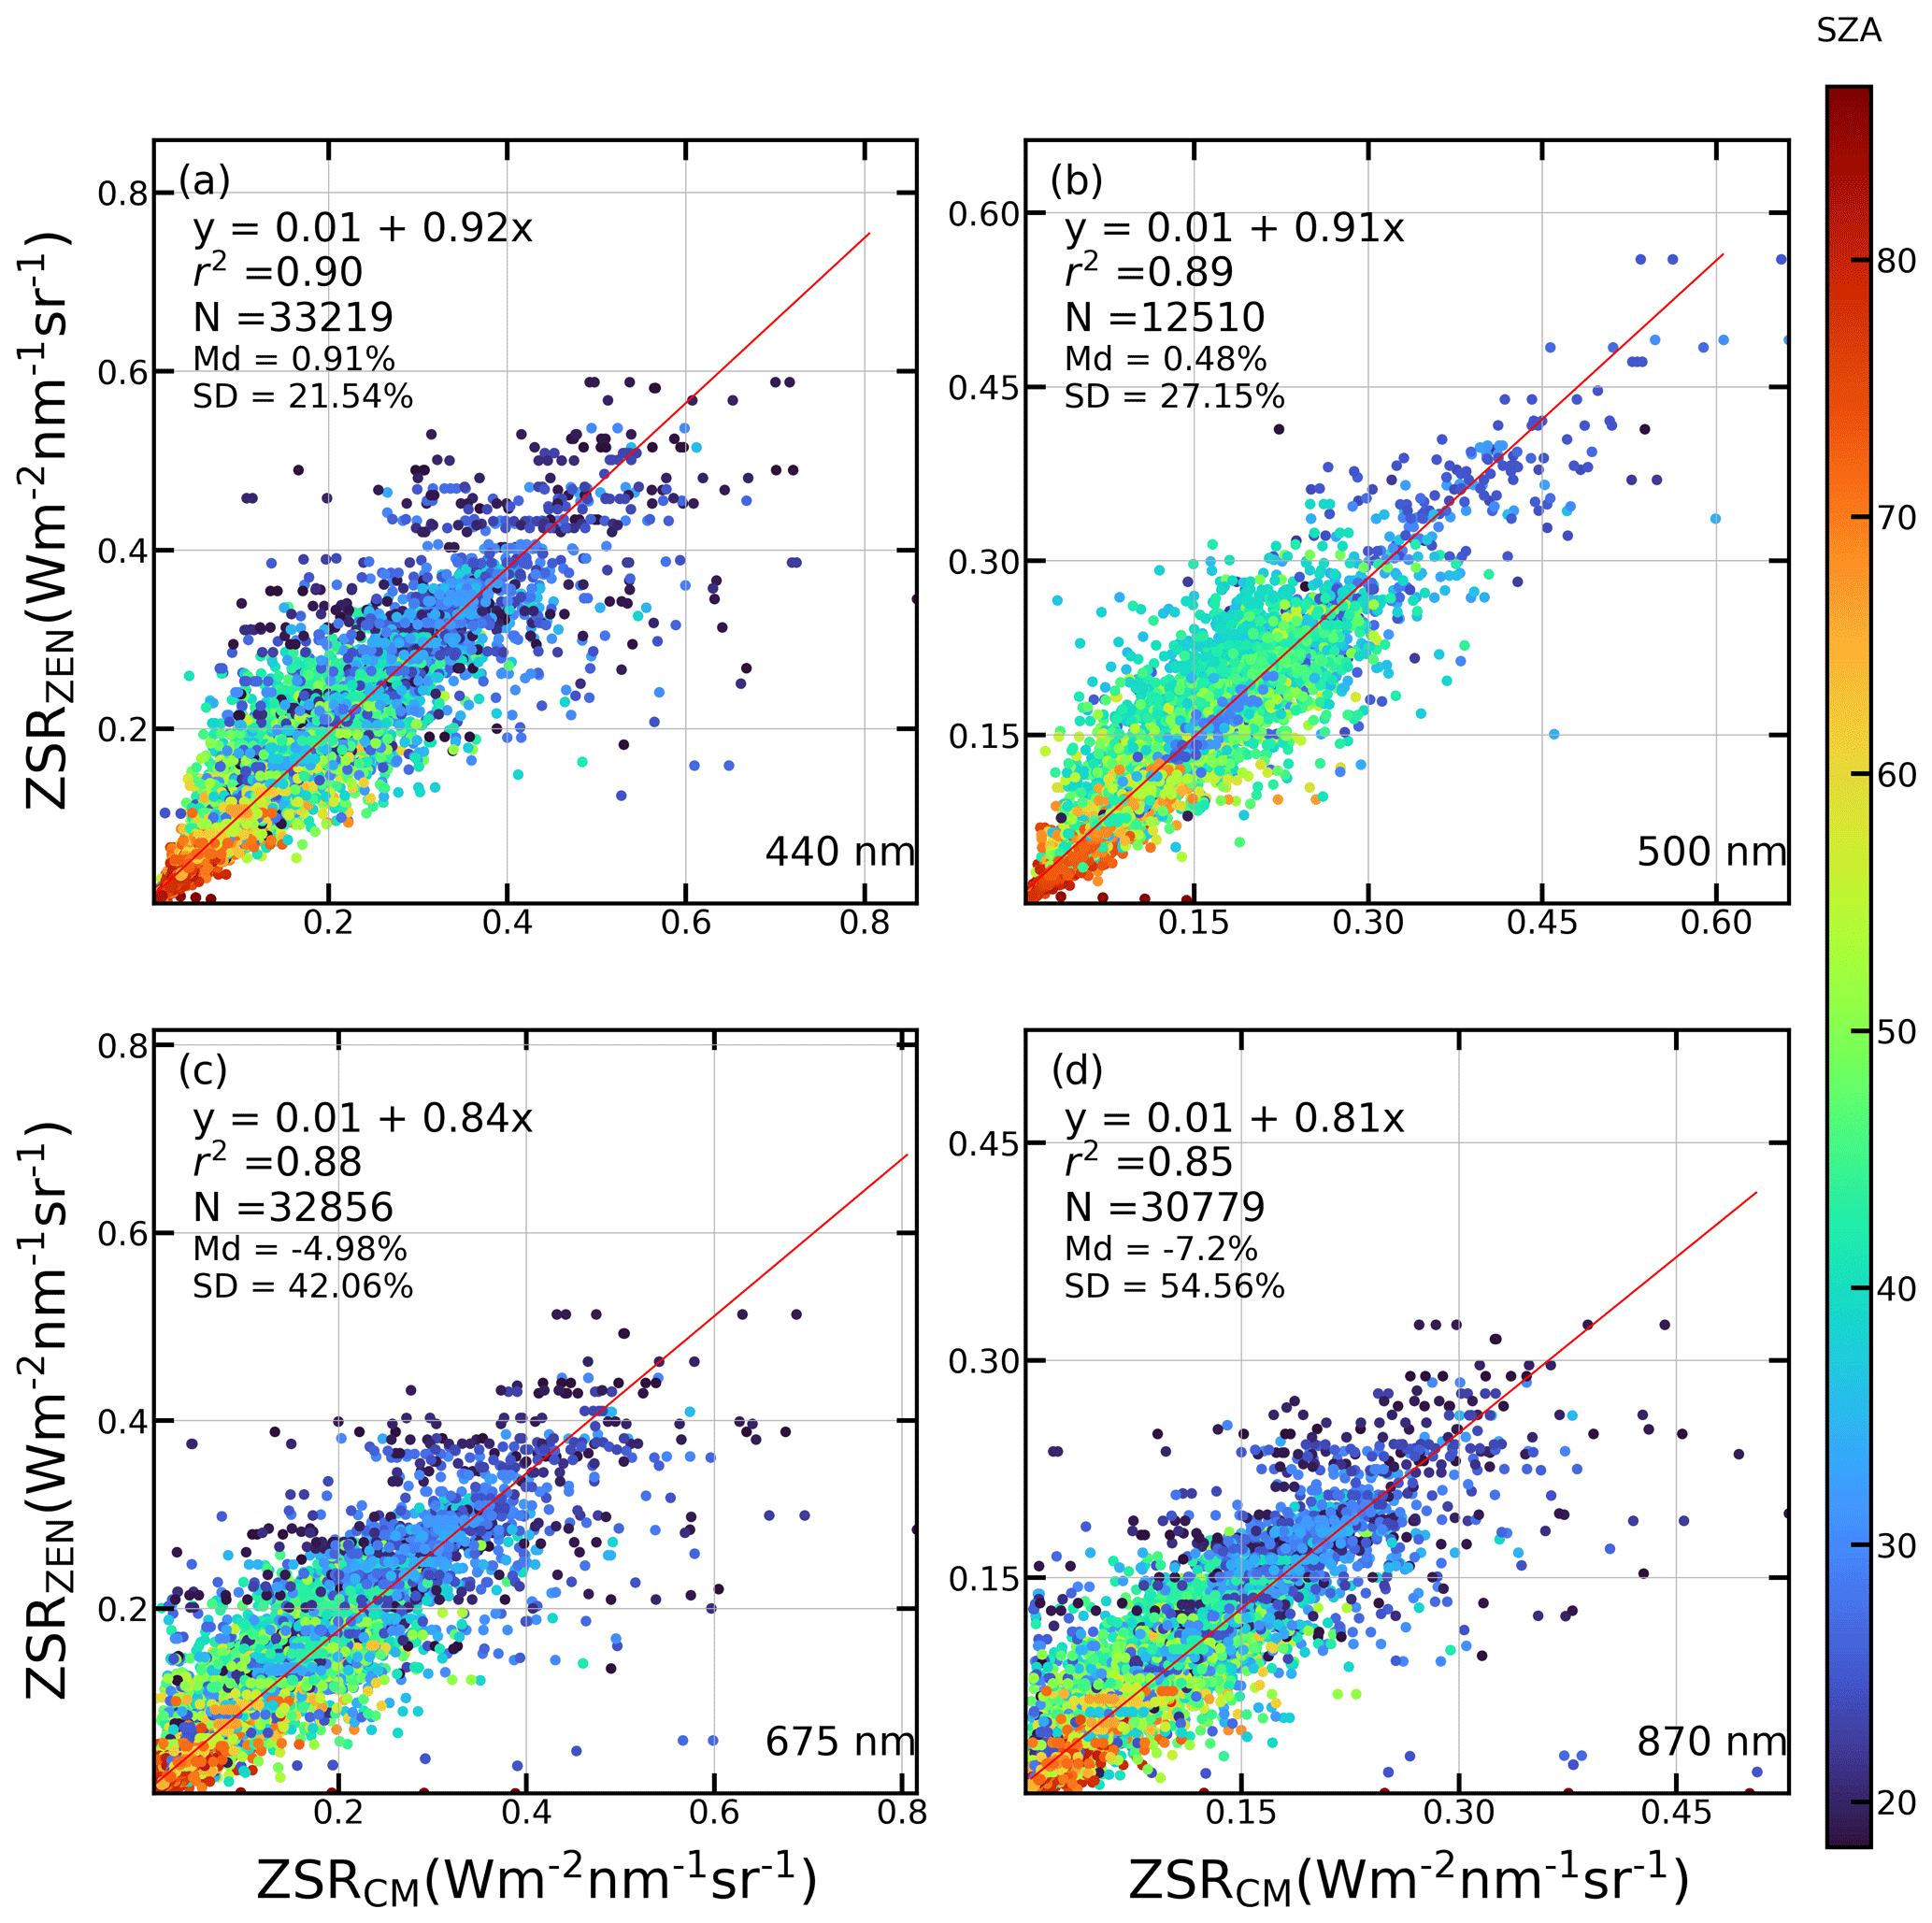
Figure 5Scatter plot of the calibrated ZEN-R52 measurements (ZSRZEN) against coincident measurements from AERONET cloud mode (ZSRCM) at (a) 440, (b) 500, (c) 675 and (d) 870 nm. The Linear fit (red line) and its equation, determination coefficient (r2), and number of data points (N) are shown. The median (Md) and standard deviation (SD) of the Δ differences are also shown. Point colours represent the SZA.
This comparison against the cloud mode measurements will not be used to quantify the uncertainty of the ZEN measurements; this is because clouds are very variable and, therefore, so is the recorded signal. Therefore, we should compare both measurements carried out at exactly the same time, but this is not the case since ZEN measurements are 1 min averages, while CE318 photometer measurements are quasi-instantaneous. In addition, for the retrieval of aerosol properties, it is necessary to employ measurements under cloud-free conditions; therefore, the results obtained in the following comparison will be the reference ones.
3.5.2 Principal plane scan
CE318 Sun–sky photometers allow us to perform three different scanning scenarios for sky radiance measurements. One of these scanning scenarios is the principal plane (PPL) geometry, where the azimuth angle is equal to the solar azimuth angle while the zenith angle varies, measuring sky radiances. This is done sequentially once for each channel starting at 870 nm, followed by 675, 500 and 440 nm channels for each PPL scenario. The PPL geometry allows us to extract the ZSR by linear interpolation of the PPL points to the zenith position. A cloud screening of PPL points has been made by checking the smoothness of the PPL curve as described in Holben et al. (1998). The smoothness criterion analyses the second derivative of the PPL radiances with respect to the scattering angle. This way the PPL measurement is classified as cloud contaminated if the second derivative is negative (the threshold is not 0 but as empirically determined) at any scattering angle between 2 and 90∘ (Almansa et al., 2020). The obtained ZSR from this method, based on the interpolation of cloud-screened CE318 sky radiances measured in the PPL geometry, has been labelled as ZSRPPL.
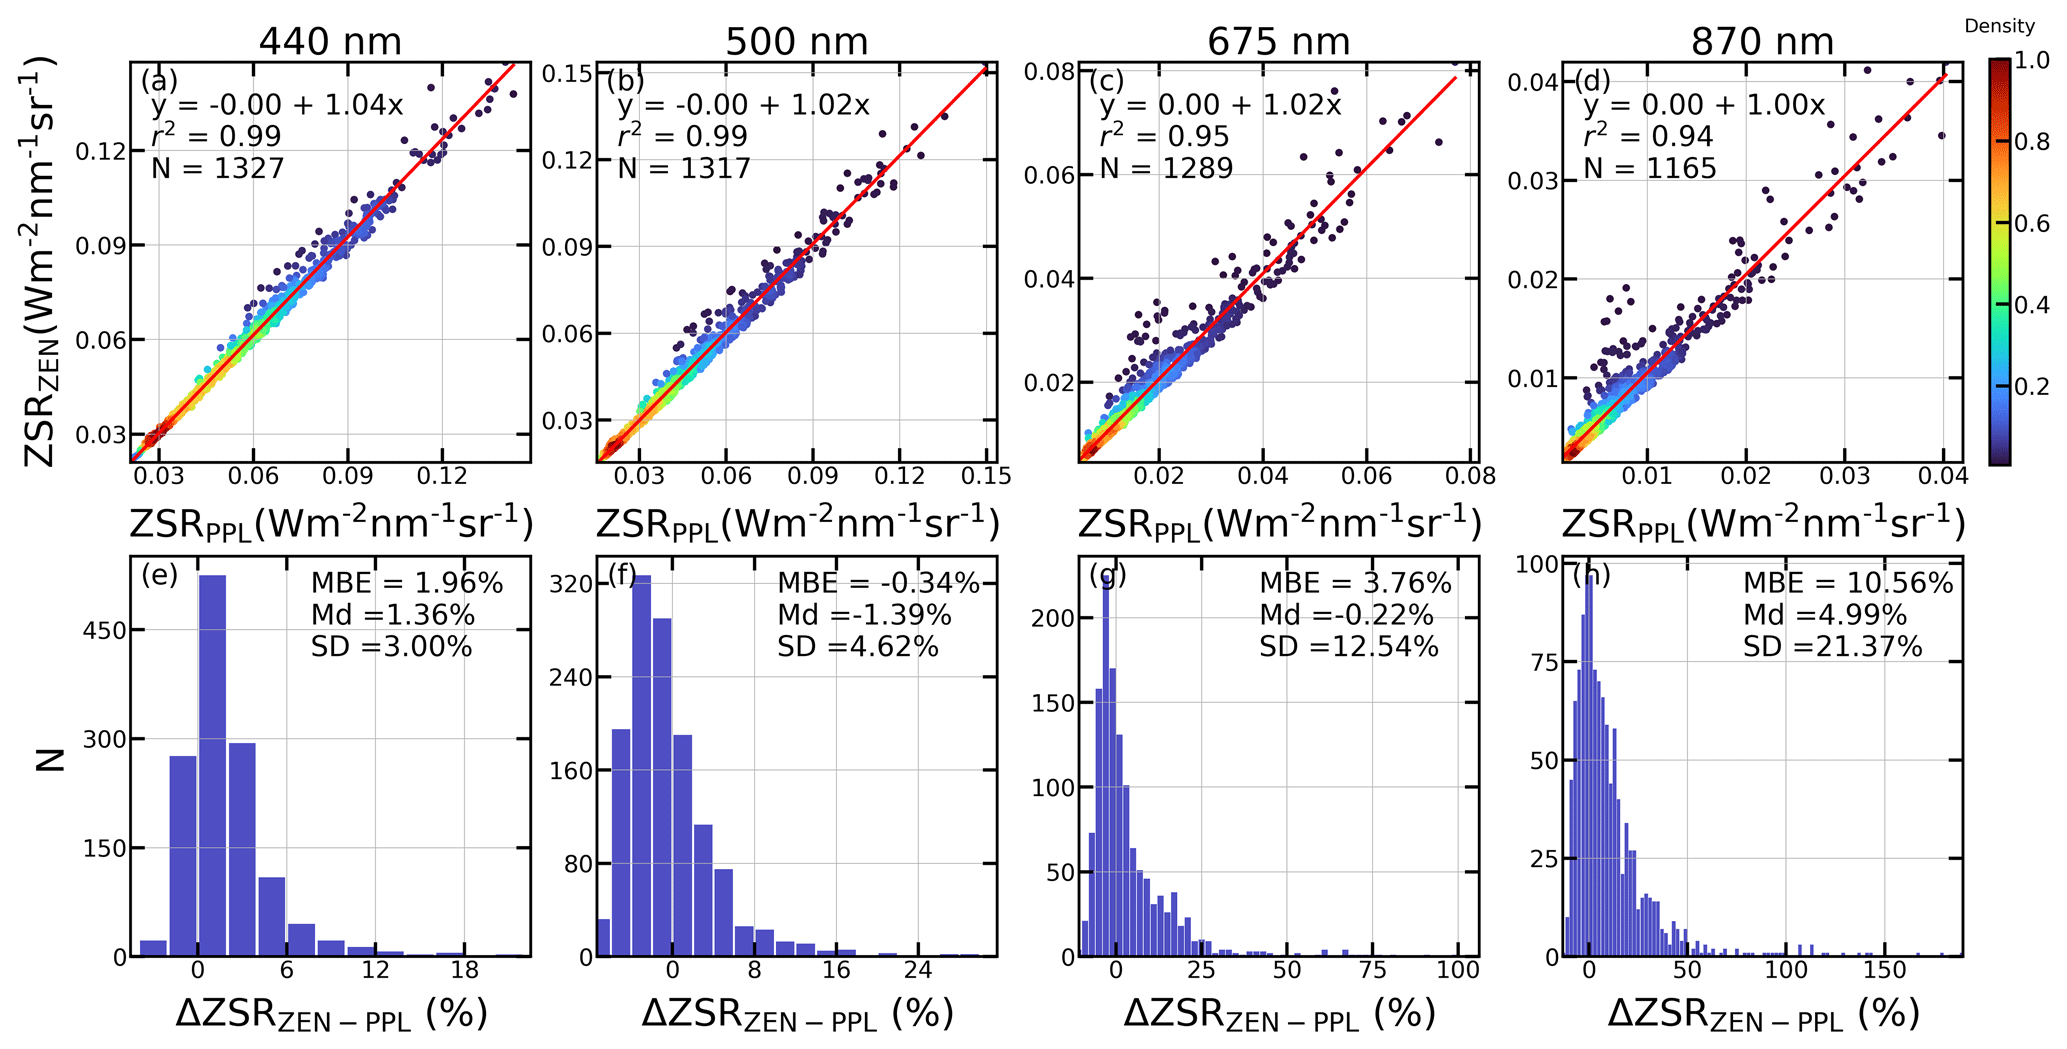
Figure 6(a–d) Density scatter plot of the calibrated ZEN-R52 measurements (ZSRZEN) against coincident zenith sky radiances derived from AERONET PPL measurements (ZSRZEN−PPL) at (a) 440, (b) 500, (c) 675 and (d) 870 nm. The Linear fit (red line), its equation, determination coefficient (r2) and number of data pairs (N) are shown. (e–h) Frequency histograms of the ΔZSRZEN−PPL differences in AOD from ZEN-R52 and AERONET PPL at (e) 440, (f) 500, (g) 675 and (h) 870 nm are shown. The mean bias error (MBE), median (Md) and standard deviation (SD) of the differences are also shown.
The PPL dataset is not directly available in the AERONET web page; thus, it has been extracted from the CÆLIS database (Fuertes et al., 2018; González et al., 2020). ZSRZEN and ZSRPPL measurements within ±1 min are compared in Fig. 6. Upper panels (a–d) of Fig. 6 show the density scatter plots of ZSRZEN against the reference ZSRPPL, where a high correlation between both datasets can be observed for all the channels, varying the determination coefficients between 0.94 (at 870 nm) and 0.99 (at 440 and 500 nm). In general, the number of outliers is higher for longer wavelengths.
In order to evaluate the uncertainty of the ZSRZEN measurements using ZSRPPL as reference, the relative differences between ZSRZEN and ZSRPPL(ΔZSRZEN−PPL) have been evaluated and represented in frequency histograms in the bottom panels (e–h) of Fig. 6. These panels also include the mean (mean bias error; MBE), median (Md) and standard deviation (SD) of ΔZSRZEN−PPL. The median values, less sensitive to outliers, are close to zero (Md=1.36 %, −1.39 % and −0.22 % for 440, 500 and 675 nm, respectively), indicating that the ZSRZEN values are accurate regarding the reference ZSRPPL values, except for the 870 nm channel, whose Md value of 4.99 % points out an overestimation of the reference ZSR values. The precision decreases for longer-wavelength channels, from SD values of 3.00 % and 4.62 % for 440 and 500 nm, respectively, to SD=12.54 % and 21.37 % for 675 and 870 nm, respectively. These accuracy and precision values will be used in the convergence criteria mentioned in Sect. 2.2.2.
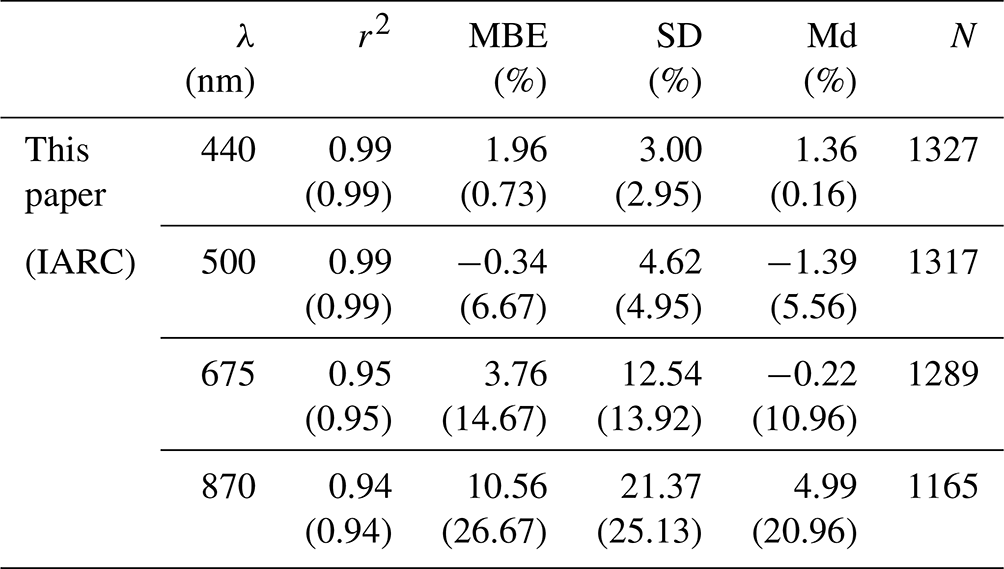
All these statistical parameters have been calculated by also considering the calibration coefficients, without temperature correction, obtained at IARC with a calibrated integrating sphere. These parameters and those previously obtained by the proposed method of this work are shown in Table 2 to check which calibration provides ZSR values closer to the reference ZSRPPL values. The results of Table 2 show that the ZSR obtained with the proposed calibration method, based on intercomparison with ZSR simulations, is, in general, more accurate and precise except for 440 nm. Although the results of Table 2 for 440 nm are worse for the proposed calibration than for the IARC calibration, the results are still good for the proposed method with MBE close to 0 (1.96 % and respectively 0.73 % for IARC) and a low value of SD (3 % and respectively 2.95 % for IARC). The ZSRZEN values from the IARC calibration are not temperature corrected, which could partially explain the observed differences.
Table 2Determination coefficient (r2) between ZSRZEN and ZSRPPL,the mean (MBE), median (Md) and standard deviation (SD) of the Δ differences between ZSRZEN and ZSRPPL at 440, 500, 675 and 870 nm using the calibration coefficient obtained in this paper with simulated ZSR values and the ones obtained with an integrating sphere at IARC in parenthesis. N represents the number of coincident ZSRZEN and ZSRPPL data pairs.
These results indicate that the ZEN-R52 measurements are more reliable at shorter wavelengths and, therefore, should be given more importance than those corresponding to longer ones in the retrieval of aerosol properties. The inversion module from the GRASP code considers the importance of each measurement through the so-called “noises”, allowing us to associate a different noise or reliability to each channel, considering them as normal distributions. The standard deviations collected in Table 2 (using the calibration proposed in this work), associated with the ZSRZEN uncertainty, are used to this end in the GRASP-ZEN method.
In order to analyse the capabilities of the proposed inversion strategy to invert ZSRZEN measurements with GRASP, a detailed sensitivity analysis is carried out in this section using synthetic data.
As mentioned in Sect. 2.2.2, the chosen method to obtain aerosol properties considers five aerosol types or models, which have fixed size distribution, refractive indices and sphere fraction. The method must retrieve aerosol properties from measurements of ZSRZEN at 440, 500, 675 and 870 nm, which is limited information. Sky radiances depend on aerosol concentration and type, among other factors like the scattering angle and SZA; hence, they are commonly used to retrieve aerosol properties by measuring them at different scattering angles and wavelengths (Nakajima et al., 1996; Román et al., 2022). Figure S5 in the Supplement shows the sky radiances in the zenith direction, modelled by GRASP for different aerosol concentrations, and how they are sensitive to changes in the AOD and aerosol type for the five aerosol types used by the inversion method. This figure shows that for higher SZA (Fig. S5; panels i–l) the ZSR values are less sensitive to aerosol type and concentration, since different scenarios show smaller differences in the corresponding ZSR, due to the lower signal in these conditions. Nevertheless, for lower SZA conditions (Fig. S5; panels a–d) there is a clear sensitivity to type and aerosol load for AOD at 440 nm, at least for values below 0.7; values above 0.7 are assumed for extreme AOD events (Mateos et al., 2020) and therefore are unusual.
To explore the limitations of the retrieval of aerosol properties following the proposed inversion strategy, two different tests have been carried out. For both tests, synthetic aerosol scenarios have been created and used as input to the GRASP forward module to simulate the ZSR under these scenarios (ZSRSYN, with SYN referring to synthetic). Since the ZSRSYN values are manually created and not real measurements, they will be randomly perturbed following a Gaussian distribution defined by the uncertainty of each channel previously calculated for the ZEN-R52 to create realistic observations (similar to Torres et al., 2017, and Román et al., 2022, among others). The perturbed ZSRSYN will be then used as input for the inversion module, following the GRASP-ZEN method. It will provide the aerosol properties as output, which will be labelled with the subindex “INV”, referring to “inversion”. The test will be focused on the retrieval of AOD and size distribution properties.
4.1 Scenarios from the combination of five aerosol types
In this test the aerosol scenarios are formed by a random mixture of the five aerosol types used by the models GRASP inversion strategy (see Sect. 2.2.2). Here we aim to assess the capabilities of the retrieval of aerosol properties if the observed aerosol was actually a pure mixture of these five types of aerosol. To this end, random fractions of each aerosol type are selected together with a random total aerosol concentration chosen in the interval from 0.01 to 0.15 µm3 µm−2, which will be used in combination with the fixed aerosol properties from each model, creating a total of 1000 scenarios. The simulations have been made for three different SZAs (30, 50 and 70∘), but we will focus here on the situation, which would represent a halfway solution and common scenario for the latitude of Valladolid.
Figure 7 shows the AODINV retrieved for SZA equal to 50∘, against the original synthetic AOD (AODSYN). The same graphs for SZA at 30 and 70∘ are shown in Fig. S6 in the Supplement. In general, the data deviation increases for high AOD values, which are less frequent. For SZA equal to 50∘, the method overestimates the aerosol load for all the wavelengths, with MBE ranging from 0.23 at 440 nm to 0.11 at 870 nm. The best results are obtained for , with absolute mean bias errors lower than 0.002 for all wavelengths and the lowest uncertainty (standard deviation lower than 0.66), while for the method slightly underestimates the AOD with MBEs ranging from −0.004 to 0. It is important to point out that the convergence capability of the method decreases for high SZAs, with the convergent inversions being a total of 43.2 % and 43.6 % at SZA=30 and 50∘, respectively, but only 27.1 % for (considering that there are initially 1000 scenarios). These results could be related to the dependence of the ZSR sensitivity on the SZA, which is higher for lower SZA, and therefore would make it easier for the method to find a solution.
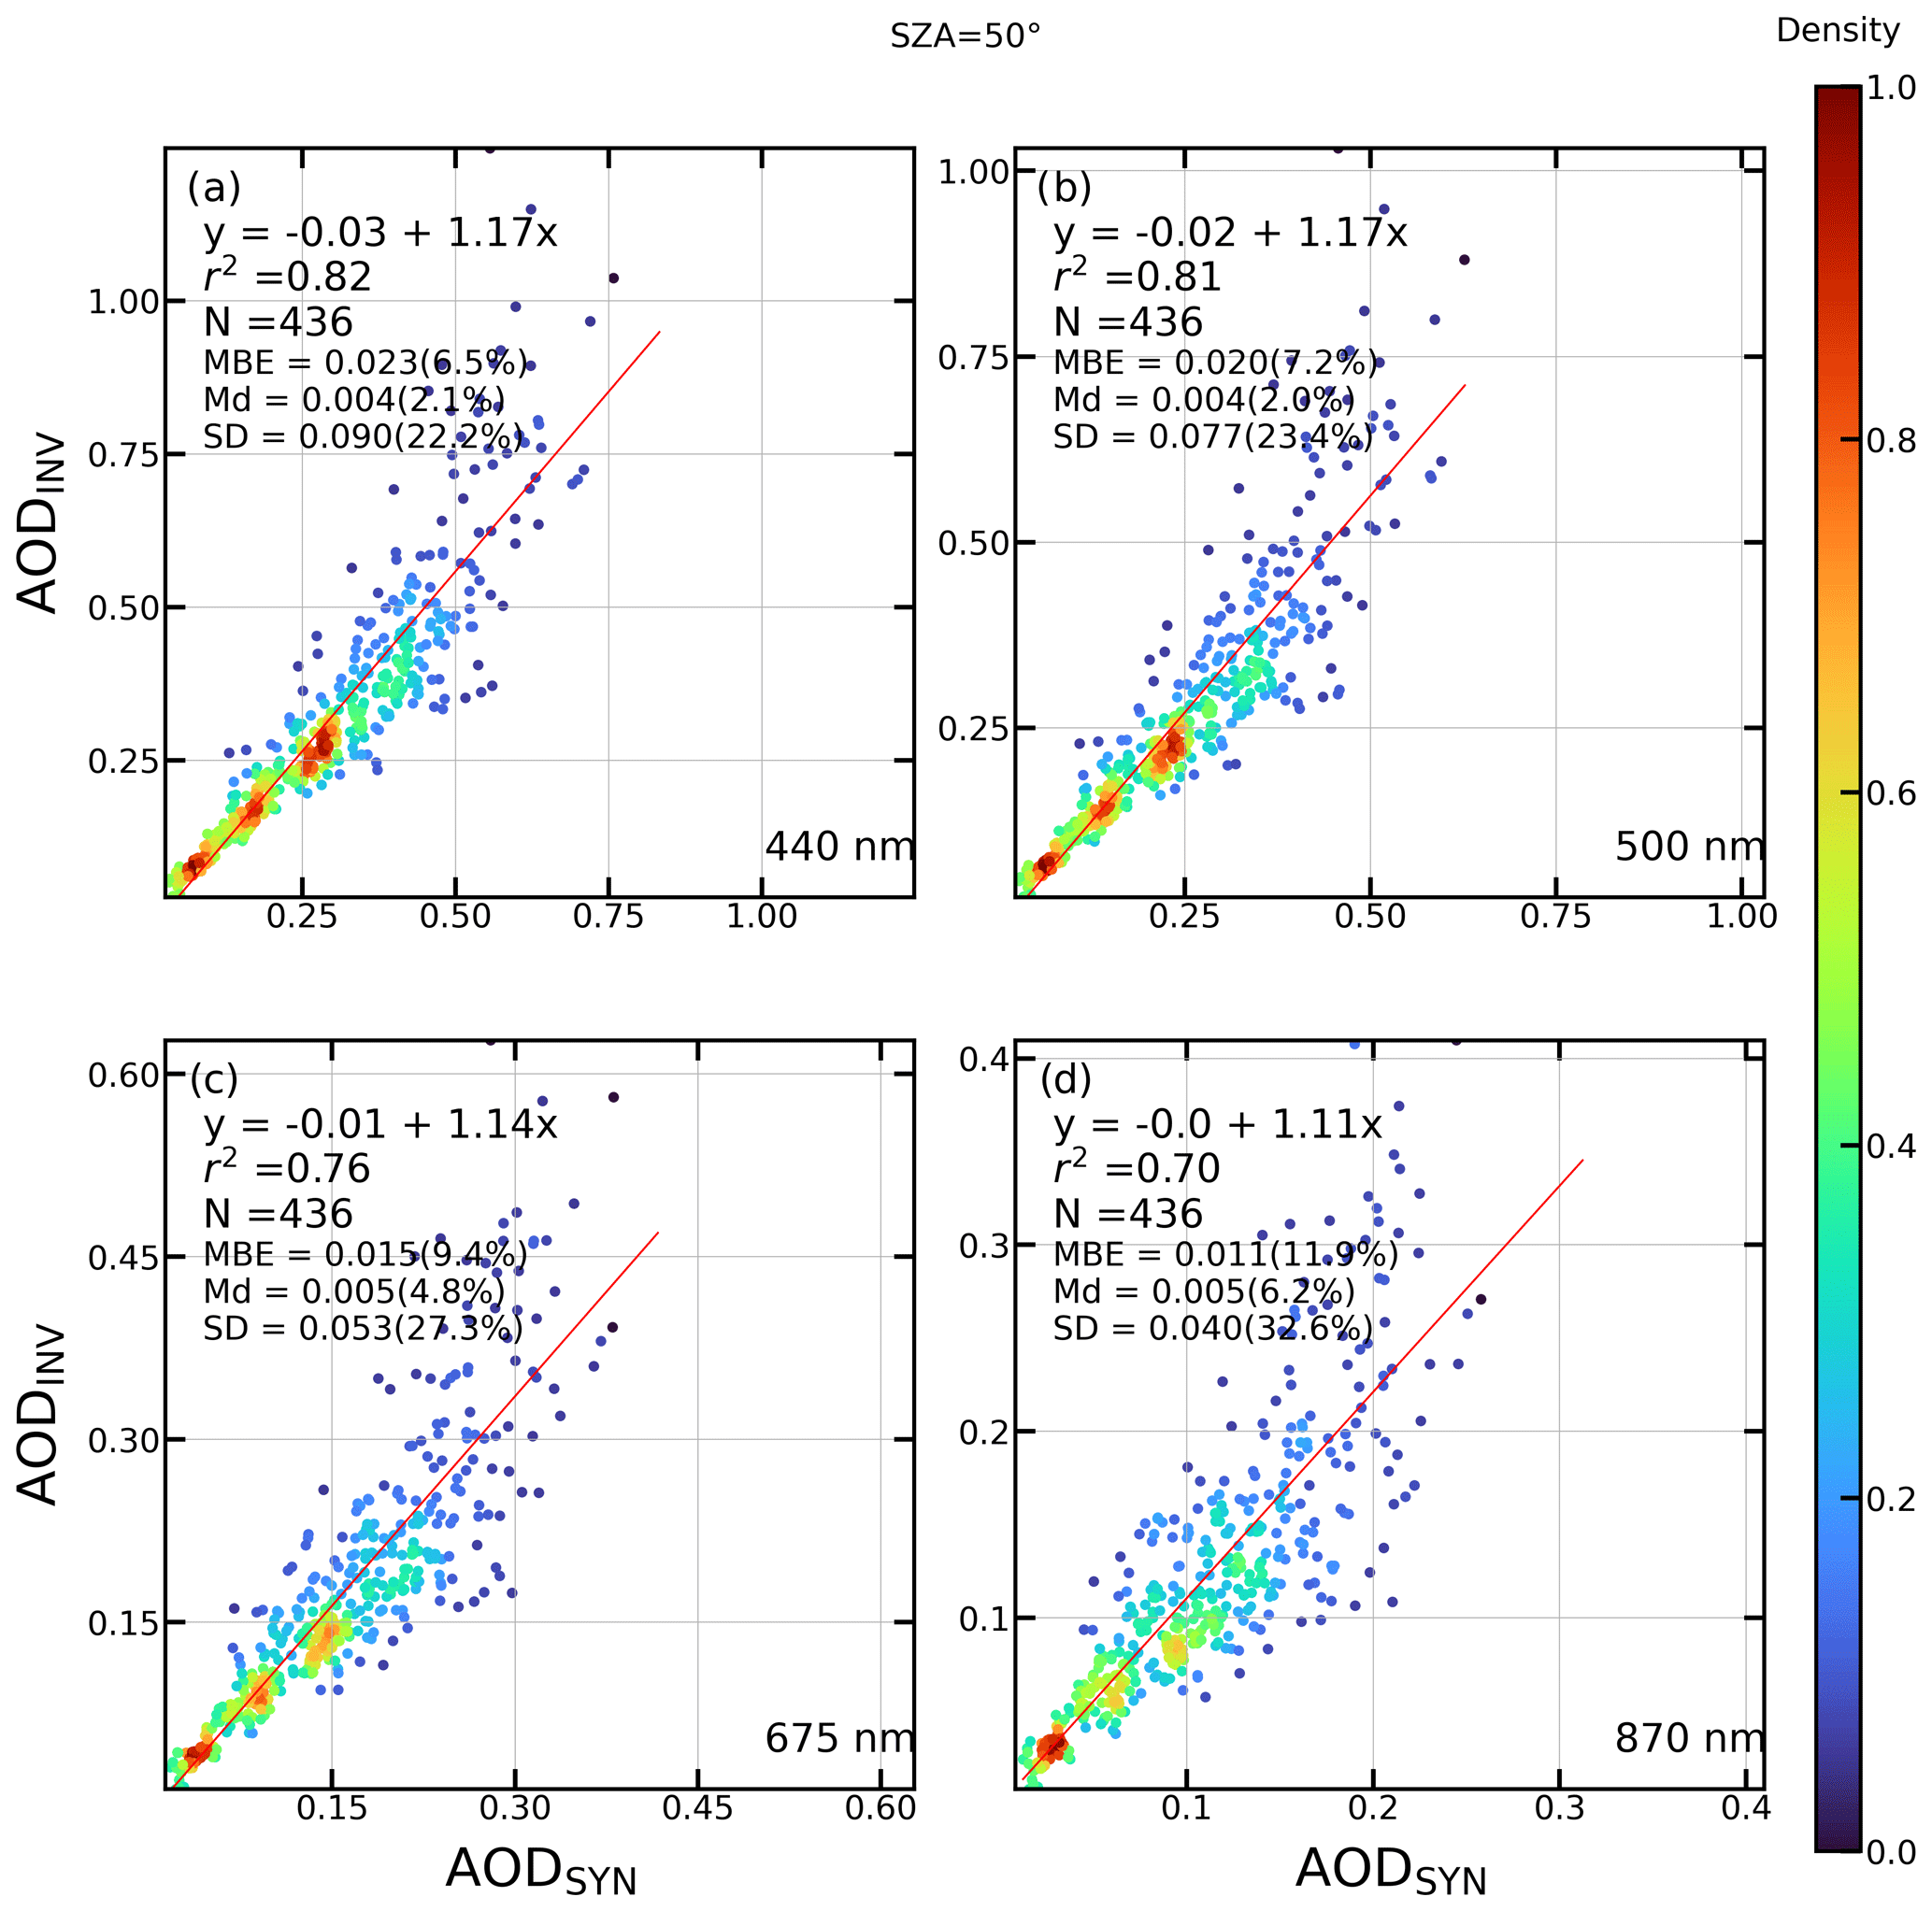
Figure 7Density scatter plot of the AOD retrieved by GRASP after the inversion of synthetic ZSR (AODINV) against the initial AOD (AODSYN) obtained for synthetic scenarios created from the combination of five aerosol types for at (a) 440, (b) 500, (c) 675 and (d) 870 nm. The Linear fit (red line) with its equation, determination coefficient (r2) and number of data points (N) are shown. Mean bias error (MBE), median (Md) and standard deviation (SD) of the absolute and Δ (between round brackets) differences between the inverted and synthetic AOD are also included.
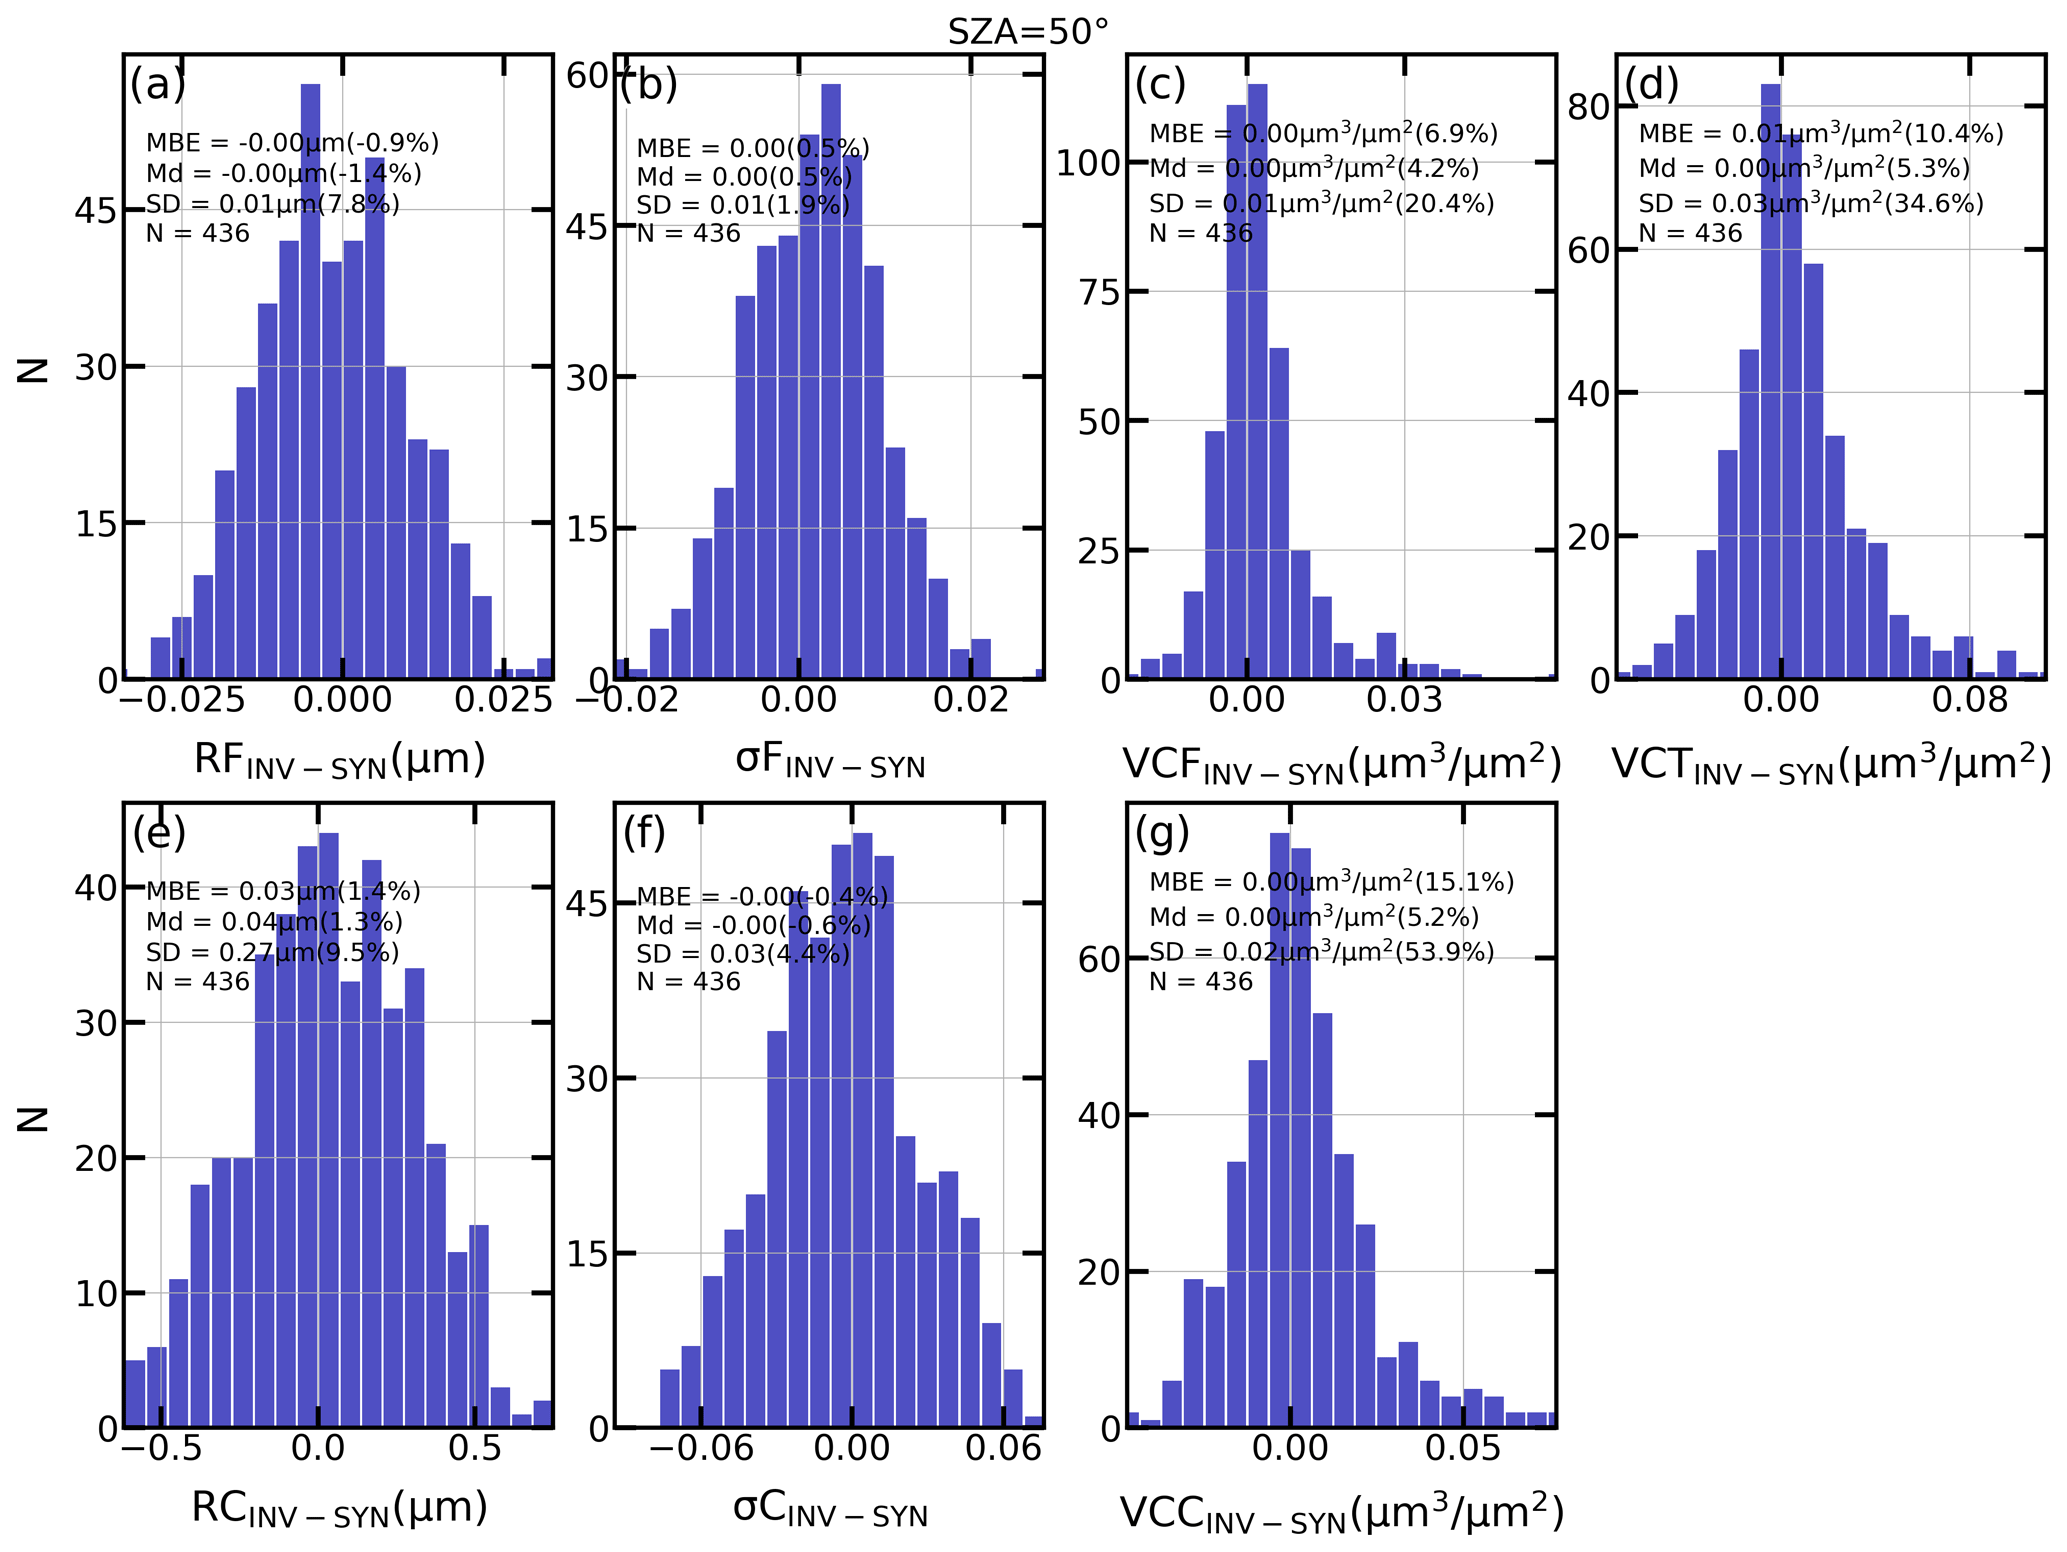
Figure 8Frequency histograms of the absolute differences in the aerosol size distribution properties retrieved by GRASP after the inversion of synthetic ZSR (INV) and the ones initially obtained (SYN) for synthetic scenarios created from the combination of five aerosol types at . The mean bias error (MBE), median (Md) and standard deviation (SD) as well as their corresponding values for the Δ differences (between round brackets) are also shown. These size distribution properties are volume median radius of fine (RF) and coarse (RC) modes, standard deviation of log-normal distribution for fine (σF) and coarse modes (σC), and aerosol volume concentration for fine (VCF) and coarse (VCC) modes as well as the total (VCT).
For the size distribution, the frequency histograms of the absolute differences between the inverted and the synthetic parameters are shown in Fig. 8 for a clear overview of the results obtained (the direct scatter plot comparison can be seen in Fig. S7 in the Supplement). For the current synthetic test, the retrieval of size distribution properties is very accurate and precise, showing Md values very close to zero for all the properties. For the volume median radius and standard deviation of the log-normal distribution, the precision is high, with SD<10 % for both fine and coarse modes. In the case of the aerosol volume concentration, the uncertainty is higher, with SD values of 0.03 (34.6 %), 0.01 (20.4 %) and 0.02 µm3 µm−2 (53.9 %) for the total, fine and coarse modes, respectively. These results could be, at least in part, due to the fixed size distributions for the models, which present similar RF, RC, σF and σC values; therefore, they will not show an important variation when combining them, but on the contrary, the aerosol volume concentration is an extensive property and therefore can have a higher variation.
4.2 AERONET scenarios
The same procedure is developed in this test but using real aerosol scenarios retrieved at Valladolid by AERONET. In this case, the AERONET-retrieved aerosol properties (size distribution, refractive indices, etc.) are used directly as input in the GRASP forward module to simulate the ZSR values. For this new test, all the available inversions (almucantar and hybrid scans) from AERONET for the coincident ZEN-R52 measurement period (2019–2021) with a sky error < 5 % have been used, obtaining a total of 5321 synthetic scenarios. With this test, we aim to assess the capabilities of the method to retrieve the aerosol properties when the aerosol scenario corresponds to real aerosol conditions and not necessarily to a mixture of the five mentioned aerosol types. In this situation, the ZSRSYN simulations are made for the corresponding date and time at which the AERONET inversion product was retrieved, achieving a wide variety of SZA values ().
Figure 9 presents the comparison between the AODINV, obtained from the inversion of the perturbed ZSRSYN with GRASP-ZEN, and AODSYN from AERONET scenarios. This comparison reveals a clear overestimation of the inverted AOD values compared to the original ones for the four wavelengths, ranging the MBE values from 0.01 to 0.04 and the Md from 0.01 to 0.03 for the differences between both datasets. These results could be related with the previous results of AOD overestimation at , but in this situation it is not related with the SZA, since it has been checked that points with different SZAs are homogeneously distributed. Therefore, the overestimation occurs for all SZA. The standard deviation values of the AOD differences, which can be associated with a “theoretical uncertainty” of the method, are 0.05 for 440 and 500 nm, 0.03 for 675 nm, and 0.02 for 870 nm.
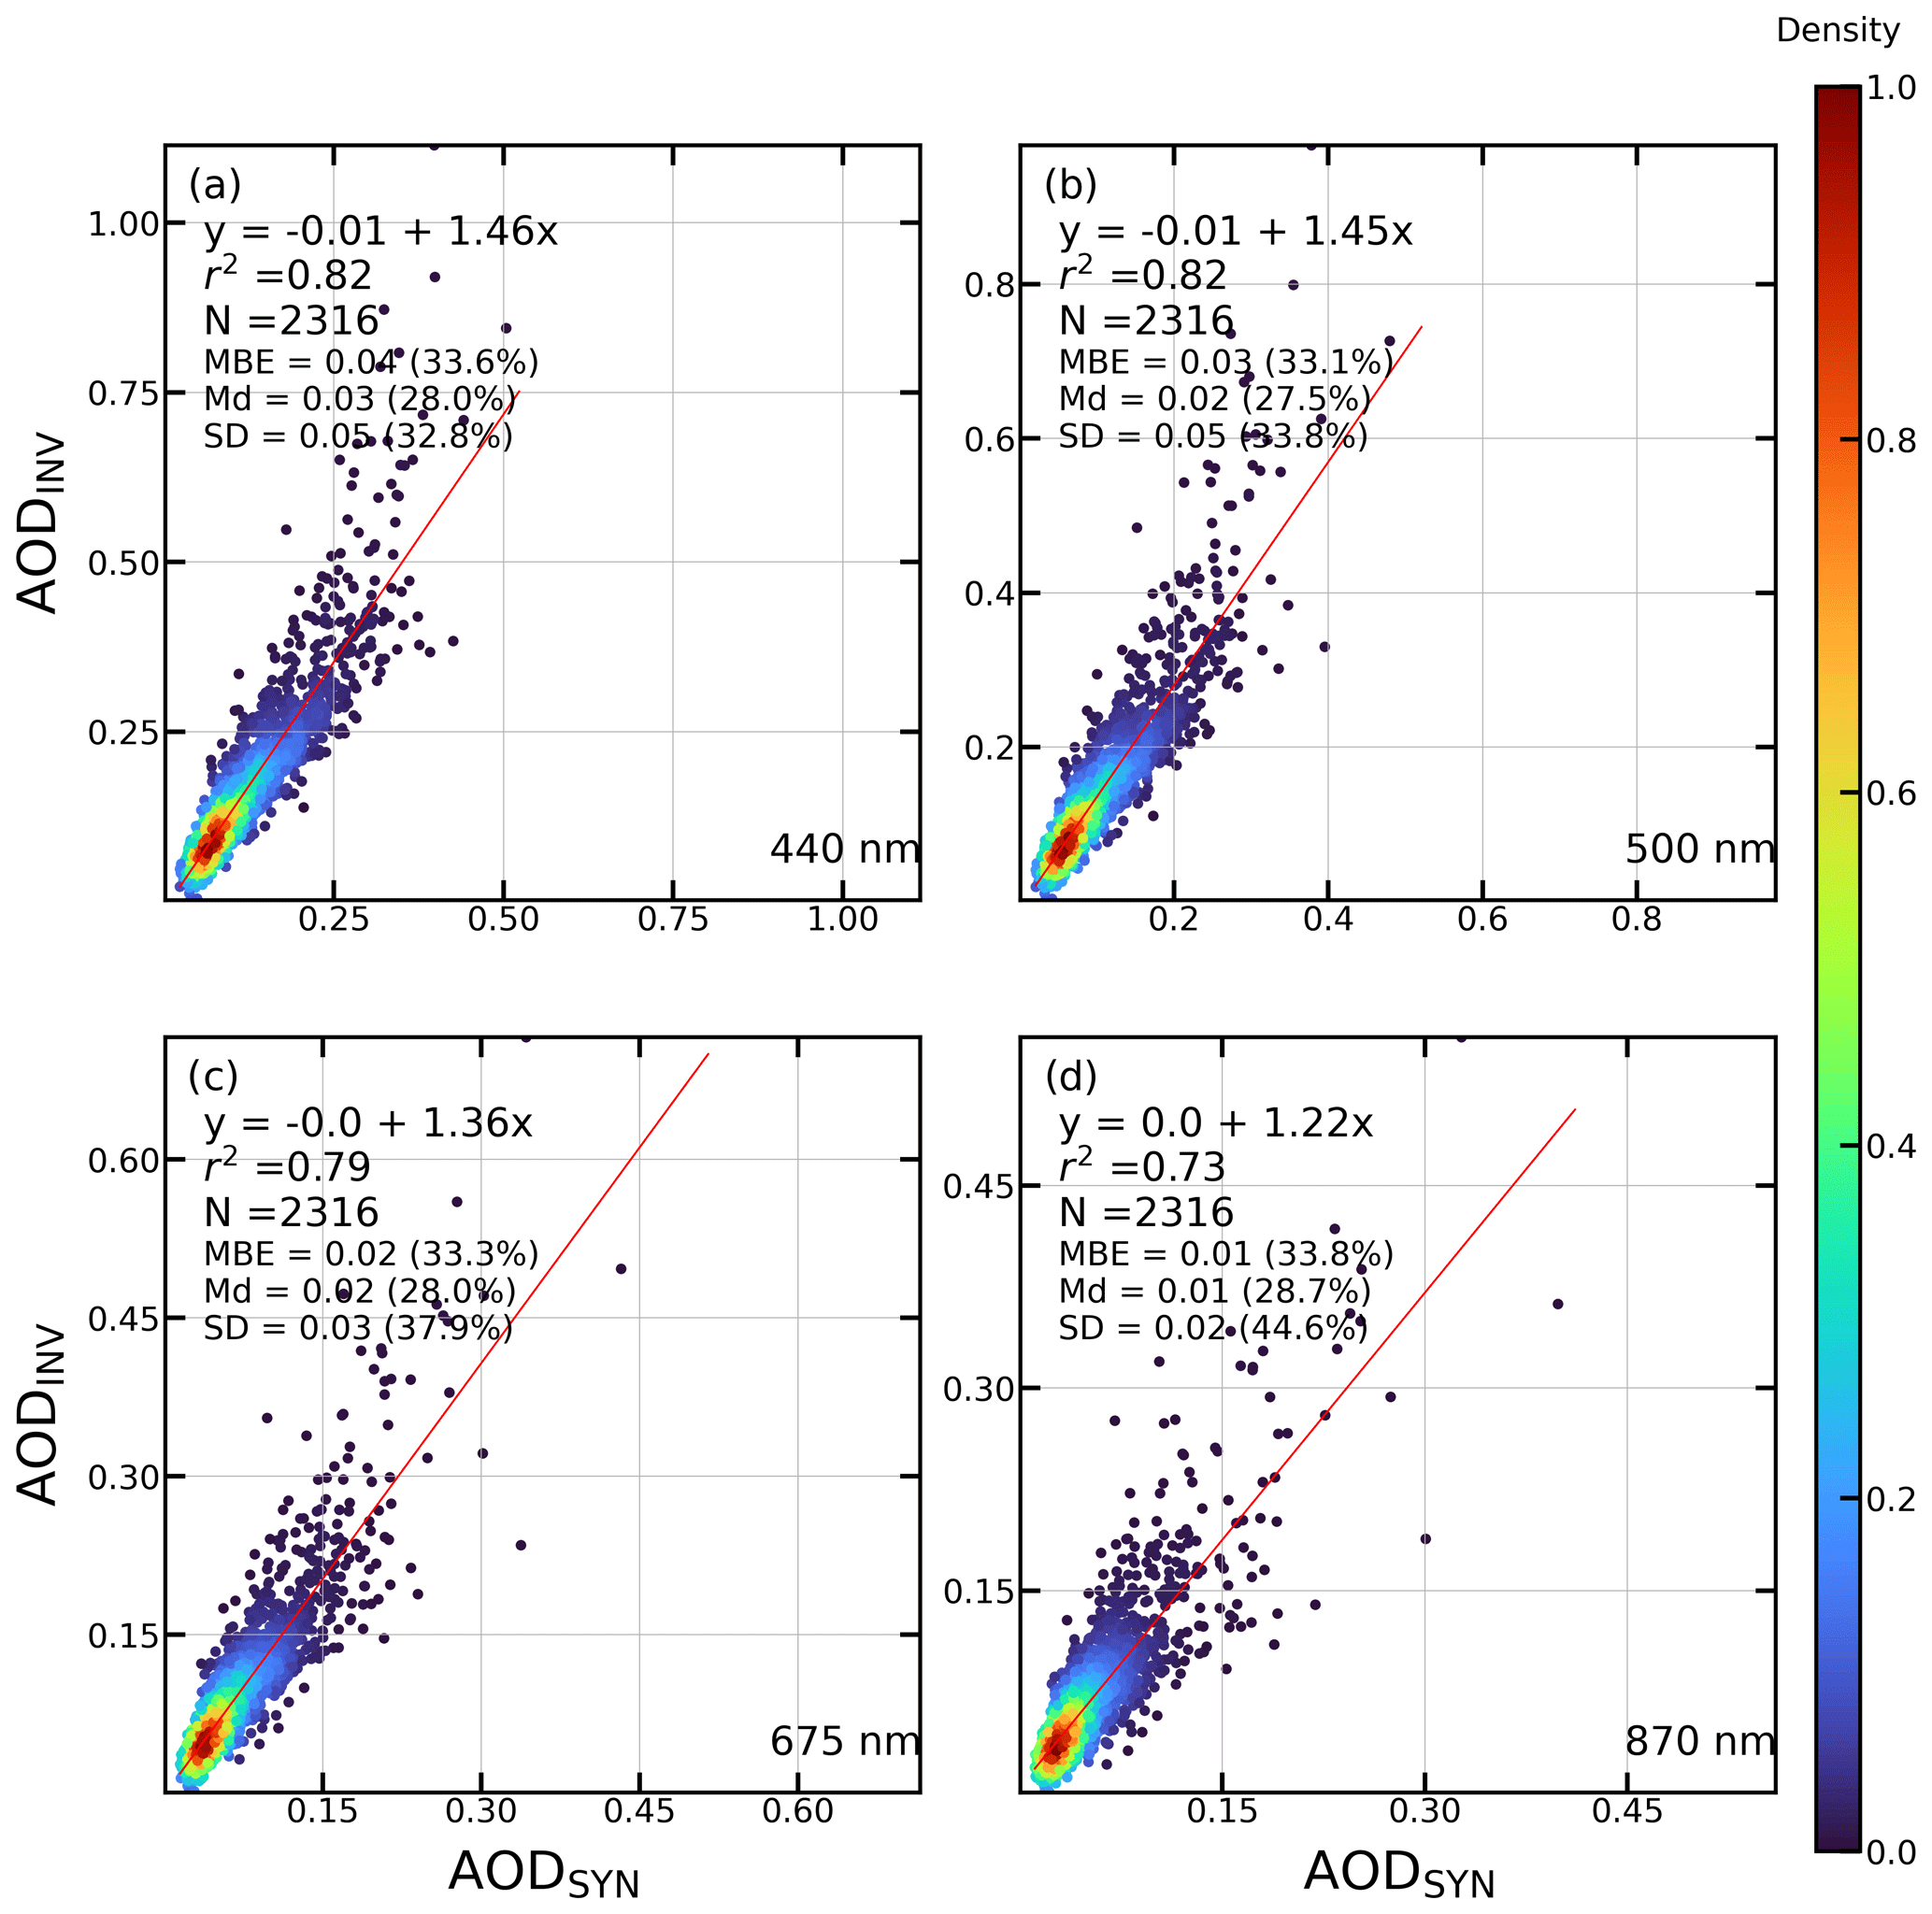
Figure 9Density scatter plot of the AOD retrieved by GRASP after the inversion of synthetic ZSR (AODINV) against the initial AOD (AODSYN) obtained for synthetic scenarios created from AERONET retrievals at (a) 440, (b) 500, (c) 675 and (d) 870 nm. The Linear fit (red line) with its equation, determination coefficient (r2) and number of data points (N) are shown. Mean bias error (MBE), median (Md), and standard deviation (SD) of the absolute and Δ (between round brackets) differences between the inverted and synthetic AOD are also included.
The reason for the observed overestimation could be in the limitations of the GRASP-ZEN method based on the models approach, which only allows us to retrieve aerosol properties within the properties of the five aerosol types. This means that, for example, if the real aerosol has a median radius of fine mode bigger than the ones of the five models, then the GRASP-ZEN retrieval will underestimate the real median radius of fine mode, and this difference will be compensated for by unbalancing other aerosol properties to fit the measured ZSR and the synthetic ZSR values of the retrieved aerosol scenario (to reduce the residual differences in ZSR values).
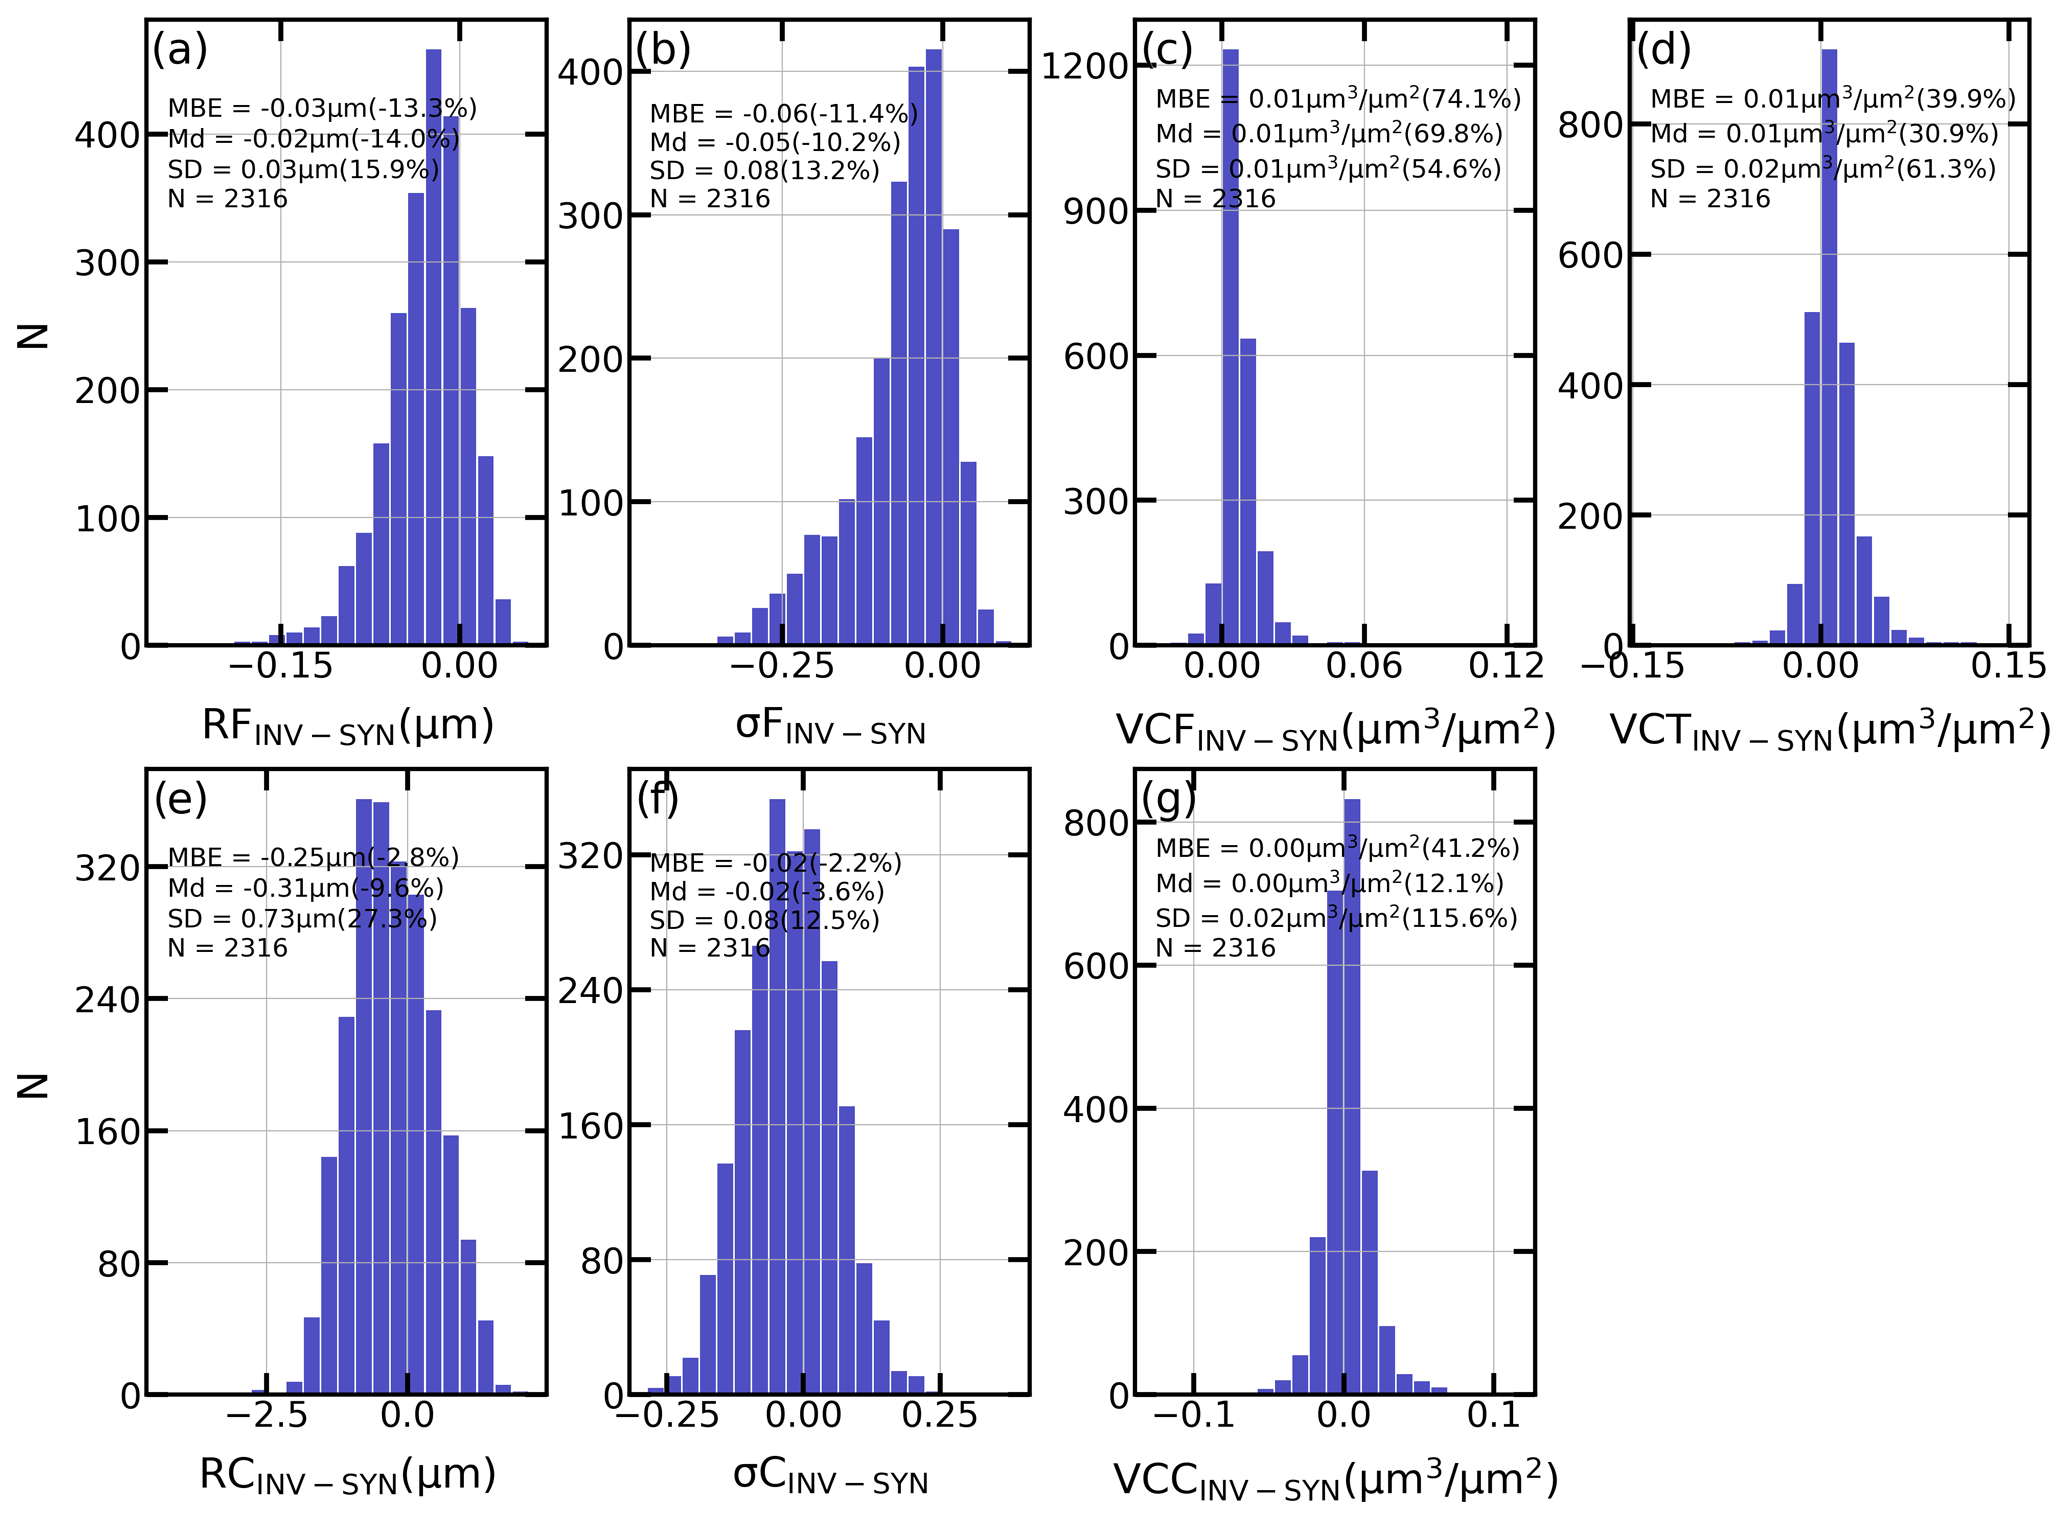
Figure 10Frequency histograms of the absolute differences in the aerosol size distribution properties retrieved by GRASP after the inversion of synthetic ZSR (INV) and the ones initially obtained (SYN) for synthetic scenarios created from AERONET retrievals. The mean bias error (MBE), median (Md) and standard deviation (SD) as well as their corresponding values for the Δ differences (between round brackets) are also shown. These size distribution properties are volume median radius of fine (RF) and coarse (RC) modes, standard deviation of log-normal distribution for fine (σF) and coarse modes (σC), and aerosol volume concentration for fine (VCF) and coarse (VCC) modes as well as the total (VCT).
To explore this hypothesis, the retrieved size distribution properties have been compared with the synthetic ones. The frequency histograms for the absolute differences between the inverted and the synthetic properties are shown in Fig. 10 (the direct scatter plot comparison can be seen in Fig. S8 in the Supplement). The retrieved volume concentrations present median differences regarding the synthetic ones about 0.01 µm3 µm−2 for VCF and VCT and very close to zero for the VCC. Similarly to the AOD, the volume concentration data present a theoretical uncertainty of 0.01 µm3 µm−2 for the fine mode and 0.02 µm3 µm−2 for the coarse mode and the total. The retrieved intensive properties underestimate the reference values, with the median values of their differences being about −14 % and −10 % for RF and σF, respectively, and −10 % and −4 % for RC and σC, respectively.
This lack of accuracy is the main difference between the results of Figs. 10 and 8. As mentioned before, we would expect a higher accuracy and precision in the retrieved values of the volume median radius and standard deviation for the model combination scenarios test (Sect. 4.1), since the scenario can be perfectly reproduced by GRASP-ZEN because it is a combination of the same models used in the inversion module; however, for a real aerosol scenario (the test for AERONET scenarios of this subsection), these properties would be impossible to obtain with enough accuracy since they present a wider range of size distributions than the one offered by the models approach. Similar results are expected for the real and imaginary refractive index and other optical properties, due to the limitations of the models approach.
The results of this section conclude that the GRASP-ZEN method is useful for the retrieval of AOD but not for some size distribution properties, like the volume median radius and standard deviation of fine and coarse modes. Therefore, we will focus on the retrieval of AOD at 440, 500, 675 and 870 nm as well as VCF, VCC and VCT.
Once the ZSRZEN measurements have been calibrated and the GRASP-ZEN method has been proved in Sect. 4 as capable of retrieving aerosol properties, the GRASP-ZEN methodology was applied to the whole available dataset of ZEN-R52 measurements at Valladolid at the moment of the study. As a result, a total of 222 663 GRASP-ZEN retrievals have been obtained between April 2019 and September 2021. This dataset has been obtained using ZSRZEN measurements which satisfy the filtering criteria determined in Sect. 3.2. The retrievals that were considered non-convergent were removed, which led to a total of 170 637 retrievals. This convergence check is based on the evaluation of the residuals from the inversion process (see Sect. 2.2.2). A cloud-screening filter was applied, based mainly on the retrieved AOD at 500 nm, following a similar procedure as in Giles et al. (2019) for cloud screening in AERONET version 3. Three checks are applied for this cloud screening: smoothness, stand-alone check and ±3σ. The smoothness check is done by the analysis of the AOD variation at 500 nm: if the variation is higher than 0.01 min−1 for each pair of two subsequent values, the retrieval with larger AOD at 500 nm in the pair is removed. After the smoothness, the stand-alone check is applied: all single retrievals which are more than 1 h apart from the closest available retrieval are removed. Finally, for each day, the daily mean and standard deviation are calculated for the retrieved AOD at 500 nm and for the Ångström exponent (AE; Ångström, 1964) obtained with the four retrieved AOD values (440, 500, 676 and 870 nm). To satisfy the ±3σ check, the retrieved AOD at 500 nm and AE must be within the daily mean ±3σ (triple standard deviation). Values not satisfying this requirement are removed. A final dataset with 126 112 points satisfying the convergence and cloud-screening criteria is obtained.
5.1 Aerosol optical depth
The AOD retrieved by GRASP-ZEN using the ZSRZEN measurements (AODGRASP_ZEN) has been compared against independent AOD measurements from AERONET (AODAERONET) derived from CE318 Sun–sky photometers co-located with the ZEN-R52 at Valladolid. Figure 11 shows the complete time series evolution of AODGRASP_ZEN together with AODAERONET, both at 440 nm. Despite some AODGRASP_ZEN outliers which are not reproduced by the AODAERONET, both datasets show in general a similar temporal evolution. Figure 12 shows a more detailed view of these data in a shorter period, from 16 to 22 June 2020, with high availability of data from both GRASP-ZEN and AERONET datasets for the four wavelengths. A lack of AOD values in the GRASP-ZEN dataset around midday is observed; it is explained by the rejection of ZEN-R52 measurements for SZAs below 30∘, which, in the analysed period and latitude, occurs around midday. In Fig. 12 (panels a–d), it can also be observed that both GRASP-ZEN and AERONET datasets vary with time in a similar way for all the wavelengths, with AOD values from GRASP-ZEN slightly overestimating the AOD values from AERONET at all wavelengths.
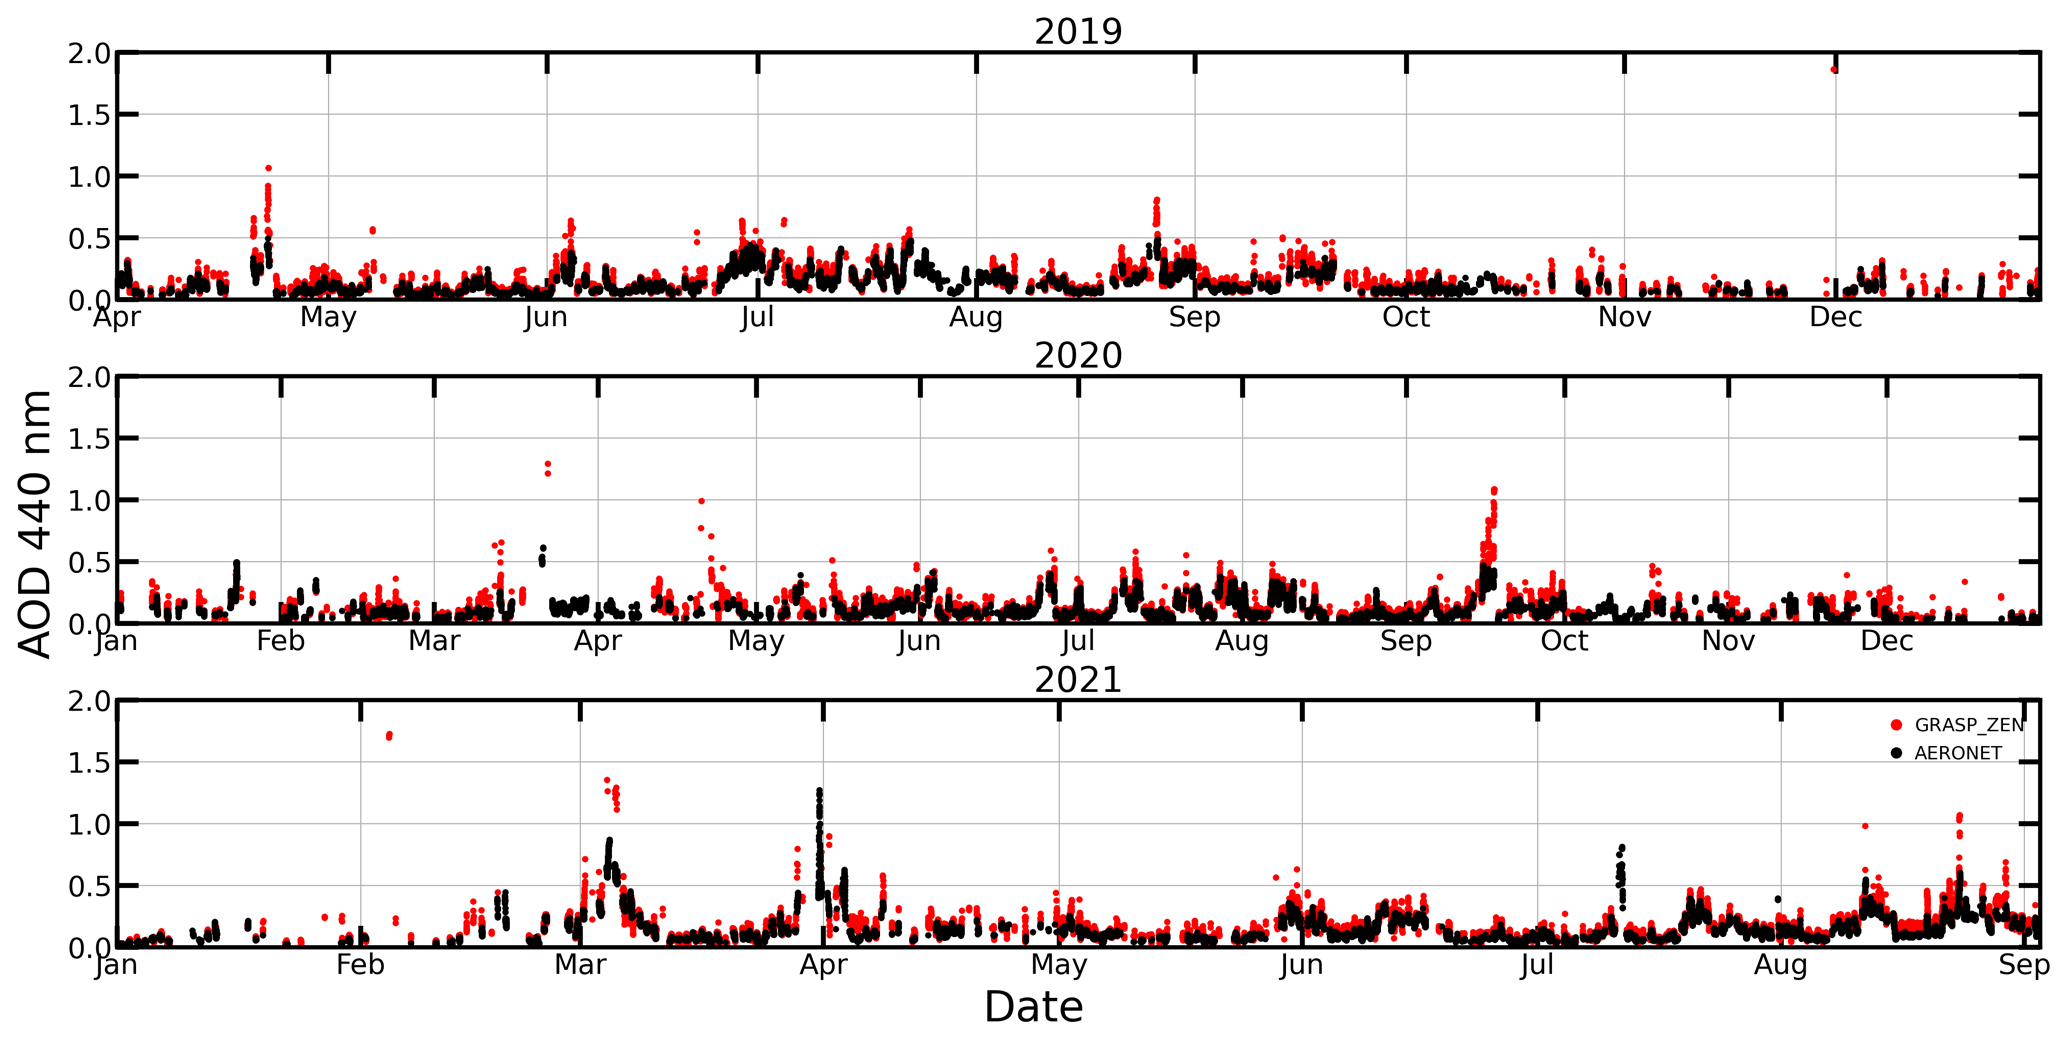
Figure 11Time series evolution of aerosol optical depth (AOD) at 440 nm retrieved by GRASP-ZEN and by AERONET at Valladolid for all the ZEN-R52 available dataset (April 2019 to September 2021).
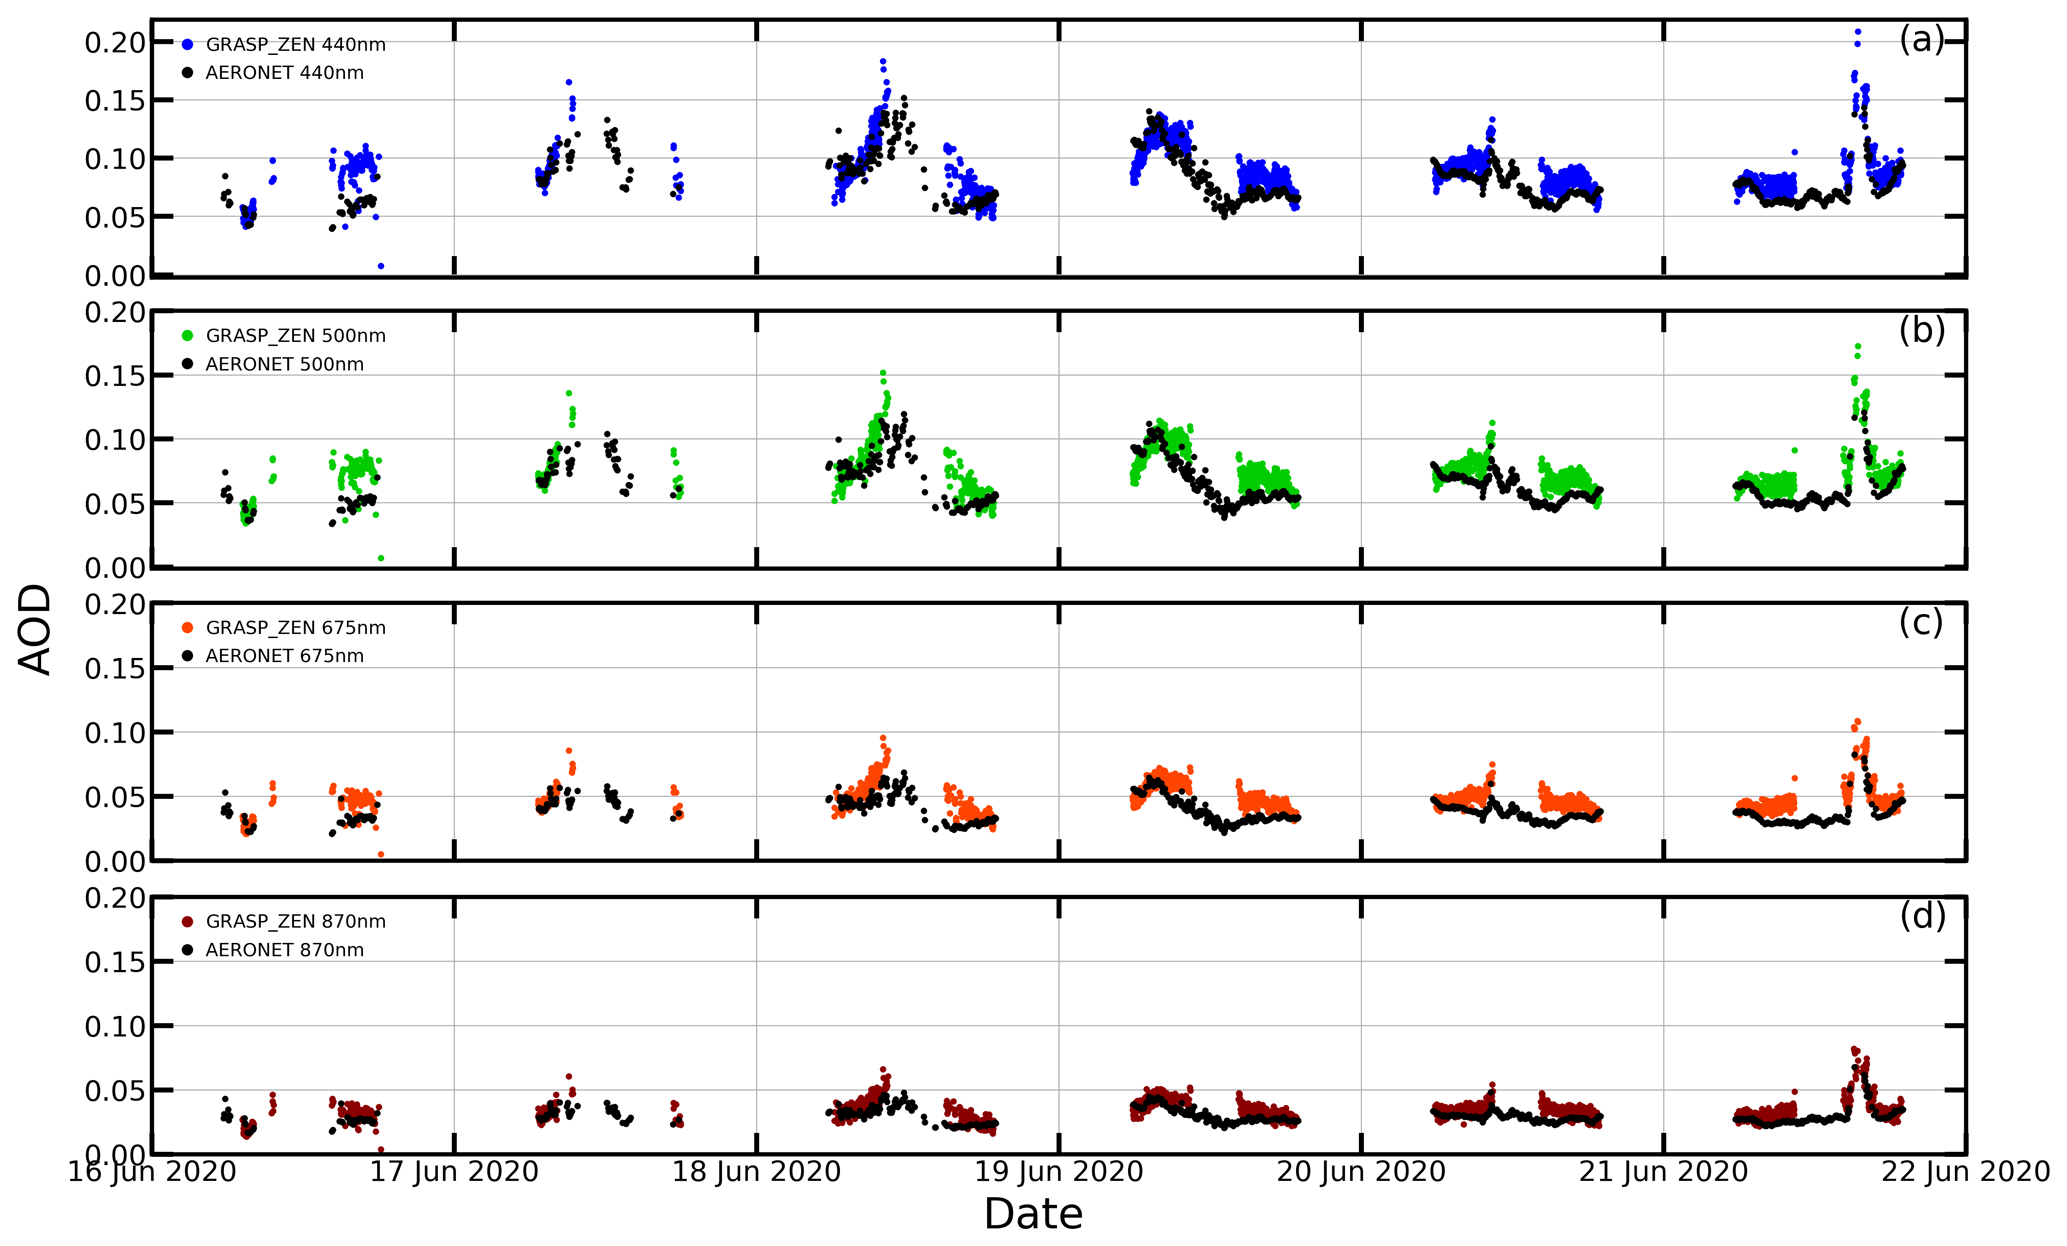
Figure 12(a–d) Time series evolution of aerosol optical depth (AOD) at (a) 440, (b) 500, (c) 675 and (d) 870 nm retrieved by GRASP-ZEN and by AERONET at Valladolid for a week period in summer 2020 (16 to 22 June). (e) AOD retrieved by GRASP-ZEN for all ZEN-R52 channels are plotted together.
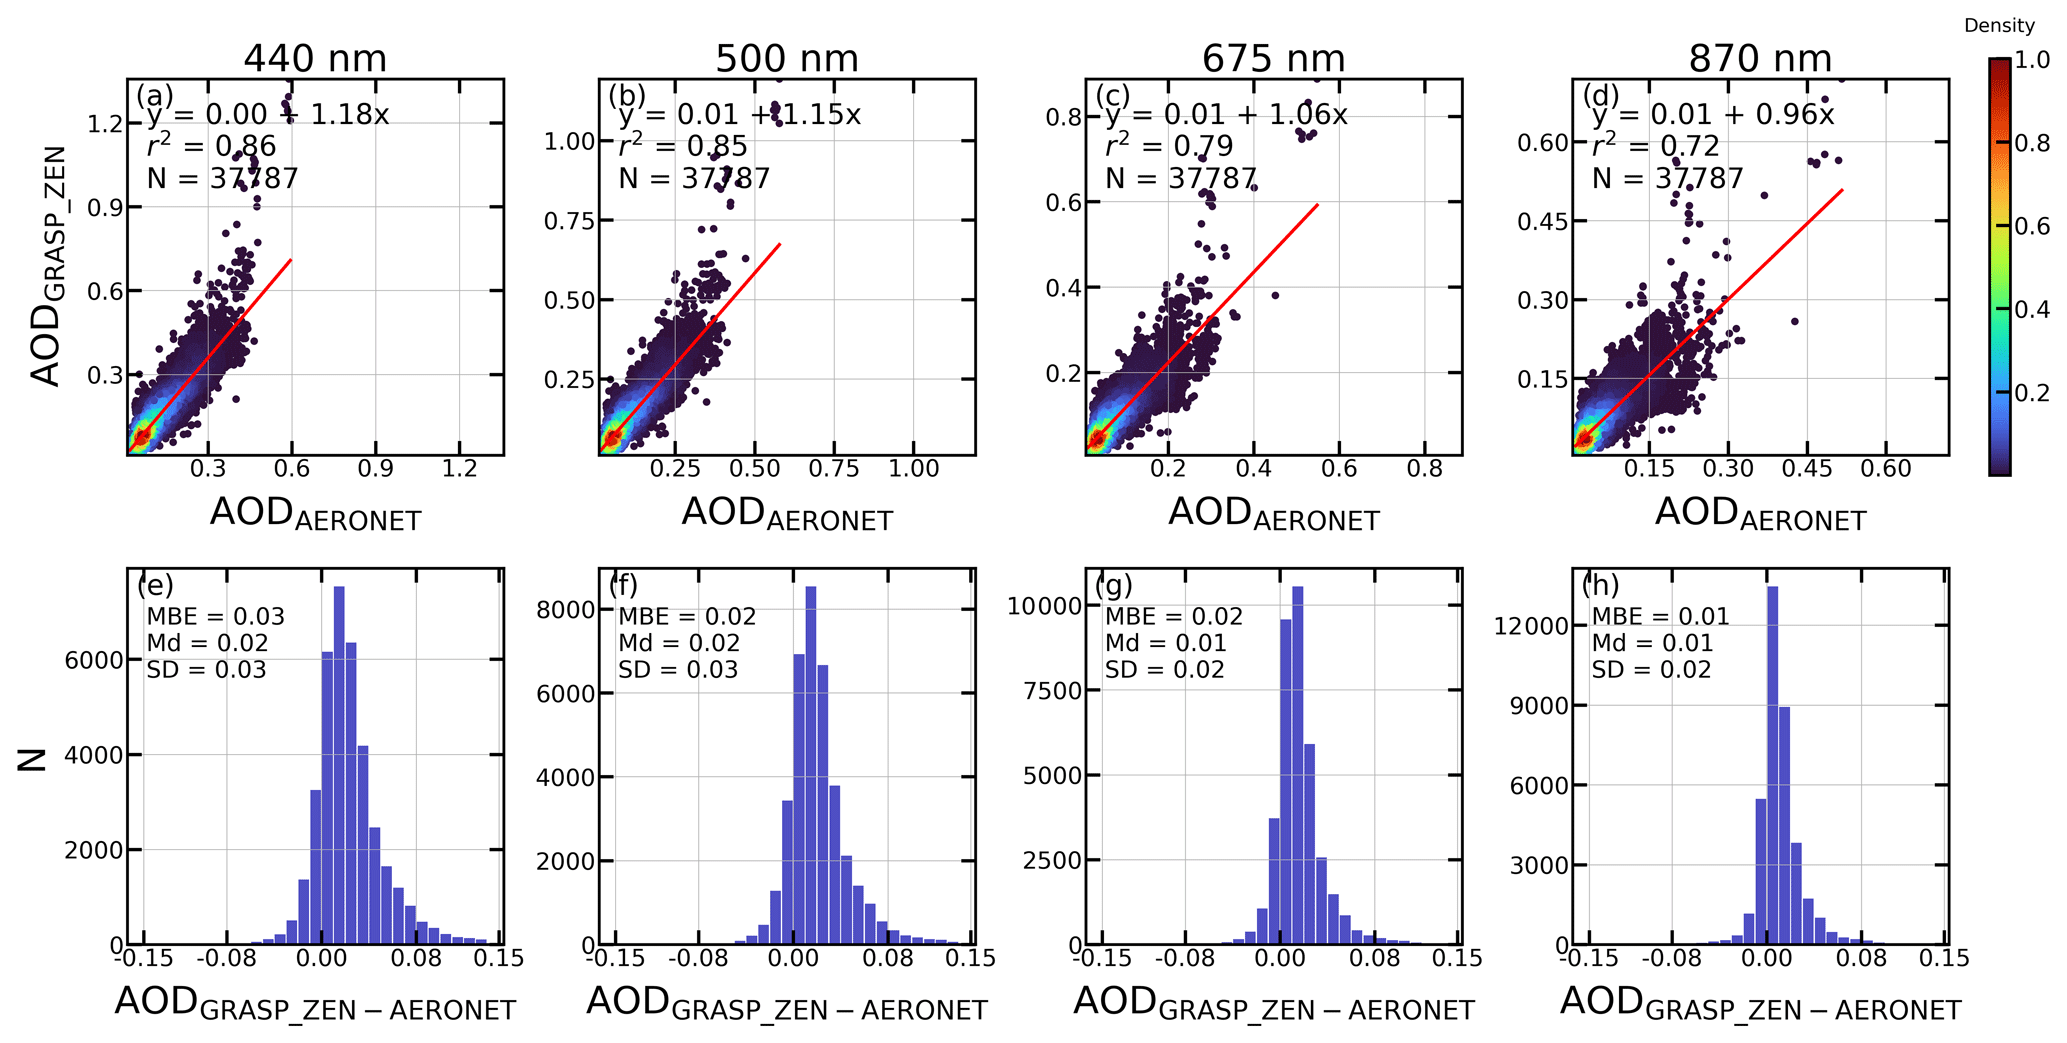
Figure 13(a–d) Density scatter plots of the AOD retrieved by GRASP-ZEN (AODGRASP_ZEN) against coincident measurement from AERONET (AODAERONET) at (a) 440, (b) 500, (c) 675 and (d) 870 nm. The Linear fit (red line), its equation, determination coefficient (r2) and number of data pairs (N) are shown. (e–h) Frequency histograms of the absolute differences in AOD from GRASP-ZEN and AERONET at (e) 440, (f) 500, (g) 675 and (h) 870 nm. The mean bias error (MBE), median (Md) and standard deviation (SD) are also shown.
To perform a more quantitative analysis of the correlation between these datasets, a matchup of AERONET AOD (AODAERONET) with GRASP-ZEN AOD (AODGRASP_ZEN) values within 1.5 min has been made, obtaining a total of 37 787 coincident points per wavelength. The AOD data from GRASP-ZEN are represented against the coincident AOD from AERONET in a density plot in Fig. 13 for each wavelength (panels a–d). This figure (panels e–h) also shows in the bottom panels the frequency histograms for the differences between both AOD datasets. AODGRASP_ZEN presents a higher correlation with AODAERONET for shorter wavelengths, with r2 ranging from 0.86 at 440 nm to 0.72 at 870 nm. In general, the AOD at 675 nm and especially at 870 nm presents more deviation between the data pairs than for the shorter wavelengths. Some outliers presenting high AODGRASP_ZEN values can be appreciated, especially at shorter wavelengths; this could be caused by some spurious measurements likely contaminated by clouds that pass the cloud-screening criteria or measurements recorded with dirtiness, rain droplets or dust over the instrument (it must be frequently cleaned). AOD from GRASP-ZEN generally overestimates the AERONET values, as the sensitivity study of Sect. 4.2 pointed out, with median values of the differences of AODGRASP_ZEN with respect to AODAERONET between 0.01 and 0.02 for all wavelengths; similar values appear for MBE, ranging from 0.01 to 0.03. The uncertainty in the retrieved AODGRASP_ZEN is estimated by SD to be 0.03 for 440 and 500 nm and 0.02 for 675 and 870 nm, using as reference the values provided by AERONET, which are within the theoretical uncertainty obtained in the previous section for the AOD.
5.2 Aerosol volume concentration
Regarding the total aerosol volume concentration, the values retrieved with GRASP-ZEN and the ones from AERONET for the whole period are shown in Fig. 14. The time evolution shows generally a similar behaviour for both datasets with the exception of some VCT extreme values more frequent in the GRASP-ZEN database. Here it can also be seen that for this parameter there is a higher temporal coverage from GRASP-ZEN than from AERONET.
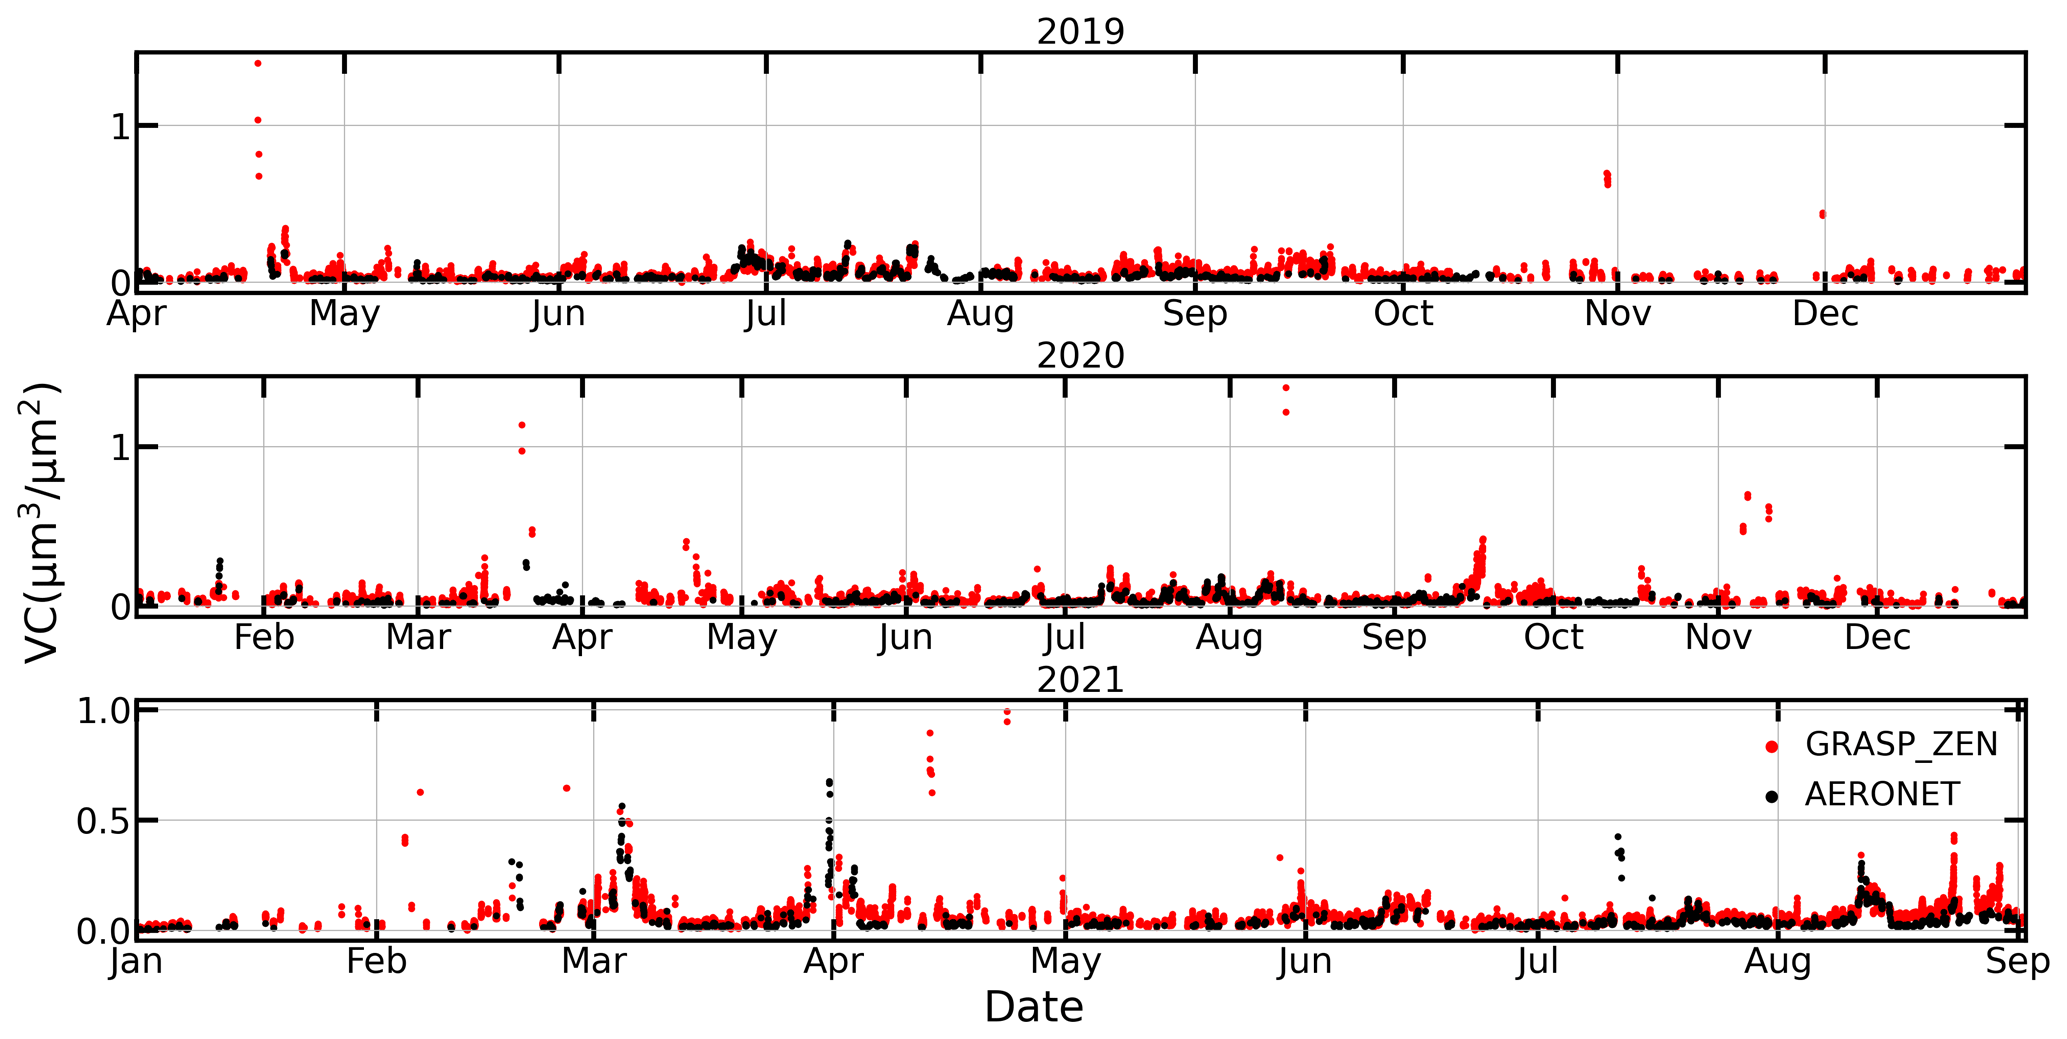
Figure 14Time series evolution of the total volume concentration (VCT) retrieved by GRASP-ZEN and by AERONET at Valladolid for all the ZEN-R52 available dataset (April 2019 to September 2021).
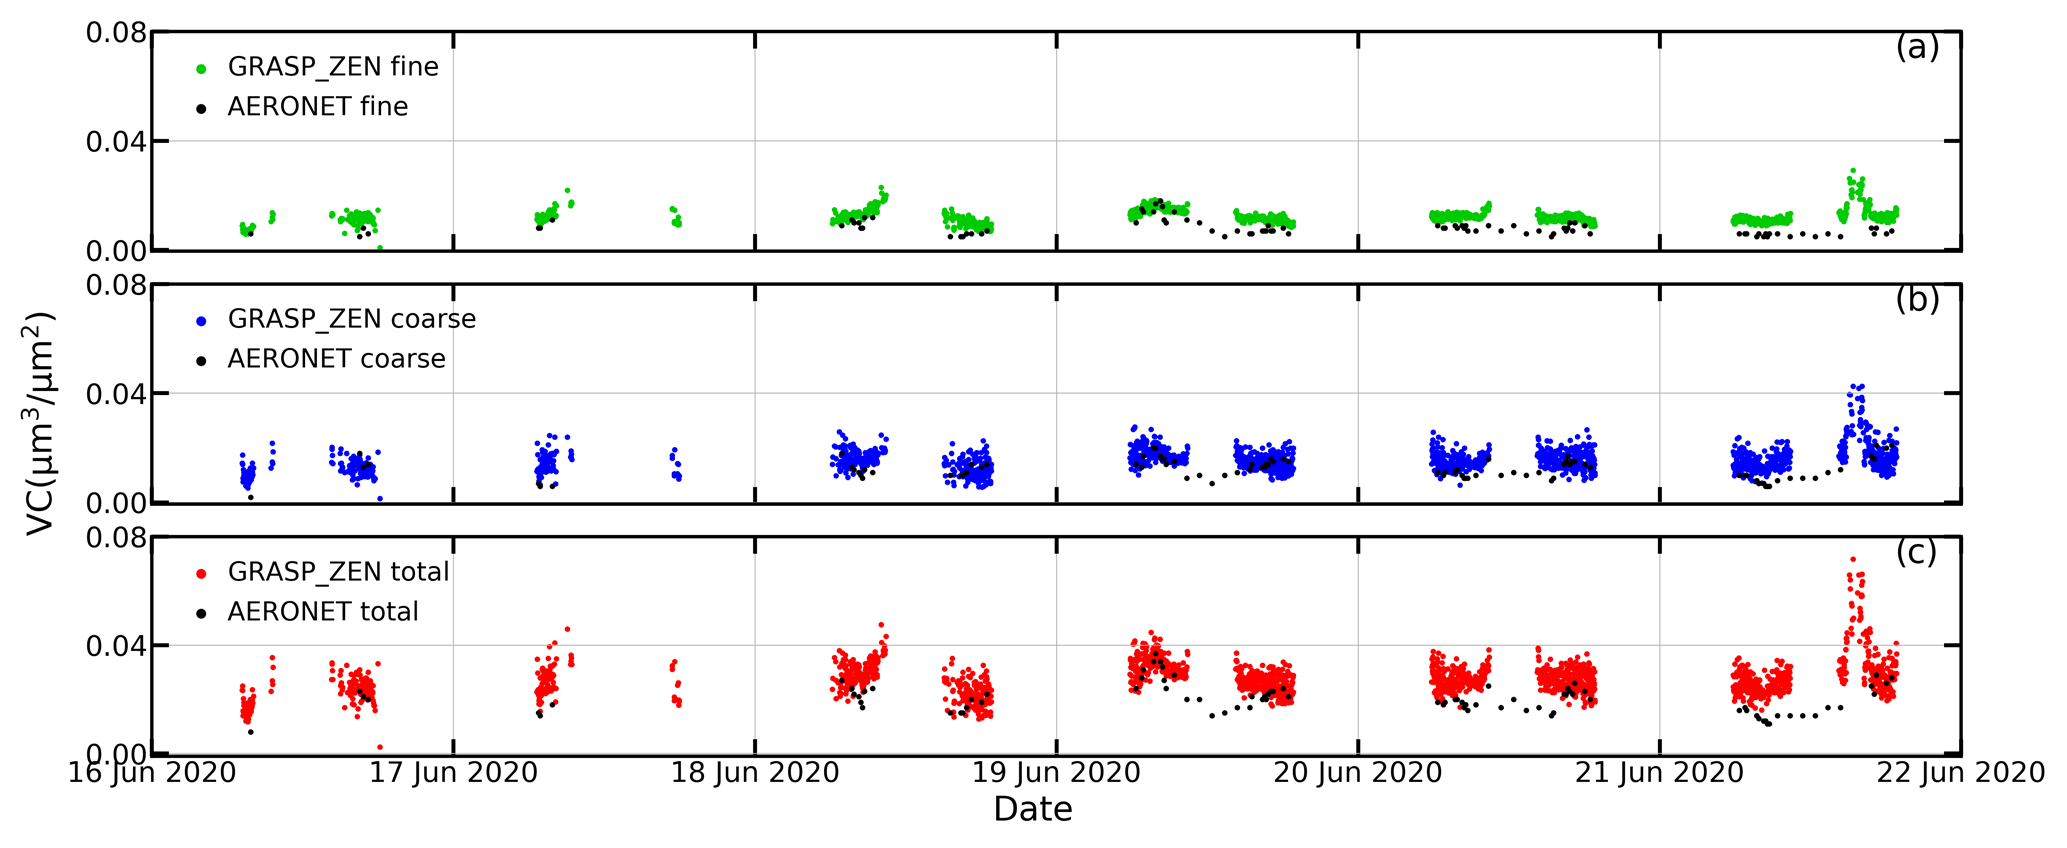
Figure 15Time series evolution of volume concentration for fine (VCF) and coarse (VCC) modes as well as the total (VCT) retrieved by GRASP-ZEN and by AERONET at Valladolid for a week period in summer 2020 (16 to 22 June).
The VCF, VCC and VCT values from both datasets are shown in Fig. 15 for the week from 16 to 22 June 2020 (same days than in Fig. 12), showing again a similar behaviour for the two datasets. Figure 15 also reveals that the GRASP-ZEN values are noisier and higher than the AERONET values, especially for the fine mode.
For a more quantitative analysis of the correlation between VCF, VCC and VCT from the GRASP-ZEN and AERONET datasets, a synchronization with a time window of ±5 min was done, obtaining a total of 4356 coincident points for each volume concentration. A higher temporal range is selected here because the inversion products are less frequent than AOD. In addition, we assume that these aerosol properties should not change significantly in 5 min.
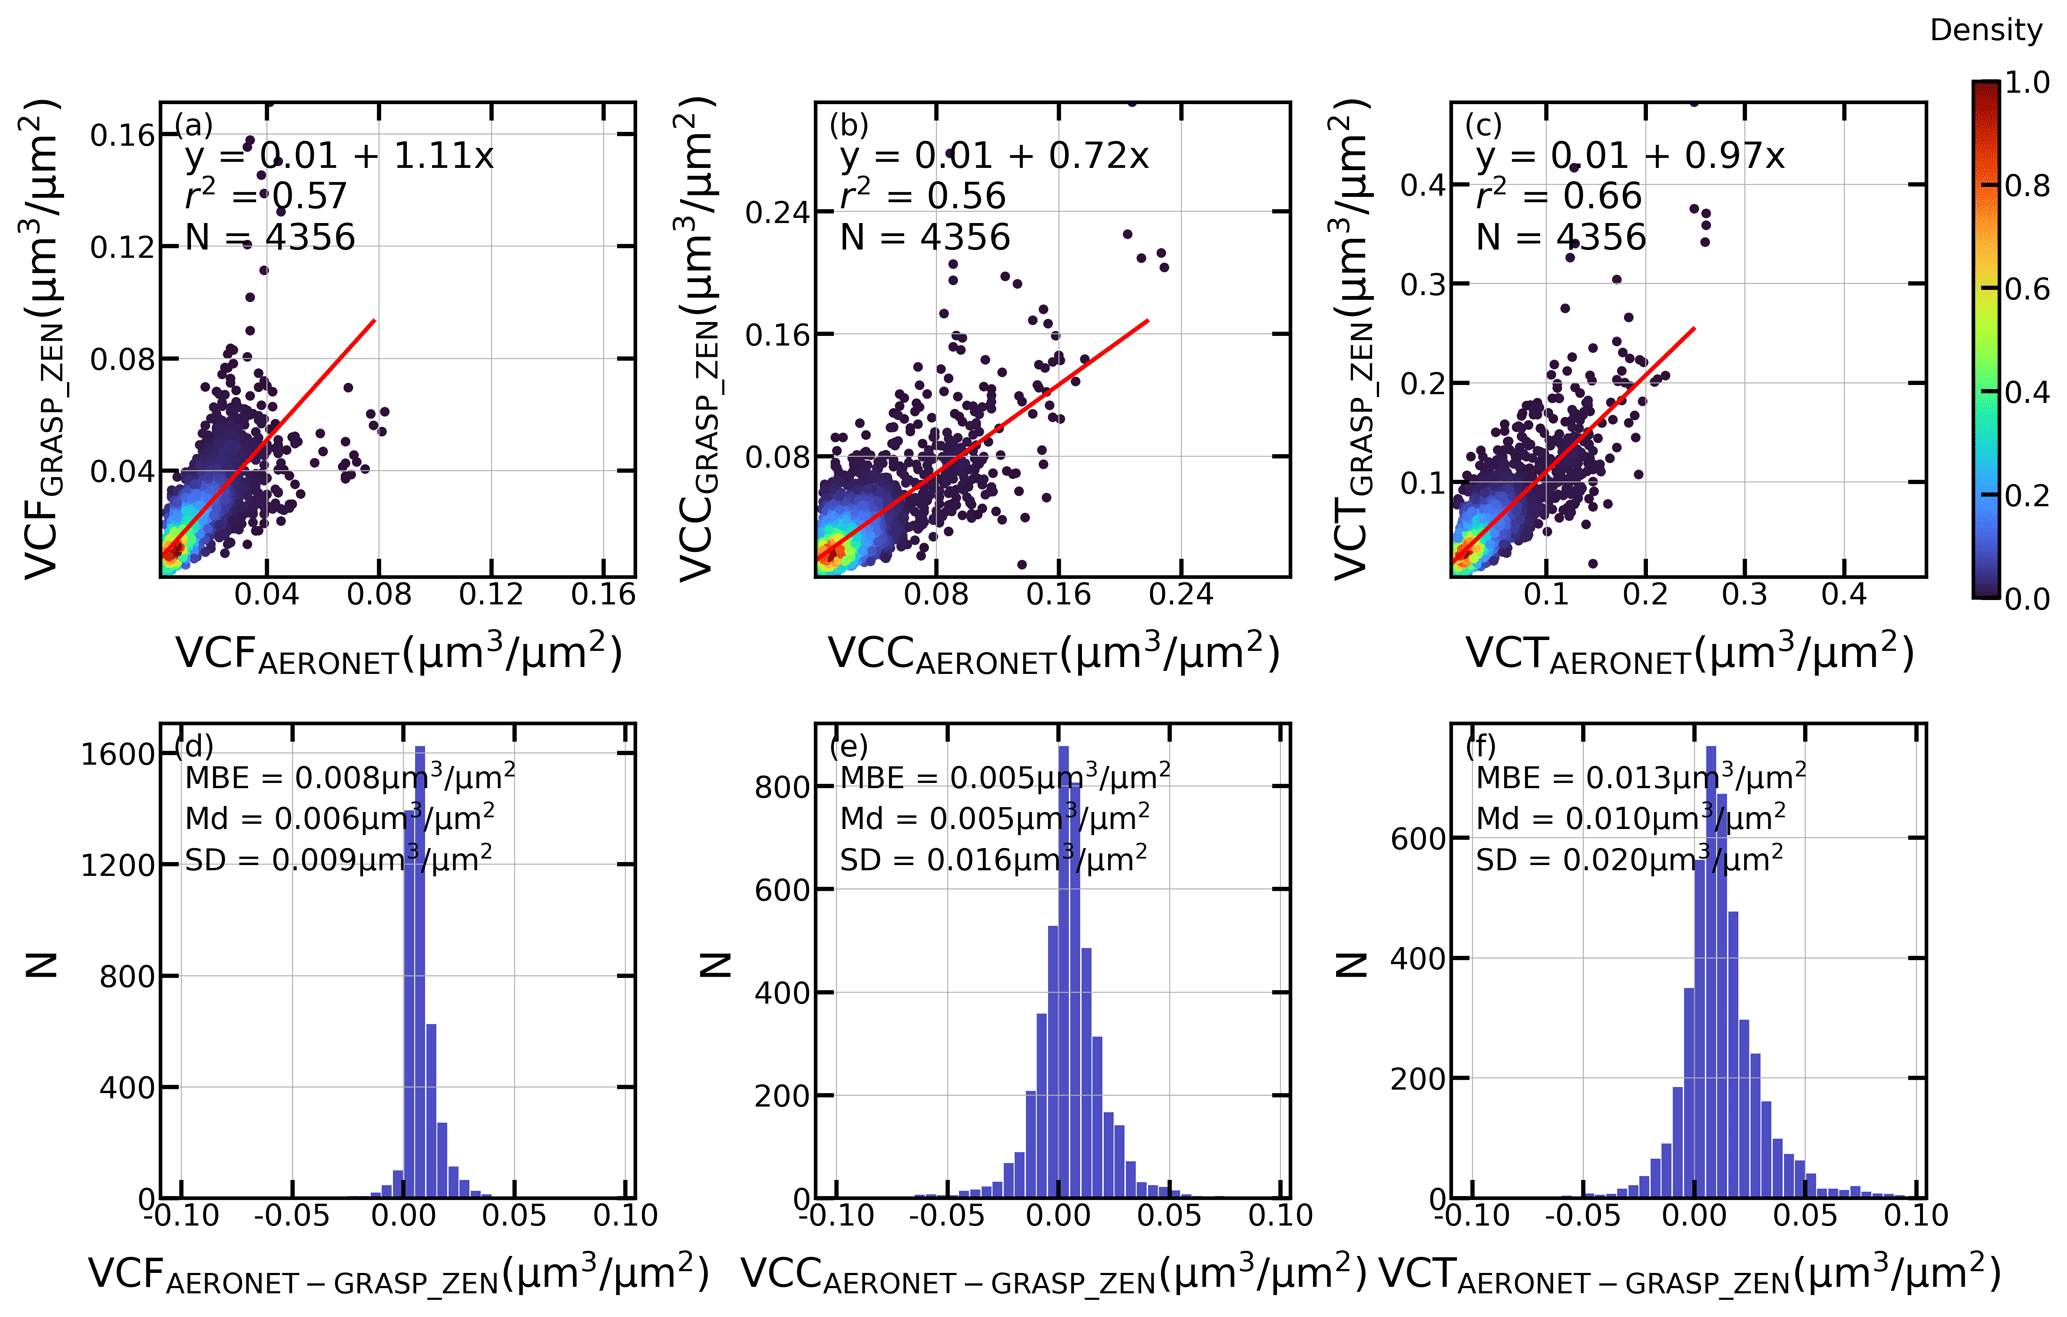
Figure 16(a–c) Density scatter plot of the volume concentration for fine (VCF) and coarse (VCC) modes and total (VCT) retrieved by GRASP-ZEN against coincident retrievals from AERONET. The Linear fit (red line), its equation, determination coefficient (r2) and number of data points (N) are shown. (d–f) Frequency histograms of the absolute differences between both datasets. The mean bias error (MBE), median (Md) and standard deviation (SD) are also shown.
The GRASP-ZEN volume concentrations are represented against the coincident AERONET ones in the density scatter plots of the upper panels of Fig. 16 for fine, coarse and total values. Bottom panels of Fig. 16 also show the frequency histograms of the differences between GRASP-ZEN and AERONET values of VCF, VCC and VCT. The best correlation is obtained for the total volume concentration, with an r2 of about 0.66, while for fine and coarse volume concentration the determination coefficients are 0.57 and 0.56, respectively. Despite the low correlation coefficients, the retrieved volume concentrations are rather precise, with median values of the differences between GRASP-ZEN and AERONET datasets of 0.006 and 0.005 µm3 µm−2 for fine and coarse modes, respectively, and 0.010 µm3 µm−2 for the VCT. The highest dispersion of the differences in volume concentrations is obtained for the VCT, which presents a SD value about 0.020 µm3 µm−2, while for fine and coarse modes these values are 0.009 and 0.016 µm3 µm−2, which are close to the uncertainty of AERONET products (0.01 µm3 µm−2). These results are again within the theoretical uncertainty obtained in the previous section.
All the results of this paper have been obtained using the GRASP-ZEN methodology based on the models approach, which is a suitable option for the current study due to the reduced number of radiometric observations provided by the ZEN-R52. However, the versatility of the GRASP code allows for different strategies for the retrieval of aerosol properties. In this sense, we have considered other strategies in this study to choose the one which provides the best results. These strategies are based on the temporal multi-pixel approach offered by GRASP (Lopatin et al., 2021), which constrains the variation of aerosol properties in time, forcing them to vary smoothly. The multi-pixel approach was firstly used in combination with the models approach. In order to avoid the problems derived by having fixed aerosol models with fixed aerosol properties, the temporal multi-pixel was also used by assuming the size distribution as a bimodal (fine and coarse modes) log-normal distribution and the refractive indices have no dependence on wavelength. None of these methods significantly improved the retrieval of aerosol properties, but they did reduce the computation time (the data of a full day are inverted all at the same time). Nevertheless, these strategies could be considered for future aerosol retrievals.
This paper has explored the capabilities to calibrate a ZEN-R52 radiometer using the GRASP (Generalized Retrieval of Atmosphere and Surface Properties) code and to retrieve aerosol properties from measured zenith sky radiance (ZSR) at four wavelengths. The ZSR values measured by the ZEN-R52 radiometer for solar zenith angle (SZA) values below 30∘ are contaminated by stray sunlight intromission and, hence, should not be used. For some latitudes this would result in the absence of measurements for a substantial amount of time; therefore, a technical improvement in the instrument to correct this issue is recommended to the manufacturers.
The proposed methodology for the calibration of the ZEN-R52, using simulated ZSR values, has been contrasted, showing discrepancies lower than 6 % with respect to the calibration coefficients obtained against an integrating sphere. This proposed methodology incorporates the advantage that it includes the normalization used by GRASP, so the need to use an extraterrestrial spectrum to normalize the data when using it as input to GRASP can be avoided.
A new inversion strategy, called GRASP-ZEN, has been proposed to retrieve aerosol properties with GRASP code using the ZSR values measured by the ZEN-R52. An analysis with synthetic data has concluded that ZSR measurements are useful to derive aerosol optical depth (AOD), since these measurements are sensitive to aerosol load and type for the ZEN-R52 channels, at least for AOD at 440 nm below 1 for . This sensitivity decreases when SZA increases due to the decrease in the intensity of the ZSR values. Two different tests with synthetic data have revealed that the GRASP-ZEN inversion strategy generally overestimates the AOD for all channels under real aerosol scenarios.
The GRASP-ZEN method has been applied to ZSR measurements recorded with a ZEN-R52 radiometer at Valladolid (Spain) for 2.5 years. A direct comparison of some retrieved aerosol properties against independent AERONET (AErosol RObotic NETwork) products has pointed out the accuracy and precision of the aerosol properties retrieved by GRASP-ZEN. The correlation between the AOD retrieved by GRASP-ZEN and AERONET is high, with determination coefficients (r2) of about 0.86, 0.85, 0.79 and 0.72 for 440, 500, 675 and 870 nm, respectively. The uncertainties for the retrieved AOD values are between ±0.02 and ±0.03 when considering the AERONET values as reference. AERONET offers uncertainties of about ±0.01 for wavelengths above 440 nm; therefore, the uncertainty achieved by the proposed method is higher than that offered by the reference value.
With respect other aerosol properties, the GRASP-ZEN retrieval is limited for the intensive properties, like complex refractive index and some size distribution parameters due to the use of the models approach of GRASP. Nevertheless, the retrieved volume concentrations, which are extensive properties, have been compared against the same independent AERONET products to quantify the relative accuracy and precision in these concentrations retrieved by GRASP-ZEN. The r2 values obtained by comparing the volume concentrations obtained with GRASP-ZEN with respect to the AERONET reference values show low values for the fine (0.57) and coarse (0.56) modes, while for the total volume concentration a higher value (0.66) has been obtained. Nevertheless, the median and standard deviation of the differences in volume concentration between GRASP-ZEN and AERONET are lower than 0.01 and 0.02 µm3 µm−2, respectively, for fine, coarse and total concentration. These results have indicated that GRASP-ZEN is capable of retrieving the aerosol volume concentrations with good accuracy and precision.
This paper shows the potential of a simple and robust radiometer like the ZEN-R52 as a possible alternative for aerosol property retrieval in remote areas or even in places with a co-located CE318 photometer in order to increase the time resolution. The proposed methodology would require a previous coincident period of measurements co-located with an AERONET CE318 photometer to achieve the calibration, and later it could be deployed in a remote site in order to broaden the aerosol monitoring network. This methodology also represents a major advance over the former ZEN-LUT proposed by Almansa et al. (2020) for aerosol property retrieval since it is not linked to the place of study. This paper also assesses the capability of GRASP to retrieve aerosol properties using only ZSR at 440, 500, 675 and 870 nm. The uncertainty and bias found in the retrieval show the limitations of the instrument and inversion strategy but also demonstrate that the ZEN-R52, together with the developed GRASP-ZEN strategy, can provide useful information about the AOD and aerosol volume concentration for total, fine and coarse modes.
GRASP code is freely available for download and installation at https://www.grasp-open.com/products/ (last access: 10 August 2023; Dubovik et al., 2021).
Data from AERONET is openly available at https://aeronet.gsfc.nasa.gov/ (last access: 10 August 2023; Giles et al., 2019). Data from the ZEN-R52 at Valladolid is continuously been sent to the GOA-UVa computer servers, therefore it is openly available by demand to the contact author.
The supplement related to this article is available online at: https://doi.org/10.5194/amt-16-4423-2023-supplement.
SHA and RR designed and developed the main concepts and ideas behind this work and wrote the paper with input from all authors. SHA conducted the data simulations and inversions with GRASP and did the analysis, including the calibration and sensitivity analysis, and was primarily responsible for the writing and coordination of the paper. SHA, RR, JCAS and MHG contributed with the development and proper operation of the designed GRASP-ZEN inversion strategy. AFA helped with the interpretation of the ZEN-R52 results and he provided independent measurements at Izaña Atmospheric Research Center. DM, CT and RG were responsible of maintenance and correct operation of the reference instruments used in this work; the CE318 sunphtometers from AERONET network. CHdB, DGF, VEC and ÁMdF mainly contributed to the interpretation of results and maintenance of the installation. All authors were involved in helpful discussions and made significant contributions to the manuscript.
The contact author has declared that none of the authors has any competing interests.
Publisher's note: Copernicus Publications remains neutral with regard to jurisdictional claims made in the text, published maps, institutional affiliations, or any other geographical representation in this paper. While Copernicus Publications makes every effort to include appropriate place names, the final responsibility lies with the authors.
This publication is part of the TED2021-131211B-I00 project funded by MCIN/AEI/10.13039/501100011033 and European Union “NextGenerationEU”/PRTR. This article is based on work from COST Action CA21119 HARMONIA, supported by COST (European Cooperation in Science and Technology) and has been supported by the European Metrology Program for Innovation and Research (EMPIR) within the joint research project EMPIR 19ENV04 MAPP. We especially thank the GOA-UVa staff members (Rogelio Carracedo, Patricia Martín-Sánchez and Javier Gatón) for helping with the research through the maintenance of the Instruments and the station infrastructure.
This research has been supported by the Ministerio de Ciencia e Innovación (grant no. PID2021-127588OBI00) and the Junta de Castilla y León (grant no. VA227P20).
This paper was edited by Otto Hasekamp and reviewed by Francisco Molero and three anonymous referees.
Almansa, A. F., Cuevas, E., Torres, B., Barreto, Á., García, R. D., Cachorro, V. E., de Frutos, Á. M., López, C., and Ramos, R.: A new zenith-looking narrow-band radiometer-based system (ZEN) for dust aerosol optical depth monitoring, Atmos. Meas. Tech., 10, 565–579, https://doi.org/10.5194/amt-10-565-2017, 2017.
Almansa, A. F., Cuevas, E., Barreto, Á., Torres, B., García, O. E., García, R. D., Velasco-Merino, C., Cachorro, V. E., Berjón, A., Mallorquín, M., López, C., Ramos, R., Guirado-Fuentes, C., Negrillo, R., and de Frutos, Á. M.: Column integrated water vapor and aerosol load characterization with the new ZEN-R52 radiometer, Remote Sens.-Basel, 12, 1424, https://doi.org/10.3390/rs12091424, 2020.
Ångström, A.: The parameters of atmospheric turbidity, Tellus, 16, 64–75, https://doi.org/10.1111/J.2153-3490.1964.TB00144.X, 1964.
Barker, H. W. and Marshak, A.: Inferring Optical Depth of Broken Clouds above Green Vegetation Using Surface Solar Radiometric Measurements, J. Atmos. Sci., 58, 2989–3006, https://doi.org/10.1175/1520-0469(2001)058<2989:IODOBC>2.0.CO;2, 2001.
Barreto, Á., Cuevas, E., Granados-Muñoz, M.-J., Alados-Arboledas, L., Romero, P. M., Gröbner, J., Kouremeti, N., Almansa, A. F., Stone, T., Toledano, C., Román, R., Sorokin, M., Holben, B., Canini, M., and Yela, M.: The new sun-sky-lunar Cimel CE318-T multiband photometer – a comprehensive performance evaluation, Atmos. Meas. Tech., 9, 631–654, https://doi.org/10.5194/amt-9-631-2016, 2016.
Barreto, A., Román, R., Cuevas, E., Pérez-Ramírez, D., Berjón, A. J., Kouremeti, N., Kazadzis, S., Gröbner, J., Mazzola, M., Toledano, C., Benavent-Oltra, J. A., Doppler, L., Juryšek, J., Almansa, A. F., Victori, S., Maupin, F., Guirado-Fuentes, C., González, R., Vitale, V., and Yela, M.: Evaluation of night-time aerosols measurements and lunar irradiance models in the frame of the first multi-instrument nocturnal intercomparison campaign, Atmos. Environ., 202, 190–211, https://doi.org/10.1016/j.atmosenv.2019.01.006, 2019.
Benavent-Oltra, J. A., Román, R., Granados-Muñoz, M. J., Pérez-Ramírez, D., Ortiz-Amezcua, P., Denjean, C., Lopatin, A., Lyamani, H., Torres, B., Guerrero-Rascado, J. L., Fuertes, D., Dubovik, O., Chaikovsky, A., Olmo, F. J., Mallet, M., and Alados-Arboledas, L.: Comparative assessment of GRASP algorithm for a dust event over Granada (Spain) during ChArMEx-ADRIMED 2013 campaign, Atmos. Meas. Tech., 10, 4439–4457, https://doi.org/10.5194/amt-10-4439-2017, 2017.
Benavent-Oltra, J. A., Román, R., Casquero-Vera, J. A., Pérez-Ramírez, D., Lyamani, H., Ortiz-Amezcua, P., Bedoya-Velásquez, A. E., de Arruda Moreira, G., Barreto, Á., Lopatin, A., Fuertes, D., Herrera, M., Torres, B., Dubovik, O., Guerrero-Rascado, J. L., Goloub, P., Olmo-Reyes, F. J., and Alados-Arboledas, L.: Different strategies to retrieve aerosol properties at night-time with the GRASP algorithm, Atmos. Chem. Phys., 19, 14149–14171, https://doi.org/10.5194/acp-19-14149-2019, 2019.
Bennouna, Y. S., Cachorro, V. E., Torres, B., Toledano, C., Berjón, A., de Frutos, A. M., and Alonso Fernández Coppel, I.: Atmospheric turbidity determined by the annual cycle of the aerosol optical depth over north-center Spain from ground (AERONET) and satellite (MODIS), Atmos. Environ., 67, 352–364, https://doi.org/10.1016/j.atmosenv.2012.10.065, 2013.
Boucher, O., Randall, D., Artaxo, P., Bretherton, C., Feingold, G., Forster, P., Kerminen, V., Kondo, Y., Liao, H., Lohmann, U., Rasch, P., Satheesh, S., Sherwood, S., Stevens, B., and Zhang, X.: Clouds and Aerosols, in: Climate Change 2013: The Physical Science Basis. Contribution of Working Group I to the Fifth Assessment Report of the Intergovernmental Panel on Climate Change, edited by: Stocker, T. F., Qin, D., Plattner, G.-K., Tignor, M., Allen, S. K., Boschung, J., Nauels, A., Xia, Y., Bex, V., and Midgley, P. M., Cambridge University Press, 571–657, https://doi.org/10.1017/CBO9781107415324.016, 2013.
Cachorro, V. E., Burgos, M. A., Mateos, D., Toledano, C., Bennouna, Y., Torres, B., de Frutos, Á. M., and Herguedas, Á.: Inventory of African desert dust events in the north-central Iberian Peninsula in 2003–2014 based on sun-photometer–AERONET and particulate-mass–EMEP data, Atmos. Chem. Phys., 16, 8227–8248, https://doi.org/10.5194/acp-16-8227-2016, 2016.
Chen, C., Dubovik, O., Fuertes, D., Litvinov, P., Lapyonok, T., Lopatin, A., Ducos, F., Derimian, Y., Herman, M., Tanré, D., Remer, L. A., Lyapustin, A., Sayer, A. M., Levy, R. C., Hsu, N. C., Descloitres, J., Li, L., Torres, B., Karol, Y., Herrera, M., Herreras, M., Aspetsberger, M., Wanzenboeck, M., Bindreiter, L., Marth, D., Hangler, A., and Federspiel, C.: Validation of GRASP algorithm product from POLDER/PARASOL data and assessment of multi-angular polarimetry potential for aerosol monitoring, Earth Syst. Sci. Data, 12, 3573–3620, https://doi.org/10.5194/essd-12-3573-2020, 2020.
Chiu, C. J., Huang, C.-H., Marshak, A., Slutsker, I., Giles, D. M., Holben, B. N., Knyazikhin, Y., Wiscombe, W. J., Huang, C., Marshak, A., Slutsker, I., Giles, D. M., Holben, B. N., Knyazikhin, Y., and Wiscombe, W. J.: Cloud optical depth retrievals from the Aerosol Robotic Network (AERONET) cloud mode observations, J. Geophys. Res.-Atmos., 115, 14202, https://doi.org/10.1029/2009JD013121, 2010.
Dubovik, O. and King, M. D.: A flexible inversion algorithm for retrieval of aerosol optical properties from Sun and sky radiance measurements, J. Geophys. Res.-Atmos., 105, 20673–20696, https://doi.org/10.1029/2000JD900282, 2000.
Dubovik, O., Lapyonok, T., Litvinov, P., Herman, M., Fuertes, D., Ducos, F., Torres, B., Derimian, Y., Huang, X., Lopatin, A., Chaikovsky, A., Aspetsberger, M., and Federspiel, C.: GRASP: a versatile algorithm for characterizing the atmosphere, SPIE Newsroom, https://doi.org/10.1117/2.1201408.005558, 2014.
Dubovik, O., Fuertes, D., Litvinov, P., Lopatin, A., Lapyonok, T., Doubovik, I., Xu, F., Ducos, F., Chen, C., Torres, B., Derimian, Y., Li, L., Herreras-Giralda, M., Herrera, M., Karol, Y., Matar, C., Schuster, G. L., Espinosa, R., Puthukkudy, A., and Federspiel, C.: A Comprehensive Description of Multi-Term LSM for Applying Multiple a Priori Constraints in Problems of Atmospheric Remote Sensing: GRASP Algorithm, Concept, and Applications, Frontiers in Remote Sensing, 2, 23, https://doi.org/10.3389/frsen.2021.706851, 2021 (code available at: https://www.grasp-open.com/products/, last access: 10 August 2023).
Eilers, P. H. C. and Goeman, J. J.: Enhancing scatterplots with smoothed densities, Bioinformatics, 20, 623–628, https://doi.org/10.1093/bioinformatics/btg454, 2004.
Espinosa, W. R., Remer, L. A., Dubovik, O., Ziemba, L., Beyersdorf, A., Orozco, D., Schuster, G., Lapyonok, T., Fuertes, D., and Martins, J. V.: Retrievals of aerosol optical and microphysical properties from Imaging Polar Nephelometer scattering measurements, Atmos. Meas. Tech., 10, 811–824, https://doi.org/10.5194/amt-10-811-2017, 2017.
Forster, P., Storelvmo, T., Armour, K., Collins, W., Dufresne, J. L., Frame, D., Lunt, D. J., Mauritsen, T., Palmer, M. D., Watanabe, M., Wild, M., and Zhang, H.: The Earth's Energy Budget, Climate Feedbacks, and Climate Sensitivity, in: Climate Change 2021: The Physical Science Basis. Contribution of Working Group I to the Sixth Assessment Report of the Intergovernmental Panel on Climate Change, edited by: Masson-Delmotte, V., Zhai, P., Pirani, A., Connors, S. L., Péan, C., Berger, S., Caud, N., Chen, Y., Goldfarb, L., Gomis, M. I., Huang, M., Leitzell, K., Lonnoy, E., Matthews, J. B. R., Maycock, T. K., Waterfield, T., Yelekçi, O., Yu, R., and Zhou, B., Cambridge University Press, Cambridge, United Kingdom and New York, NY, USA, 923–1054, https://doi.org/10.1017/9781009157896.009, 2021.
Fuertes, D., Toledano, C., González, R., Berjón, A., Torres, B., Cachorro, V. E., and de Frutos, Á. M.: CÆLIS: software for assimilation, management and processing data of an atmospheric measurement network, Geosci. Instrum. Method. Data Syst., 7, 67–81, https://doi.org/10.5194/gi-7-67-2018, 2018.
Giles, D. M., Sinyuk, A., Sorokin, M. G., Schafer, J. S., Smirnov, A., Slutsker, I., Eck, T. F., Holben, B. N., Lewis, J. R., Campbell, J. R., Welton, E. J., Korkin, S. V., and Lyapustin, A. I.: Advancements in the Aerosol Robotic Network (AERONET) Version 3 database – automated near-real-time quality control algorithm with improved cloud screening for Sun photometer aerosol optical depth (AOD) measurements, Atmos. Meas. Tech., 12, 169–209, https://doi.org/10.5194/amt-12-169-2019, 2019 (data available at: https://aeronet.gsfc.nasa.gov/, last access: 10 August 2023).
González, R., Toledano, C., Román, R., Fuertes, D., Berjón, A., Mateos, D., Guirado-Fuentes, C., Velasco-Merino, C., Antuña-Sánchez, J. C., Calle, A., Cachorro, V. E., and de Frutos, Á. M.: Daytime and nighttime aerosol optical depth implementation in CÆLIS, Geosci. Instrum. Method. Data Syst., 9, 417–433, https://doi.org/10.5194/gi-9-417-2020, 2020.
Herreras, M., Román, R., Cazorla, A., Toledano, C., Lyamani, H., Torres, B., Cachorro, V. E., Olmo, F. J., Alados-Arboledas, L., and de Frutos, A. M.: Evaluation of retrieved aerosol extinction profiles using as reference the aerosol optical depth differences between various heights, Atmos. Res., 230, 104625, https://doi.org/10.1016/j.atmosres.2019.104625, 2019.
Herreras-Giralda, M., Litvinov, P., Dubovik, O., Derimian, Y., Lapyonok, T., Fuertes, D., Sourdeval, O., Preusker, R., and Fischer, J.: Thermal emission in the successive orders of scattering (SOS) radiative transfer approach, J. Quant. Spectrosc. Ra., 291, 108327, https://doi.org/10.1016/j.jqsrt.2022.108327, 2022.
Holben, B. N., Eck, T. F., Slutsker, I., Tanré, D., Buis, J. P., Setzer, A., Vermote, E., Reagan, J. A., Kaufman, Y. J., Nakajima, T., Lavenu, F., Jankowiak, I., and Smirnov, A.: AERONET – A Federated Instrument Network and Data Archive for Aerosol Characterization, Remote Sens. Environ., 66, 1–16, https://doi.org/10.1016/S0034-4257(98)00031-5, 1998.
Lenoble, J., Herman, M., Deuzé, J. L., Lafrance, B., Santer, R., and Tanré, D.: A successive order of scattering code for solving the vector equation of transfer in the earth's atmosphere with aerosols, J. Quant. Spectrosc. Ra., 107, 479–507, https://doi.org/10.1016/j.jqsrt.2007.03.010, 2007.
Lopatin, A., Dubovik, O., Chaikovsky, A., Goloub, P., Lapyonok, T., Tanré, D., and Litvinov, P.: Enhancement of aerosol characterization using synergy of lidar and sun-photometer coincident observations: the GARRLiC algorithm, Atmos. Meas. Tech., 6, 2065–2088, https://doi.org/10.5194/amt-6-2065-2013, 2013.
Lopatin, A., Dubovik, O., Fuertes, D., Stenchikov, G., Lapyonok, T., Veselovskii, I., Wienhold, F. G., Shevchenko, I., Hu, Q., and Parajuli, S.: Synergy processing of diverse ground-based remote sensing and in situ data using the GRASP algorithm: applications to radiometer, lidar and radiosonde observations, Atmos. Meas. Tech., 14, 2575–2614, https://doi.org/10.5194/amt-14-2575-2021, 2021.
Marshak, A., Knyazikhin, Y., Davis, A. B., Wiscombe, W. J., and Pilewskie, P.: Cloud-vegetation interaction: Use of normalized difference cloud index for estimation of cloud optical thickness, Geophys. Res. Lett., 27, 1695–1698, https://doi.org/10.1029/1999GL010993, 2000.
Mateos, D., Cachorro, V. E., Velasco-Merino, C., O'Neill, N. T., Burgos, M. A., Gonzalez, R., Toledano, C., Herreras, M., Calle, A., and de Frutos, A. M.: Comparison of three different methodologies for the identification of high atmospheric turbidity episodes, Atmos. Res., 237, 104835, https://doi.org/10.1016/j.atmosres.2019.104835, 2020.
Molero, F., Pujadas, M., and Artíñano, B.: Study of the Effect of Aerosol Vertical Profile on Microphysical Properties Using GRASP Code with Sun/Sky Photometer and Multiwavelength Lidar Measurements, Remote Sens.-Basel, 12, 4072, https://doi.org/10.3390/RS12244072, 2020.
Myhre, G., Shindell, D., Bréon, F., Collins, W., Fuglestvedt, J., Huang, J., Koch, D., Lamarque, J., Lee, D., Mendoza, B., Nakajima, T., Robock, A., Stephens, G., Takemura, T., and Zhang, H.: Anthropogenic and Natural Radiative Forcing, in: Climate Change 2013: The Physical Science Basis. Contribution of Working Group I, edited by: Stocker, T. F., Qin, D., Plattner, G.-K., Tignor, M., Allen, S. K., Boschung, J., Nauels, A., Xia, Y., Bex, V., and Midgley, P. M., Cambridge University Press, 659–740, https://doi.org/10.1017/CBO9781107415324.018, 2013.
Nakajima, T., Tonna, G., Rao, R., Boi, P., Kaufman, Y., and Holben, B.: Use of sky brightness measurements from ground for remote sensing of particulate polydispersions, Appl. Optics, 35, 2672–2686, https://doi.org/10.1364/ao.35.002672, 1996.
Román, R., Bilbao, J., and de Miguel, A.: Reconstruction of six decades of daily total solar shortwave irradiation in the Iberian Peninsula using sunshine duration records, Atmos. Environ., 99, 41–50, https://doi.org/10.1016/j.atmosenv.2014.09.052, 2014.
Román, R., Torres, B., Fuertes, D., Cachorro, V. E., Dubovik, O., Toledano, C., Cazorla, A., Barreto, A., Bosch, J. L., Lapyonok, T., González, R., Goloub, P., Perrone, M. R., Olmo, F. J., de Frutos, A., and Alados-Arboledas, L.: Remote sensing of lunar aureole with a sky camera: Adding information in the nocturnal retrieval of aerosol properties with GRASP code, Remote Sens. Environ., 196, 238–252, https://doi.org/10.1016/j.rse.2017.05.013, 2017.
Román, R., Benavent-Oltra, J. A., Casquero-Vera, J. A., Lopatin, A., Cazorla, A., Lyamani, H., Denjean, C., Fuertes, D., Pérez-Ramírez, D., Torres, B., Toledano, C., Dubovik, O., Cachorro, V. E., de Frutos, A. M., Olmo, F. J., and Alados-Arboledas, L.: Retrieval of aerosol profiles combining sunphotometer and ceilometer measurements in GRASP code, Atmos. Res., 204, 161–177, https://doi.org/10.1016/j.atmosres.2018.01.021, 2018.
Román, R., González, R., Toledano, C., Barreto, Á., Pérez-Ramírez, D., Benavent-Oltra, J. A., Olmo, F. J., Cachorro, V. E., Alados-Arboledas, L., and de Frutos, Á. M.: Correction of a lunar-irradiance model for aerosol optical depth retrieval and comparison with a star photometer, Atmos. Meas. Tech., 13, 6293–6310, https://doi.org/10.5194/amt-13-6293-2020, 2020.
Román, R., Antuña-Sánchez, J. C., Cachorro, V. E., Toledano, C., Torres, B., Mateos, D., Fuertes, D., López, C., González, R., Lapionok, T., Herreras-Giralda, M., Dubovik, O., and de Frutos, Á. M.: Retrieval of aerosol properties using relative radiance measurements from an all-sky camera, Atmos. Meas. Tech., 15, 407–433, https://doi.org/10.5194/amt-15-407-2022, 2022.
Schaaf, C., Liu, J., Gao, F., and Strahler, A. H.: MODIS albedo and reflectance anisotropy products from Aqua and Terra, in: Land Remote Sensing and Global Environmental Change: NASA's Earth Observing System and the Science of ASTER and MODIS, Springer, vol. 11, 549–561, https://doi.org/10.1007/978-1-4419-6749-7_24, 2011.
Sinyuk, A., Holben, B. N., Eck, T. F., Giles, D. M., Slutsker, I., Korkin, S., Schafer, J. S., Smirnov, A., Sorokin, M., and Lyapustin, A.: The AERONET Version 3 aerosol retrieval algorithm, associated uncertainties and comparisons to Version 2, Atmos. Meas. Tech., 13, 3375–3411, https://doi.org/10.5194/amt-13-3375-2020, 2020.
Titos, G., Ealo, M., Román, R., Cazorla, A., Sola, Y., Dubovik, O., Alastuey, A., and Pandolfi, M.: Retrieval of aerosol properties from ceilometer and photometer measurements: long-term evaluation with in situ data and statistical analysis at Montsec (southern Pyrenees), Atmos. Meas. Tech., 12, 3255–3267, https://doi.org/10.5194/amt-12-3255-2019, 2019.
Torres, B., Dubovik, O., Fuertes, D., Schuster, G., Cachorro, V. E., Lapyonok, T., Goloub, P., Blarel, L., Barreto, A., Mallet, M., Toledano, C., and Tanré, D.: Advanced characterisation of aerosol size properties from measurements of spectral optical depth using the GRASP algorithm, Atmos. Meas. Tech., 10, 3743–3781, https://doi.org/10.5194/amt-10-3743-2017, 2017.
Tsekeri, A., Lopatin, A., Amiridis, V., Marinou, E., Igloffstein, J., Siomos, N., Solomos, S., Kokkalis, P., Engelmann, R., Baars, H., Gratsea, M., Raptis, P. I., Binietoglou, I., Mihalopoulos, N., Kalivitis, N., Kouvarakis, G., Bartsotas, N., Kallos, G., Basart, S., Schuettemeyer, D., Wandinger, U., Ansmann, A., Chaikovsky, A. P., and Dubovik, O.: GARRLiC and LIRIC: strengths and limitations for the characterization of dust and marine particles along with their mixtures, Atmos. Meas. Tech., 10, 4995–5016, https://doi.org/10.5194/amt-10-4995-2017, 2017.
Walker, J. H., Cromer, C. L., and McLean, J. T.: Calibration of passive remote observing optical and microwave instrumentation, Proc. SPIE, 1493, 224–230, 1991.
Wei, Y., Li, Z., Zhang, Y., Chen, C., Xie, Y., Lv, Y., and Dubovik, O.: Derivation of PM10 mass concentration from advanced satellite retrieval products based on a semi-empirical physical approach, Remote Sens. Environ., 256, 112319, https://doi.org/10.1016/j.rse.2021.112319, 2021.