the Creative Commons Attribution 4.0 License.
the Creative Commons Attribution 4.0 License.
 | 11 May 2022
Design, characterization, and first field deployment of a novel aircraft-based aerosol mass spectrometer combining the laser ablation and flash vaporization techniques
Andreas Hünig
Oliver Appel
Antonis Dragoneas
Sergej Molleker
Hans-Christian Clemen
Frank Helleis
Thomas Klimach
Franziska Köllner
Thomas Böttger
Frank Drewnick
Johannes Schneider
Stephan Borrmann
In this paper, we present the design, development, and characteristics of the novel aerosol mass spectrometer ERICA (ERC Instrument for Chemical composition of Aerosols; ERC – European Research Council) and selected results from the first airborne field deployment. The instrument combines two well-established methods of real-time in situ measurements of fine particle chemical composition. The first method is the laser desorption and ionization technique, or laser ablation technique, for single-particle mass spectrometry (here with a frequency-quadrupled Nd:YAG laser at λ = 266 nm). The second method is a combination of thermal particle desorption, also called flash vaporization, and electron impact ionization (like the Aerodyne aerosol mass spectrometer). The same aerosol sample flow is analyzed using both methods simultaneously, each using time-of-flight mass spectrometry. By means of the laser ablation, single particles are qualitatively analyzed (including the refractory components), while the flash vaporization and electron impact ionization technique provides quantitative information on the non-refractory components (i.e., particulate sulfate, nitrate, ammonia, organics, and chloride) of small particle ensembles. These techniques are implemented in two consecutive instrument stages within a common sample inlet and a common vacuum chamber. At its front end, the sample air containing the aerosol particles is continuously injected via an aerodynamic lens. All particles which are not ablated by the Nd:YAG laser in the first instrument stage continue their flight until they reach the second instrument stage and impact on the vaporizer surface (operated at 600 ∘C). The ERICA is capable of detecting single particles with vacuum aerodynamic diameters (dva) between ∼ 180 and 3170 nm (d50 cutoff). The chemical characterization of single particles is achieved by recording cations and anions with a bipolar time-of-flight mass spectrometer. For the measurement of non-refractory components, the particle size range extends from approximately 120 to 3500 nm (d50 cutoff; dva), and the cations are detected with a time-of-flight mass spectrometer. The compact dimensions of the instrument are such that the ERICA can be deployed on aircraft, at ground stations, or in mobile laboratories. To characterize the focused detection lasers, the ablation laser, and the particle beam, comprehensive laboratory experiments were conducted. During its first deployments the instrument was fully automated and operated during 11 research flights on the Russian high-altitude research aircraft M-55 Geophysica from ground pressure and temperature to 20 km altitude at 55 hPa and ambient temperatures as low as −86 ∘C. In this paper, we show that the ERICA is capable of measuring reliably under such conditions.
- Article
(4978 KB) - Companion paper
-
Supplement
(2416 KB) - BibTeX
- EndNote


Beyond the experimental determination of physical aerosol properties, detailed measurements of the chemical composition of aerosol particles are essential for studies in the context of urban pollution, health effects, cloud formation, radiative transfer in the atmosphere, and climate change (Fuzzi et al., 2015). Chemical composition measurements can provide information on the aerosol source – natural or anthropogenic – and on the state of chemical and physical processing of the particles while aging during transport (IPCC, 2013; Seinfeld and Pandis, 2016).
Besides offline methods, which involve particle collection on suitable substrates by impactors or filter samplers followed by subsequent laboratory analyses (Elmes and Gasparon, 2017), in situ real-time measurements adopting aerosol particle mass spectrometry have become a widespread, established tool. For the implementation of aerosol mass spectrometry, two complementary measurement techniques are commonly used. The first method uses a pulsed laser to vaporize and ionize individual submicron- to micrometer-sized particles by laser desorption and ionization (LDI; Suess and Prather, 1999) for single-particle mass spectrometry (SPMS). The resulting ions are extracted into a time-of-flight mass spectrometer. In terms of the deliverables, with this method single-particle mass spectra of both refractory and non-refractory components of soot, salt, mineral dust, and meteoric dust particles, as well as metal-containing particles, can be detected. The second method is based on thermal desorption and electron impact ionization (TD-EI), which allows quantitative measurement of non-refractory species (sulfate, nitrate, ammonium, chloride, and organic compounds) in ensembles of particles (Drewnick et al., 2005). While the latter method provides quantitative mass concentrations of non-refractory components, the mass spectrometer signals of the LDI method can only be used for the identification of the ions themselves and not for determination of absolute mass concentrations. Within certain limitations this may become possible if the data of other instruments are included in the analysis (e.g., Ault et al., 2009; Healy et al., 2012; Gunsch et al., 2018; Köllner et al., 2021). Details on the methodologies, limitations, and considerations of the inherent experimental errors of these measuring techniques can be found in Kulkarni et al. (2011) and the references therein.
For single-particle analysis by the LDI method, a time-of-flight mass spectrometer (TOFMS) is a suitable choice because in this way a full bipolar mass spectrum of a single particle can be recorded (Hinz et al., 1996). The trigger signal for firing the laser pulse that causes the ionization of the particle can be used as the trigger of the TOFMS. Thereby, the ions are separated from neutral molecules in less than a microsecond, preventing further reactions between ions and molecules as for example in an ion trap mass spectrometer (Fachinger et al., 2017). For the TD-EI technique (Aerodyne aerosol mass spectrometer – AMS), a quadrupole mass spectrometer was used in the beginning (Jayne et al., 2000) until it was replaced by a TOFMS (Drewnick et al., 2005; DeCarlo et al., 2006). The advantages of the TOFMS are a higher resolution, higher sensitivity, and thereby lower detection limits compared to the quadrupole technique (DeCarlo et al., 2006). Additionally, the TOFMS also makes it possible to perform single-particle analysis using the thermal desorption technique, provided there is an optical triggering of the detected particles (Cross et al., 2009; Freutel et al., 2013). Furthermore, TOFMSs are compact and rugged.
Compact and mobile online instruments based on the LDI or the TD-EI method have been deployed on research aircraft to measure particle chemical composition at high temporal and spatial resolutions. PALMS (Particle Analysis by Laser Mass Spectrometry; Murphy et al., 1998) has been operated at altitudes of up to 20 km. Other aircraft-based, online single-particle laser ablation aerosol mass spectrometers, which are operated at lower altitudes, include the A-ATOFMS (aircraft aerosol time-of-flight mass spectrometer; Pratt et al., 2009), the ALABAMA (Aircraft-based Laser ABlation Aerosol MAss spectrometer; Brands et al., 2011; Clemen et al., 2020), and miniSPLAT (miniaturized version of the Single Particle Laser Ablation Time-of-flight Mass Spectrometer; Zelenyuk et al., 2015). Instruments utilizing the TD-EI technique have been deployed on research aircraft using a C-ToF-MS (compact time-of-flight mass spectrometer from Tofwerk AG, Switzerland), e.g., by Bahreini et al. (2009), Morgan et al. (2010), Schmale et al. (2010), Brito et al. (2018), Schulz et al. (2018), and Haslett et al. (2019), while a mAMS (mini aerosol mass spectrometer) was used for example by Vu et al. (2016) and Goetz et al. (2018). An HR-ToF-MS (high-resolution time-of-flight mass spectrometer) was adapted for aircraft use, for example, by Dunlea et al. (2007) and Willis et al. (2016). However, as these references show, for aircraft-borne measurements of aerosol chemical composition usually only one of the two mass spectrometry methods is implemented on a single aircraft mostly as a consequence of limitations in weight and space. Although several aerosol instruments can be operated simultaneously at one location during ground-based measurements or in a laboratory environment (e.g., Möhler et al., 2008; Dall'Osto et al., 2012; Roth et al., 2016), up to now two different aerosol mass spectrometers have rarely been available on the same aircraft (e.g., Murphy et al., 2006a; Toon et al., 2016; Froyd et al., 2019; Schneider et al., 2019; Hodzic et al., 2020; Guo et al., 2021; Köllner et al., 2021). Since the two techniques deliver complementary information on the aerosol composition and also cover slightly different size ranges, a single instrument implementing both methodologies in one apparatus has obvious advantages, provided that it is sufficiently small and light. The temporal resolution of the ablation laser (for other reasons see Sect. 2.3) limits the number of particles detected (e.g., Su et al., 2004). The addition of a TD-EI unit largely enhances the data yield for the particle analysis by complementary information. Furthermore, the opportunities for measurements at high altitudes are rare, so an aerosol instrument which provides a high information output is advantageous.
The subject of this paper is the ERICA (ERC Instrument for Chemical composition of Aerosols; ERC – European Research Council), which has been developed in our laboratories at the Johannes Gutenberg University and the Max Planck Institute for Chemistry in Mainz. It is a hybrid instrument implementing both of the aforementioned particle desorption and ionization methods in one single fully automated apparatus. The adopted techniques for automating the operation (including pressure and temperature control), details on the electronic hardware, the mechanical adaption, the inlet system, the electrical distribution, and the remote control, are detailed in a separate paper by Dragoneas et al. (2022).
The ERICA was deployed for the first time during the aircraft field campaigns of the StratoClim project (Stratospheric and upper tropospheric processes for better climate predictions; Brunamonti et al., 2018; Bucci et al., 2020) in August and September 2016 at the Kalamata International Airport (KLX; 37.07∘ N, 22.03∘ E; Kalamata, Greece) and during July and August 2017 at the Tribhuvan International Airport (KTM; 27.70∘ N, 85.36∘ E; Kathmandu, Nepal). Although the instrument was initially designed for implementation on the Russian high-altitude research aircraft M-55 Geophysica (Borrmann et al., 1995; Stefanutti et al., 1999) and operation in the low particle number density environment of the upper troposphere and lower stratosphere (up to 20 km altitude), the ERICA can be integrated into suitable racks to be implemented onto other research aircraft such as NASA's DC-8 (Schneider et al., 2021), DLR's HALO (Deutsches Zentrum für Luft- und Raumfahrt (DLR), High Altitude and LOng Range Research Aircraft (HALO); https://halo-research.de/, last access: 28 March 2022), or the NSF–NCAR HIAPER (National Science Foundation (NSF), National Center for Atmospheric Research (NCAR), High-Performance Instrumented Airborne Platform for Environmental Research (HIAPER); Laursen et al., 2006). Furthermore, the ERICA can be used for a variety of ground-based stationary or mobile applications. In this paper we show the design of the ERICA and results from laboratory characterization measurements, as well as results selected for a proof-of-concept demonstration from the field campaign in Kathmandu, Nepal. The instrumental design and characterization are presented here in some detail (in particular in the Supplement) in order to support potential design efforts of other groups and to provide benchmark tests and values.
Since the two instrument components share a single vacuum system, weight is saved due to common components like pumps, power supply units, and the vacuum chamber. Furthermore, the mechanical components of the ERICA are designed to operate under the demanding conditions like thermal stress and vibrations aboard an aircraft. The final design of the compact instrument was implemented in an aircraft rack (Dragoneas et al., 2022) of 60 cm × 74 cm × 140 cm (height × width × length) with a total weight of 200 kg. In addition, field deployments with research aircraft at high altitudes are rare, so as much information as possible – with as many instruments as possible – should be collected. Thus, a compact design is crucial for implementation on such aircraft, and therefore a combination of two measurement methods into one apparatus is a major advantage. To visualize the orientation of the major components, a three-dimensional drawing of the instrument body as well as a photograph of the instrument mounted in the M-55 Geophysica rack for the StratoClim campaign is provided in Sect. S1.1 in the Supplement.
2.1 General principle and design of the ERICA
The principal configuration of the ERICA with its inlet system, the LDI section (denominated ERICA-LAMS), and the TD-EI section (denominated ERICA-AMS) is shown in Fig. 1 and is described in the following. During aircraft operation, the sample airflow is provided by a constant-pressure inlet (CPI; Molleker et al., 2020) serving as a critical orifice at the instrument's front end (see Sect. 2.2). The particles are focused in the aerodynamic lens (ADL) into a narrow beam and accelerated into the vacuum chamber, where they first reach the optical particle detection units (PDU1 and PDU2 in Fig. 1) of the ERICA-LAMS. Here, optical particle detection and sizing are realized via a particle flight time measurement by means of light scattering. For this purpose, two parallel continuous-wave laser beams (Gaussian beam shape) are directed onto the particle beam. The light scattered from the passing individual particles is focused by ellipsoidal reflectors onto photomultiplier tubes (PMTs). The time elapsing between the two light-scattering signals is used to derive the particles' vacuum aerodynamic diameter dva (for a definition see Jimenez et al., 2003b, a; DeCarlo et al., 2004) by involving a calibration (Brands et al., 2011). This time is also used to determine the point in time the particle reaches the ablation spot of the ERICA-LAMS. If well positioned and timed, the particle is desorbed and ionized during the LDI process by a triggered 266 nm UV pulse (Gaussian beam shape) from a frequency-quadrupled Nd:YAG laser. The resulting cations and anions are extracted into a bipolar time-of-flight mass spectrometer (B-ToF-MS) and detected by micro-channel plates (MCPs).
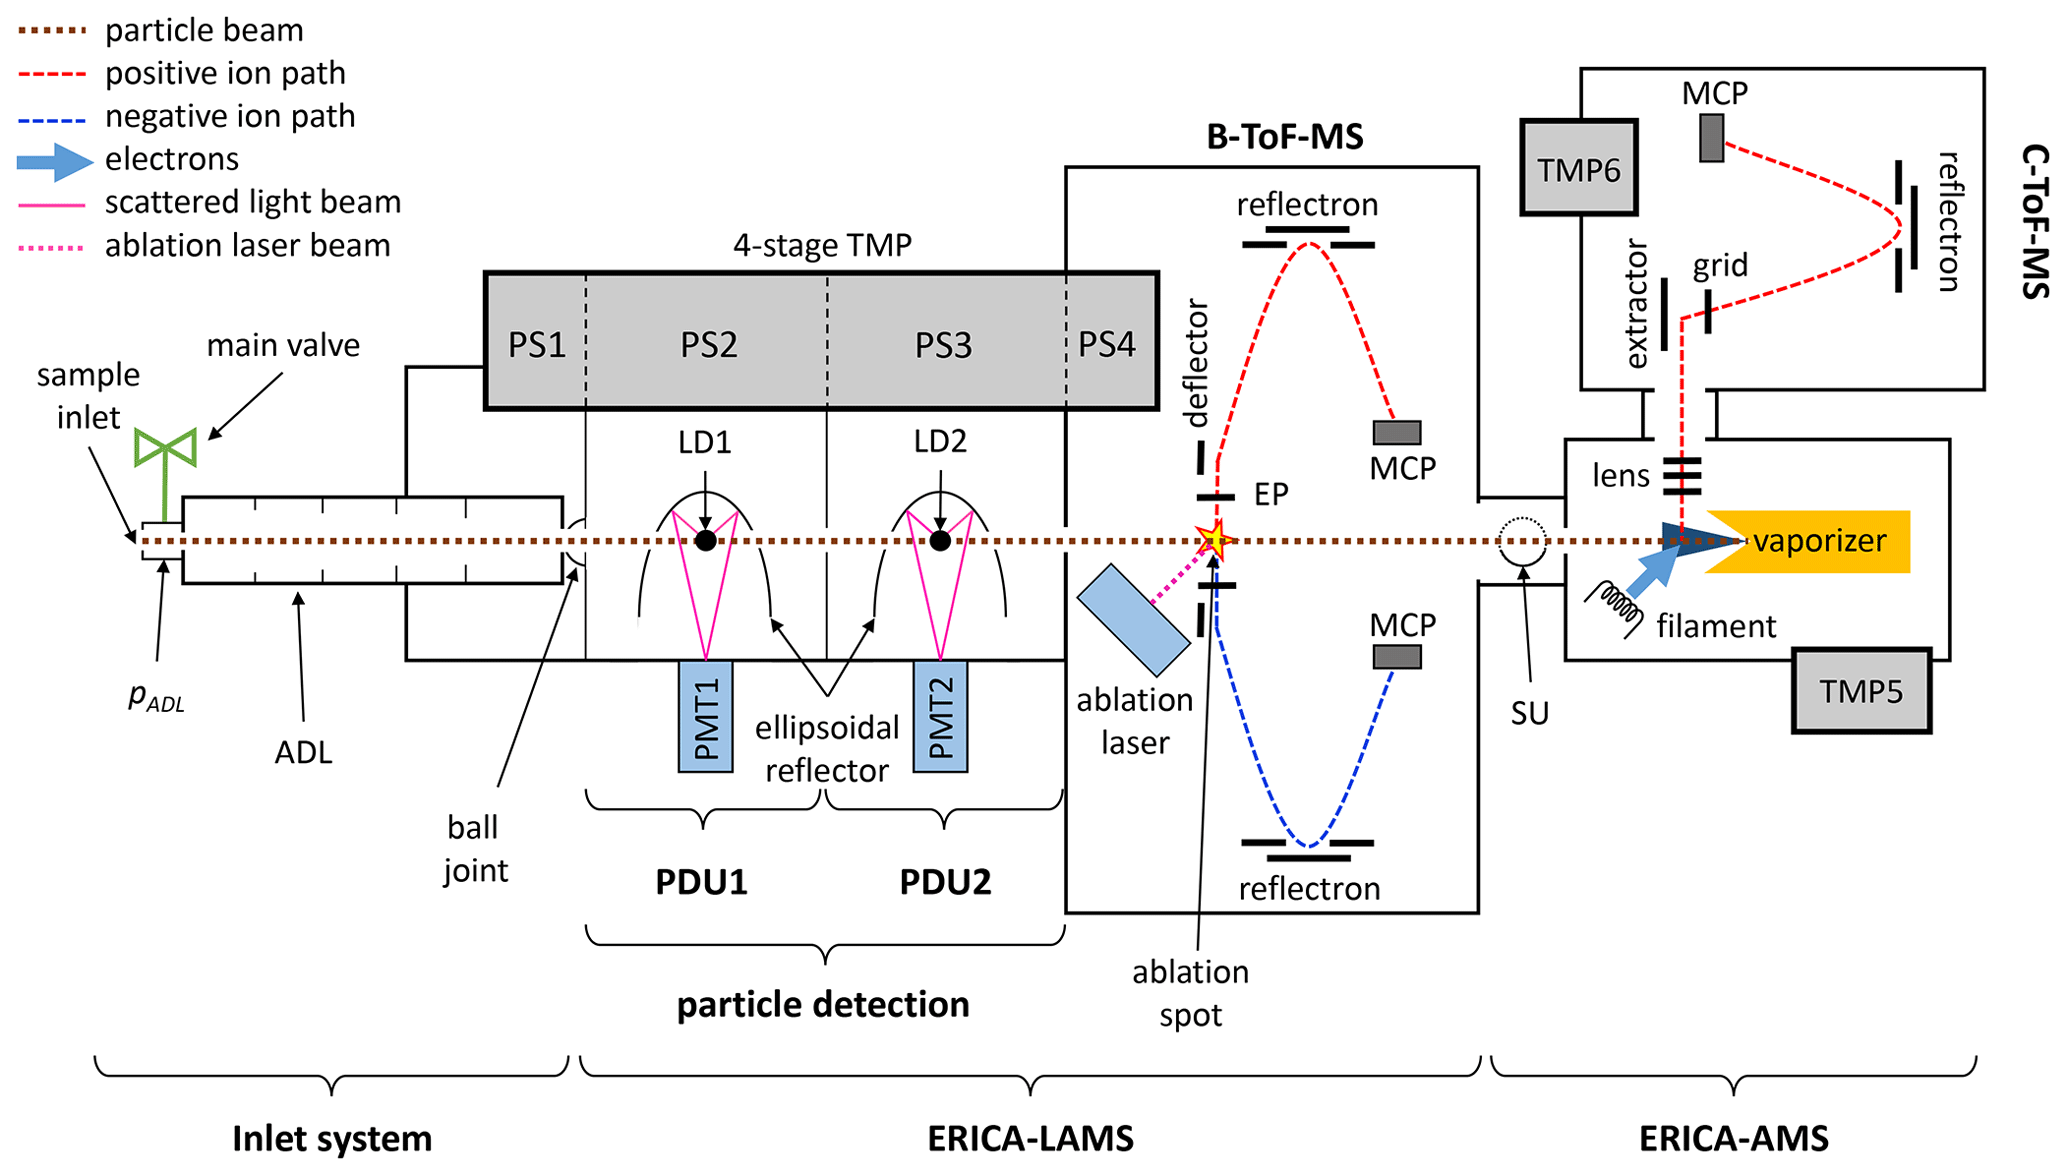
Figure 1Overview of the ERICA setup. (ADL – aerodynamic lens, LD – laser diode, EP – extraction plates, MCP – micro-channel plate, PDU – particle detection unit, PMT – photomultiplier tube, PS – pumping stage, SU – shutter unit, TMP – turbomolecular pump). The additional backing pump (MD1) for the TMPs is not shown. The detection laser beams and the ablation laser beam enter the vacuum chamber perpendicularly to the plane of drawing. The constant pressure inlet (not shown) is located upstream of the main valve.
It is assumed that a large fraction of the sampled particles will not generate a single-particle spectrum. The major reasons for this effect are as follows: first, the particles are not ablated because the laser is firing at a limited maximum repetition rate of 8 pulses s−1. During the idle time of the Nd:YAG laser, particles remain unablated, even if they are successfully detected by the units PDU1 and PDU2. This actually is by far the largest fraction of the sampled particles emerging from the ADL. If, for example, the ambient number density of particles with diameters above the optical detection limit is 100 cm−3 (NTP, normal temperature and pressure, 20 ∘C and 1013 hPa), then, at most only 5.4 % (8 shots s−1 and sampling volumetric flow rate of 1.48 cm3 s−1) of the detectable particles are hit by the laser. Second, the particles are too small for optical detection. Third, particles for which the calculation of the trigger failed continue their travel towards the ERICA-AMS vaporizer. Fourth, particles that primarily consist of materials that are transparent at a UV wavelength of 266 nm, such as pure sulfuric acid, are hard to ablate (Murphy et al., 2007). We selected a UV laser with 266 nm wavelength due to smaller dimensions of the laser and the fact that chemical substances show less fragmentation compared to ablation with shorter wavelengths (Thomson et al., 1997). In general, however, it is also possible to implement excimer lasers operating at shorter wavelengths to ablate pure sulfuric acid droplets. Also, pure sulfuric acid is detected by the ERICA-AMS. Thus, even most particles amenable to laser ablation, which pass through the ablation region, remain undestroyed. Another reason why a spectrum is not triggered over a signal threshold for recording is a low number of generated ions during the LDI process. These unablated particles pass through the ablation region of the ERICA-LAMS and enter the continuously operating the ERICA-AMS. The ERICA-AMS is based, in analogy to the Aerodyne AMS, on the TD-EI method. A filament provides the electrons for ionization of the vapor molecules emanating from the vaporizer. The resulting cations are extracted into the C-ToF-MS and eventually detected by its MCPs.
The particle size range within the 50 % cutoff in detection efficiency (d50) of the ERICA-LAMS is between 180 and 3170 nm (see Sect. 3.2.2). The signal-to-noise ratio of optical particle detection is sufficient for particle time-of-flight calibration between 80 and 5000 nm (see Sect. S4 in the Supplement). For the ERICA-AMS, the detectable particle size range is determined by the transmission and focusing properties of the aerodynamic lens. For the ADL used in our instrument, Xu et al. (2017), who used this lens in combination with an ACSM (aerosol chemical speciation monitor), determined a transmission range from ∼ 120 to 3500 nm. We assume that the detectable particle size range of the ERICA-AMS matches this transmission range. The design details of the ERICA-AMS are the same as those of the Aerodyne AMS and are well described in the literature (e.g., Jayne et al., 2000; Jimenez et al., 2003c; Drewnick et al., 2005; Canagaratna et al., 2007). A fundamental difference from the commercial Aerodyne AMS is the use of a simple shutter mechanic instead of a chopper to block the particle beam for the reference background measurement.
2.2 Aerosol particle inlet and vacuum system
A continuous flow of sampled air containing particles enters the instrument via a critical orifice at the sample inlet (see Fig. 1). For measurements at ambient ground pressure, a pinhole (diameter of 100 µm) maintains a volumetric flow rate ΦERICA of 1.48 cm3 s−1. However, in order to achieve a constant pressure in the ADL (pADL = 4.5 hPa), the mass flow rate needs to be kept constant during flight operations with largely varying ambient pressures (for the M-55 Geophysica ranging from ground pressure to 50 hPa). If pADL is not kept constant, the transmission of the particles through the inlet into the vacuum system becomes altitude-dependent (Zhang et al., 2002). For this purpose, a newly developed, automatically controlled compressible rubber O-ring setup, the so-called CPI, is deployed (Molleker et al., 2020). As the ADL the intermediate pressure lens IPL-013 (Peck et al., 2016; Xu et al., 2017) was integrated to focus the particles into a beam with sufficiently small divergence, i.e., less than the diameter of the vaporizer element at a distance of 55 cm downstream of the exit of the ADL. The lens itself contains six apertures (excluding the first critical orifice) with decreasing diameters (from 5.0 mm down to 2.9 mm), and the exiting particles are accelerated to velocities of up to 200 m s−1. The inner end of the ADL tube protrudes from a holder plate through a radially sealed feedthrough and is attached to a ball joint inside the first pumping stage of the vacuum chamber. Four fine threaded screws, two of them with scale, enable the operator to tilt the lens precisely in two dimensions in order to adjust the particle flight direction so that it becomes aligned with the vaporizer of the ERICA-AMS. By means of this design, the particle beam remained stable during flights even in the presence of vibrations caused by turbulence in the convective anvil outflows of tropical cumulonimbus at 12 to 18 km altitude.
The vacuum chamber was purchased from Aeromegt GmbH (Germany) and is a modified design of a LAAPTOF (laser ablation aerosol particle time-of-flight mass spectrometer; Gemayel et al., 2016). During mobile operation on aircraft, two diaphragm pumps (model MD 1 VARIO-SP, Vacuubrand GmbH + Co KG, Germany; pumping rate of 5 × 102 cm3 s−1) yield 3 mbar for the backing pressure of the four-stage turbomolecular pump (TMP1). As in the Aeromegt LAAPTOF, the four-stage turbomolecular pump (see Fig. 1; SplitFlow 270, Pfeiffer Vacuum GmbH, Germany) is utilized for pumping the entire single-particle mass spectrometer (ERICA-LAMS part). Its first pumping stage (PS1) operates at a rate of 3.0 × 104 cm3 s−1. The second pumping stage (PS2; see Fig. 1) reduces the pressure of the chamber, containing PDU1, down to 3 × 10⁻⁴ mbar (pumping rate of 1.55 × 105 cm3 s−1). A pinhole of a 1.8 mm opening diameter placed perpendicularly to the particle beam separates PS2 from the third pumping stage (PS3). For the particle detection unit PDU2, PS3 provides a vacuum pressure of 8 × 10⁻⁷ mbar with a pumping rate of 1.55 × 105 cm3 s−1. The fourth pumping stage (PS4) is attached to the chamber of the B-ToF-MS, which is maintained at a pressure of 4 × 10⁻⁷ mbar (pumping rate of 2.0 × 105 cm3 s−1). The particle detection unit PDU2 and the mass spectrometer chamber are connected through a centered 4 mm aperture.
The shutter unit (SU) separates the ERICA-LAMS mass spectrometer chamber from the ERICA-AMS ionizer vacuum chamber (see Fig. 1). The latter is separated from the SU by an orifice of 7 mm in diameter. The turbomolecular pump TMP2 (see Fig. 1; model HiPace® 80, Pfeiffer Vacuum GmbH, Germany; pumping rate of 6.7 × 104 cm3 s−1) is attached to the ionizer chamber, keeping it at a pressure of 1 × 10⁻⁷ mbar. The turbomolecular pump TMP3 (model HiPace® 30, Pfeiffer Vacuum GmbH, Germany) provides a pumping rate of 2.2 × 104 cm3 s−1 in the C-ToF-MS such that here the operational pressure is 2 × 10⁻⁷ mbar. Both HiPace® pumps, TMP2 and TMP3, are backed by the third pumping stage (PS3) of the SplitFlow pump. A schematic of the distribution of the pumps and the vacuum connections between the pumps is shown in Sect. S1.2 in the Supplement.
2.3 ERICA-LAMS
The ERICA-LAMS is based on the commercial LAAPTOF (Gemayel et al., 2016; Marsden et al., 2016). However, it has been thoroughly modified, so only the vacuum chamber (including the four-stage TMP), the ADL adjustment mechanics, and the B-ToF-MS remain. The setup of the optical single-particle detection module for the ERICA-LAMS consists of the two particle detection units PDU1 and PDU2 (see Fig. 1), based on the design of the ALABAMA (Brands et al., 2011; Clemen et al., 2020). Each of these particle detection units (PDU1 and PDU2) contains a continuous-wave laser (LD1 and LD2), an ellipsoidal reflector, and a PMT (PMT1 and PMT2). By that, each particle passing both laser beams causes two light-scattering signals. The distance from the exit of the ADL to the focal point of the first ellipsoidal reflector (i.e., the first particle detection point) is 58.8 mm; the distance between the first and second detection point is 66.5 mm. A scheme of the geometry with dimensions of the ERICA is provided in Sect. S1.3 in the Supplement. The laser sources are 150 mW UV-laser diodes operating at a wavelength of 405 nm (model SF-AW210 distributed by InsaneWare-Deluxe, Germany) mounted in a heat sink.
The continuous-wave laser light is focused by a plano-convex lens with a focal length of 4.02 mm to a radius w0 of 30 µm (see Sect. 3.2.1). To reduce optical disturbances like diffraction fringes, the laser beam passes through a baffle of four apertures before the beam enters the detection region. Finally, approximately 40 mW of light illuminates the particle detection region. Each PDU is individually mounted on a disjoined micro XY translation stage (1 µm precision, model MKT 30-D10-EP by OWIS GmbH, Germany), and thus, they can be tilted in two dimensions for adjusting the laser foci onto the particle beam. An O-ring around the tube holding the four aperture rings provides the vacuum seal at the pivot point.
In order to focus the light scattered by the individual particles on a detector, ellipsoidal reflectors (model E50NV-01 anti-fingerprint coated, Optiforms, Inc., Temecula, CA, USA) were used. A detailed description of the ellipsoidal-reflector setup can be found in Sect. S1.4 in the Supplement. A plano-convex lens collimates the reflected scattered light towards the sensitive area of the PMT (model H10721-210, Hamamatsu Photonics K.K., Japan). This design collects a maximum of 70 % of the total scattered light from a spherical particle (100 nm), according to model calculations adopting Mie theory and using the geometry of the detection unit except for the pinholes (which cause losses). The acquired PMT signals are processed by a custom-built electronic board, hereafter referred to as the trigger card (TC) following the design from the ALABAMA (Brands et al., 2011; Clemen et al., 2020).
The ablation laser is triggered by the TC that measures the particle flight time between the two PMTs and computes the precise time of the particle arrival at the “ablation spot” by multiplying the particle flight time between PDU1 and PDU2 by a factor (pulse generator multiplier), considering the geometry of the instrument (see Sect. S1.3 in the Supplement). The triggering of the ablation laser considers the time span of 145 µs between triggering the laser flash lamps and the Q-switch. The precise values for this timing are set experimentally. Also, the TC triggers the high-voltage switches for the ion extraction.
As a consequence of the ablation laser pulse, the material of an aerosol particle is vaporized and ionized in a single step by a multi-photon process (Suess and Prather, 1999). For the LDI, a frequency-quadrupled Nd:YAG laser (model Ultra 50, Quantel, France) generates 6 ns long pulses with 266 nm wavelength and typical values of around 4 mJ for the pulse energy. The co-emitted light from the laser at wavelengths of 1064 and 532 nm is not filtered by a wavelength separator inside the laser head in order to minimize the number of optical elements in the light path before the ablation spot.
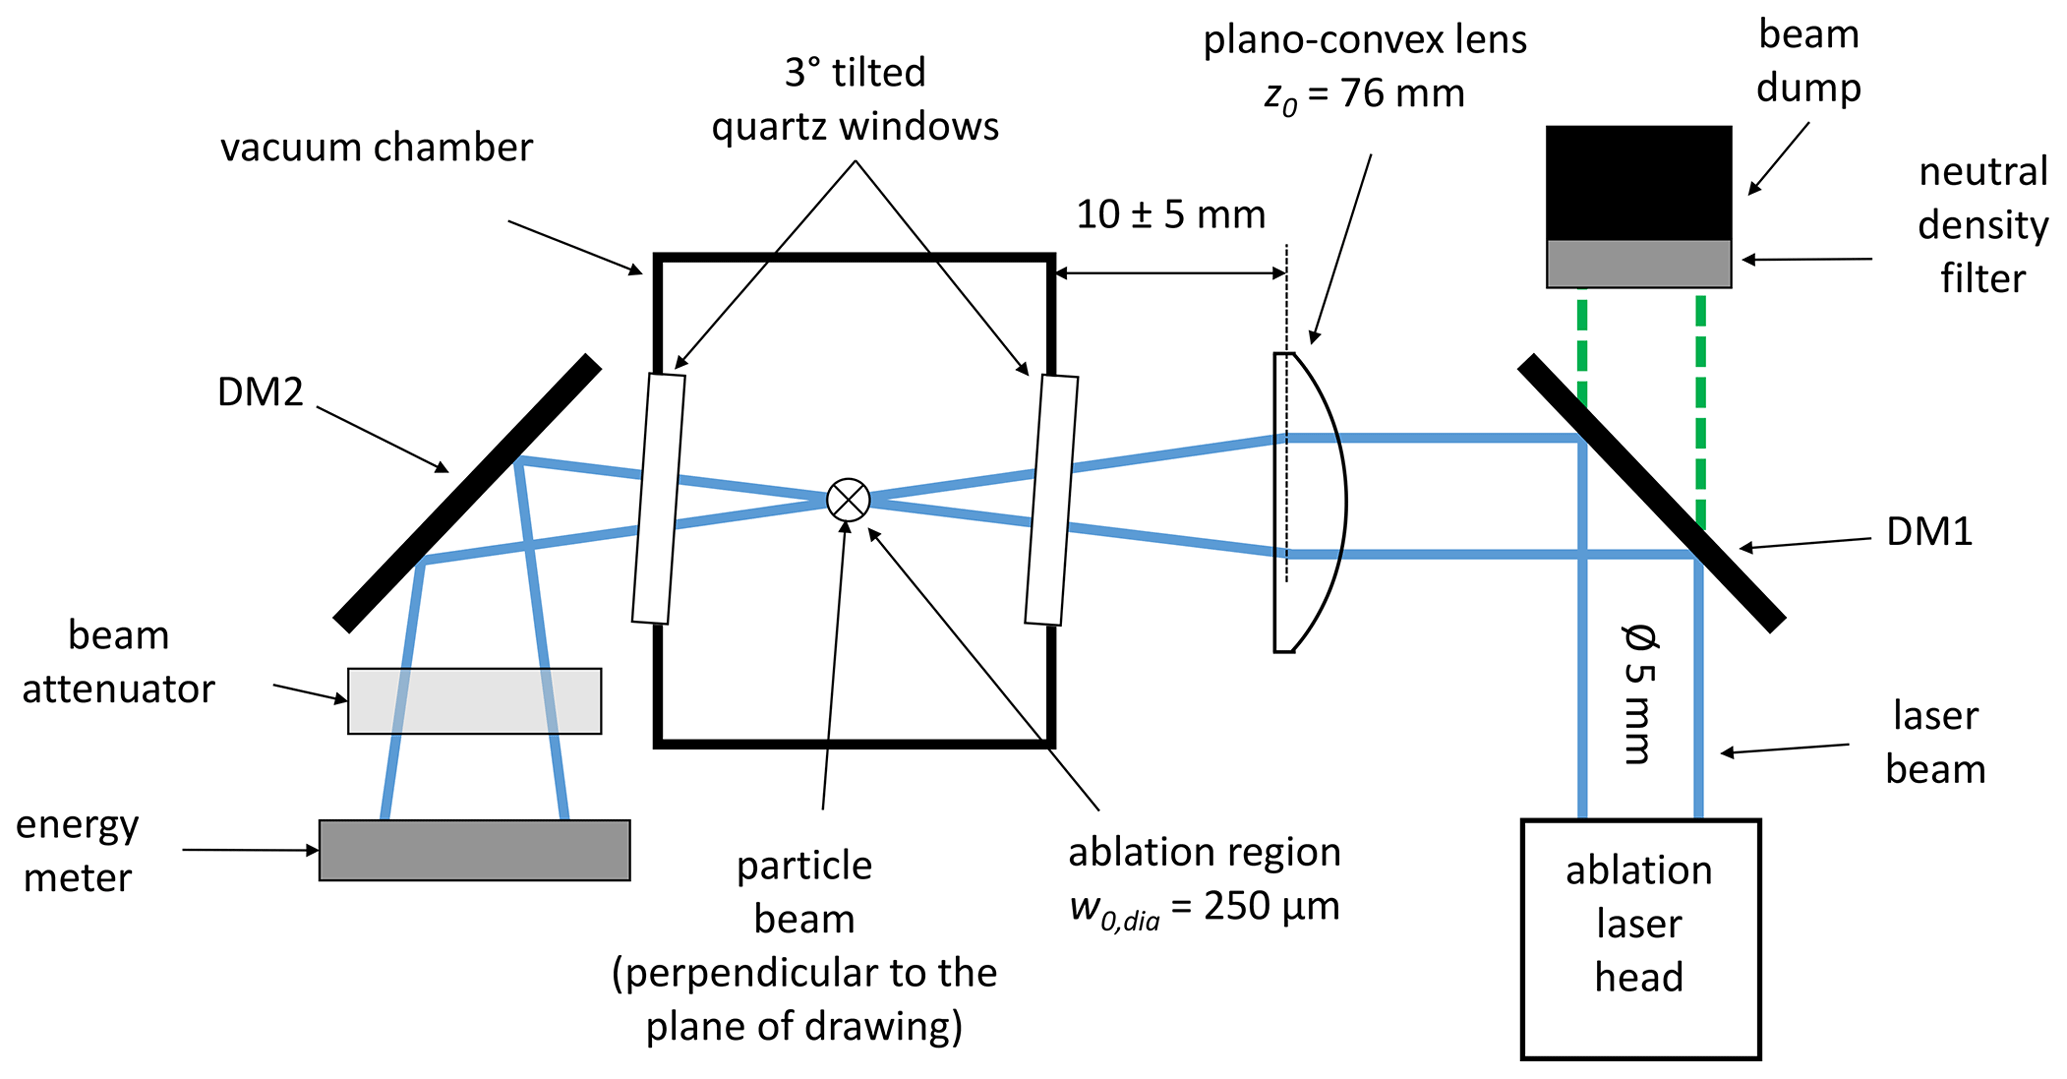
Figure 2Schematic of the ablation laser unit of the ERICA-LAMS and corresponding optical dimensions (z0: focal length; w0,dia: laser beam focus diameter). The particle beam is pointing perpendicularly to the plane of the drawing. The dichroic mirrors are labeled as DM1 and DM2.
As shown in Fig. 2, the emitted laser beam is oriented orthogonally to the particle flight axis and focused onto the particle beam by a plano-convex lens (anti-reflection-coated model L-11612, Laseroptik GmbH, Germany). From the laser head, the beam is directed towards the mass spectrometer chamber by the dichroic mirror DM1 (see Fig. 2; model G340722000, Qioptiq Photonics GmbH & Co. KG, Germany). This mirror also separates the UV light from the light at the other wavelengths (1064 and 532 nm) by reflecting > 99.5 % of the 266 nm light while only 12.6 % of the light at other wavelengths is reflected towards the ablation spot. The laser beam, now mostly consisting of UV light, enters and exits the vacuum chamber through uncoated and 3∘ tilted quartz glass windows in order to reduce back-reflections towards the laser head. The exiting beam is directed by a second dichroic mirror DM2 through an attenuating UV-absorbing glass filter (model UG11, Qioptiq Photonics GmbH & Co. KG, Germany) to an optical energy meter (EnergyMax™-USB, model J-25MB-LE, Coherent, Inc., USA) by which the energy of each pulse can be measured such that the laser pulse energy is detected and stored. The focal length of the lens (f = 76 mm) is such that a high UV light intensity is centered at the ablation spot (see Fig. 1). This spot is located at the center between the extraction plates (EPs) of the B-ToF-MS (from Tofwerk AG, Switzerland). For adjusting the beam waist of the UV laser to the ablation spot, the dichroic mirror DM1 is mounted on a holder, which allows tilting the mirror with 2 degrees of freedom. The minimum beam at the ablation spot, which can be obtained with this setup, has a diameter w0,dia of 250 µm (see Sect. 3.2.1). For this fine adjustment, the focusing lens can also be moved in the direction towards the vacuum chamber. By means of this setup, the diameter of the laser beam at the location of the particle beam can be enlarged from the minimum of 250 µm up to approximately 740 µm so that the energy density at the ablation spot can be reduced in a controlled way (Brands et al., 2011). Considering a nearly Gaussian beam shape, as measured and confirmed by the fitting method in Sect. 3.2.1, the power density available to ablate the particle depends on the location of the particle within the laser beam. After each pulse the laser has to idle for at least 120 ms in order to keep the output energy constant; this fact limits the repetition rate for the ERICA-LAMS to 8 pulses s−1 (instead of the nominal 10 pulses s−1 according to the manufacturer's specification). The maximum repetition rate of the ablation laser, along with factors such as particle losses in the ADL, particle beam divergence, particle and laser beam alignment, and the sensitivity of the particle detection units, limits the number of particles analyzed (Su et al., 2004; Zelenyuk and Imre, 2005; Brands et al., 2011; Marsden et al., 2016; Clemen et al., 2020), which affects the spatial resolution for measurements from a fast-flying aircraft.
For the analysis of the single particles, the ions generated by the laser pulse are accelerated into the B-ToF-MS using an electric extraction field in the ablation region. The acceleration field between the EP is turned on only for the short time interval of 2 µs, which is long enough for sufficient ion extraction. For this purpose, fast solid-state high-voltage transistor switches (model HTS 61-03-C, Behlke Power Electronics GmbH, Germany) are triggered by the TC and switch within 18 ns about 1.2 µs before the Q-switch actually fires the laser. During the time when no particles are detected by PDU1 and PDU2 or the ablation laser is in its idle time, the EPs are connected to ground. Upon connection to ground, the electric field decays with an RC time constant of approximately 10 ms. The high-voltage (HV) switch was implemented since the electric extraction fields cause charged aerosol particles to deviate from their straight flight direction (e.g., Chen et al., 2020; Clemen et al., 2020), and as a result, they might not hit the vaporizer in the ERICA-AMS part. In order to also reduce particle deflection caused by an electric field forming outside the ion optics, in addition the particle flight path through the ERICA-LAMS part is shielded by grounded plates. Inside the time-of-flight mass spectrometers, reflectrons (see Fig. 1) serve to enlarge the ion flight path and to increase the mass resolution RMS to up to 700 (see Sect. 3.2.4).
The generated ion signal is picked up by MCPs (model MCP 40/12/10/8 D 46:1, Photonis USA, Inc., Sturbridge, MA, USA), amplified, and collected by a digital oscilloscope (model PicoScope 6404C, Pico Technology, UK). The oscilloscope features four channels with 8 bit vertical resolution and a maximum sampling performance of 5 gigasamples per second (GS s−1). The time resolution is set to 1.6 ns per sample. Each of the two MCP outputs, for the anions and cations, is conditioned and sampled simultaneously by two separate channels (two channels for cations and two channels for anions) of different input voltage ranges (full range for cations 200 mV and 4 V, respectively, and for anions 100 mV and 4 V, respectively), an approach for extending the dynamic range of the analog-to-digital conversion (Brands et al., 2011). A graphic user interface was developed for the control of the oscilloscope and the fast export of raw data to binary files. These files are converted to a format that is compatible with the in-house-developed evaluation software CRISP (Concise Retrieval of Information from Single Particles) by Klimach (2012) for a posteriori analysis. In each file the bipolar mass spectrum, the time of ablation (time stamp), and the particle flight time (“upcounts”) between PDU1 and PDU2 are stored.
2.4 ERICA-AMS
All particles which are not ablated in the ERICA-LAMS (see Sect. 2.3) continue their flight towards the ERICA-AMS instrument part. The design of the ERICA-AMS is the same as the design of the commercial Aerodyne AMS, which is described in the literature (Drewnick et al., 2005; Canagaratna et al., 2007). However, a major difference to the commercial AMS is the use of the SU in the ERICA-AMS instead of a chopper and a longer particle flight path between the ADL and the vaporizer (see below). In the ERICA-AMS, quantification is given in the same way as in the commercial AMS since the shutter performs the same function as the chopper. The vaporizer, ionizer, and ion optics, as well as the C-ToF-MS, are identical to those in the commercial Aerodyne C-ToF-MS, ToF-ACSM, and mAMS. The details are described in Drewnick et al. (2005), Canagaratna et al. (2007), and Fröhlich et al. (2013).
In the ERICA-AMS, non-refractory components are thermally desorbed by a tungsten vaporizer (surface diameter of 3.8 mm) operating at a temperature of approximately 600 ∘C. The vapor molecules and fragments are ionized by electrons (impact energy of 70 eV) continuously emitted by a filament (emission current of 1.6 mA). This vaporization and ion generation unit was manufactured by Aerodyne (Aerodyne Research Inc., Billerica, MA, USA). The generated ions (cations) are extracted through an electrostatic lens stack into the C-ToF-MS. The extraction path is perpendicular to the aerosol particle flight path (orthogonal extraction). The ions are extracted in batches with a frequency of 50 kHz. The trigger pulse for ion extraction defines the starting time for the time-of-flight mass spectrometric ion analysis (Drewnick et al., 2005; Canagaratna et al., 2007). After passing through the C-ToF-MS, the ions impinge on the MCP (model MCP 40/12/10/8 D 46:1, Photonis USA Inc., Sturbridge, MA, USA) and generate a signal, which is amplified and collected by the data acquisition card (DAQ card; model ADQ1600 USB3, Teledyne Signal Processing Devices Sweden AB, Sweden). The DAQ card serves for both the generation of periodic trigger pulses for ion extraction and the acquisition of ion-generated signals from the MCPs. This device samples at 1.6 GS s−1 with a high vertical resolution of 14 bit. Multiple consecutive spectra are processed at a hardware level over a time period of user-selectable length (typically 400 ms) and are streamed via a USB 3.0 connection as one averaged raw spectrum to the main control computer.
For quantitative aerosol composition measurements, the background signal, which originates from air molecules and residual vapor molecules inside the chamber, has to be subtracted from the aerosol sampling signal. For this purpose, the SU is used to periodically block the particle beam. The SU consists of a C-shaped surface made of metal, which is mounted on the shaft of a high-vacuum magnetically coupled feedthrough (Pfeiffer Vacuum GmbH, Germany). The shaft periodically rotates the shutter by 90∘ into and back out of the particle beam path. In this way, the particle stream to the vaporizer is blocked and permitted, respectively, for adjustable time periods. In the commercial Aerodyne AMS (Canagaratna et al., 2007), the particle beam is periodically blocked by a chopper inside the low-vacuum stage. By means of the chopper it is possible to distinguish between different vacuum aerodynamic particle sizes, as the particle flight elapsed from its pass through the chopper until its arrival at the vaporizer is size-dependent. The distance between the chopper and the vaporizer and the corresponding flight time need to be long enough to achieve such size-resolved sampling. In the design of the ERICA-AMS, the distance from the shutter to the vaporizer is very short. This would not be the case if a chopper were mounted directly behind the ball joint of the ADL. However, by periodically blocking the particle beam with a chopper at this position, the detection frequency of the ERICA-LAMS would have been reduced accordingly. Thus, a simple shutter has been implemented, and the particle size information can only be provided by the PDU of the ERICA-LAMS (see Sect. S4 in the Supplement).
Based on experience from flight operation and laboratory experiments, one measurement cycle has been selected to have a length of 10 s, which corresponds to 25 measured averaged raw spectra. Out of these, 12 spectra were recorded with the shutter open (4.8 s), 11 with the shutter closed (4.4 s) for background measurement, and 2 during the movement of the shutter. Since the exact position of the shutter during the acquisition of the latter is not known, these 2 spectra are discarded and not used for data evaluation. These open–closed cycles can be adjusted in the acquisition software (“TofDAQRec” by Tofwerk AG, Switzerland). The collected data are evaluated by the software “Tofware” from Tofwerk AG (Fröhlich et al., 2013; Stark et al., 2015; Timonen et al., 2016).
2.5 Influence of the ERICA-LAMS on the ERICA-AMS
The assembly of the two instrument parts, i.e., the ERICA-LAMS and the ERICA-AMS, in a serial configuration might lead to interactions. On the one hand, it can safely be assumed that the ERICA-LAMS is largely unaffected by the ERICA-AMS presence and operation. On the other hand, particles which are ablated or distracted in the ERICA-LAMS are excluded from the total mass measured by the ERICA-AMS.
The first loss mechanism for particles to be analyzed by the ERICA-AMS is the ablation of the particles in the ERICA-LAMS. The impact of this instrument-induced loss depends on the number concentration of particles within the sampled aerosols and cannot be compensated for. Two examples illustrate this for different conditions:
- i.
In pristine conditions, like the summertime Arctic boundary layer, particle number concentrations rarely exceed 5 cm−3 (Köllner et al., 2017) in the size range (see Sect. 3.2.2) relevant to our instrument. For the typical sampling volumetric flow rate (ΦERICA) of 1.48 cm3 s−1, a maximum of around 7 particles s−1 would be detected by the ERICA-LAMS. Even with the ablation laser being restricted to a maximum of 8 shots s−1, theoretically this can result in a 100 % loss for the ERICA-AMS since all particles would be ablated and ionized assuming a hit rate (HR; for a definition see Sect. 3.2.3) of 100 %. On the other hand, small particles (dva < 100 nm; see Sect. 3.2.2) cannot be detected sufficiently by the detection units and will not lead to any losses at the ERICA-AMS. Furthermore, in practice, the HR is particle-size-dependent and, for all particle sizes, lower than unity. Thus, the parameter HR is not applicable for estimating the losses of the non-ablated particles. The value of the HR might not be lower than unity because of the failure of the laser pulse hitting the targeted particle but because of the ionization efficiency within the LDI process. Thus, at such low ambient particle concentrations, the quantitative results of the ERICA-AMS measurements must be viewed critically. In addition, possible measurement strategies, such as including periods of short inactivity for the ERICA-LAMS, can be adopted. Further studies and additional instrumentation (size distributions) need to be considered to quantify the ERICA-AMS results at low particle concentrations.
- ii.
During the first field deployment (see Sect. 4), usually around 100 particles s−1 was detected by the PDUs during ambient aerosol measurements in the planetary boundary layer. Considering ΦERICA, 8 laser shots s−1 and a maximum HR of 100 %, about 5.4 % of the particles are ablated and thus will not reach the vaporizer. For the same reasons as those discussed above, this is a conservative estimate and the actual losses cannot be determined. However, the losses (in mass) are small considering the commonly assumed uncertainty of 30 % in AMS instruments (Bahreini et al., 2009). By calculation, 30 % losses for the particle numbers equal 27 particles s−1 (∼ 18 particles cm−3). In the upper troposphere and lower stratosphere (UTLS; > 15 km), we measured a particle detection rate of between 5 and 800 particles s−1. Thus, for such measurements, losses for the mass concentration of up to 100 % have to be considered and the uncertainty of 30 % has to be adapted.
Another loss mechanism is the deflection of charged particles caused by the temporarily applied electrical field between the high-voltage extraction plates of the ERICA-LAMS. This will lead to losses which are impossible to be compensated for because typically the charge distribution of ambient aerosol particles is not known. Therefore, measures have been taken in order to minimize these losses as much as possible. As described in Sect. 2.3, the high voltage (HV) for ion extraction is only applied shortly before a particle is ablated. The deflection caused by the electric field is dependent on the particle size and charge; the resulting losses consequently depend on the dimensions and shape of the vaporizer, meaning that not all deflected charged particles are lost. The HV switch unit was specially designed to keep the deflection losses to a minimum. The HV is applied for 10 ms per shot, resulting in a duty cycle of 8 %, assuming the laser is shooting 8 times s−1.
3.1 Characterization of the particle beam
3.1.1 Determination of efficiencies for optical particle detection and particle mass measurements
Knowing the particle beam properties at the PDUs, the ablation spot, and the vaporizer is essential for interpreting and evaluating measured data. For proper detection of the sampled particles, a sufficient overlap of the particle beam with the laser beams and the vaporizer is required. The optical particle detection efficiency of the PDUs was determined by comparison of count rates of the individual detection units (PDU1 and PDU2) with those of either a condensation particle counter (CPC) or an optical particle counter (OPC) as the reference device (see Sect. S3 in the Supplement). In this way, the particle numbers or, indirectly, the mass concentrations measured by the ERICA-AMS can be associated with the number concentration of the sample airflow. The measured polystyrene latex (PSL) particle sizes and the respective measurement setups are shown in Sect. S3 in the Supplement.
To determine the size-dependent and ADL-position-dependent optical detection efficiency DEPDU at the detection units with PSL particles (see Table S5 in the Supplement), the ADL was tilted in steps and DEPDU was measured at different ADL positions xpos while the position of the detection laser was kept constant. Hereafter, this procedure is referred to as the “ADL position scan”. This approach, which is similar to the method reported by, e.g., Marsden et al. (2016) and Clemen et al. (2020), is described by Molleker et al. (2020). DEPDU was determined for each lens position xpos according to Eq. (1).
Here, is the averaged value of the number of particles per second counted by each PDU over 30 s, ΦERICA is the volume flow into the ERICA, and is the value of the number of particles per volume unit averaged over 30 s at the reference device. A typical result of an ADL position scan for PSL particles at PDU1 and PDU2 is shown in the Supplement (Sect. S5.4, Fig. S13). The curve fit to the ADL position scan can be described as a convolution integral of a rectangular top-hat function of the effective detection laser width 2reff,L, since the scattered light is only detected above a certain intensity threshold, and a 2-D Gaussian distribution function representing the particle beam cross section. The effective laser beam radius reff,L is the laser beam radius wherein a particle is registered. The convolution is described by Eq. (2) according to Molleker et al. (2020):
The variable σ is a measure for the particle beam width, i.e., the particle beam radius, and x0 corresponds to the value of xpos at the peak value. This x0 value is also called the modal value of the ADL position scan. The parameter Ascan is a scaling parameter of the peak value of the ADL position scan and accounts for losses, e.g., ADL transmission efficiency values smaller than unity. Equation (2) is used as a curve-fit function for determining the values of the parameters reff,L, x0, σ, and Ascan. A plateau, such as the one shown in Fig. S13a in the Supplement, indicates a narrow particle beam with respect to the effective laser width for the respective measurement.
For the measurements of particles with sizes from 218 to 834 nm, it was assumed that the particle losses between PDU1 and PDU2 are negligible. Therefore, the curve fitting for both detection units was performed simultaneously for each particle size with both data sets (PDU1 and PDU2) by a comprehensive analysis, which allows us to combine two data sets into one single common curve-fitting procedure. In the following, this procedure is referred to as “combined curve fitting”. During this combined curve-fitting procedure, the variable Ascan was linked for both PDUs by determining one Ascan value for PDU1 and PDU2 simultaneously. Thus, only one value for Ascan per measured particle size was obtained.
For the evaluation of the measurement with PSL particles of 108 nm in size, a different approach was chosen because losses between PDU1 and PDU2 seemed reasonable due to the particle beam divergence (Huffman et al., 2005). Therefore, the evaluation was carried out without the combined curve-fitting procedure and, thus, individually for the measurements at PDU1 and PDU2. Due to the mathematical relation between the variables reff,L and Ascan during the curve fitting, it was not possible to determine both variables at the same time. Therefore, reff,L was calculated separately and kept constant during the curve fitting. Considering the size dependence of the scattered light intensity based on Mie scattering, was estimated for the measurement with PSL particles of a size of 108 nm, adopting suitable software routines following Bohren and Huffman (1998). The value of , determined for the measurements of particles with sizes of 218 nm, was used as base for the estimation. The result of the calculations showed that a particle of 108 nm scatters the same amount of light as a particle of 218 nm, when it is closer to the focus by a factor of 0.955. Thus, was used as a curve-fit constant for the evaluation of the measurement with PSL particles of 108 nm (see Sect. S5.1.1 in the Supplement). Since this calculation is based on a Gaussian laser beam profile, it can only be seen as an approximation and especially since the outer parts of the laser beam might deviate from a Gaussian profile due to diffraction and reflection in the laser beam setup.
In addition to the particle detection efficiency for PSL particles, the optical particle detection efficiencies of particle counting at both PDUs were determined according to Eq. (1) for ammonium nitrate (AN) particles between 91 and 814 nm in size (see Sect. S3 in the Supplement). Besides the singly charged, the doubly charged particles have to be considered when using a differential mobility analyzer (DMA) for size selection out of a polydisperse aerosol. For this, a newly developed, iterative method was adopted and is described in detail in Sect. S5.2 in the Supplement. Briefly, the curve-fit function of Eq. (2) was extended by a second term for the doubly charged particles and two weighing factors to account for the fractions of the particle charges (see Eq. S15 in the Supplement). As for the measurements with PSL particles, the parameters reff,L, σ, x0, and Ascan could be determined by a combined curve-fitting procedure (for exceptions see Sect. S5.2 in the Supplement).
Simultaneously to the measurements with AN particles at the detection units PDU1 and PDU2 of the ERICA-LAMS, the mean mass concentration of AN was measured with the ERICA-AMS, similarly to the approach described in Liu et al. (2007). The efficiency with which particle mass concentrations were measured with the ERICA-AMS was determined. While this quantity is equivalent to the “collection efficiency” (CE; e.g., Canagaratna et al., 2007; Matthew et al., 2008; Drewnick et al., 2015) in AMS measurements, we define it as “particle mass detection efficiency” for consistency with the ERICA-LAMS discussion. As a reference, we used the CPC to obtain the mean particle number concentration and calculated the input mass concentration. The curve-fitting evaluation method applied afterwards also accounts for the doubly charged particle fraction and is described in detail in Sect. S5.2 in the Supplement. By the curve-fitting procedure, the parameters reff,V (effective vaporizer radius), σ, x0, and Ascan could be determined (see Sect. S5.2 in the Supplement for definitions and exceptions). All these parameters, reff,L, reff,V, σ, x0, and Ascan, are essential for adjustment procedures of the instrument and to interpret the obtained laboratory and field mass spectra. Furthermore, the determined parameters are used in Sect. 3.1.2 to characterize the particle beam and in Sect. 3.2.2 and 3.3.2 to determine the optical particle detection efficiency and the particle mass detection efficiency, respectively.
Overall, the parameters serve as a means for the evaluation of the performance of the instrument.
3.1.2 Particle beam properties
The parameters reff,L, reff,V, σ, x0, and Ascan were determined by the curve-fitting functions (Eqs. 2 and S15 and S17 in the Supplement) and are thus in the dimension relative to the ADL position xpos as read out on the micrometer adjustment screw (see Sect. S1.3 in the Supplement). Below, the parameters were rescaled, using the intercept theorem, to the dimension of the particle beam at the specific position (PDU1, PDU2, ablation spot, and ERICA-AMS vaporizer).
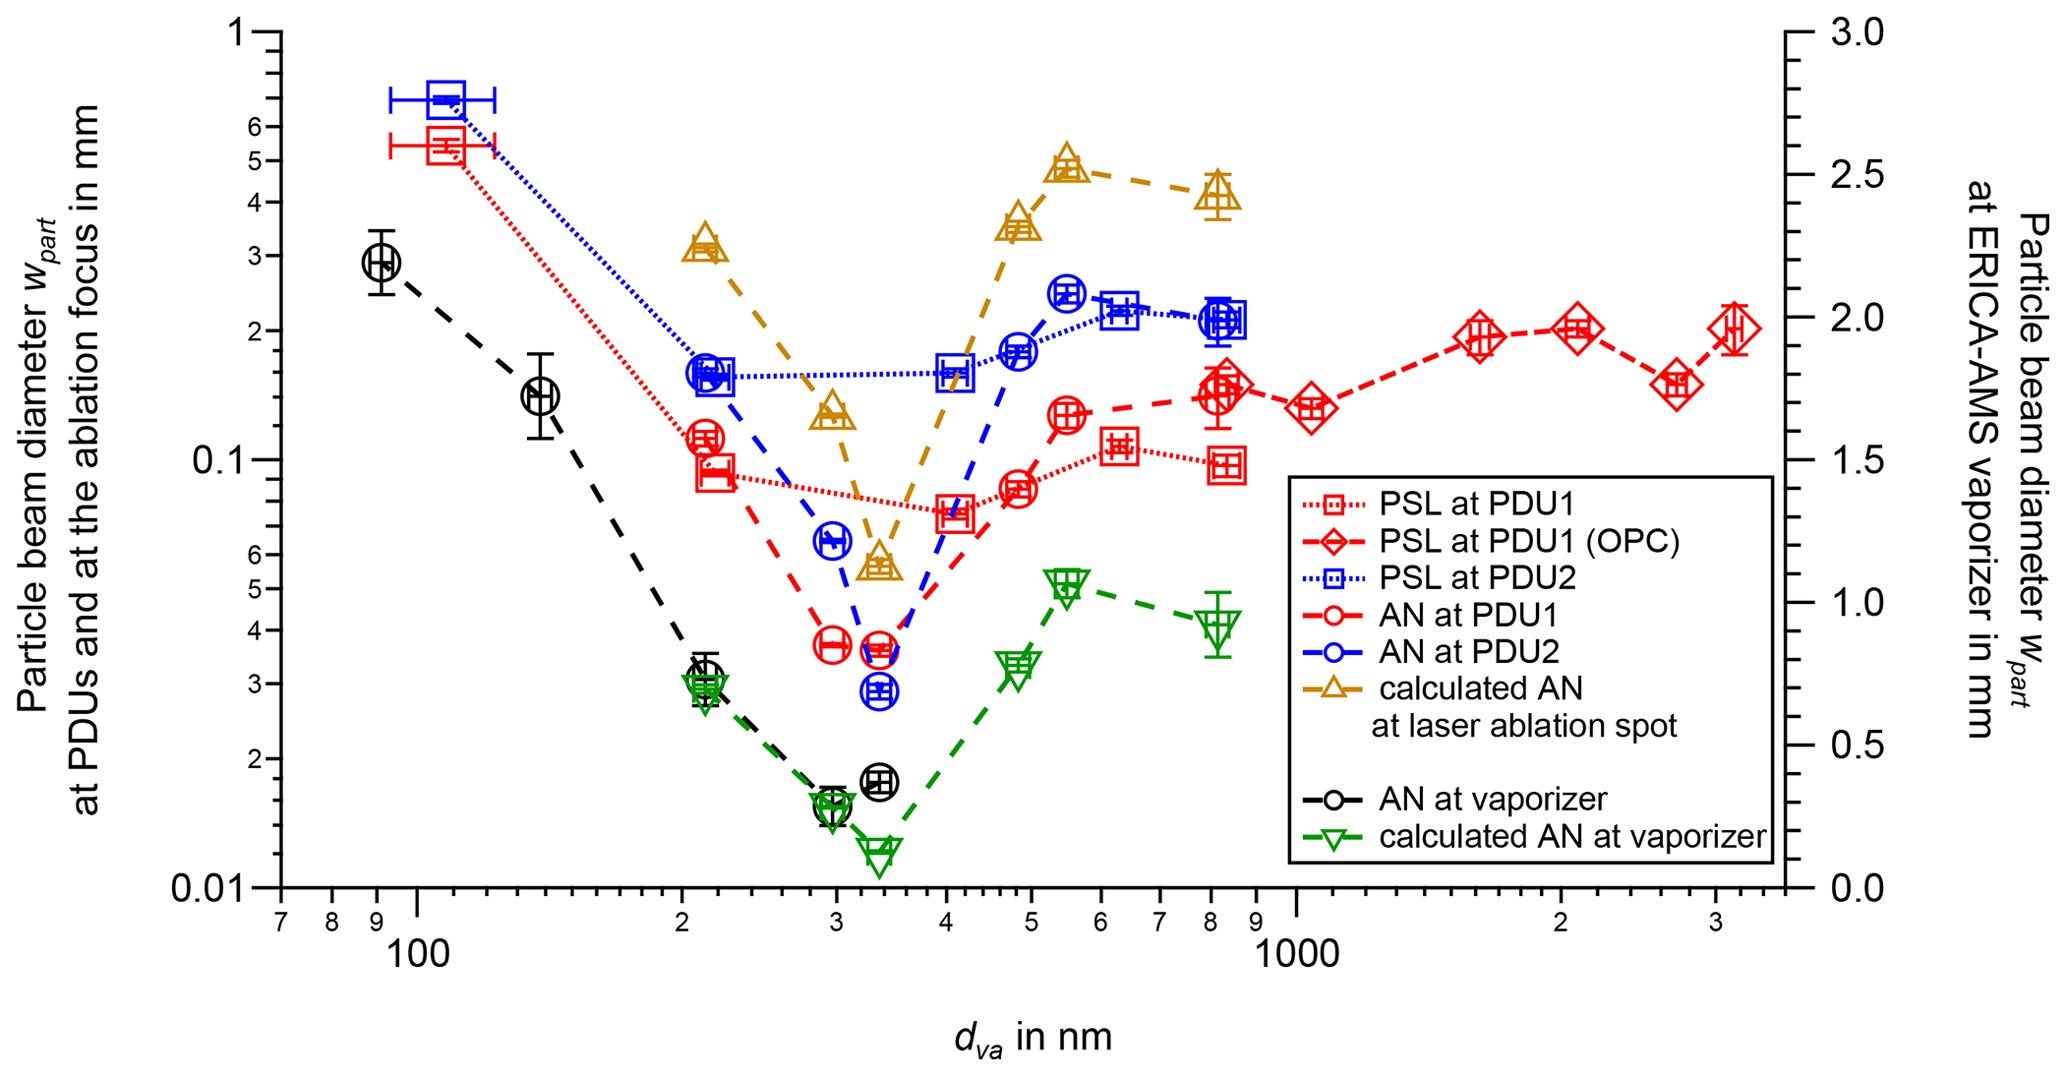
Figure 3The particle beam diameter wpart ( diameter) as a function of particle size dva for PSL (squares) and AN (circles) particles measured at the detection units PDU1 (red, left ordinate) and PDU2 (blue, left ordinate) and for AN particles measured at the ERICA-AMS vaporizer (right ordinate, black). The reference values for number concentrations were obtained from the experimental setup with either the CPC or the OPC (Setup B or Setup C, respectively; see Fig. S8 in the Supplement). The AN particle beam diameter at the ablation spot (brown triangles, left ordinate) and the ERICA-AMS vaporizer (green triangles, right ordinate) were calculated by extrapolation of the measurement at PDU2. The uncertainty in PSL particle size is given by NIST certificates and converted to dva. The uncertainty in AN particle size dva is estimated to be 3 % (Hings, 2006). These uncertainties for PSL and AN particle sizes are the same for Figs. 3 to 7 and 12. The uncertainties in the particle beam diameters result from the curve fittings (1 standard deviation).
The curve fittings yield the standard deviation σ, which is proportional to the particle beam radius at each detector (PDU or vaporizer). The particle beam diameter wpart is defined as 2σ, i.e., the diameter of the Gaussian distribution function. In Fig. 3, wpart is displayed as a function of the particle size dva at various locations within the instrument. The particle beam diameter wpart is approximately 0.1 mm at PDU1 and 0.2 mm at PDU2 for particle sizes above 400 nm. For PSL particles of 108 nm in size, the wpart values are 5 times (7 times) wider at PDU1 (PDU2). The measurements with the OPC for larger diameters indicate a trend for wpart from 0.10 to 0.18 mm. For AN particles of 335 nm in size, a minimum of wpart was found, as the corresponding values for wpart at PDU1 and PDU2 are 0.04 and 0.03 mm, respectively. At the vaporizer, the largest value for wpart of 2.2 mm was measured for AN particles of 91 nm in size, which is narrower than the width of the vaporizers' physical cross-sectional diameter of 3.8 mm. Thus, by adjusting the ADL properly, all investigated AN particles larger than 91 nm can be collected by the vaporizer. The overall curve shapes at each PDU depict a “V”, where the smaller and the larger particles show a larger wpart than particles of 335 nm in size. Smaller particles can be deflected by collisions with residual gas molecules, and larger particles are over-focused by the ADL due to their inertia (Zhang et al., 2002; Peck et al., 2016). Considering the geometry of the instrument, wpart at the ablation spot and at the ERICA-AMS vaporizer can also be extrapolated from the respective wpart for AN at PDU2. The longer travel distance for the particles and the particle beam divergence (Huffman et al., 2005) result in a 3.3-fold-broader wpart for AN particles at the vaporizer than at PDU2. The calculation yields a maximum wpart of 0.48 mm at the ablation spot, a value which is approximately 2 times the ablation laser beam diameter w0,dia (see overlap parameter determination below in this section), and wpart of 1.07 mm at the vaporizer (both for AN particles of 548 nm in size).
In the following, the overlap of the particle beam with the detection laser focus is discussed. Considering an optical laser beam diameter w0,dia of 60 µm of the PDUs (see Sect. 3.2.1), the particle beam diameter wpart is wider by a factor of 2 to 3 (PSL, dva > 400 nm). However, the laser intensity of a Gaussian beam provides intensities larger than zero also for radial distances above w0 and the scattered light might be sufficient for particles to be detected. The maximum distance from the laser axis where particles can be detected is represented by the parameter reff,L and not w0. Figure 4 shows the effective laser beam radii reff,L and reff,V as a function of the particle size dva. Overall, for PSL particles, reff,L is between 0.1 and 0.4 mm. The shape of the curve of the effective laser beam radius depends on the response function of the scattered light intensity as a function of size, where an increase to larger sizes is expected. For the measurements with PSL particles of 108 nm and AN particles of 91 and 138 nm in size, this is inevitable since the values of reff are calculated based on the Mie scattering according to a rough estimation (see Sect. S5.1 in the Supplement). For larger particles or the measurements with the OPC as the reference device, an increase in reff,L with particle size would be expected. Due to the fact that the OPC measurements were performed with various PMT threshold values (see Sect. S3 in the Supplement), reff,L appears lower than the CPC reference measurements, and thus, reff,L for particle sizes above 834 nm is underestimated in Fig. 4. The AN measurement results do not agree with the results of the measurements with PSL particles, possibly due to a different refractive index of AN as compared to that of PSL. The vaporizer width determined by the ADL position scans, i.e., reff,V, agrees with the vaporizer's physical dimension of a 1.9 mm radius.
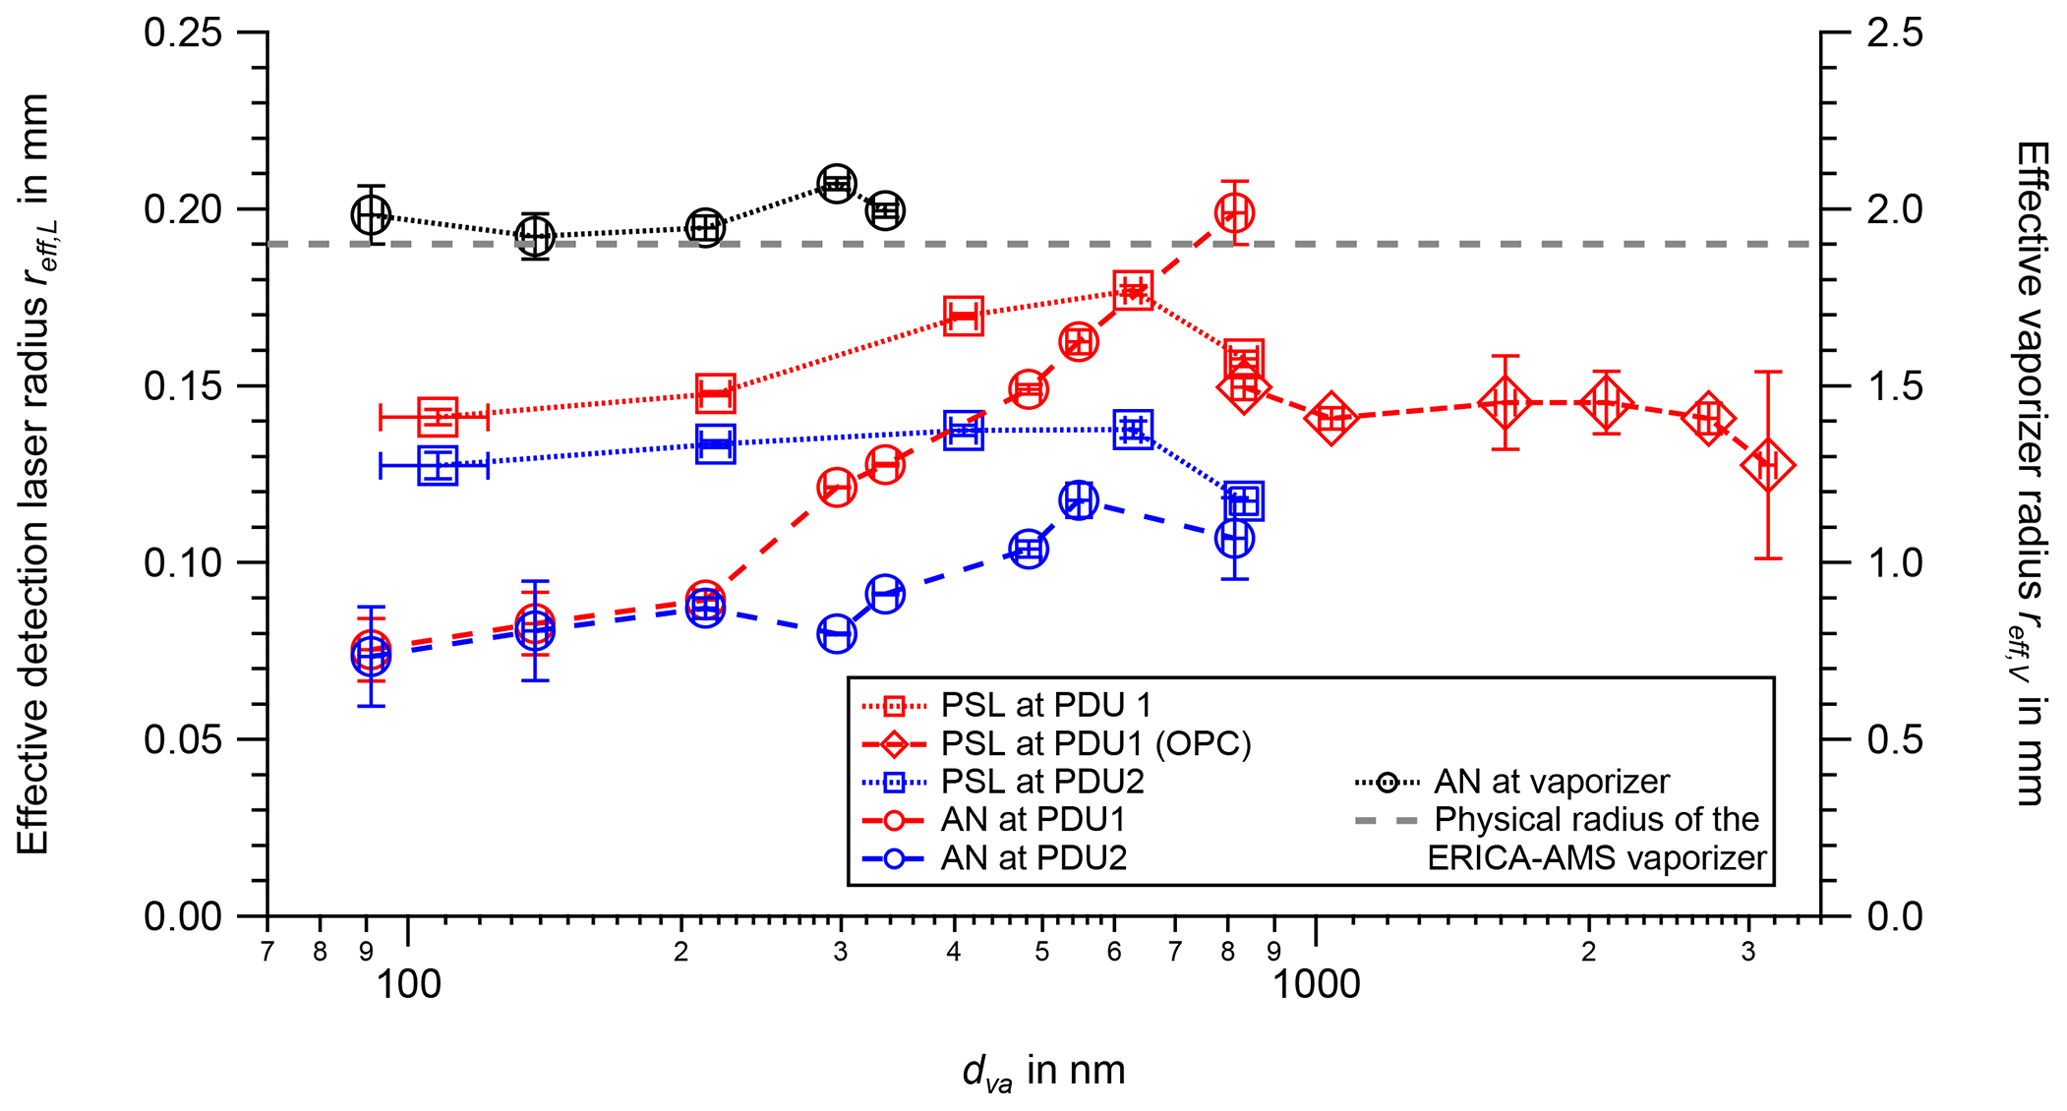
Figure 4The effective detection laser radius reff,L as a function of particle size dva determined for PDU1 (red, left ordinate) and PDU2 (blue, left ordinate) with PSL (squares) and AN (circles) particles and the effective vaporizer radius reff,V as a function of particle size dva for the ERICA-AMS vaporizer (right ordinate, black) determined with AN particles. CPC and OPC measurements are as for Fig. 3. The physical vaporizer radius is marked by a dashed gray line. The uncertainties in the effective radii result from the curve fittings (1 standard deviation). The uncertainty in reff,L for the PSL measurement with particle size of 108 nm was estimated to be 0.002 mm (PDU1) and 0.004 mm (PDU2), and the uncertainties in reff,L for the AN measurements with particle sizes of 138 and 91 nm are conservatively estimated to be 0.009 mm at PDU1 and 0.014 mm at PDU2. These values are the approximated maximum uncertainties in reff,L in the considered size range of 213 to 814 nm at PDU1 and PDU2. For the measurement with AN particles of 91 nm in diameter, the uncertainty in reff,V was estimated to be 0.08 mm.
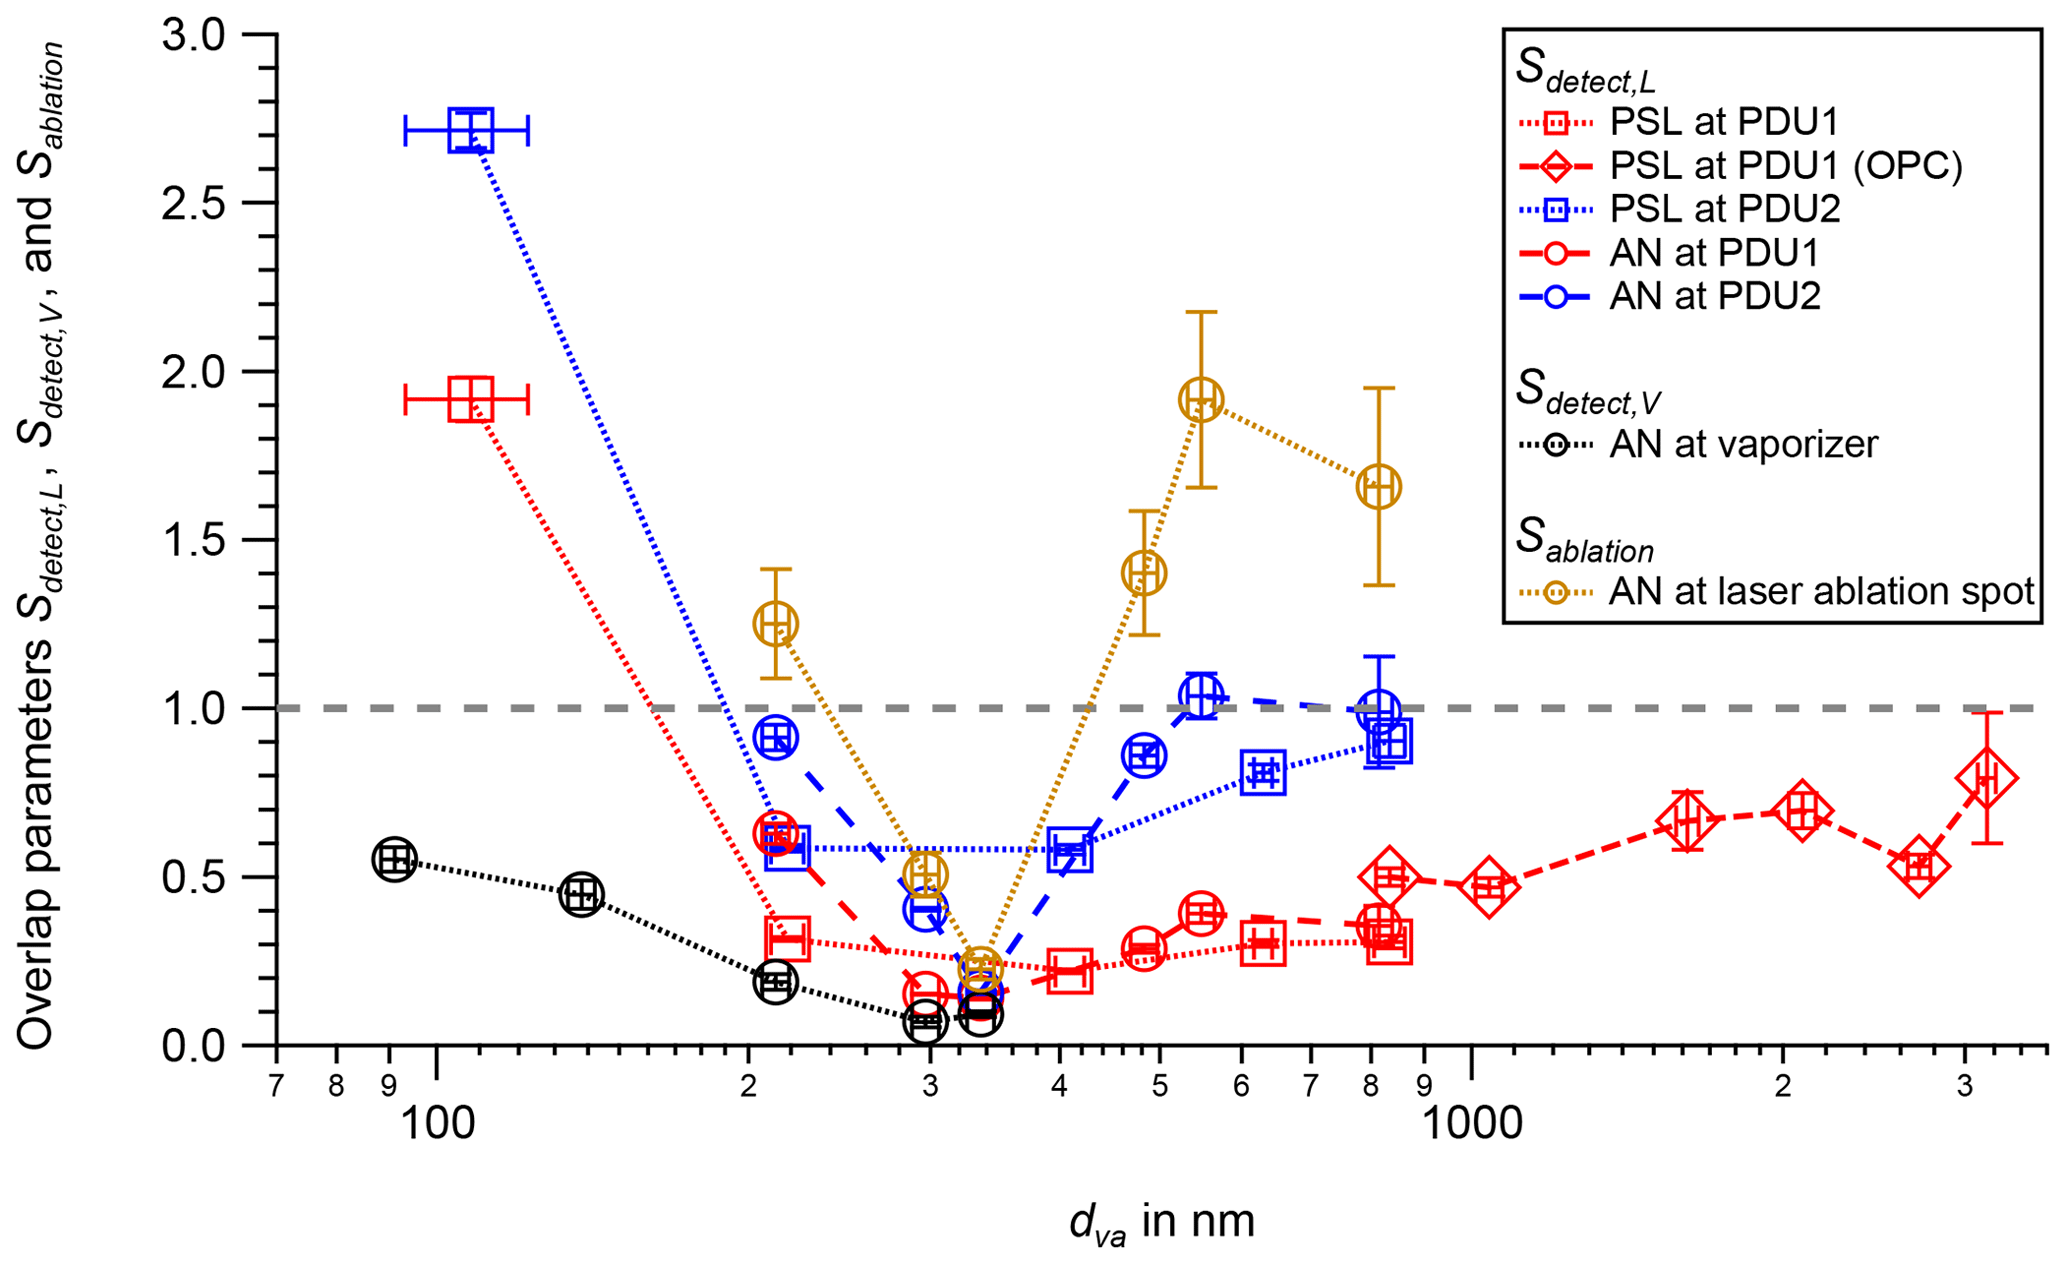
Figure 5The overlap parameters Sdetect,L, Sdetect,V, and Sablation as a function of particle size dva for PSL (squares) and AN (circles) particles. Sdetect,L was determined for PSL and AN particles at PDU1 (red) and PDU2 (blue). Sdetect,V was determined for AN particles at the ERICA-AMS vaporizer (black). Sablation was calculated for AN particles at the laser ablation spot (brown). CPC and OPC measurements are as for Fig. 3. The horizontal dashed gray line illustrates where the ratio equals 1. The uncertainties in Sdetect,L, Sdetect,V, and Sablation result from the curve-fitting values (1 standard deviation).
To determine the overlap of the particle beam with the detection laser beam, the particle beam diameter wpart is compared to the effective laser diameter . Therefore, the overlap parameter was calculated for different particle sizes at the PDUs as the maximum possible overlap of wpart and deff,L for each measurement at lens position xpos=x0. The parameter (with ) expresses the overlap of the particle beam with the effective vaporizer width. Both are shown in Fig. 5. The horizontal gray line marks an overlap parameter of 1. All investigated particle sizes below that line are detected sufficiently well within 1σ of the particle beam width. That is the case, within their uncertainties, for all measurements except for PSL particles of 108 nm in size. The reason for this is a large wpart for the smallest particles resulting from a large particle divergence caused by the small particle inertia for this size (Zhang et al., 2002). The values of Sdetect,L of the measurements with the OPC are overestimated, since the resulting values of reff,L are underestimated due to the varying threshold during the measurements (see Sect. S3 in the Supplement). However, the values are below a ratio of 1. It has to be remarked that a value above 1 does not indicate impossible particle detection by the PDUs but just a reduced detection efficiency. As shown in Sect. S4 in the Supplement, the PDUs can detect particles in a size range between 80 and 5145 nm, although not with such efficiency as in the size range between ∼ 180 and 3170 nm (see Sect. 3.2.2).
An overlap parameter Sablation can also be determined for the overlap of the particle beam and the ablation laser spot by dividing the particle beam diameter wpart, exemplarily for AN particles, at the ablation laser spot (see brown curve in Fig. 3) by the determined optical laser beam waist w0,dia of 250 µm (). The determination of the parameter w0,dia is shown in Sect. 3.2.1. In Fig. 5, Sablation is plotted versus the particle size dva. The calculated fraction of the illuminated area of the UV ablation laser spot is between 0.23 (at dva=335 nm) and 1.91 (at dva=548 nm). Although the particle beam is larger than the ablation laser beam waist diameter for most particle sizes, it is possible to ablate particles and measure them with the mass spectrometer. This indicates again that w0,dia is not the most meaningful measure for the overlap. It also leads to the conclusion that particles can experience largely different laser intensities depending on the position of the particle within the ablation laser beam. At least, Sablation smaller than 1 indicates that 1σ of the particle beam is within the w0,dia of the ablation laser spot.
All the data shown for the parameters Sdetect,L, Sdetect,V, and Sablation are the maximum possible values of the respective particle sizes obtained when performing the ADL adjustment separately for each particle size.
3.2 ERICA-LAMS characterization
3.2.1 Detection and ablation laser beam widths
For characterization of the laser beams of the PDUs and the ablation laser, a razor blade was moved stepwise perpendicularly into the respective laser beam (with steps of 0.01 mm). These characterization experiments were performed in a separate measurement setup. The remaining energy was measured using a bolometer (high-sensitivity thermal sensor model 3A, Ophir Optronics Solutions Ltd.) in the case of the diode lasers and by an energy meter (model EnergyMax™-USB, J-25MB-LE, Coherent, Inc., USA) for the pulsed UV ablation laser. The results of the measurements are provided in Sect. S2 in the Supplement.
To measure the beam waist radius w0 of the detection laser in two dimensions (x and y), the razor blade was positioned directly at the focal point. Curve fits of the Gaussian error function (Eq. 3) were applied to all data sets, with P0 for the power offset of the fitted curve, Pmax the maximum power, pos0 the central position of the Gaussian distribution, pos the horizontal position of the blade (i.e., the independent variable), and w0 the beam radius of the Gaussian intensity profile (Skinner and Whitcher, 1972; Araújo et al., 2009).
It was found that the laser spot has an oval cross-sectional shape with the dimensions of w0 = (30.3 ± 1.2) µm and w0 = (20.0 ± 0.9) µm (measurement in the x and y directions, respectively). Thus, the diameter () can be determined for the x direction as w0,dia = (60.6 ± 2.4) µm and for the y direction as w0,dia = (40.0 ± 1.8) µm. The average irradiance over the beam cross section ( of intensity) of the laser can be estimated as 2.1 × 10³ W cm−2. Since the detection units are identical in construction, this measurement represents both detection units.
The procedure of the characterization of the ablation laser beam is similar to the one adopted for the detection lasers. Here, however, a cross-sectional scan is performed at eight different positions along the laser beam's optical axis. To evaluate the whole beam waist, the radii w were plotted versus the position of the razor blade from the lens zpos. To determine the focal length z0, the Rayleigh range zR, and the beam waist radius w0 at the axial position zpos, the curve fit of the Gaussian near-field equation (Eq. 4; Siegman, 1986) was applied:
From exposures on photosensitive paper, the laser beam profile appeared radially symmetrical, and this measurement was performed only in one orientation. The curve fitting results in a Rayleigh range zR of 7.5 mm, a focal length z0 of 76.4 mm, and a beam waist radius w0 of 125 µm. Thus, the beam waist diameter w0,dia is approximately 250 µm, resulting in an average irradiance over the beam cross section ( of intensity) of the laser of 1.36 × 10⁹ W cm−2. It has to be mentioned that particles can encounter very different laser irradiance depending on their trajectory through the Gaussian profile since the detection and the ablation laser beam waists are much larger than the diameters of the sampled particles (Marsden et al., 2018). The ablation laser beam waist radius and energy density are sufficient for particle ablation, and the measured values are comparable to those of other single-particle mass spectrometers, like the ALABAMA (Köllner, 2019) and A-ATOFMS (Su et al., 2004).
3.2.2 Optical particle detection efficiency
We determined the optical detection efficiencies for PSL and AN particles at PDU1 and PDU2 for two cases: the largest possible, i.e., the maximum, detection efficiency DEmax and the detection efficiency for the set ADL position (xpos = 10.55 mm) during the deployment in Kathmandu, Nepal (KTM), DEKTM. Both DEmax and DEKTM combine the optical detection efficiency measurements with PSL and AN particles described in Sect. 3.1.1. Section S5.6 in the Supplement provides a listing of all relevant equations.
The parameter DEmax was determined for each measurement. For this, the determined set of parameters (reff,L, σ, x0, and Ascan) of each curve fitting, was re-inserted into the respective Eq. (2) or Eq. (S15). For the maximum possible detection efficiency DEmax, the variable xpos equals the modal value of the ADL position scan x0, thereby compensating for the size-dependent particle beam shift (see Sect. S5.7 in the Supplement). To obtain the DEmax values in practice, the ADL has to be readjusted for each particle size.
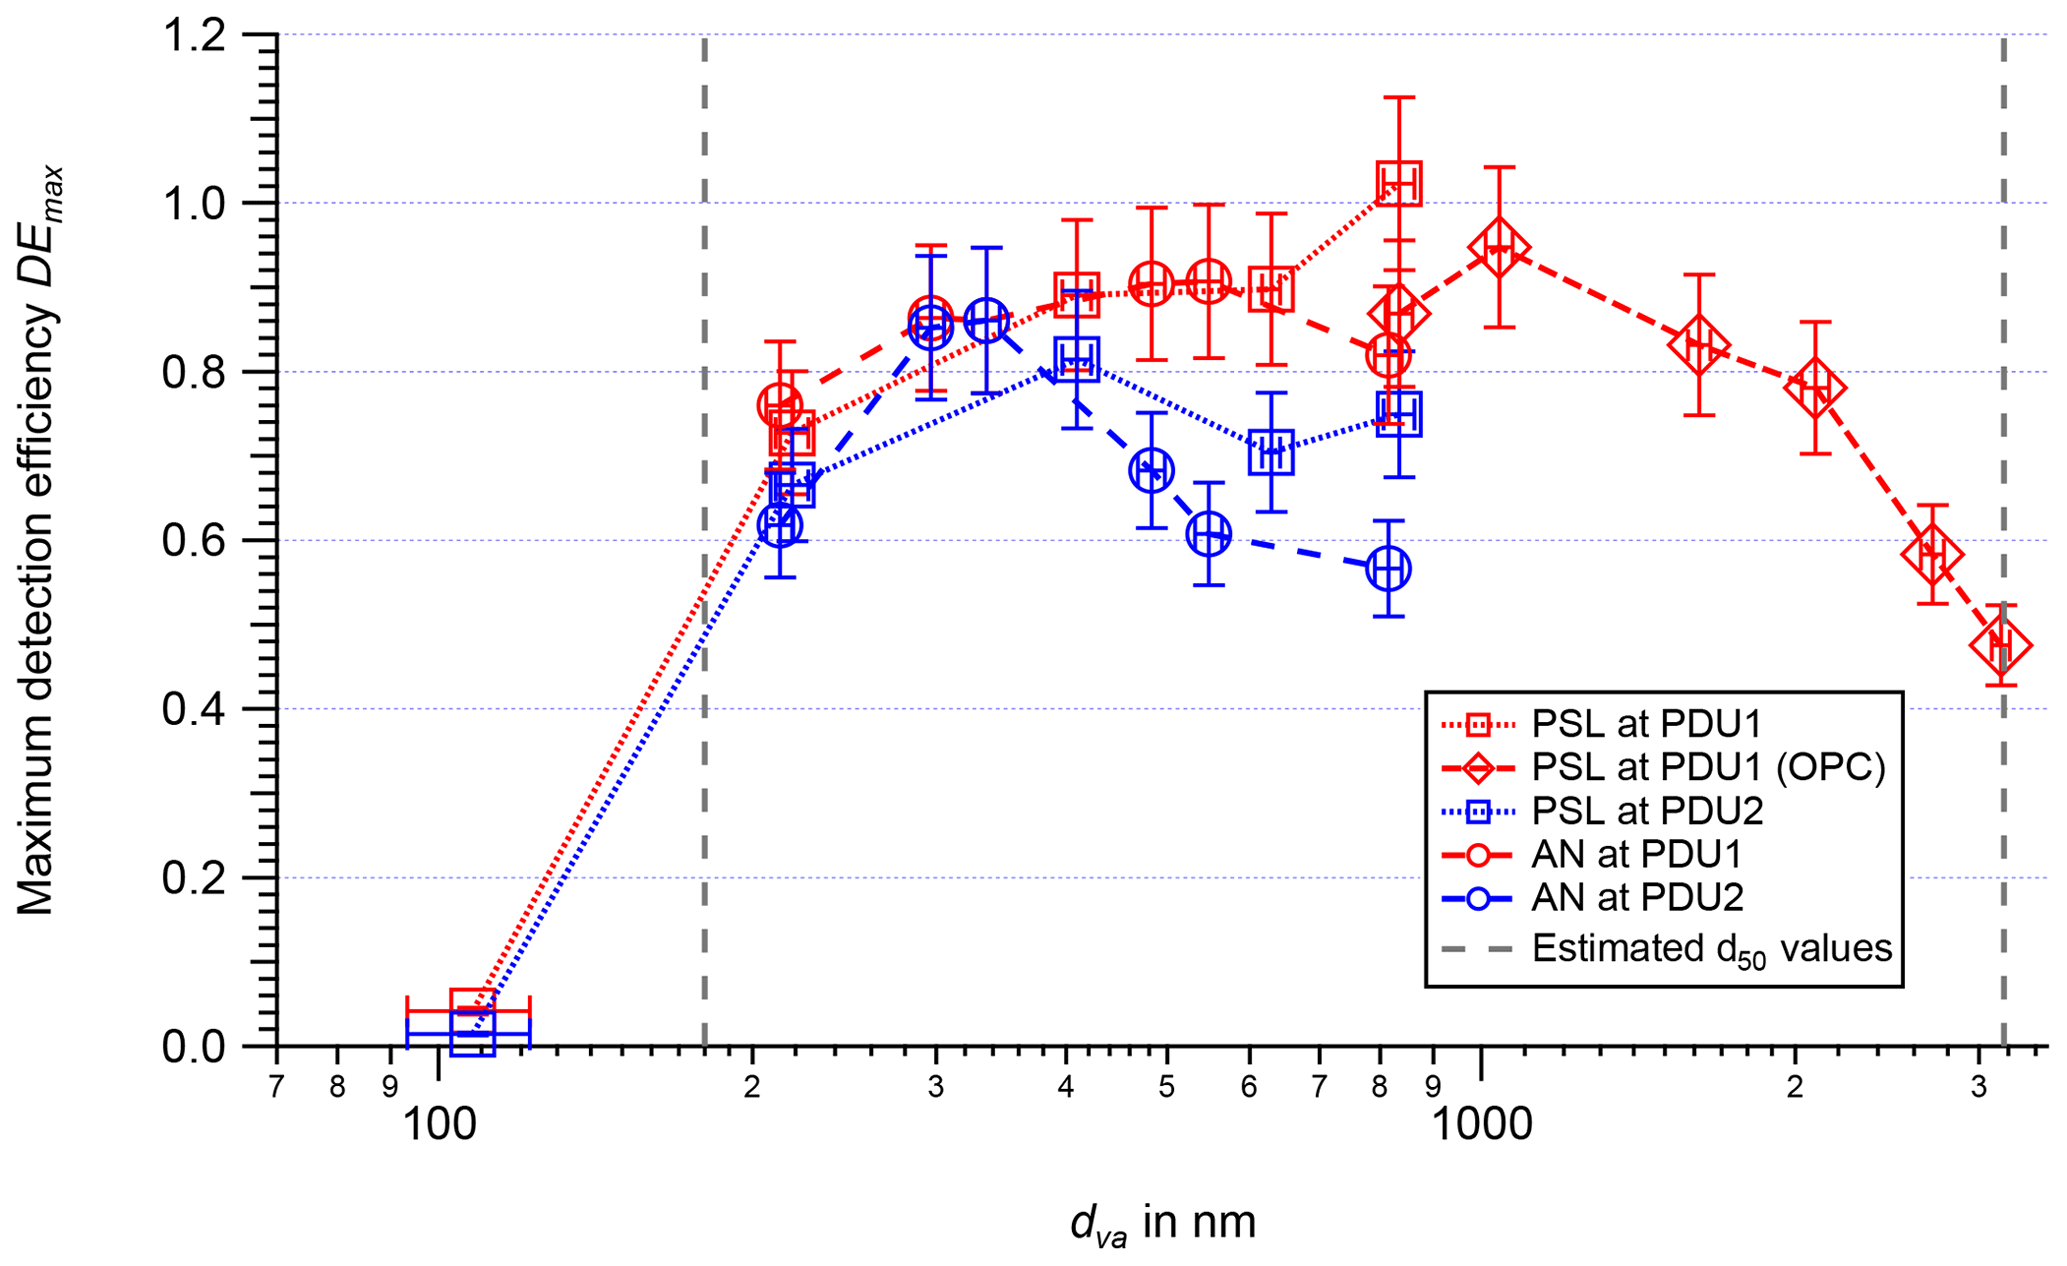
Figure 6Maximum detection efficiency DEmax as a function of particle size dva for PSL (squares) and AN (circles) particles measured at PDU1 (red) and PDU2 (blue). CPC and OPC measurements are as for Fig. 3. The estimated d50 (50 % of the maximum) values of the optical detection are marked by vertical dashed gray lines. The uncertainties in DEmax reflect the conservatively estimated value of 10 %.
Figure 6 presents the largest possible, i.e., the maximum, detection efficiency DEmax at ADL position x0 as a function of the particle size dva. The values of DEmax for PSL particles with particle sizes larger than 200 nm is above 0.60, reaching the value of 1 for particle sizes of 834 nm at PDU1. The parameter d50 is typically used to characterize the detection limits of single-particle counting devices. The parameter d50 is defined as 50 % of the maximum DEmax value. Here, the low d50 value of the optical particle detection is between the particle sizes 108 and 218 nm. The upper d50 value lies slightly above a particle size of 3150 nm. Interpolations or extrapolations for the measurements with PSL particles are used to estimate the d50 values. We found 180 nm as the lower and 3170 nm as the upper d50 value. At PDU2, the DEmax is lower, which can be explained by the broader particle beam at PDU2 compared to PDU1. The curve progression of the particle measurements up to particle sizes of 1000 nm follows the expected response function of the light scattering, especially the decreasing DEmax at small particle sizes. The decreasing DEmax values for large particles and be explained by the reduced transmission of the ADL due to particles losses by inertial impaction.
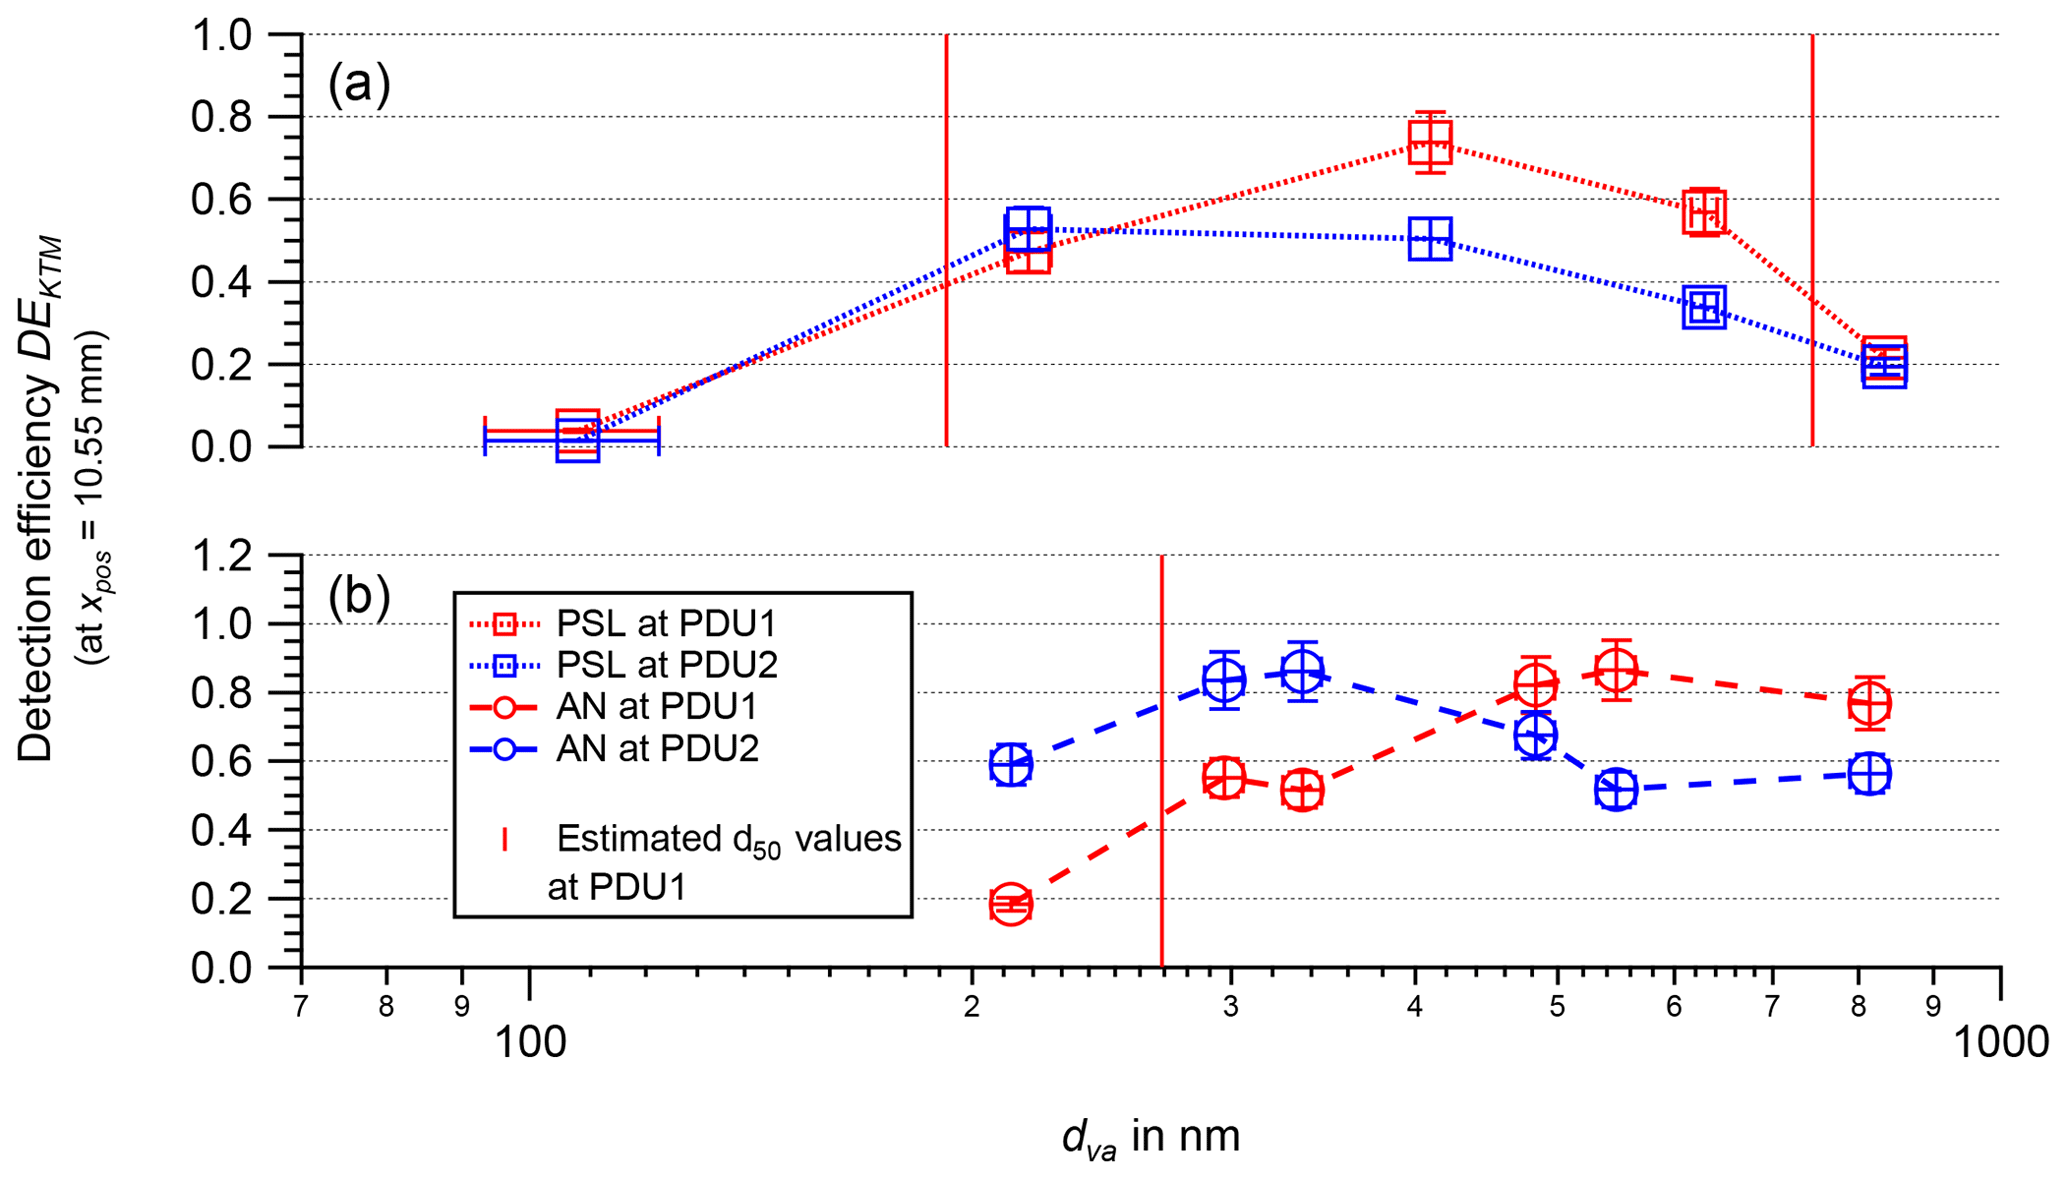
Figure 7Detection efficiency DEKTM as a function of particle size dva experimentally determined for PSL (squares, panel a) and AN (circles, panel b) particles measured at the detection units PDU1 (red) and PDU2 (blue) for the ADL setting during field deployment in Kathmandu, Nepal. The estimated d50 values (PDU1) are marked by vertical red lines. The uncertainties in DEKTM reflect the conservatively estimated value of 10 %.
Due to the size-dependent particle beam shift, and thus the DEmax for various particle sizes is found at various lens settings, a compromise for all particle sizes has to be found to adjust the ADL. To choose the optimum ADL position, AN particles with various sizes were measured with the ERICA-AMS at different ADL positions. The position that yields the highest mass concentration signal as compromise for all sizes is defined as the best ADL position. We found xpos = 10.55 mm as the optimum ADL position, which was subsequently applied during the field deployment in Kathmandu, Nepal (KTM). Figure 7 shows the optical detection efficiency during field deployment in KTM DEKTM as a function of the particle size dva at this specific ADL position. The calculations of the parameter DEKTM are based on Eqs. (2) or (S15) and are shown in Sect. S5.6 in the Supplement. Here, besides xpos = 10.55 mm, all other parameter values of the singly charged fraction were adopted from the curve-fitting results of the individual measurements. In Fig. 7a, the detection efficiency DEKTM of PSL particles is plotted as a function of the particle size dva. The graph shows an increase with particle size up to a maximum for DEKTM of 0.74 for a particle size of 410 nm. By interpolation, the lower d50 value at PDU1 is 190 nm and the upper d50 value is 745 nm. Due to the relatively low maximum DEKTM value for PSL measurements at PDU2 (0.53) compared to PDU1, the d50 values found at PDU2 (160 and 750 nm) are misleading. In Fig. 7b it can be seen that d50 exhibits a pronounced difference for particles with optical properties other than PSL such as AN. Except for the measurement with particle sizes of 213 nm at PDU1, all AN particle measurements (Fig. 7b) result in a DEKTM larger than 0.40 and reach their maximum here for particle sizes of 335 nm (PDU2) and 548 nm (PDU1), both having values around 0.86. Here, solely d50 can be determined for the measurement with AN particles at PDU1 to 270 nm.
The measurements demonstrated in this section have shown that detection efficiency varies with particle size and type. The efficiency of the optical detection strongly depends on the adjustment of the instrument as well as the optical and the aerodynamic properties of the particle.
3.2.3 Hit rate
Another relevant parameter to describe the performance of a single-particle laser ablation mass spectrometer is the hit rate HR. The definition of HR (see Eq. 5), also called ablation efficiency, is the number of acquired spectra Nspectra, i.e., particles successfully ionized by the ablation laser and recorded by the oscilloscope, divided by the number of laser shots Nshots, i.e., attempts to ablate particles (Su et al., 2004):
This definition is largely independent from ambient particle number concentration and the idle time of the laser but rather reflects the adjustment of the instrument. For each particle for which a laser shot is triggered, the aerodynamic particle size is determined by the TC. With the ERICA-LAMS, HR values of up to 1 (not shown) could be achieved in the laboratory for PSL particles of a certain size after optimizing the PMT thresholds and the pulse generator multiplier (see Sect. 2.3) value for the corresponding particle size. To assess on the smallest detectable particle size, the detection units PDU1 and PDU2 were optimized for the following experiment for PSL particles of 218 nm size.
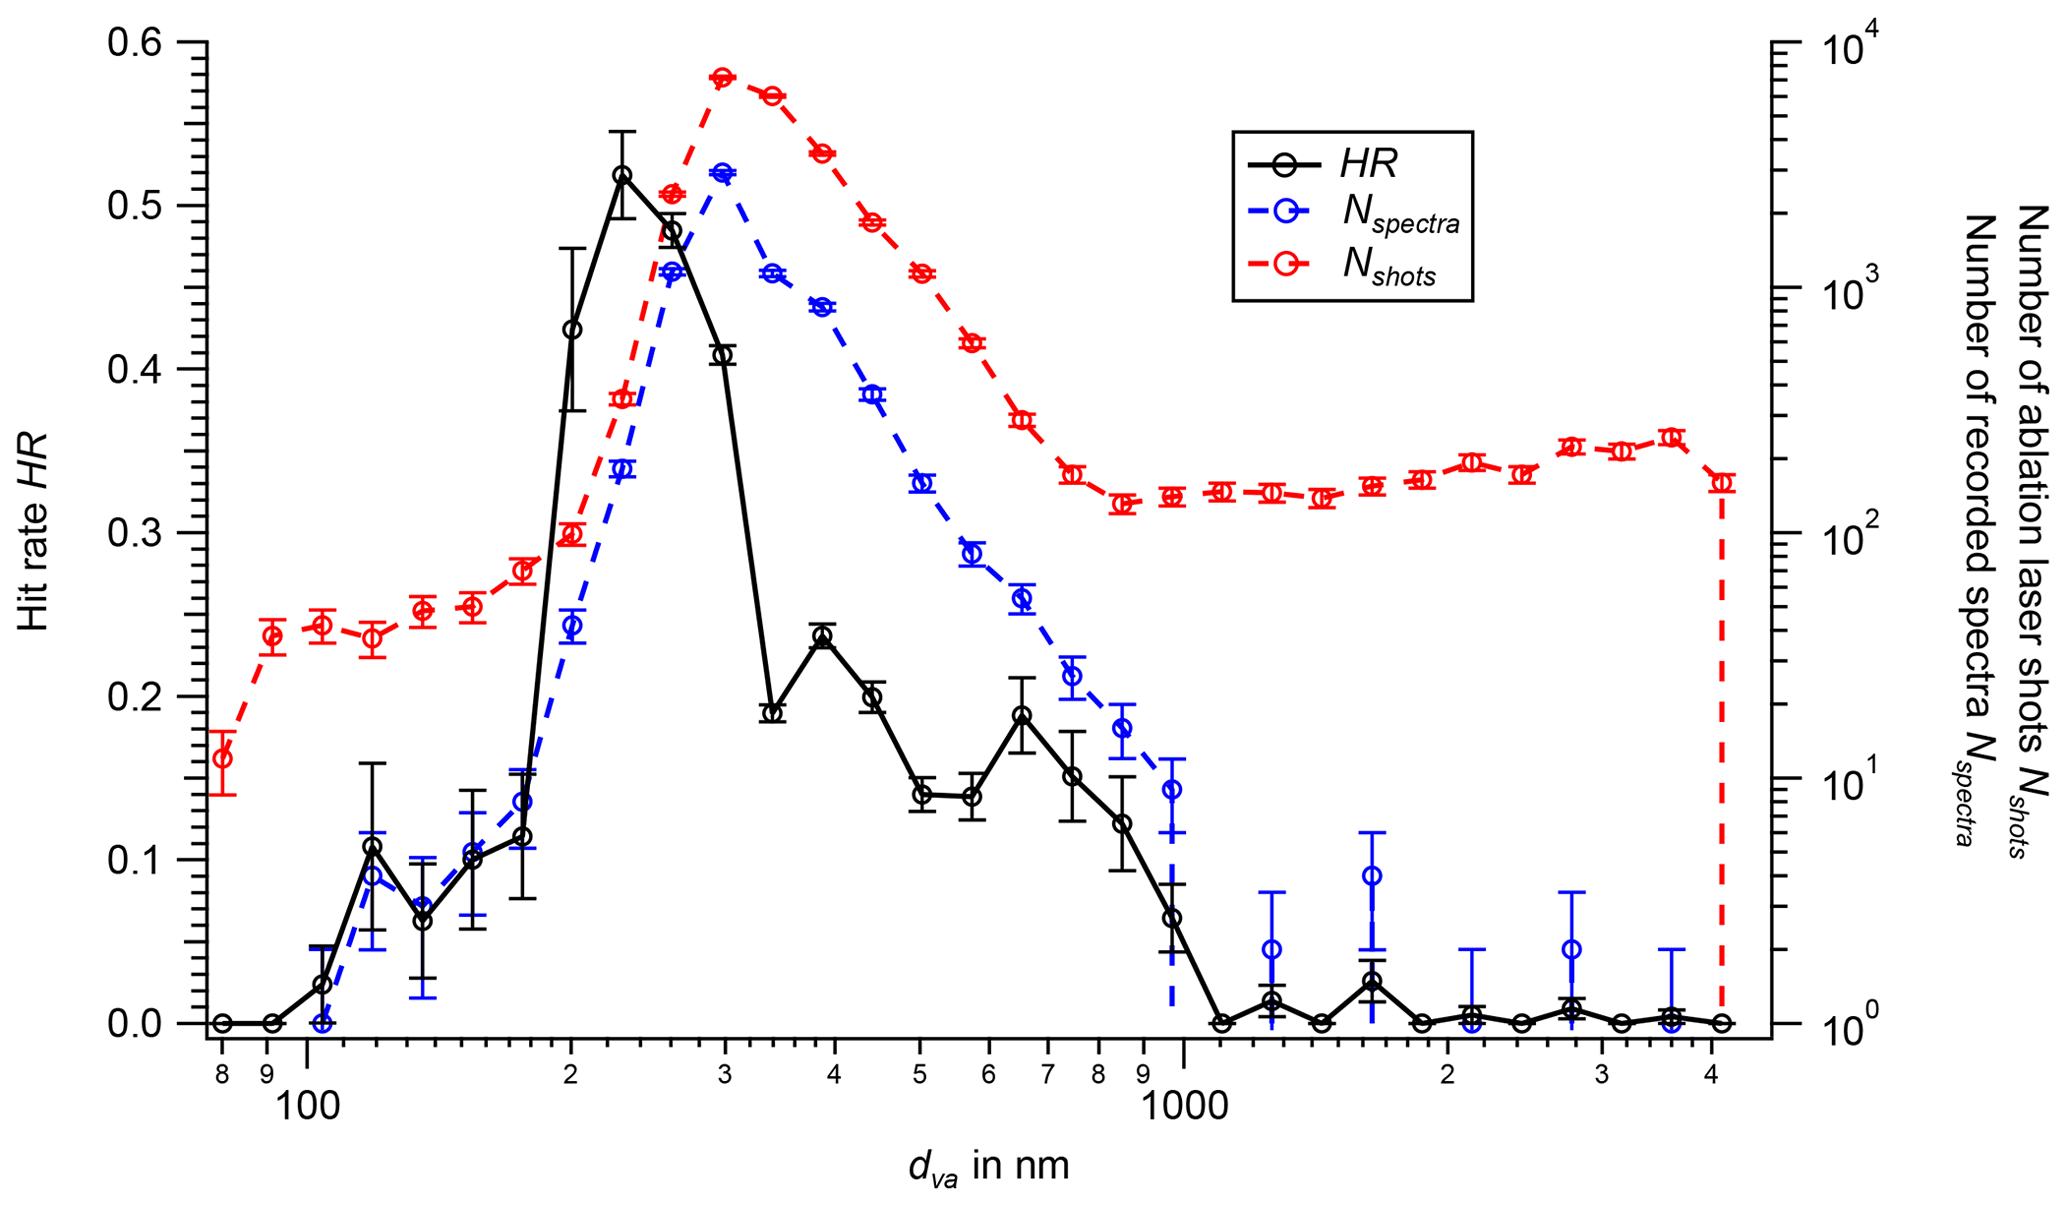
Figure 8The hit rate HR (black, left ordinate); the number of spectra Nspectra (blue, right ordinate, log scale); and the number of detected particles, i.e., ablation laser shots Nshots (red, right ordinate, log scale), as a function of particle size dva (logarithmic bin size) for ambient urban aerosol. Only the spectra with size information within the calibrated size range were processed (see Sect. S4 in the Supplement). Uncertainties in HR, Nshots, and Nspectra are based on counting statistics.
To determine the hit rate for ambient aerosol, ambient air from outside the laboratory was sampled. Only spectra of particles with diameters in the range of calibration (see Sect. S4 in the Supplement) were considered. The ablation laser was adjusted to the maximum HR for ambient aerosol, by varying the pulse generator multiplier and adjusting DM1 (Fig. 2). The average ablation laser pulse energy was 3.2 mJ. Figure 8 shows the HR of the described experiment as a function of the particle size dva. Furthermore, Nspectra and Nshots are plotted as a function of particle size. In the size range from 100 to 1000 nm, HR values of more than 10 % are achieved. At the particle sizes between 200 and 300 nm, at approximately 230 nm, a maximum of 0.52 was found. The reason for the maximum at this particular particle size might be the selected optimization in the adjustment of the detection and ablation units. Particles are detected by the PDU as soon as their scattered light is sufficiently intense. This might be earlier for larger particles due to the higher reff,L, and thus the timing might not be optimal for all particle sizes. In addition, a large particle beam divergence (see Sect. S5.7 in the Supplement) can lead to a low HR for small particles (dva < 200 nm) as well as for large ones (dva > 400 nm). This curve progression reflects the experimentally determined particle beam width wpart and the overlap parameter Sablation (see Fig. 5 in Sect. 3.1.2). Furthermore, the HR is less than unity over all sizes, which may be due to the ionization efficiency of particle components in the LDI process. Besides the particle size, HR also depends on the particle shape and the chemical composition of the particle (Su et al., 2004) as well as on the laser intensity of the ablation laser (Brands et al., 2011).
3.2.4 Single-particle mass spectra
Single-particle mass spectra from laboratory tests
To study mass spectra of different chemical compounds, solutions of sodium chloride (NaCl), ammonium nitrate (AN; NH4NO3), benz[a]anthracene (BaA; C18H12), and a gold-sphere suspension were nebulized. Details on the experimental setup, as well as on the properties of the studied particles, are provided in Sect. S3 in the Supplement. If not mentioned separately, all mass spectra were processed by the evaluation software CRISP (Klimach, 2012). During this processing, the mass-to-charge ratio ( of all spectra is calibrated and each peak area is integrated over 25 signal acquisition samples before and after the determined peak center. In the resulting so-called stick spectra, a stick reflects the ion peak area in units of millivolts of sample of the specific . To determine the ion peak area threshold of the ERICA-LAMS, i.e., minimum peak that can be detected, the data set of the first field campaign (see Sect. 4) was used. The ion peak area threshold is defined as the ion peak area at on which during ambient measurements typically no signals occur ( 2 to 6 for cations, 2 to 11 for anions). To determine the ion peak area threshold, the normalized cumulative signal intensity distributions for each usually unoccupied were made and the overall 99 % threshold was determined (Köllner et al., 2017). Below this ion peak area threshold, 99 % of the baseline noise is present (Köllner et al., 2017). The result for cations and anions is an ion peak area threshold value of 7 mV sample.
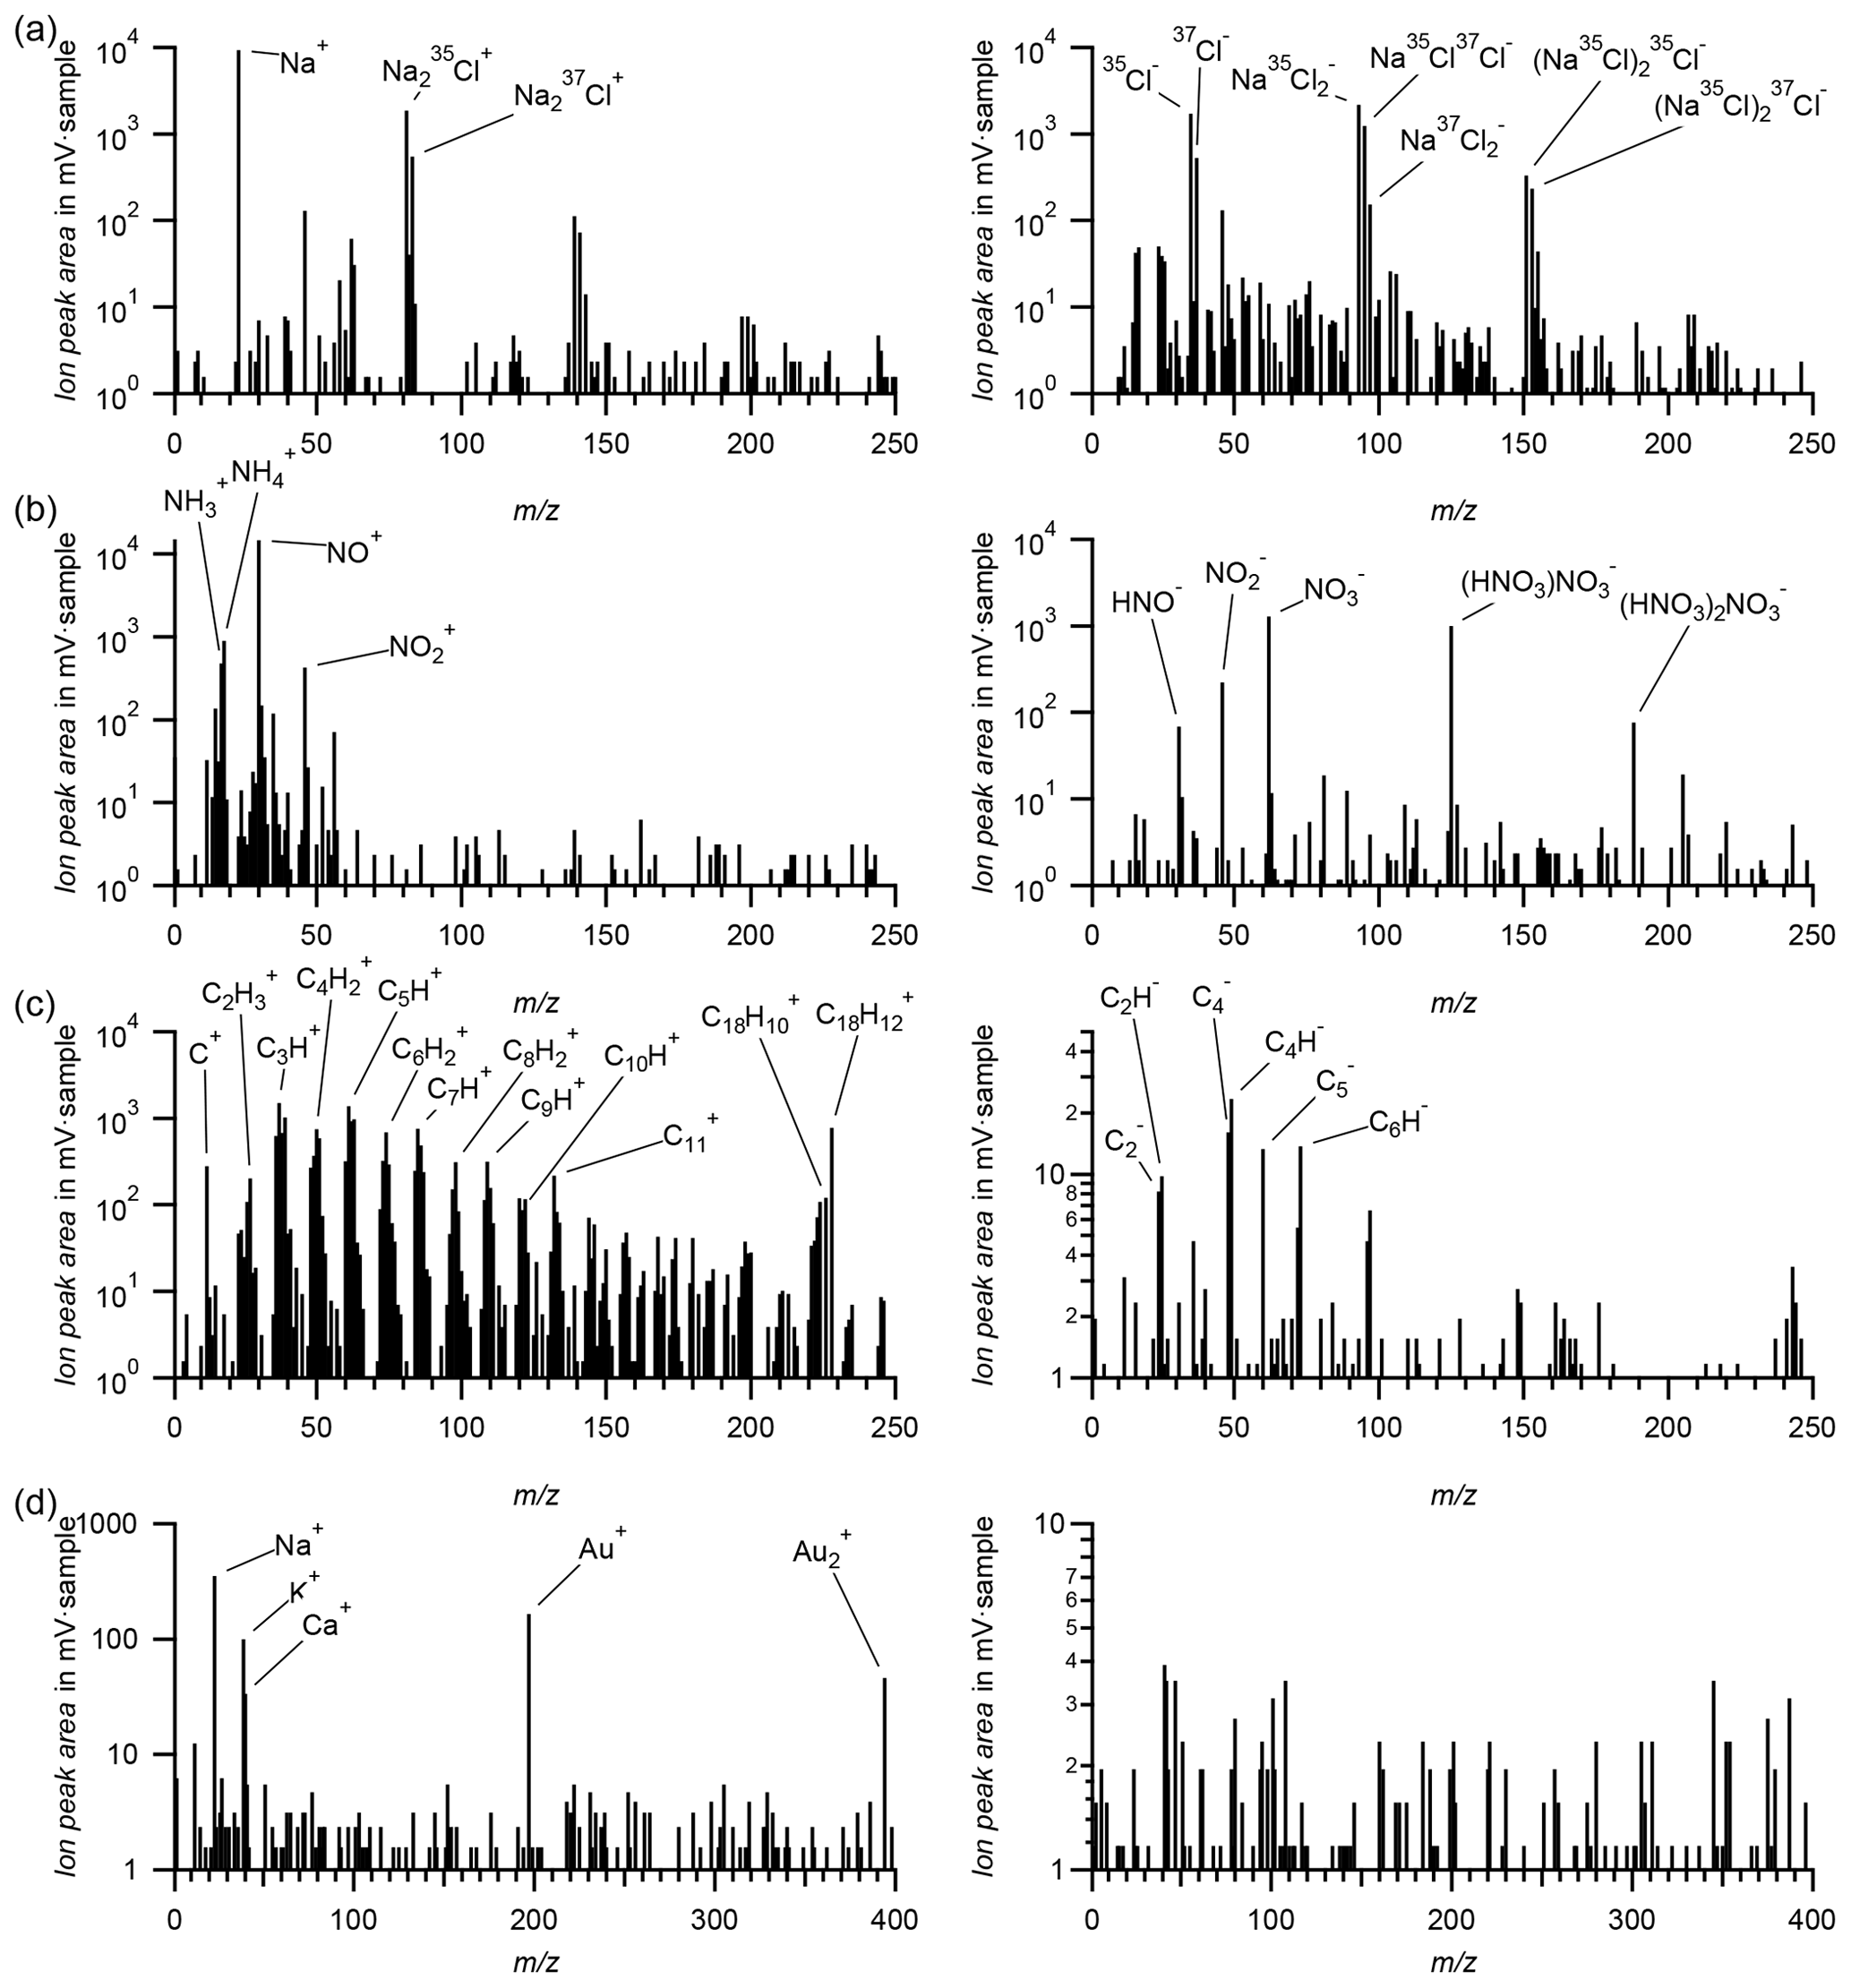
Figure 9Exemplary stick mass spectra () of four laboratory-generated single particles as measured by the ERICA-LAMS. Left: cations; right: anions. (a) NaCl particle; (b) AN particle; (c) benz[a]anthracene (BaA) particle; (d) gold particle (note the abscissa for panel d is up to 400; the anion shows no peak above the ion peak area threshold of 7 mV sample).
As an example, Fig. 9a presents a bipolar ion mass spectrum of a single sodium chloride particle as detected by the ERICA-LAMS during laboratory measurements. Other pure substance spectra are shown in Fig. 9b for a single AN particle. The spectral patterns detected by the ERICA-LAMS are comparable and in good agreement with results produced by other established single-particle mass spectrometers, e.g., the ALABAMA (Brands et al., 2011; Köllner et al., 2017), ATOFMS (Gard et al., 1997; Gross et al., 2000; Liu et al., 2000), and a modified LAAPTOF (Ramisetty et al., 2018). Also for ambient stratospheric particles, Schneider et al. (2021) have shown that spectra from the ERICA-LAMS and ALABAMA are comparable.
We further investigated BaA particles, as BaA has been identified as a component of soot (Lima et al., 2005). A characteristic example of their mass spectra is shown in Fig. 9c. Therein, the Cn and the CnHm pattern is clearly visible in both the cation and the anion spectra, being indicative of polycyclic aromatic hydrocarbons (PAHs; e.g., Hinz et al., 1999). Also, the molecular peak at 228 appears in the spectrum (C18H). This observation is consistent with the typical performance of mass spectrometers employing lasers with a wavelength of 266 nm, which results in less fragmentation as compared to those with a wavelength of 193 nm (Thomson et al., 1997). The four examples shown here demonstrate that the ERICA-LAMS provides valid single-particle mass spectra that are comparable to those of other instruments in the literature.
It is noteworthy that an important prerequisite for the later application of the ERICA during airborne measurements was the capability to detect the presence of gold particles in the sampled aerosols. Gold can be used as a marker for self-contamination. By plating the sampling inlet with gold, it can safely be assumed that if gold-containing particles are found, this indicates that they have removed material from the inlet (Dragoneas et al., 2022). To test the instrument's capability of measuring gold particles, dispersions of gold spheres (dva = 3860 nm) were used. A typical bipolar spectrum is displayed in Fig. 9d. In addition to the signal on 197 from the Au+ cation, the peak of the Au cation on 394 was consistently present, providing a good indication that actual gold particles were detected, even in the absence of an isotopic pattern or specific anion signal. The Na+, K+, and Ca+ signals in the spectra can be attributed to the residual buffer solution of the gold-particle dispersion. The identification of particle types for which the evidence is based on hardly ionizable substances, such as gold, is only possible if the content of well-ionizable substances is moderate (Reilly et al., 2000), since otherwise no Au signal might be obtained.
Mass spectral resolution
The mass spectral resolution RMS is a measure for the mass separation performance of the mass spectrometer and is defined as . The parameter ΔM is defined as the full width at half maximum of M, i.e., the value. Thus, a higher value of RMS indicates a better separation of the peaks in the mass spectra. Appropriate separation is particularly necessary for the identification of neighboring nominal masses like 39 and 40 (for K+ and Ca+) as well as for signals caused by isotopes, e.g., elements such as tin and lead. In Fig. 10, details of two different raw cation spectra from two ambient aerosol particles are presented. Here, the output voltage signal of the digitizer is displayed as a function of the digitizer sample number (1.6 ns per sample). The particles of the presented spectra were recorded during the StratoClim campaign (July and August 2017) at ground level at the airport of Kathmandu, Nepal. The signal intensities correspond to the isotopic abundance of tin (Fig. 10a) and lead (Fig. 10b). The occurrence of both species can be expected in a polluted environment as in Kathmandu, Nepal. Out of these mass spectra, RMS of the ERICA-LAMS can be estimated to be 200 for cations at 120 (Fig. 10a) and 700 at 200 (Fig. 10b). For anion spectra we found an RMS of about 600 at both 100 and 200. The RMS values of other single-particle mass spectrometers are comparable to the ones presented here. Brands (2009) states for the ALABAMA a resolution of 200 for cations of 108 and of 600 for anions of 120. The resolution of the A-ATOFMS (at 100) is 500 for cations and 800 for anions (Pratt et al., 2009). Without any specific value, Gemayel et al. (2016) state for the LAAPTOF an RMS of above 600 for both polarities.
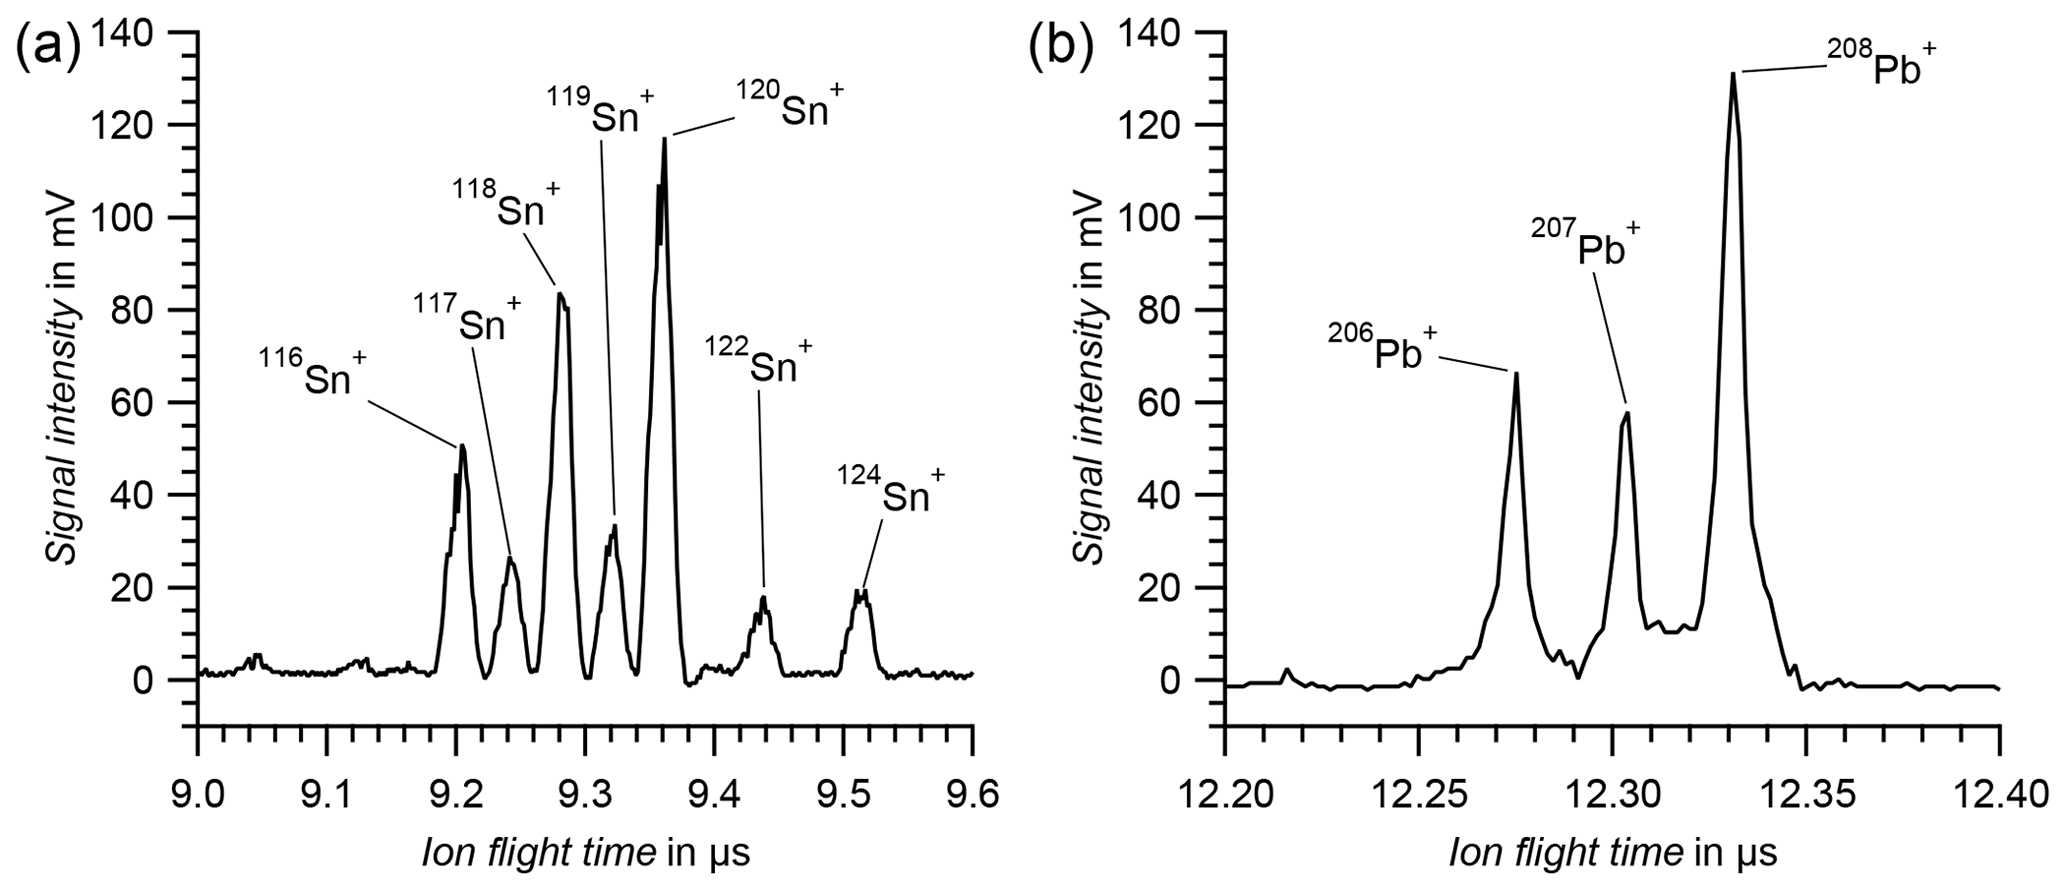
Figure 10Details of cation raw spectra (voltage output versus ion flight time in the B-ToF-MS) of two ambient single particles at the airport of Kathmandu, Nepal. (a) Tin isotopic pattern (dva = 277 nm). (b) Lead isotopic pattern (dva = 311 nm).
3.3 ERICA-AMS characterization
3.3.1 Mass spectral resolution and data preparation
The ERICA-AMS mainly adopts elements of the commercial AMS from Aerodyne (see Sect. 2.1). The observed mass resolution of 800 at 200 during ambient aerosol sampling (see Sect. S6 in the Supplement) is comparable with that of commercial C-ToF-MS instruments (Drewnick et al., 2005). The conversion of the ion flight time to an is done using predefined calibration peaks. We use the peaks for CH+, O, SO,182W+, 184W+, and 186W+, species for which the exact ratio is known and which occur in every spectrum due to their existence in the vacuum background or outgassing of the heated tungsten filament. The wide range of covered values allows us to fit a relation of the three-parameter time of flight to , which is then valid for the whole spectrum. The common Ar+ peak is not used because in measurements shortly after evacuating the chamber, the residual organic peak at the same nominal mass of 40 can disturb the determination of the peak center. The software integrates the signal at each particular ratio to generate a stick spectrum. The signal occurring between the peaks is used to estimate a baseline, which is subtracted during this integration. Stick spectra are generated for measurements with open and closed shutters to subtract the instrument background signal from the aerosol measurement signal in order to obtain the aerosol contribution only. The difference between the total and the background signal results in the aerosol signal. The open–closed cycle is set to 10 s (see Sect. 2.4). A so-called “fragmentation table” is used to attribute the individual peaks to certain species (air, organics, nitrate, sulfate, ammonium, and chloride; Allan et al., 2004). The fragmentation table can be manually adapted to compensate for instrument-specific deviations. Along with the particles, a small fraction of the gaseous components are measured, which still exhibit the most dominant peaks at 28 (N2), 30 (O2), and 40 (Ar) in the mass spectrum (see Fig. 11). A more detailed description of the evaluation procedure can be found in, e.g., Allan et al. (2004) and Fröhlich et al. (2013).
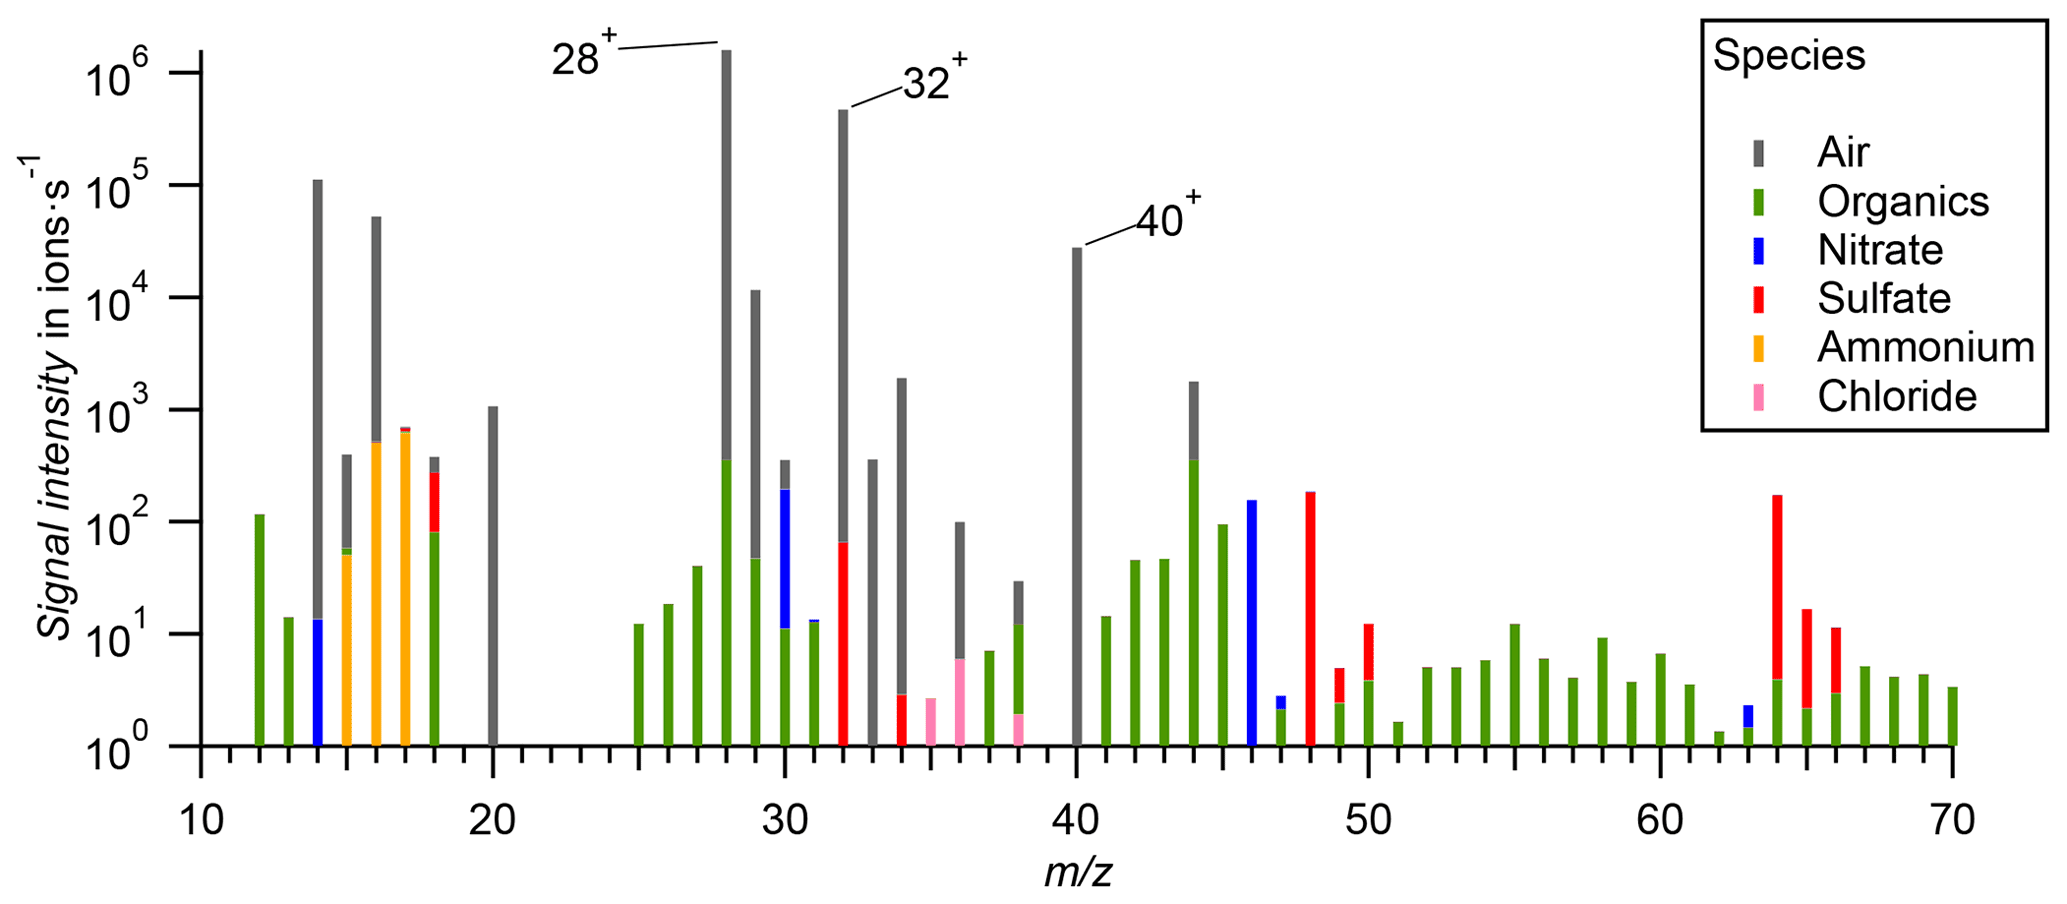
Figure 11Example of an ambient aerosol average spectrum collected during the field campaign in Kathmandu, Nepal (averaged over the entire campaign period). Cumulative species (air, organics, nitrate, sulfate, ammonium, and chloride) colored according to their fraction in the applied fragmentation table.
3.3.2 Particle mass detection efficiency
Similarly to the determination of the optical detection efficiencies for PSL and AN particles at PDU1 and PDU2 (see Sect. 3.2.2), the particle mass detection efficiency for AN particles was determined at the ERICA-AMS vaporizer for two cases: DEmax and DEKTM. Like with the optical detection efficiency, DEmax and DEKTM combine the particle mass detection efficiency measurements with AN particles described in Sect. 3.1.1 (see also Sect. S5.6 in the Supplement).
The parameter DEmax was determined for each measurement at the ERICA-AMS vaporizer by re-inserting the determined set of parameters (reff,V, σ, x0, and Ascan) of each curve fitting in Eq. (S17).
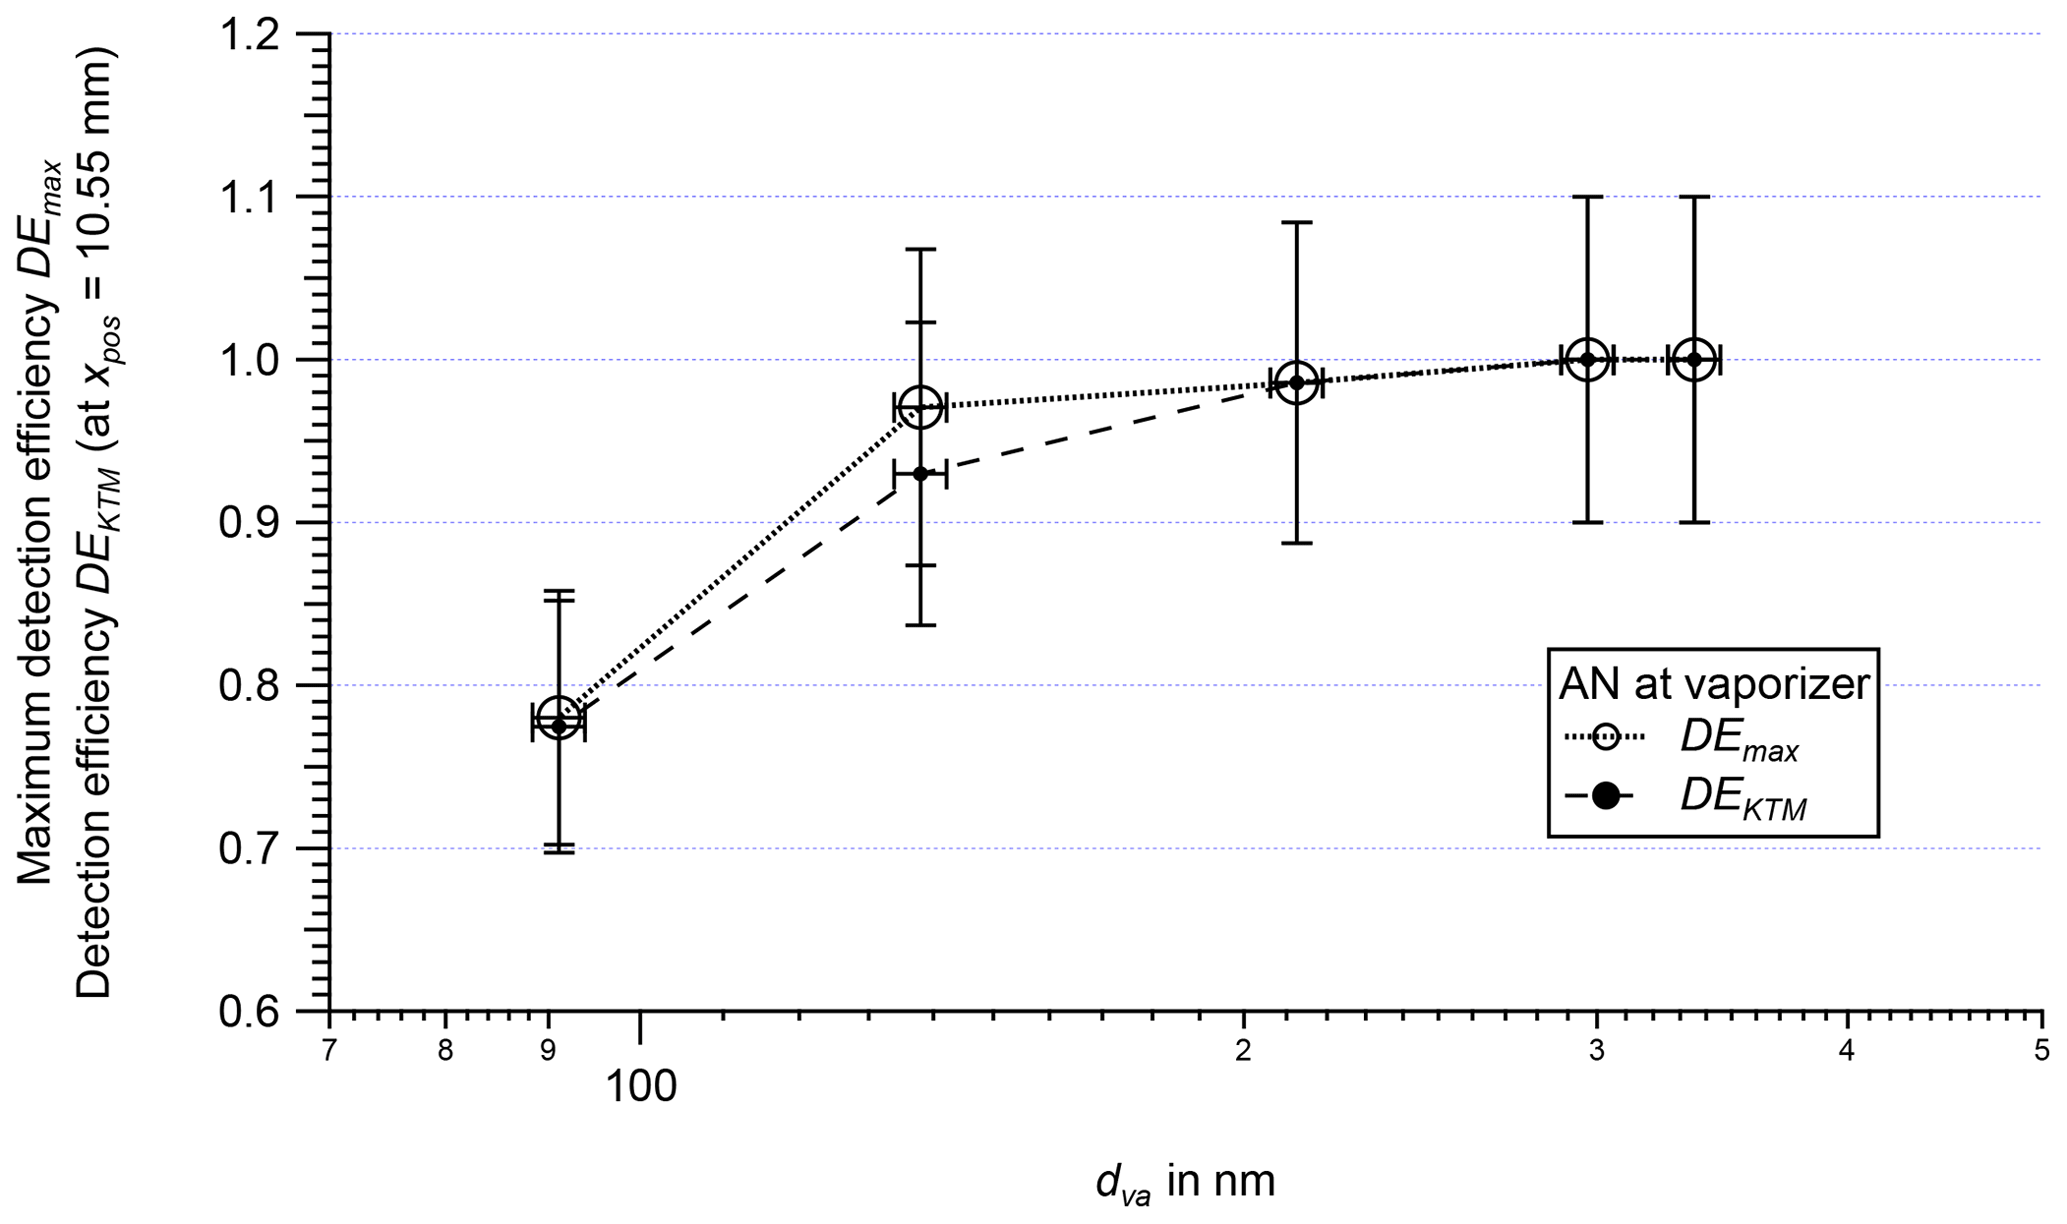
Figure 12Maximum detection efficiency DEmax (non-filled markers) and the detection efficiency DEKTM (filled markers; ADL setting during field deployment in Kathmandu, Nepal) as a function of particle size dva experimentally determined for AN particles measured at the ERICA-AMS vaporizer. The d50 values of the AMS measurement lie outside the applied particle range. The uncertainties in DEmax and DEKTM reflect the conservatively estimated value of 10 %.
Figure 12 presents the maximum possible particle mass detection efficiency DEmax at ADL position x0 as a function of the particle size dva. The DEmax values found for the measurements at the ERICA-AMS vaporizer are not comparable in absolute terms with the DEmax values found for the AN measurements at PDU1 and PDU2 (Fig. 7) since the measurements at the position of the ERICA-AMS vaporizer are analogous to an ionization efficiency (IE) calibration measurement (see Sect. 3.3.3). During this IE calibration, among other losses, the transmission losses in the ADL are compensated for. However, this measurement on the ERICA-AMS vaporizer demonstrates that the decreasing DEmax values for smaller sizes at the PDUs are caused not by losses in the ADL but by the inability to detect small particles by adopted optical means. No d50 value could be determined for the measurements on the vaporizer. Even though the data point at 91 nm indicates a lower d50 cutoff, we assume that the particle size range in which the ERICA-AMS can measure is between ∼ 120 and 3500 nm, as specified by Xu et al. (2017) for the ADL type used here.
Figure 12 also shows the particle mass detection efficiency during field deployment in KTM DEKTM as a function of the particle size dva at the ADL position xpos = 10.55 mm. The calculations of the parameter DEKTM are based on Eq. (S17) and are shown in Sect. S5.6 in the Supplement. For the measurements at the vaporizer, no d50 values can be determined because the results are above 50 % of their maximum DEKTM values over the entire size range. The DEKTM at the vaporizer is 1 due to the normalization by the IE calibration, as explained above (see also Sect. 3.3.3).
Overall, the AMS part shows a fairly stable efficiency around 1 for the examined size range after calibration with AN particles of 483 nm in size. This is highly desirable to ensure the quantitative measurement of the AMS.
3.3.3 Ionization efficiency
By means of a calibration with a test aerosol of AN, the IE can be determined and the peak areas obtained from integration can be converted into a quantitative measure of the aerosol mass concentration of the atmosphere. In order to determine the IE of the ERICA-AMS, in a first step the average signal of a single ion must be measured. This is done by considering single mass spectrum extractions. The assumption is that a rarely occupied signal has a very low probability of experiencing the arrival of two ions in the same extraction. The peak area of these signals, averaged over multiple events where the signal is above the noise threshold, then represents the average single-ion signal (SIS). The SIS is given in units of millivolt nanoseconds (mV ns) and depends on multiple factors, mostly the type and condition of the MCP detector, the applied high voltages and the resulting field strengths, the temperature, and the gain of the signal amplifier. After voltage adjustment of the MCP a SIS of around 0.8 mV ns was obtained.
The IE is determined with AN particles applying Setup B as described in Sect. S3 in the Supplement (Fig. S8). The so-created monodisperse aerosol is sampled by the instrument as well as by a CPC for reference. This mass-based approach is similar to the one described in Drewnick et al. (2005) and considers the transmission efficiency through the ADL and the possible losses due to particle beam divergence. As a reference zero, a measurement through a filter is performed. The IE calibration factor in Tofware is then adjusted so that the nitrate signal equals the nitrate mass load determined by the CPC. To calculate the mass load from the CPC data, several corrections have to be applied. For instance, doubly charged particles of a larger size are also transmitted through the DMA due to the same electrical mobility, which will also contribute to the mass load. To reduce this effect, we choose a rather large particle size of 483 nm for the calibrations so that the corresponding larger-sized particles of 814 nm are not generated by the nebulizer in a high quantity. By measuring the concentration of singly charged 814 nm particles and calculating the charge ratio generated by the neutralizer according to Tigges et al. (2015), we correct for the effect of doubly charged 814 nm particles (see Sect. S5.3 in the Supplement). In addition the Jayne shape factor has to be applied (Jayne et al., 2000). The IE is usually given for nitrate and is strongly dependent on the flux of electrons for ionization. The ERICA achieves an IE of 2000 ions pg−1, or 2.05 × 10⁻⁷ ions per molecule. This is lower than reported for the Aerodyne AMS (Canagaratna et al., 2007), partly due to operation at a lower filament emission current of 1.6 mA. Other test aerosol species can be used to determine a species-dependent relative ionization efficiency (RIE). The RIE of ammonium and the RIE for sulfate were determined by independent measurements of AN particles and ammonium sulfate particles according to Canagaratna et al. (2007). An averaged of 4.4 and of 0.97 were calculated. The default RIE values of the organic compounds (RIEorg=1.4) and for chloride (RIEChl=1.3) and for nitrate () were adopted from Canagaratna et al. (2007).
With the IE and RIE values, the ion count signal can be converted into an aerosol mass. Together with the known flow into the instrument (ΦERICA = 1.48 cm3 s−1), the mass concentration of the particulate matter is calculated (Canagaratna et al., 2007). Due to the installed constant pressure inlet (Molleker et al., 2020), which keeps the pressure in the ADL constant, the volumetric flow into the instrument increases with decreasing ambient pressure. With the assumption of a stable instrument temperature, this leads to a constant mass flow or normal flow (NTP, 20 ∘C and 1013 hPa). Thus, the dimension of the measurement result is mass per normal volume.
3.3.4 Detection limits
Several methods can be used to determine the detection limit (DL) for the species measured by an AMS as described by Drewnick et al. (2009). One approach is the calculation based on the ion-counting statistics during a measurement with the shutter closed (closed signal), denoted as DLstat. The most common approach is a measurement of the signal noise during a measurement of filtered air, denoted as DLfilter. Especially during in-flight measurements, this filter-based method cannot be representative of the whole flight due to changing vacuum, temperature, and instrument background conditions. Thus, for field measurements a detection limit DLspline was calculated from the closed signal after applying a spline-based detrending method comparable to Schulz et al. (2018) and Reitz (2011). In each case the DL is defined as 3 times the standard deviation of the respective signal. The detection limits of all species are given in Table 1 for each method. The statistical approach as well as the filter-based method is based on a long-term filter measurement in the lab, while DLspline was determined from the measurements during the StratoClim 2017 campaign. The differences are reasonable because DLstat does not consider interferences with other species, especially water and air, whereas DLspline was measured under different conditions regarding pumping time and consequently instrument background. The detection limits are slightly higher than reported for other airborne instruments (e.g., Schulz et al., 2018) due to not only a different time basis but also a rather strong air beam signal in our instrument (see Sect. 3.3.5).
Table 1Detection limits of the species measured by the ERICA-AMS determined with several methods. DLstat and DLfilter measured under lab conditions. DLspline measured during the StratoClim field campaign. The limits are given for one measurement cycle (10 s) and are expected to reduce with longer averaging times t proportionally to .
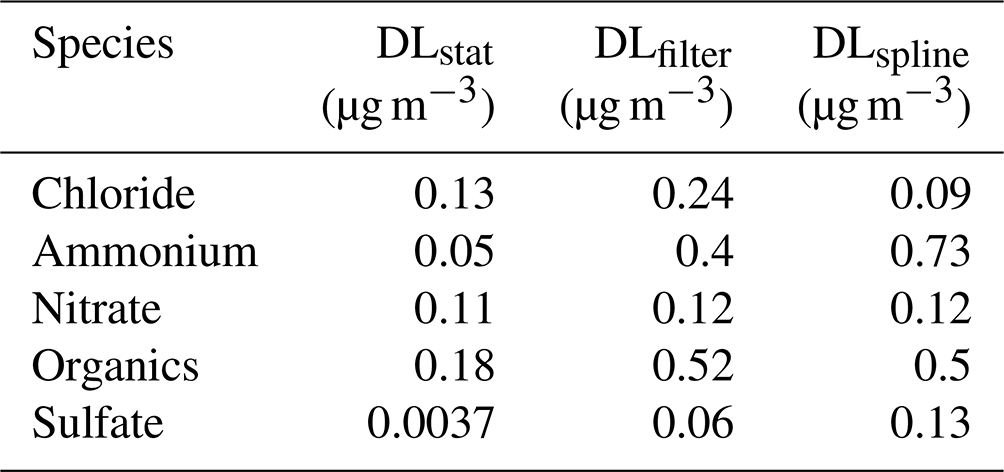
3.3.5 Air beam and water signal
The ADL is supposed to focus particles into a narrow beam into the vacuum chamber while the air molecules are strongly diverging after the end of the lens. However, some of the air is also propagating towards the ion source and generates ions at ratios of 14 (N+), 16 (O+), 28 (N), 32 (O), 40 (Ar+), and 44 (CO) as well as the corresponding isotopes. This signal, the so-called “air beam” signal, can on one hand be used for diagnostic purposes but on the other hand introduces uncertainties into measuring particle signals at the corresponding . An air beam signal as small as possible is thus desirable, e.g., to reduce the detection limit of aerosol species. In the ERICA-AMS, we experienced a rather strong air beam signal of around 2.9 × 10⁶ ions s−1 (see Fig. 11). This is larger than reported by Canagaratna et al. (2007) (1.5× 10⁶ to 2.5 × 10⁶ ions s−1), with a 5-fold higher IE value at the same time. We found out that the reason lies in the assembly of the ERICA. Since the front part of the instrument was optimized for laser ablation mass spectrometry, a rather large conical skimmer with an inner diameter of 1.9 mm was built in after the ADL for the separation of air and particles. While this causes no problem for the laser ablation part, it leads to a substantial transfer of air molecules towards the following stages of the vacuum chamber. For improvement, a newly designed skimmer with an opening of 1 mm and a channel of 21.5 mm length was implemented in order to reduce the air beam signal by a factor of 6.7, resulting in 4.4 × 10⁵ ions s−1. Since this skimmer was implemented in 2019, earlier campaigns, like StratoClim 2017, were conducted with the large air beam signal. Additionally, interferences of particle signals with the signal of residual water influence the detection limit of ammonium. Here, the background water vapor in the vacuum plays a role. We experience an intense water signal of 2.5 × 10⁶ up to 1 × 10⁷ ions s−1 depending on instrument temperature and pumping time. This water signal occurs independently of the shutter position and thus does not directly relate to the air beam streaming into the instrument but to the background vacuum conditions.
The first field deployment of the ERICA was during an aircraft field campaign as part of the StratoClim project. The main objective of the StratoClim project was to produce more reliable predictions of regional and global climate change through a better understanding of key microphysical, chemical, and dynamical processes in the UTLS of the Asian monsoon (Rex et al., 2016; http://stratoclim.org, last access: 21 February 2022). During the two aircraft field campaigns (43 flight hours), over 150 000 single-particle mass spectra were recorded and the ERICA-AMS provided reliable data for about 31.2 h. By means of a satellite communication link to the operators (Dragoneas et al., 2022), the time of data losses could be kept low with 29 min for the ERICA-AMS and 39 min for the ERICA-LAMS. The first aircraft campaign took place in Kalamata, Greece, in August and September 2016 and the second in Kathmandu, Nepal, in July and August 2017. The high-altitude research aircraft M-55 Geophysica served as platform for these campaigns. During its first deployments, the instrument was fully automated and operated during 11 research flights from ground pressure and temperature to 20 km altitude at 55 hPa and ambient temperatures as low as −86 ∘C. It was the first time that bipolar single-particle mass spectra were measured at altitudes above 16 km. Also, the ERICA-AMS was the first AMS-type mass spectrometer that was successfully deployed to measure at such high altitudes. The analyses of the research flight data presented in this study serve to provide a proof of concept for the ERICA, as well as to document its operational reliability and performance, without the purpose to provide details on the results connected with the scientific objectives. Detailed results from the aircraft field campaigns can be found, for example, in Höpfner et al. (2019), Schneider et al. (2021), and Appel et al. (2022). In the following, data examples from the second aircraft campaign of StratoClim 2017 in Kathmandu (KTM) are shown.
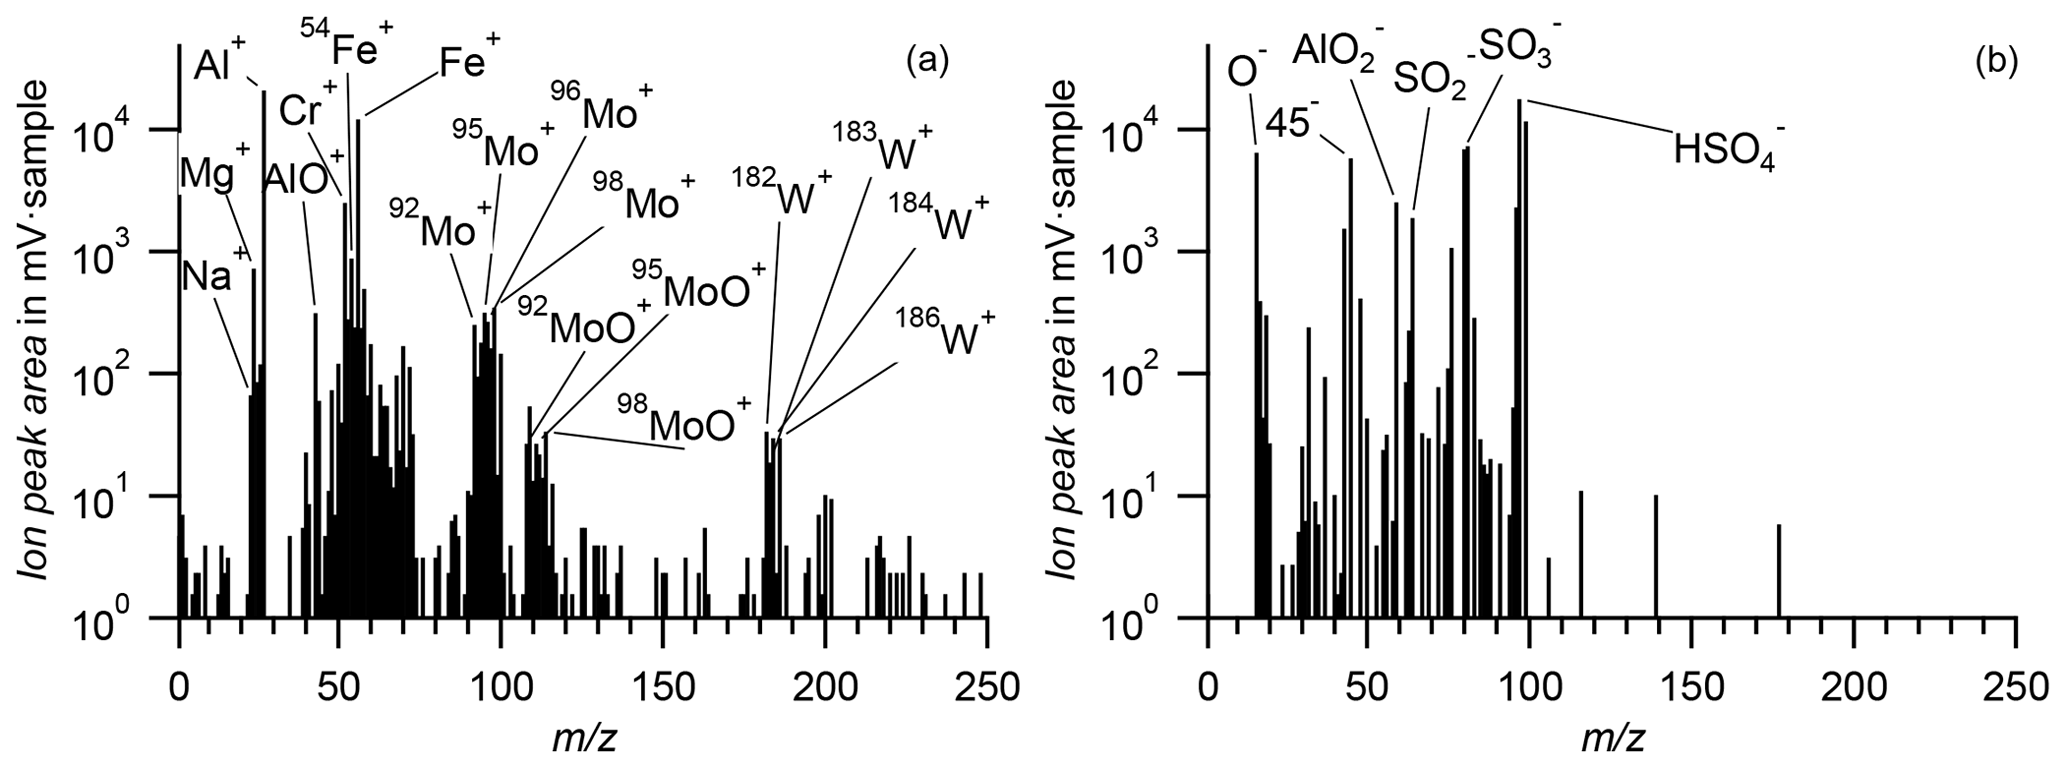
Figure 13Exemplary single-particle stick spectrum recorded during StratoClim 2017 demonstrates the feasibility of identifying metallic isotopes. (a) Cations; (b) anions. This particle containing heavy metal and sulfate was measured at an altitude of 20 402 m (29 July 2017, 06:09:34 UTC, dva = 602 nm).
A selected bipolar single-particle mass spectrum containing heavy metal signatures is presented in Fig. 13. The mass spectrum shows signals of light metals like sodium, magnesium, aluminum, and calcium, showing that the ERICA-LAMS is able to identify metals by their isotopic patterns. Furthermore, sulfate fragment ions and heavy metal ions of chromium, iron, molybdenum, and tungsten are present. The identification of iron, molybdenum, and tungsten was done by comparing the signal intensity patterns with those of the natural abundance of the isotopes of the elements. The presence of molybdenum could be confirmed by signals for MoO+, which has the same isotopic ratio as Mo+. This particular mass spectrum was recorded at an altitude of ∼ 20 km (a.m.s.l.) on 29 July 2017. Attributing this single particle to a certain source is difficult. However, an anthropogenic source as an exhaust of an aircraft engine, in which tungsten–molybdenum alloys are in use (Guan et al., 2011), is conceivable due to its heavy metal signals.
We use the hit rate (HR; see Sect. 3.2.3 for definition and limitations of the HR) as a function of altitude to determine whether the ERICA-LAMS can measure over the entire altitude range sampled. The parameter HR is instrument specific and independent of both the aircraft residence time and ambient particle number concentration. Figure 14 shows the HR vertical profile for the entire second aircraft campaign in 500 m bins. Here, the HR values are between 0.1 and 0.3 over the entire altitude range. At maximum altitude, the HR is 0.24. These results demonstrate that single-particle mass spectra can be recorded both on the ground and at altitudes up to more than 20 km. Variations in HR values may be due to differences in aerosol composition, size, and shape at different altitudes (Su et al., 2004; Brands et al., 2011). In addition to the HR, the number of recorded single-particle mass spectra Nspectra and the number of ablation laser shots Nshots also show that mass spectra can be recorded in all sampled altitude ranges (up to 20.5 km; Fig. 14). However, Nspectra and Nshots depend on the residence time of the aircraft at the respective flight altitude, which was long at altitudes above 15 km and also below 5 km.
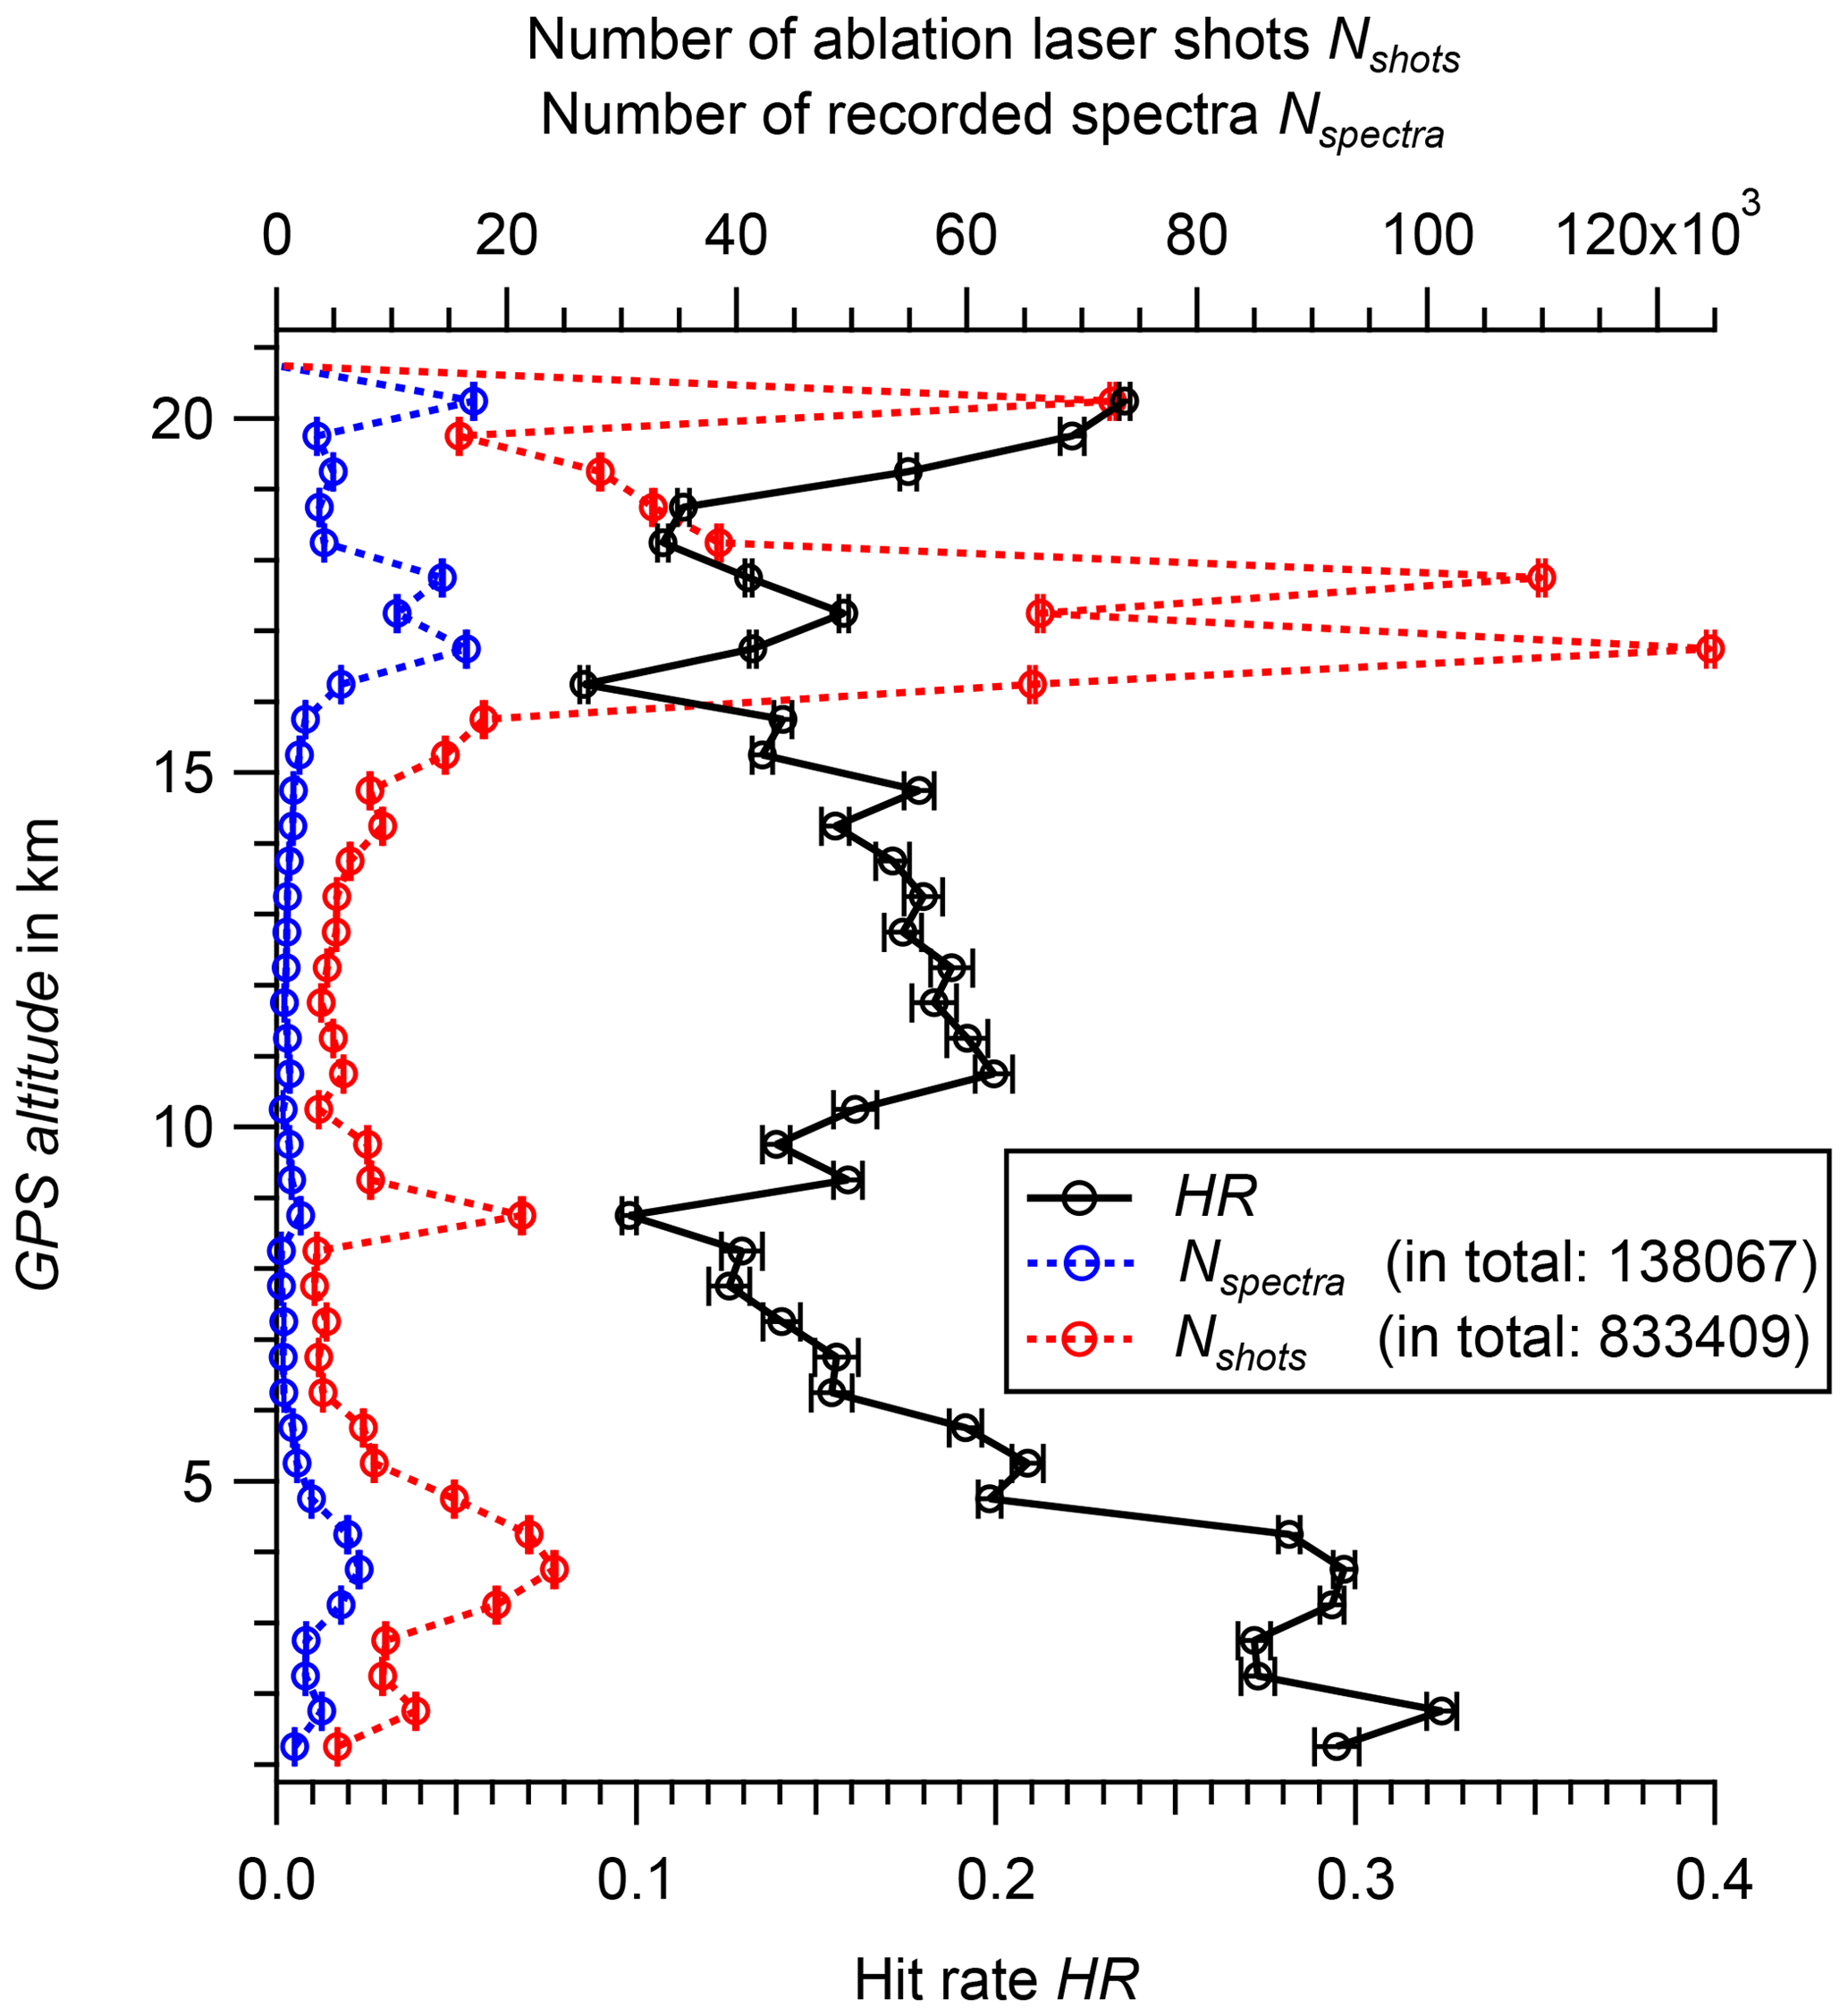
Figure 14Vertical profile of the hit rate HR (black, bottom abscissa), the number of recorded spectra Nspectra (blue, top abscissa), and number of ablation laser shots Nshots (red, top abscissa) for the entire second aircraft campaign in 500 m bins. Uncertainties in HR, Nspectra, and Nshots are based on counting statistics.
After demonstrating that it is possible to measure with the ERICA at flight altitudes up to about 20 km, in the following we show that aerosol species known in the literature can be identified with both the ERICA-LAMS and the ERICA-AMS. The evaluation of the data was carried out separately for the ERICA-LAMS and the ERICA-AMS. For the ERICA-AMS, the species reported in Sect. 3.3.1 were quantified. To determine specific particle types of the single particles, the ERICA-LAMS data set was processed with the software CRISP (Klimach, 2012) using the k-means clustering algorithm as described in Roth et al. (2016). In this processing, all single-particle mass spectra were pre-sorted into a predefined number of so-called clusters and then manually combined into meaningful particle types. With this approach, two particle types (in addition to other particle types not included in this publication) well described in the literature were found: a meteoric-material-containing (e.g., Schneider et al., 2021) and an elemental carbon (EC)-containing particle type (e.g., Pratt and Prather, 2010).
To identify the sulfate-containing particle type, the ERICA-LAMS data set was filtered for single-particle spectra that contained sulfate marker signals at −96 (SO) or −97 (HSO) or both markers. Since these sulfate marker signals are also found in the meteoric-material-containing particle spectra, by this approach, the meteoric-material-containing particle type is a subtype of the sulfate-containing particle type. In the following, first, we focus on the aerosol composition at high altitudes (> 10 km), considering particulate sulfate as well as the meteoric-material-containing particle type.

Figure 15Vertical profile (flight on 4 August 2017) of (a) the particle number fraction of sulfate-containing single particles (black; ERICA-LAMS), (b) the mass fraction of sulfate (red; ERICA-AMS), and (c) the particle number fraction of meteoric material-containing single particles (gray; ERICA-LAMS). The vertical resolution is in altitude bins of 500 m. The uncertainties in the particle number fraction are calculated from counting statistics. The uncertainty in the mass fraction is based on the background measurement and was propagated for the mass fraction. The dashed horizontal blue line marks the cold-point tropopause (CPT).
Figure 15a shows the vertical profile of the particle number fraction of the sulfate-containing single particles. It has to be noted that the ERICA-LAMS is capable of measuring sulfate species of non-refractory and refractory types but cannot distinguish between both types. A particle number fraction is the fraction of a particle type out of all mass spectra recorded in the respective altitude bin (bin size 500 m). In the vertical profile of the research flight of 4 August 2017, a large number fraction of about 0.6 of the sulfate-containing single particles can be seen between 10 and 17 km (ERICA-LAMS), which increases with higher altitudes up to a maximum value of 1.
Non-refractory sulfate (Canagaratna et al., 2007) measured by the ERICA-AMS consists mainly of pure sulfuric acid in the stratosphere (Murphy et al., 2014). The mass fraction is the calculated fraction of the mass concentration of sulfate over the total mass concentration determined by the ERICA-AMS for each altitude bin. In Fig. 15b, the vertical profile of the sulfate mass fraction is depicted. The profile shows an enhancement, above the cold-point tropopause (CPT; 17 km), at altitudes starting at 17.5 km. At 20 km altitude, the non-refractory aerosol sulfate mass fraction is 1. A high sulfate mass fraction can be expected due to the proximity of the Junge layer, where the aerosol particles mainly consist of pure sulfuric acid (Junge and Manson, 1961; Murphy et al., 2006b). Since no other species, such as nitrate or organics, were observed by the ERICA-AMS in significant amounts at this altitude, the convective and radiatively driven vertical transport within the Asian monsoon anticyclone (AMA; Ploeger et al., 2015) does not play as much of a role here anymore, as further detailed below.
As identified and described by Murphy et al. (1998) and Cziczo et al. (2001), the meteoric-material-containing particle type is characterized by a high abundance of magnesium (Mg+, isotopes at 24, 25, and 26) and iron (Fe+, isotopes at 56 and 54) signals in the cation spectrum and of sulfate (HSO at −97) in the anion spectrum. The occurrence of the described characteristic signals in the single-particle mass spectra of the ERICA-LAMS and the dominant presence of the meteoric-material-containing particle type at high altitudes (> 17 km) were already described by Schneider et al. (2021). The mean spectrum can be found in Sect. S7 in the Supplement. Figure 15c exemplarily shows the abundance of meteoric material in the vertical profile of the research flight on 4 August 2017 in the particle number fraction of the meteoric-material-containing particle type. The particle number fraction is larger than 0.6 above 19.5 km and reaches its maximum of 0.8 at the maximum flight altitude of the research flight. The increase in particle number fraction of the described meteoric particle type at high altitudes is also described for measurements with other mass spectrometers, like PALMS (Murphy et al., 2014) and the ALABAMA (Schneider et al., 2021). Furthermore, similar particle number fraction values of up to 0.6 were also reported for a similar particle type recorded in the mid-latitude stratosphere by Murphy et al. (2014). The demonstrated results of the meteoric-material-containing particle type can be considered an indication of the reliable operation of the ERICA-LAMS at high altitudes such as up to 20 km.
The measurements of the two instrument parts, the ERICA-LAMS and ERICA-AMS, were evaluated separately, and the derived results complement each other. Pure sulfuric acid cannot be ablated with the frequency-quadrupled Nd:YAG laser (wavelength 266 nm) used in the ERICA-LAMS because light of this wavelength is not efficiently absorbed by the particles (Murphy, 2007). Vice versa, the meteoric particles consist of refractory components that can be detected by the ERICA-LAMS but not by the ERICA-AMS. The analyses presented here as examples show that the ERICA can be used by means of the two complementary measurement methods to measure aerosol components, such as sulfuric acid and meteoric material, that are significantly present in the stratosphere.
The results can also be used to show that the aerosol composition and mixing state between 10 and 17 km differ from those above 17 km. For this, the mass fraction of sulfate (ERICA-AMS) and the number fraction of sulfate-containing single-particle spectra (ERICA-LAMS) were examined (Fig. 15). Below 17 km, the number fraction of sulfate-containing single-particle spectra is stable at around 0.6 and the mass fraction of sulfate in the non-refractory aerosol is less than 0.2. This indicates that many particles contain sulfate, although typically only in a small mass fraction (about one-third on average), because they are internally mixed with nitrate and organics. Above 17 km, with increasing altitude, the sulfate mass fraction and the particle number fraction of sulfate-containing single particles both increase up to 1. The observed change in the mass fraction is stronger compared to the increase in the number fraction of sulfate-containing single particles. Since the two measurement methods not only provide different views on the aerosol but also have different limitations, this observation must be interpreted with care. A possible interpretation for the increasing sulfate mass fraction could be that within the internally mixed aerosol of particles containing a refractory core, e.g., of meteoric dust, and a sulfuric acid coating (Murphy et al., 2014), the coating grows as a consequence of further condensation. However, since the ERICA-LAMS is not capable of measuring pure sulfuric acid particles (Murphy, 2007), it is also possible that partial external mixing of the internally mixed particles with sulfuric acid particles causes this observation.

Figure 16Data from the research flight on 8 August 2017 during StratoClim, Nepal. The vertical resolution is in altitude bins of 500 m. The horizontal blue line marks the cold-point tropopause (CPT). The Asian tropopause aerosol layer (ATAL), the free troposphere (FT) and the boundary layer (BL) are indicated. (a) The mean mass spectrum of 340 EC-containing single particles. (b) The vertical profile of the particle number fraction of EC-containing single particles (ERICA-LAMS). The uncertainty in the particle number fraction is calculated from counting statistics. (c) The vertical profile of the median total mass concentration Ctotal (NTP; ERICA-AMS). The interquartile range of the median total mass concentration Ctotal is shaded in gray.
As described above, the EC particle type was identified using the k-means clustering for the data set. The EC particle type is characterized by a C pattern in the cation and a C pattern in the anion spectrum (e.g., Hinz et al., 2005). Figure 16a shows the mean spectrum of the recorded EC-particle-type mass spectra (total number 389) during the StratoClim research flight of 8 August 2017. Here, the described signal pattern is evident in both polarities. Figure 16b displays the vertical distribution of the particle number fraction of all EC-containing particles in the research flight (vertical bin size 500 m). As expected, the particle number fraction of EC is enhanced in the lowest 6 km with a value of around 0.05. EC is created as primary aerosol by combustion processes as part of soot at low altitudes (Turpin et al., 1991; Seinfeld and Pandis, 2016). Combustion is a common source of air pollution in Nepal (Saud and Paudel, 2018; Sadavarte et al., 2019). Field measurements with the established single-particle mass spectrometer A-ATOFMS, which is comparable to the ERICA, were conducted in the USA. Pratt and Prather (2010) also found a stable EC particle number fraction of around 0.05 in the altitude range of 1 to 6 km. This comparison with the A-ATOFMS shows that the ERICA provides credible results at low altitudes. We observed another enhancement of the EC particle number fraction in the altitude range between 7 and 15 km and assume that the occurrence of EC-containing particles in this altitude range can be caused either by local emitters, such as aircraft (Liu et al., 2017), or by vertical transport, such as the convective outflow of the Asian monsoon (Garny and Randel, 2016). Above 16 km, the EC particle number fraction is very low, ranging around 0.01.
Pure soot is a refractory compound and, consequently, cannot be detected by the ERICA-AMS (Canagaratna et al., 2007). On the other hand, the ERICA-AMS is capable of providing quantitative mass concentration of the non-refractory components of ambient aerosol and thus is well suited for the identification of particle layers by quantitative means. The total ERICA-AMS mass concentration Ctotal is defined as the sum over all non-refractory aerosol species. Figure 16c depicts the vertical profile of Ctotal for the research flight on 8 August 2017. An enhancement in the total mass concentration is clearly evident for altitudes from ground level to approximately 3.5 km and can be associated with anthropogenic emissions at the ground. This layer can be seen as the boundary layer. In the boundary layer, we found during the flight (monsoon season measurement) a maximum Ctotal of 6.9 µg m−3 at an altitude of 2 km. At ground level, a Ctotal of 4.8 µg m−3 was found for this flight. Pre-monsoon season PM2.5 filter measurements (April 2015) in the Kathmandu valley show typical Ctotal values of between 30.0 and 207.4 µg m−3 (Islam et al., 2020) at ground level. Due to particle-scavenging processes, Ctotal is lower during the monsoon season (Hyvärinen et al., 2011). The second enhancement (at altitudes between 15.5 and 19.5 km) with a maximum of 2.8 µg m−3 can be associated with the Asian tropopause aerosol layer (ATAL; e.g., Vernier et al., 2011; Höpfner et al., 2019). In the free troposphere (at altitudes between 4 and 16 km), Ctotal goes down to approximately 1 µg m−3.
The results from the non-refractory Ctotal can be discussed together with the particle number fraction of the refractory EC particle type to provide complementary information about the sampled aerosol particles. Within the boundary layer, as measured by the ERICA-AMS, Ctotal decreases whereas the EC particle number fraction is stable, as in the free troposphere. This indicates, within the limitations of the applied methods, that the EC particle type is well mixed within the boundary layer and in the free troposphere, although Ctotal changes. In the ATAL (> 16 km), EC particles seem to play a minor role in the composition of the aerosol, while for the convective outflow levels (< 16 km), the data suggest an increase in the EC particle number fraction as a result of detrainment. (This StratoClim flight on 8 August 2017 was performed at a time of high convective activity and in the presence of large cloud systems above the Himalayan foothills.) An example of single-particle information, which the ERICA-LAMS is capable of delivering, is provided in Sect. S8 of the Supplement. Due to the lack of a chopper, no particle size information can be determined by the ERICA-AMS.
Overall, the studies presented here confirm that the ERICA can be adopted for aircraft missions from ground level up to an altitude of 20 km and operates reliably under demanding field conditions. A more comprehensive evaluation of the collected data will be conducted in further studies.
In this study we present a novel aerosol mass spectrometer combining the LDI technique (ERICA-LAMS; quadrupled Nd:YAG laser at λ = 266 nm) with the TD-EI technique (ERICA-AMS; vaporizer operated at a temperature of 600 ∘C, electron impact energy of 70 eV). These techniques are implemented in two consecutive instrument stages that are connected in series within a common vacuum chamber. The use of a common vacuum chamber and other components for both measurement techniques minimizes the weight and volume of the instrument. The resulting compact dimensions enable the instrument to be deployed on aircraft, at ground stations, and in mobile laboratories. By that, the same aerosol sample can be investigated with two different physical methods. The chemical characterization of single particles is achieved by recording bipolar mass spectra with a B-ToF-MS. By deploying both methods, complementary chemical information can be obtained. By means of the LDI technique, single particles consisting of refractory or non-refractory components are qualitatively analyzed, while the TD-EI technique provides quantitative information on the non-refractory components (i.e., particulate sulfate, nitrate, ammonium, organics, and chloride) of small particle ensembles. The cations generated by the TD-EI technique are detected with a C-ToF-MS.
Comprehensive laboratory measurements with PSL and AN test aerosol were conducted to characterize the key instrumental parameters. Focused laser beams of the PDUs and the ablation laser beams as well as the particle beam were investigated. In order to determine the particle beam characteristic parameters, ADL position scans with particles of various sizes were performed. The parameters presented in this publication are as follows: the PDU and ablation laser beam waist radii (w0,dia), the particle beam width (wpart), the effective detection radius of the PDUs (reff,L) and of the vaporizer (reff,V), and the particle beam overlap parameters (Sdetect,L, Sdetect,V, and Sablation), each as a function of particle size. Extensive information about the beam characteristics was obtained and shows the performance of the ERICA. Here, 1σ overlap of the particle beam with the detection laser spot for particle sizes between 213 and 3150 nm was found. The installed ADL is described in the literature (Peck et al., 2016; Xu et al., 2017) and covers a particle size range of ∼ 120 to 3500 nm (d50). We found that the particle beam hits the vaporizer completely even at sizes as low as 91 nm. The evaluation of the particle beam shift resulted in two cases of the optical particle detection efficiency due to a non-concentric focusing of all particle sizes: the maximum optical detection efficiency (DEmax) that theoretically can be achieved and the optical detection efficiency during the field campaign in Kathmandu (DEKTM). The characterization shows that DEmax at the PDUs reaches a value of up to 1.00 compared to a reference instrument in a laboratory setup and shows an optical detectable size range of 180 to 3170 nm (d50) for PSL particles. During the field campaign in Nepal the optical particle detection efficiency DEKTM reached up to 0.86. We found d50 values for the DEKTM of 190 and 745 nm for PSL particles (at PDU1). Particle time-of-flight calibration was performed for particle sizes between 80 and 5145 nm. The evaluation of scattered light intensities for particle size determination is also conceivable but has not been implemented yet.
The capabilities of the ERICA were tested in field and laboratory experiments. After the adjustment preparation procedure as conducted before any field campaign, a ground-based field experiment was conducted to determine the size-resolved HR of the ERICA-LAMS. The result was a maximum HR of 0.52 for a particle size of around 230 nm. The outcome of this experiment reflects the results of the particle beam characterization measurements. In addition, we measured pure chemical substances from solutions or suspensions in order to validate that ERICA-LAMS raw mass spectra can be calibrated by the software CRISP correctly. Besides sodium chloride, ammonium nitrate, and benz[a]anthracene, gold spheres were sampled. All substances could be identified by their specific marker peaks in the mass spectra after CRISP processing. Furthermore, mass spectra resolution RMS values of 200 for 120, 700 for 200 (both cations), and about 600 for the anion spectra were determined and are comparable to similar single-particle mass spectrometers. For the ERICA-AMS, RMS was determined by the evaluation software Tofware to be 800 for 200, which is also comparable to other C-ToF-MSs. The conversion of the ion time of flight into a mass spectrum is based on six predefined calibration peaks. A major difference from a commercial AMS instrument is that the ERICA-AMS features a shutter instead of a chopper. By means of the shutter, the background signal (shutter closed) can be determined and then subtracted from the “shutter open” signal. The fragmentation table implemented in Tofware allows the determination of various species, such as organics, nitrate, sulfate, ammonium, and chloride. By means of an IE calibration, the determined sample signal can be turned into an aerosol mass concentration. The IE calibration procedure was conducted with monodisperse AN particles using a CPC as a reference device and yielded 2.05 × 10⁻⁷ ions per molecule. For the detection limits, results for five aerosol particle species were obtained and presented for three different methods. Also, for the StratoClim 2017 campaign an air beam signal of 2.9 × 10⁶ ions s−1 and a water signal of between 2.5 × 10⁶ and 1 × 10⁷ ions s−1 were found. Subsequent modification of a skimmer reduced the air beam by a factor of 6.7 for future instrument deployments. The losses in mass due to particles being ablated and hence not contributing to the ERICA-AMS signal were determined to be low and within the AMS's measurement uncertainties of 30 % for most atmospheric conditions. However, for low particle concentrations the losses have to be considered. To quantify these losses, the operation of the ERICA-LAMS part would need to be paused, at least intermittently, to enable undisturbed quantitative measurements by the ERICA-AMS. This procedure can be implemented in the automated mode. With a similar mode, it would be possible to investigate the fraction of charged ambient particles by switching the HV switch on and off at defined intervals.
The two aircraft field campaigns as part of the StratoClim project in 2016 and 2017 were the first field deployments of the ERICA. This was the first time an AMS-type mass spectrometer was deployed above 16 km, as well as the first time bipolar single-particle mass spectra were recorded at these altitudes. Mass spectra examples from high altitudes presented here agree with spectra presented in the literature and show that the ERICA delivered reasonable data even under field conditions during autonomous operation aboard a research aircraft. For the ERICA-LAMS, the meteoric-material-containing particle type and, for the ERICA-AMS, the sulfate species are used for a proof of concept of the operation at stratospheric altitudes. For low altitudes, down to ground level, the EC particle type and total mass concentration serve as examples of the capabilities of the ERICA-LAMS and ERICA-AMS, respectively. The vertical profiles of these species and additionally of the HR show a reasonable instrument performance over the entire altitude range from ground level up to 20 km. In this study, we also show that the ERICA-LAMS and ERICA-AMS can provide complementary information about the sampled aerosol. Some limitations of one ionization method can be partially compensated for by the other.
Although the ERICA-LAMS and ERICA-AMS combination was developed for the aircraft deployment within the ATAL and the combination has been shown to perform reliably in field campaigns, in the future, modifications could be made to the instrument to address other scientific questions. One modification might be the implementation of another laser type such as an excimer laser for measurements in the lower stratosphere (Murphy et al., 2007). While this is possible for the ERICA as well, space and weight limitations inherent in the implementation prevented the use of an excimer laser setup on the M-55 Geophysica. However, the light at the longer ablation laser wavelength generates less fragmentation in the mass spectra (Thomson et al., 1997). Furthermore, the mass spectra recorded with the ERICA are to a higher degree comparable with instruments like the A-ATOFMS (Gard et al., 1997) and the ALABAMA (Brands et al., 2011), which also operate with an ablation laser at a wavelength of 266 nm.
In another upcoming further development, an additional single-particle mode for the ERICA-AMS will be added, which will be based on optical particle detection. As with the ERICA-LAMS, a single particle is optically detected by the PDUs, and by means of the TC the point in time is calculated when the particle hits the vaporizer. For the same point in time, the data acquisition card is triggered, and the single-particle mass spectrum is recorded. For the ERICA this mode is called the optically triggered AMS (OT-AMS) mode. With the method of the OT-AMS mode, it is possible to quantify the non-refractory components of single particles when the ablation laser is in idle mode. This method is similar to the procedure with a light-scattering probe on the AMS (Cross et al., 2007; Freutel et al., 2013). In addition, the size information of the measured single particle is obtained by means of the particle flight time between the two PDUs. One possible future investigation by means of the OT-AMS mode is the ablation laser's effect on the particles that are only partly ablated and where the residuals reach the vaporizer of the ERICA-AMS. This investigation is only possible with a unique feature, the serial configuration of the SMPS and AMS, as in the OT-AMS mode. A method has to be developed to ensure the linkage of the results to the very same particle. Such a procedure needs more implementations and further laboratory studies.
The presented examples of field measurements showed that the instrument has already been successfully operated during the aircraft campaign of the StratoClim project. The evaluation of the data is ongoing and will be presented in further publications. Furthermore, the ERICA was successfully deployed during the ND-MAX/ECLIF 2 (NASA/DLR-Multidisciplinary Airborne eXperiments/Emission and CLimate Impact of alternative Fuel; Voigt et al., 2021) field campaign in January to February 2018 (Schneider et al., 2021) and during the ACCLIP (Asian summer monsoon Chemical and Climate Impact Project) test phase in January and February 2020. The main campaign will be set up in July to August 2022 based in South Korea (https://www.eol.ucar.edu/field_projects/acclip, last access: 21 February 2022).
Data can be accessed by contacting the corresponding author Stephan Borrmann (stephan.borrmann@mpic.de).
The supplement related to this article is available online at: https://doi.org/10.5194/amt-15-2889-2022-supplement.
SB provided the instrumental concept and an initial design in his ERC Advanced Grant proposal. SB, FD, and JS initiated the instrumental design and accompanied its development and characterization. FH and TK designed the detection units. OA, TB, AD, AH, and SM developed the instrument. OA, AD, AH, and SM performed the described measurements in the field and in the lab. OA and AH evaluated the data. The lens scan evaluation method was developed by TK. HCC initiated and accompanied the implementation of the HV switch and the electric shielding of the ion optic as an essential improvement. AH, together with SB, OA, AD, FK, and SM, drafted the manuscript. All co-authors provided detailed comments on the manuscript.
At least one of the (co-)authors is a member of the editorial board of Atmospheric Measurement Techniques. The peer-review process was guided by an independent editor, and the authors also have no other competing interests to declare.
Publisher’s note: Copernicus Publications remains neutral with regard to jurisdictional claims in published maps and institutional affiliations.
We gratefully thank the workshops of the Max Planck Institute for Chemistry and of the Institute for Atmospheric Physics (Johannes Gutenberg University Mainz) and Tofwerk AG, in particular Christian Gurk, Helmut Schreiber, Bastian Meckel, David Göttert, Sebastian Best, Joachim Sody, and Urs Rohner, for the essential support. The help of Mike Cubison for customizing Tofware is gratefully acknowledged. Special thanks are due to Wen Xu and Philip Croteau from Aerodyne Research Inc. for the specification measurements of the ADL deployed. We would like to express our gratitude to Fred Stroh for his extraordinary commitment to the realization of the field campaigns and to Markus Rex for managing the entire StratoClim project. Our special thanks are extended to the crew of MDB (Myasishchev Design Bureau) and the M-55 Geophysica pilots. We would like to thank the Hellenic Air Force and the Hellenic Civil Aviation Authority for their co-operation in the organization of the first aircraft campaign of the StratoClim project. Especially, we would like to give credit to Konstantinos Chinis (wing commander), Alexandros Kefalas (wing deputy commander), Ioannis Kitsios (MRO director), and the personnel of the 120 Air Training Wing in Kalamata, Greece, for providing the best possible support during the field campaign that took place at their air base in August and September 2016. We extend our sincere thanks to the officials of the Nepalese government authorities, research institutions involved, and Tribhuvan Airport as well as of the German embassy in Nepal for their extraordinary support and hospitality, which made the StratoClim field campaigns and our research possible. We thank the reviewers for their detailed and helpful suggestions to improve the manuscript.
This research has been supported by FP7 Ideas: European Research Council (EXCATRO – In-situ experiments on the chemical composition of high altitude aerosols and clouds in the tropical upper troposphere and lower stratosphere (grant no. 321040) and STRATOCLIM – Stratospheric and upper tropospheric processes for better climate predictions (grant no. 603557)) and the Bundesministerium für Bildung und Forschung (joint ROMIC project SPITFIRE (grant no. 01LG1205A)).
The article processing charges for this open-access publication were covered by the Max Planck Society.
This paper was edited by Troy Thornberry and reviewed by Nicholas Marsden and two anonymous referees.
Allan, J. D., Delia, A. E., Coe, H., Bower, K. N., Alfarra, M. R., Jimenez, J. L., Middlebrook, A. M., Drewnick, F., Onasch, T. B., Canagaratna, M. R., Jayne, J. T., and Worsnop, D. R.: A generalised method for the extraction of chemically resolved mass spectra from Aerodyne aerosol mass spectrometer data, J. Aerosol Sci., 35, 909–922, https://doi.org/10.1016/j.jaerosci.2004.02.007, 2004.
Appel, O., Köllner, F., Dragoneas, A., Hünig, A., Molleker, S., Schlager, H., Mahnke, C., Weigel, R., Port, M., Schulz, C., Drewnick, F., Vogel, B., Stroh, F., and Borrmann, S.: Chemical analysis of the Asian Tropopause Aerosol Layer (ATAL) with emphasis on secondary aerosol particles using aircraft based in situ aerosol mass spectrometry, Atmos. Chem. Phys. Discuss. [preprint], https://doi.org/10.5194/acp-2022-92, in review, 2022.
Araújo, M., Silva, R., Lima, E., Pereira, D., and De Oliveira, P.: Measurement of Gaussian laser beam radius using the knife-edge technique: Improvement on data analysis, Appl. Opt., 48, 393–396, https://doi.org/10.1364/AO.48.000393, 2009.
Ault, A. P., Moore, M. J., Furutani, H., and Prather, K. A.: Impact of Emissions from the Los Angeles Port Region on San Diego Air Quality during Regional Transport Events, Environ. Sci. Technol., 43, 3500–3506, https://doi.org/10.1021/es8018918, 2009.
Bahreini, R., Ervens, B., Middlebrook, A. M., Warneke, C., de Gouw, J. A., DeCarlo, P. F., Jimenez, J. L., Brock, C. A., Neuman, J. A., Ryerson, T. B., Stark, H., Atlas, E., Brioude, J., Fried, A., Holloway, J. S., Peischl, J., Richter, D., Walega, J., Weibring, P., Wollny, A. G., and Fehsenfeld, F. C.: Organic aerosol formation in urban and industrial plumes near Houston and Dallas, Texas, J. Geophys. Res.-Atmos., 114, D00F16, https://doi.org/10.1029/2008JD011493, 2009.
Bohren, C. F. and Huffman, D. R.: Absorption and scattering of light by small particles, Wiley science paperback series, New York, NY, USA, ISBN 978-0-471-29340-8, 1998.
Borrmann, S., Stefanutti, L., and Khattatov, V.: Chemistry and aerosol measurements on the Geophysika stratospheric research aircraft: The airborne polar experiment, Phys. Chem. Earth, 20, 97–101, https://doi.org/10.1016/0079-1946(95)00011-X, 1995.
Brands, M.: Aufbau und Charakterisierung eines flugzeuggetragenen Einzelpartikel-Massenspektrometers, PhD thesis, Johannes Gutenberg-Universität Mainz, Mainz, Germany, https://doi.org/10.25358/openscience-2255, 2009.
Brands, M., Kamphus, M., Böttger, T., Schneider, J., Drewnick, F., Roth, A., Curtius, J., Voigt, C., Borbon, A., Beekmann, M., Bourdon, A., Perrin, T., and Borrmann, S.: Characterization of a Newly Developed Aircraft-Based Laser Ablation Aerosol Mass Spectrometer (ALABAMA) and First Field Deployment in Urban Pollution Plumes over Paris During MEGAPOLI 2009, Aerosol Sci. Technol., 45, 46–64, https://doi.org/10.1080/02786826.2010.517813, 2011.
Brito, J., Freney, E., Dominutti, P., Borbon, A., Haslett, S. L., Batenburg, A. M., Colomb, A., Dupuy, R., Denjean, C., Burnet, F., Bourriane, T., Deroubaix, A., Sellegri, K., Borrmann, S., Coe, H., Flamant, C., Knippertz, P., and Schwarzenboeck, A.: Assessing the role of anthropogenic and biogenic sources on PM1 over southern West Africa using aircraft measurements, Atmos. Chem. Phys., 18, 757–772, https://doi.org/10.5194/acp-18-757-2018, 2018.
Brunamonti, S., Jorge, T., Oelsner, P., Hanumanthu, S., Singh, B. B., Kumar, K. R., Sonbawne, S., Meier, S., Singh, D., Wienhold, F. G., Luo, B. P., Boettcher, M., Poltera, Y., Jauhiainen, H., Kayastha, R., Karmacharya, J., Dirksen, R., Naja, M., Rex, M., Fadnavis, S., and Peter, T.: Balloon-borne measurements of temperature, water vapor, ozone and aerosol backscatter on the southern slopes of the Himalayas during StratoClim 2016–2017, Atmos. Chem. Phys., 18, 15937–15957, https://doi.org/10.5194/acp-18-15937-2018, 2018.
Bucci, S., Legras, B., Sellitto, P., D'Amato, F., Viciani, S., Montori, A., Chiarugi, A., Ravegnani, F., Ulanovsky, A., Cairo, F., and Stroh, F.: Deep-convective influence on the upper troposphere–lower stratosphere composition in the Asian monsoon anticyclone region: 2017 StratoClim campaign results, Atmos. Chem. Phys., 20, 12193–12210, https://doi.org/10.5194/acp-20-12193-2020, 2020.
Canagaratna, M. R., Jayne, J. T., Jimenez, J. L., Allan, J. D., Alfarra, M. R., Zhang, Q., Onasch, T. B., Drewnick, F., Coe, H., Middlebrook, A., Delia, A., Williams, L. R., Trimborn, A. M., Northway, M. J., DeCarlo, P. F., Kolb, C. E., Davidovits, P., and Worsnop, D. R.: Chemical and microphysical characterization of ambient aerosols with the aerodyne aerosol mass spectrometer, Mass Spectrom. Rev., 26, 185–222, https://doi.org/10.1002/mas.20115, 2007.
Chen, Y., Kozlovskiy, V., Du, X., Lv, J., Nikiforov, S., Yu, J., Kolosov, A., Gao, W., Zhou, Z., Huang, Z., and Li, L.: Increase of the particle hit rate in a laser single-particle mass spectrometer by pulse delayed extraction technology, Atmos. Meas. Tech., 13, 941–949, https://doi.org/10.5194/amt-13-941-2020, 2020.
Clemen, H.-C., Schneider, J., Klimach, T., Helleis, F., Köllner, F., Hünig, A., Rubach, F., Mertes, S., Wex, H., Stratmann, F., Welti, A., Kohl, R., Frank, F., and Borrmann, S.: Optimizing the detection, ablation, and ion extraction efficiency of a single-particle laser ablation mass spectrometer for application in environments with low aerosol particle concentrations, Atmos. Meas. Tech., 13, 5923–5953, https://doi.org/10.5194/amt-13-5923-2020, 2020.
Cross, E. S., Slowik, J. G., Davidovits, P., Allan, J. D., Worsnop, D. R., Jayne, J. T., Lewis, D. K., Canagaratna, M., and Onasch, T. B.: Laboratory and Ambient Particle Density Determinations using Light Scattering in Conjunction with Aerosol Mass Spectrometry, Aerosol Sci. Technol., 41, 343–359, https://doi.org/10.1080/02786820701199736, 2007.
Cross, E. S., Onasch, T. B., Canagaratna, M., Jayne, J. T., Kimmel, J., Yu, X.-Y., Alexander, M. L., Worsnop, D. R., and Davidovits, P.: Single particle characterization using a light scattering module coupled to a time-of-flight aerosol mass spectrometer, Atmos. Chem. Phys., 9, 7769–7793, https://doi.org/10.5194/acp-9-7769-2009, 2009.
Cziczo, D. J., Thomson, D. S., and Murphy, D. M.: Ablation, Flux, and Atmospheric Implications of Meteors Inferred from Stratospheric Aerosol, Science, 291, 1772–1775, https://doi.org/10.1126/science.1057737, 2001.
Dall'Osto, M., Drewnick, F., Fisher, R., and Harrison, R. M.: Real-Time Measurements of Nonmetallic Fine Particulate Matter Adjacent to a Major Integrated Steelworks, Aerosol Sci. Technol., 46, 639–653, https://doi.org/10.1080/02786826.2011.647120, 2012.
DeCarlo, P. F., Slowik, J. G., Worsnop, D. R., Davidovits, P., and Jimenez, J. L.: Particle Morphology and Density Characterization by Combined Mobility and Aerodynamic Diameter Measurements. Part 1: Theory, Aerosol Sci. Technol., 38, 1185–1205, https://doi.org/10.1080/027868290903907, 2004.
DeCarlo, P. F., Kimmel, J. R., Trimborn, A., Northway, M. J., Jayne, J. T., Aiken, A. C., Gonin, M., Fuhrer, K., Horvath, T., Docherty, K. S., Worsnop, D. R., and Jimenez, J. L.: Field-Deployable, High-Resolution, Time-of-Flight Aerosol Mass Spectrometer, Anal. Chem., 78, 8281–8289, https://doi.org/10.1021/ac061249n, 2006.
Dragoneas, A., Molleker, S., Appel, O., Hünig, A., Böttger, T., Hermann, M., Drewnick, F., Schneider, J., Weigel, R., and Borrmann, S.: The realization of autonomous, aircraft-based, real-time aerosol mass spectrometry in the upper troposphere and lower stratosphere, EGUsphere [preprint], https://doi.org/10.5194/egusphere-2022-33, 2022.
Drewnick, F., Hings, S. S., DeCarlo, P., Jayne, J. T., Gonin, M., Fuhrer, K., Weimer, S., Jimenez, J. L., Demerjian, K. L., Borrmann, S., and Worsnop, D. R.: A New Time-of-Flight Aerosol Mass Spectrometer (TOF-AMS) – Instrument Description and First Field Deployment, Aerosol Sci. Technol., 39, 637–658, https://doi.org/10.1080/02786820500182040, 2005.
Drewnick, F., Hings, S. S., Alfarra, M. R., Prevot, A. S. H., and Borrmann, S.: Aerosol quantification with the Aerodyne Aerosol Mass Spectrometer: detection limits and ionizer background effects, Atmos. Meas. Tech., 2, 33–46, https://doi.org/10.5194/amt-2-33-2009, 2009.
Drewnick, F., Diesch, J.-M., Faber, P., and Borrmann, S.: Aerosol mass spectrometry: particle–vaporizer interactions and their consequences for the measurements, Atmos. Meas. Tech., 8, 3811–3830, https://doi.org/10.5194/amt-8-3811-2015, 2015.
Dunlea, E., Decarlo, P., Aiken, A., Kimmel, J., Bahreini, R., Peltier, R., Weber, R., Tomlinson, J., Collins, D., Shinozuka, Y., Howell, S., Clarke, A., Emmons, L., Apel, E., Pfister, G., van Donkelaar, A., Millet, D., and Jimenez, J.: Observations of Processed Asian Pollution with a High-Resolution Time-of-Flight Aerosol Mass Spectrometer (HR-ToF-AMS) from the C-130 Aircraft During the INTEX-B Field Campaign, AGU Fall Meeting Abstracts, 1 December 2007, San Francisco, California, USA, http://ui.adsabs.harvard.edu/abs/2007AGUFM.A33A0823D (last access: 19 April 2022), 2007.
Elmes, M. and Gasparon, M.: Sampling and single particle analysis for the chemical characterisation of fine atmospheric particulates: A review, J. Environ. Manage., 202, 137–150, https://doi.org/10.1016/j.jenvman.2017.06.067, 2017.
Fachinger, J. R. W., Gallavardin, S. J., Helleis, F., Fachinger, F., Drewnick, F., and Borrmann, S.: The ion trap aerosol mass spectrometer: field intercomparison with the ToF-AMS and the capability of differentiating organic compound classes via MS-MS, Atmos. Meas. Tech., 10, 1623–1637, https://doi.org/10.5194/amt-10-1623-2017, 2017.
Freutel, F., Drewnick, F., Schneider, J., Klimach, T., and Borrmann, S.: Quantitative single-particle analysis with the Aerodyne aerosol mass spectrometer: development of a new classification algorithm and its application to field data, Atmos. Meas. Tech., 6, 3131–3145, https://doi.org/10.5194/amt-6-3131-2013, 2013.
Fröhlich, R., Cubison, M. J., Slowik, J. G., Bukowiecki, N., Prévôt, A. S. H., Baltensperger, U., Schneider, J., Kimmel, J. R., Gonin, M., Rohner, U., Worsnop, D. R., and Jayne, J. T.: The ToF-ACSM: a portable aerosol chemical speciation monitor with TOFMS detection, Atmos. Meas. Tech., 6, 3225–3241, https://doi.org/10.5194/amt-6-3225-2013, 2013.
Froyd, K. D., Murphy, D. M., Brock, C. A., Campuzano-Jost, P., Dibb, J. E., Jimenez, J.-L., Kupc, A., Middlebrook, A. M., Schill, G. P., Thornhill, K. L., Williamson, C. J., Wilson, J. C., and Ziemba, L. D.: A new method to quantify mineral dust and other aerosol species from aircraft platforms using single-particle mass spectrometry, Atmos. Meas. Tech., 12, 6209–6239, https://doi.org/10.5194/amt-12-6209-2019, 2019.
Fuzzi, S., Baltensperger, U., Carslaw, K., Decesari, S., Denier van der Gon, H., Facchini, M. C., Fowler, D., Koren, I., Langford, B., Lohmann, U., Nemitz, E., Pandis, S., Riipinen, I., Rudich, Y., Schaap, M., Slowik, J. G., Spracklen, D. V., Vignati, E., Wild, M., Williams, M., and Gilardoni, S.: Particulate matter, air quality and climate: lessons learned and future needs, Atmos. Chem. Phys., 15, 8217–8299, https://doi.org/10.5194/acp-15-8217-2015, 2015.
Gard, E., Mayer, J. E., Morrical, B. D., Dienes, T., Fergenson, D. P., and Prather, K. A.: Real-Time Analysis of Individual Atmospheric Aerosol Particles: Design and Performance of a Portable ATOFMS, Anal. Chem., 69, 4083–4091, https://doi.org/10.1021/ac970540n, 1997.
Garny, H. and Randel, W. J.: Transport pathways from the Asian monsoon anticyclone to the stratosphere, Atmos. Chem. Phys., 16, 2703–2718, https://doi.org/10.5194/acp-16-2703-2016, 2016.
Gemayel, R., Hellebust, S., Temime-Roussel, B., Hayeck, N., Van Elteren, J. T., Wortham, H., and Gligorovski, S.: The performance and the characterization of laser ablation aerosol particle time-of-flight mass spectrometry (LAAP-ToF-MS), Atmos. Meas. Tech., 9, 1947–1959, https://doi.org/10.5194/amt-9-1947-2016, 2016.
Goetz, J. D., Giordano, M. R., Stockwell, C. E., Christian, T. J., Maharjan, R., Adhikari, S., Bhave, P. V., Praveen, P. S., Panday, A. K., Jayarathne, T., Stone, E. A., Yokelson, R. J., and DeCarlo, P. F.: Speciated online PM1 from South Asian combustion sources – Part 1: Fuel-based emission factors and size distributions, Atmos. Chem. Phys., 18, 14653–14679, https://doi.org/10.5194/acp-18-14653-2018, 2018.
Gross, D. S., Gälli, M. E., Silva, P. J., and Prather, K. A.: Relative Sensitivity Factors for Alkali Metal and Ammonium Cations in Single-Particle Aerosol Time-of-Flight Mass Spectra, Anal. Chem., 72, 416–422, https://doi.org/10.1021/ac990434g, 2000.
Guan, J. L., Lu, H. W., Xiao, X. H., Wu, Y. C., and Chen, Z. D.: Research on Precision Mirror Machining Technology for W-Mo Alloy, Key Eng. Mater., 487, 303–307, https://doi.org/10.4028/www.scientific.net/KEM.487.303, 2011.
Gunsch, M. J., May, N. W., Wen, M., Bottenus, C. L. H., Gardner, D. J., VanReken, T. M., Bertman, S. B., Hopke, P. K., Ault, A. P., and Pratt, K. A.: Ubiquitous influence of wildfire emissions and secondary organic aerosol on summertime atmospheric aerosol in the forested Great Lakes region, Atmos. Chem. Phys., 18, 3701–3715, https://doi.org/10.5194/acp-18-3701-2018, 2018.
Guo, H., Campuzano-Jost, P., Nault, B. A., Day, D. A., Schroder, J. C., Kim, D., Dibb, J. E., Dollner, M., Weinzierl, B., and Jimenez, J. L.: The importance of size ranges in aerosol instrument intercomparisons: a case study for the Atmospheric Tomography Mission, Atmos. Meas. Tech., 14, 3631–3655, https://doi.org/10.5194/amt-14-3631-2021, 2021.
Haslett, S. L., Taylor, J. W., Evans, M., Morris, E., Vogel, B., Dajuma, A., Brito, J., Batenburg, A. M., Borrmann, S., Schneider, J., Schulz, C., Denjean, C., Bourrianne, T., Knippertz, P., Dupuy, R., Schwarzenböck, A., Sauer, D., Flamant, C., Dorsey, J., Crawford, I., and Coe, H.: Remote biomass burning dominates southern West African air pollution during the monsoon, Atmos. Chem. Phys., 19, 15217–15234, https://doi.org/10.5194/acp-19-15217-2019, 2019.
Healy, R. M., Sciare, J., Poulain, L., Kamili, K., Merkel, M., Müller, T., Wiedensohler, A., Eckhardt, S., Stohl, A., Sarda-Estève, R., McGillicuddy, E., O'Connor, I. P., Sodeau, J. R., and Wenger, J. C.: Sources and mixing state of size-resolved elemental carbon particles in a European megacity: Paris, Atmos. Chem. Phys., 12, 1681–1700, https://doi.org/10.5194/acp-12-1681-2012, 2012.
Hings, S.: Characterisation and Field Deployment of a Novel Quantitative Time-of-Flight Aerosol Mass Spectrometer (ToF-AMS), PhD thesis, Johannes Gutenberg-Universität Mainz, Mainz, Germany, https://doi.org/10.25358/openscience-3333, 2006.
Hinz, K.-P., Kaufmann, R., and Spengler, B.: Simultaneous Detection of Positive and Negative Ions From Single Airborne Particles by Real-time Laser Mass Spectrometry, Aerosol Sci. Technol., 24, 233–242, https://doi.org/10.1080/02786829608965368, 1996.
Hinz, K.-P., Greweling, M., Drews, F., and Spengler, B.: Data processing in on-line laser mass spectrometry of inorganic, organic, or biological airborne particles, J. Am. Soc. Mass. Spectrom., 10, 648–660, https://doi.org/10.1016/s1044-0305(99)00028-8, 1999.
Hinz, K.-P., Trimborn, A., Weingartner, E., Henning, S., Baltensperger, U., and Spengler, B.: Aerosol single particle composition at the Jungfraujoch, J. Aerosol Sci., 36, 123–145, https://doi.org/10.1016/j.jaerosci.2004.08.001, 2005.
Hodzic, A., Campuzano-Jost, P., Bian, H., Chin, M., Colarco, P. R., Day, D. A., Froyd, K. D., Heinold, B., Jo, D. S., Katich, J. M., Kodros, J. K., Nault, B. A., Pierce, J. R., Ray, E., Schacht, J., Schill, G. P., Schroder, J. C., Schwarz, J. P., Sueper, D. T., Tegen, I., Tilmes, S., Tsigaridis, K., Yu, P., and Jimenez, J. L.: Characterization of organic aerosol across the global remote troposphere: a comparison of ATom measurements and global chemistry models, Atmos. Chem. Phys., 20, 4607–4635, https://doi.org/10.5194/acp-20-4607-2020, 2020.
Höpfner, M., Ungermann, J., Borrmann, S., Wagner, R., Spang, R., Riese, M., Stiller, G., Appel, O., Batenburg, A. M., Bucci, S., Cairo, F., Dragoneas, A., Friedl-Vallon, F., Hünig, A., Johansson, S., Krasauskas, L., Legras, B., Leisner, T., Mahnke, C., Möhler, O., Molleker, S., Müller, R., Neubert, T., Orphal, J., Preusse, P., Rex, M., Saathoff, H., Stroh, F., Weigel, R., and Wohltmann, I.: Ammonium nitrate particles formed in upper troposphere from ground ammonia sources during Asian monsoons, Nat. Geosci., 12, 608–612, https://doi.org/10.1038/s41561-019-0385-8, 2019.
Huffman, J. A., Jayne, J. T., Drewnick, F., Aiken, A. C., Onasch, T., Worsnop, D. R., and Jimenez, J. L.: Design, Modeling, Optimization, and Experimental Tests of a Particle Beam Width Probe for the Aerodyne Aerosol Mass Spectrometer, Aerosol Sci. Technol., 39, 1143–1163, https://doi.org/10.1080/02786820500423782, 2005.
Hyvärinen, A.-P., Raatikainen, T., Komppula, M., Mielonen, T., Sundström, A.-M., Brus, D., Panwar, T. S., Hooda, R. K., Sharma, V. P., de Leeuw, G., and Lihavainen, H.: Effect of the summer monsoon on aerosols at two measurement stations in Northern India – Part 2: Physical and optical properties, Atmos. Chem. Phys., 11, 8283–8294, https://doi.org/10.5194/acp-11-8283-2011, 2011.
IPCC: Climate change 2013: The physical science basis. Contribution of working group I to the fifth assessment report of the intergovernmental panel on climate change, IPCC, edited by: Stocker, T. F., Qin, D., Plattner, G.-K., Tignor, M., Allen, S. K., Boschung, J., Nauels, A., Xia, Y., Bex, V., and Midgley, P. M.,, Cambridge, United Kingdom and New York, NY, USA, Report, 1535 pp., ISBN 978-1-107-66182-0 , 2013.
Islam, Md. R., Jayarathne, T., Simpson, I. J., Werden, B., Maben, J., Gilbert, A., Praveen, P. S., Adhikari, S., Panday, A. K., Rupakheti, M., Blake, D. R., Yokelson, R. J., DeCarlo, P. F., Keene, W. C., and Stone, E. A.: Ambient air quality in the Kathmandu Valley, Nepal, during the pre-monsoon: concentrations and sources of particulate matter and trace gases, Atmos. Chem. Phys., 20, 2927–2951, https://doi.org/10.5194/acp-20-2927-2020, 2020.
Jayne, J. T., Leard, D. C., Zhang, X., Davidovits, P., Smith, K. A., Kolb, C. E., and Worsnop, D. R.: Development of an Aerosol Mass Spectrometer for Size and Composition Analysis of Submicron Particles, Aerosol Sci. Technol., 33, 49–70, https://doi.org/10.1080/027868200410840, 2000.
Jimenez, J. L., Bahreini, R., Cocker, D. R., Zhuang, H., Varutbangkul, V., Flagan, R. C., Seinfeld, J. H., O'Dowd, C. D., and Hoffmann, T.: Correction to “New particle formation from photooxidation of diiodomethane (CH2I2)”, J. Geophys. Res.-Atmos., 108, 4733, https://doi.org/10.1029/2003JD004249, 2003a.
Jimenez, J. L., Bahreini, R., Cocker, D. R., Zhuang, H., Varutbangkul, V., Flagan, R. C., Seinfeld, J. H., O'Dowd, C. D., and Hoffmann, T.: New particle formation from photooxidation of diiodomethane (CH2I2), J. Geophys. Res.-Atmos., 108, 4318, https://doi.org/10.1029/2002JD002452, 2003b.
Jimenez, J. L., Jayne, J. T., Shi, Q., Kolb, C. E., Worsnop, D. R., Yourshaw, I., Seinfeld, J. H., Flagan, R. C., Zhang, X., Smith, K. A., Morris, J. W., and Davidovits, P.: Ambient aerosol sampling using the Aerodyne Aerosol Mass Spectrometer, J. Geophys. Res.-Atmos., 108, 8425, https://doi.org/10.1029/2001JD001213, 2003c.
Junge, C. E. and Manson, J. E.: Stratospheric aerosol studies, J. Geophys. Res., 66, 2163–2182, https://doi.org/10.1029/JZ066i007p02163, 1961.
Klimach, T.: Chemische Zusammensetzung der Aerosole – Design und Datenauswertung eines Einzelpartikel-Laserablationsmassenspektrometers, PhD thesis, Johannes Gutenberg-Universität Mainz, Mainz, Germany, https://doi.org/10.25358/openscience-4386, 2012.
Köllner, F.: Aerosol particles in the summertime arctic lower troposphere: Chemical composition, sources, and formation, PhD thesis, Johannes Gutenberg-Universität Mainz, Mainz, Germany, https://doi.org/10.25358/openscience-2680, 2019.
Köllner, F., Schneider, J., Willis, M. D., Klimach, T., Helleis, F., Bozem, H., Kunkel, D., Hoor, P., Burkart, J., Leaitch, W. R., Aliabadi, A. A., Abbatt, J. P. D., Herber, A. B., and Borrmann, S.: Particulate trimethylamine in the summertime Canadian high Arctic lower troposphere, Atmos. Chem. Phys., 17, 13747–13766, https://doi.org/10.5194/acp-17-13747-2017, 2017.
Köllner, F., Schneider, J., Willis, M. D., Schulz, H., Kunkel, D., Bozem, H., Hoor, P., Klimach, T., Helleis, F., Burkart, J., Leaitch, W. R., Aliabadi, A. A., Abbatt, J. P. D., Herber, A. B., and Borrmann, S.: Chemical composition and source attribution of sub-micrometre aerosol particles in the summertime Arctic lower troposphere, Atmos. Chem. Phys., 21, 6509–6539, https://doi.org/10.5194/acp-21-6509-2021, 2021.
Kulkarni, P., Baron, P. A., and Willeke, K.: Aerosol measurement: principles, techniques, and applications, 3rd edition, edited by: Kulkarni, P., Wiley, Hoboken, NJ, USA, XIV, 883 pp., ISBN 978-0-470-38741-2, 2011.
Laursen, K. K., Jorgensen, D. P., Brasseur, G. P., Ustin, S. L., and Huning, J. R.: HIAPER: The Next Generation NSF/NCAR Research Aircraft, B. Am. Meteorol. Soc., 87, 896–910, https://doi.org/10.1175/BAMS-87-7-896, 2006.
Lima, A. L. C., Farrington, J. W., and Reddy, C. M.: Combustion-Derived Polycyclic Aromatic Hydrocarbons in the Environment – A Review, Environ. Forensics, 6, 109–131, https://doi.org/10.1080/15275920590952739, 2005.
Liu, D.-Y., Prather, K., and Hering, S. V.: Variations in the Size and Chemical Composition of Nitrate-Containing Particles in Riverside, CA, Aerosol Sci. Technol., 33, 71–86, https://doi.org/10.1080/027868200410859, 2000.
Liu, P. S. K., Deng, R., Smith, K. A., Williams, L. R., Jayne, J. T., Canagaratna, M. R., Moore, K., Onasch, T. B., Worsnop, D. R., and Deshler, T.: Transmission Efficiency of an Aerodynamic Focusing Lens System: Comparison of Model Calculations and Laboratory Measurements for the Aerodyne Aerosol Mass Spectrometer, Aerosol Sci. Technol., 41, 721–733, https://doi.org/10.1080/02786820701422278, 2007.
Liu, Y., Sun, X., Sethi, V., Nalianda, D., Li, Y.-G., and Wang, L.: Review of modern low emissions combustion technologies for aero gas turbine engines, Prog. Aerosp. Sci., 94, 12–45, https://doi.org/10.1016/j.paerosci.2017.08.001, 2017.
Marsden, N., Flynn, M. J., Taylor, J. W., Allan, J. D., and Coe, H.: Evaluating the influence of laser wavelength and detection stage geometry on optical detection efficiency in a single-particle mass spectrometer, Atmos. Meas. Tech., 9, 6051–6068, https://doi.org/10.5194/amt-9-6051-2016, 2016.
Marsden, N. A., Flynn, M. J., Allan, J. D., and Coe, H.: Online differentiation of mineral phase in aerosol particles by ion formation mechanism using a LAAP-TOF single-particle mass spectrometer, Atmos. Meas. Tech., 11, 195–213, https://doi.org/10.5194/amt-11-195-2018, 2018.
Matthew, B. M., Middlebrook, A. M., and Onasch, T. B.: Collection Efficiencies in an Aerodyne Aerosol Mass Spectrometer as a Function of Particle Phase for Laboratory Generated Aerosols, Aerosol Sci. Technol., 42, 884–898, https://doi.org/10.1080/02786820802356797, 2008.
Möhler, O., Benz, S., Saathoff, H., Schnaiter, M., Wagner, R., Schneider, J., Walter, S., Ebert, V., and Wagner, S.: The effect of organic coating on the heterogeneous ice nucleation efficiency of mineral dust aerosols, Environ. Res. Lett., 3, 025007, https://doi.org/10.1088/1748-9326/3/2/025007, 2008.
Molleker, S., Helleis, F., Klimach, T., Appel, O., Clemen, H.-C., Dragoneas, A., Gurk, C., Hünig, A., Köllner, F., Rubach, F., Schulz, C., Schneider, J., and Borrmann, S.: Application of an O-ring pinch device as a constant-pressure inlet (CPI) for airborne sampling, Atmos. Meas. Tech., 13, 3651–3660, https://doi.org/10.5194/amt-13-3651-2020, 2020.
Morgan, W. T., Allan, J. D., Bower, K. N., Highwood, E. J., Liu, D., McMeeking, G. R., Northway, M. J., Williams, P. I., Krejci, R., and Coe, H.: Airborne measurements of the spatial distribution of aerosol chemical composition across Europe and evolution of the organic fraction, Atmos. Chem. Phys., 10, 4065–4083, https://doi.org/10.5194/acp-10-4065-2010, 2010.
Murphy, D. M.: The design of single particle laser mass spectrometers, Mass Spectrom. Rev., 26, 150–165, https://doi.org/10.1002/mas.20113, 2007.
Murphy, D. M., Thomson, D. S., and Mahoney, M. J.: In Situ Measurements of Organics, Meteoritic Material, Mercury, and Other Elements in Aerosols at 5 to 19 Kilometers, Science, 282, 1664–1669, https://doi.org/10.1126/science.282.5394.1664, 1998.
Murphy, D. M., Cziczo, D. J., Froyd, K. D., Hudson, P. K., Matthew, B. M., Middlebrook, A. M., Peltier, R. E., Sullivan, A., Thomson, D. S., and Weber, R. J.: Single-particle mass spectrometry of tropospheric aerosol particles, J. Geophys. Res.-Atmos., 111, D23S32, https://doi.org/10.1029/2006jd007340, 2006a.
Murphy, D. M., Hudson, P. K., Thomson, D. S., Sheridan, P. J., and Wilson, J. C.: Observations of Mercury-Containing Aerosols, Environ. Sci. Technol., 40, 3163–3167, https://doi.org/10.1021/es052385x, 2006b.
Murphy, D. M., Cziczo, D. J., Hudson, P. K., and Thomson, D. S.: Carbonaceous material in aerosol particles in the lower stratosphere and tropopause region, J. Geophys. Res.-Atmos., 112, D04203, https://doi.org/10.1029/2006jd007297, 2007.
Murphy, D. M., Froyd, K. D., Schwarz, J. P., and Wilson, J. C.: Observations of the chemical composition of stratospheric aerosol particles, Q. J. Roy. Meteor. Soc., 140, 1269–1278, https://doi.org/10.1002/qj.2213, 2014.
Peck, J., Gonzalez, L. A., Williams, L. R., Xu, W., Croteau, P. L., Timko, M. T., Jayne, J. T., Worsnop, D. R., Miake-Lye, R. C., and Smith, K. A.: Development of an aerosol mass spectrometer lens system for PM2.5, Aerosol Sci. Technol., 50, 781–789, https://doi.org/10.1080/02786826.2016.1190444, 2016.
Ploeger, F., Gottschling, C., Griessbach, S., Grooß, J.-U., Guenther, G., Konopka, P., Müller, R., Riese, M., Stroh, F., Tao, M., Ungermann, J., Vogel, B., and von Hobe, M.: A potential vorticity-based determination of the transport barrier in the Asian summer monsoon anticyclone, Atmos. Chem. Phys., 15, 13145–13159, https://doi.org/10.5194/acp-15-13145-2015, 2015.
Pratt, K. A. and Prather, K. A.: Aircraft measurements of vertical profiles of aerosol mixing states, J. Geophys. Res.-Atmos., 115, D11305, https://doi.org/10.1029/2009JD013150, 2010.
Pratt, K. A., Mayer, J. E., Holecek, J. C., Moffet, R. C., Sanchez, R. O., Rebotier, T. P., Furutani, H., Gonin, M., Fuhrer, K., Su, Y., Guazzotti, S., and Prather, K. A.: Development and Characterization of an Aircraft Aerosol Time-of-Flight Mass Spectrometer, Anal. Chem., 81, 1792–1800, https://doi.org/10.1021/ac801942r, 2009.
Ramisetty, R., Abdelmonem, A., Shen, X., Saathoff, H., Leisner, T., and Mohr, C.: Exploring femtosecond laser ablation in single-particle aerosol mass spectrometry, Atmos. Meas. Tech., 11, 4345–4360, https://doi.org/10.5194/amt-11-4345-2018, 2018.
Reilly, P. T. A., Lazar, A. C., Gieray, R. A., Whitten, W. B., and Ramsey, J. M.: The Elucidation of Charge-Transfer-Induced Matrix Effects in Environmental Aerosols Via Real-Time Aerosol Mass Spectral Analysis of Individual Airborne Particles, Aerosol Sci. Technol., 33, 135–152, https://doi.org/10.1080/027868200410895, 2000.
Reitz, P.: Chemical composition measurements of cloud condensation nuclei and ice nuclei by aerosol mass spectrometry, PhD thesis, Johannes Gutenberg-Universität Mainz, Mainz, Germany, https://doi.org/10.25358/openscience-3178, 2011.
Rex, M., Schlager, H., Stroh, F., and Cairo, F.: StratoClim FactSheet 2 Asian Monsoon Aircraft Campaign, Alfred Wegener Institute Helmholtz Centre for Polar and Marine Research Potsdam, Germany, http://www.stratoclim.org/downloads/StratoClim_Factsheet_2-Aircraft_Campaign_updated_highres.pdf (last access: 19 April 2022), 2016.
Roth, A., Schneider, J., Klimach, T., Mertes, S., van Pinxteren, D., Herrmann, H., and Borrmann, S.: Aerosol properties, source identification, and cloud processing in orographic clouds measured by single particle mass spectrometry on a central European mountain site during HCCT-2010, Atmos. Chem. Phys., 16, 505–524, https://doi.org/10.5194/acp-16-505-2016, 2016.
Sadavarte, P., Rupakheti, M., Bhave, P., Shakya, K., and Lawrence, M.: Nepal emission inventory – Part I: Technologies and combustion sources (NEEMI-Tech) for 2001–2016, Atmos. Chem. Phys., 19, 12953–12973, https://doi.org/10.5194/acp-19-12953-2019, 2019.
Saud, B. and Paudel, G.: The Threat of Ambient Air Pollution in Kathmandu, Nepal, J. Environ. Public Health, 2018, 1504591, https://doi.org/10.1155/2018/1504591, 2018.
Schmale, J., Schneider, J., Jurkat, T., Voigt, C., Kalesse, H., Rautenhaus, M., Lichtenstern, M., Schlager, H., Ancellet, G., Arnold, F., Gerding, M., Mattis, I., Wendisch, M., and Borrmann, S.: Aerosol layers from the 2008 eruptions of Mount Okmok and Mount Kasatochi: In situ upper troposphere and lower stratosphere measurements of sulfate and organics over Europe, J. Geophys. Res.-Atmos., 115, D00L07, https://doi.org/10.1029/2009JD013628, 2010.
Schneider, J., Köllner, F., Schulz, C., Clemen, H.-C., Kaiser, K., Eppers, O., Williams, J., Fischer, H., Lelieveld, J., and Borrmann, S.: Aerosol properties and processing in the upper troposphere in aged biomass burning outflow: First results from the HALO mission CAFE-Africa in 2018, EGU General Assembly 2019, 7–12 April 2019, Vienna, Austria, http://meetingorganizer.copernicus.org/EGU2019/EGU2019-5798.pdf (last access: 19 April 2022), 2019.
Schneider, J., Weigel, R., Klimach, T., Dragoneas, A., Appel, O., Hünig, A., Molleker, S., Köllner, F., Clemen, H.-C., Eppers, O., Hoppe, P., Hoor, P., Mahnke, C., Krämer, M., Rolf, C., Grooß, J.-U., Zahn, A., Obersteiner, F., Ravegnani, F., Ulanovsky, A., Schlager, H., Scheibe, M., Diskin, G. S., DiGangi, J. P., Nowak, J. B., Zöger, M., and Borrmann, S.: Aircraft-based observation of meteoric material in lower-stratospheric aerosol particles between 15 and 68∘ N, Atmos. Chem. Phys., 21, 989–1013, https://doi.org/10.5194/acp-21-989-2021, 2021.
Schulz, C., Schneider, J., Amorim Holanda, B., Appel, O., Costa, A., de Sá, S. S., Dreiling, V., Fütterer, D., Jurkat-Witschas, T., Klimach, T., Knote, C., Krämer, M., Martin, S. T., Mertes, S., Pöhlker, M. L., Sauer, D., Voigt, C., Walser, A., Weinzierl, B., Ziereis, H., Zöger, M., Andreae, M. O., Artaxo, P., Machado, L. A. T., Pöschl, U., Wendisch, M., and Borrmann, S.: Aircraft-based observations of isoprene-epoxydiol-derived secondary organic aerosol (IEPOX-SOA) in the tropical upper troposphere over the Amazon region, Atmos. Chem. Phys., 18, 14979–15001, https://doi.org/10.5194/acp-18-14979-2018, 2018.
Seinfeld, J. H. and Pandis, S. N.: Atmospheric chemistry and physics: from air pollution to climate change, 3rd edition, A Wiley-Interscience publication, Wiley, Hoboken, NJ, USA, 1152 pp., ISBN 978-1-118-94740-1, 2016.
Siegman, A. E.: Lasers, University Science Books, Sausalito, CA, USA, XXII, 1283 pp., ISBN 0-935702-11-3, 1986.
Skinner, D. R. and Whitcher, R. E.: Measurement of the radius of a high-power laser beam near the focus of a lens, J. Phys. E Sci. Instrum., 5, 237–238, https://doi.org/10.1088/0022-3735/5/3/015, 1972.
Stark, H., Yatavelli, R. L. N., Thompson, S. L., Kimmel, J. R., Cubison, M. J., Chhabra, P. S., Canagaratna, M. R., Jayne, J. T., Worsnop, D. R., and Jimenez, J. L.: Methods to extract molecular and bulk chemical information from series of complex mass spectra with limited mass resolution, Int. J. Mass Spectrom., 389, 26–38, https://doi.org/10.1016/j.ijms.2015.08.011, 2015.
Stefanutti, L., Sokolov, L., Balestri, S., MacKenzie, A. R., and Khattatov, V.: The M-55 Geophysica as a Platform for the Airborne Polar Experiment, J. Atmos. Ocean. Tech., 16, 1303–1312, https://doi.org/10.1175/1520-0426(1999)016<1303:tmgaap>2.0.co;2, 1999.
Su, Y., Sipin, M. F., Furutani, H., and Prather, K. A.: Development and Characterization of an Aerosol Time-of-Flight Mass Spectrometer with Increased Detection Efficiency, Anal. Chem., 76, 712–719, https://doi.org/10.1021/ac034797z, 2004.
Suess, D. T. and Prather, K. A.: Mass spectrometry of aerosols, Chem. Rev., 99, 3007–3036, https://doi.org/10.1021/cr980138o, 1999.
Thomson, D. S., Middlebrook, A. M., and Murphy, D. M.: Thresholds for Laser-Induced Ion Formation from Aerosols in a Vacuum Using Ultraviolet and Vacuum-Ultraviolet Laser Wavelengths, Aerosol Sci. Technol., 26, 544–559, https://doi.org/10.1080/02786829708965452, 1997.
Tigges, L., Wiedensohler, A., Weinhold, K., Gandhi, J., and Schmid, H. J.: Bipolar charge distribution of a soft X-ray diffusion charger, J. Aerosol Sci., 90, 77–86, https://doi.org/10.1016/j.jaerosci.2015.07.002, 2015.
Timonen, H., Cubison, M., Aurela, M., Brus, D., Lihavainen, H., Hillamo, R., Canagaratna, M., Nekat, B., Weller, R., Worsnop, D., and Saarikoski, S.: Applications and limitations of constrained high-resolution peak fitting on low resolving power mass spectra from the ToF-ACSM, Atmos. Meas. Tech., 9, 3263–3281, https://doi.org/10.5194/amt-9-3263-2016, 2016.
Toon, O. B., Maring, H., Dibb, J., Ferrare, R., Jacob, D. J., Jensen, E. J., Luo, Z. J., Mace, G. G., Pan, L. L., Pfister, L., Rosenlof, K. H., Redemann, J., Reid, J. S., Singh, H. B., Thompson, A. M., Yokelson, R., Minnis, P., Chen, G., Jucks, K. W., and Pszenny, A.: Planning, implementation, and scientific goals of the Studies of Emissions and Atmospheric Composition, Clouds and Climate Coupling by Regional Surveys (SEAC4RS) field mission, J. Geophys. Res.-Atmos., 121, 4967–5009, https://doi.org/10.1002/2015JD024297, 2016.
Turpin, B. J., Huntzicker, J. J., Larson, S. M., and Cass, G. R.: Los Angeles summer midday particulate carbon: primary and secondary aerosol, Environ. Sci. Technol., 25, 1788–1793, https://doi.org/10.1021/es00022a017, 1991.
Vernier, J. P., Thomason, L., and Kar, J.: CALIPSO detection of an Asian tropopause aerosol layer, Geophys. Res. Lett., 38, L07804, https://doi.org/10.1029/2010gl046614, 2011.
Voigt, C., Kleine, J., Sauer, D., Moore, R. H., Bräuer, T., Le Clercq, P., Kaufmann, S., Scheibe, M., Jurkat-Witschas, T., Aigner, M., Bauder, U., Boose, Y., Borrmann, S., Crosbie, E., Diskin, G. S., DiGangi, J., Hahn, V., Heckl, C., Huber, F., Nowak, J. B., Rapp, M., Rauch, B., Robinson, C., Schripp, T., Shook, M., Winstead, E., Ziemba, L., Schlager, H., and Anderson, B. E.: Cleaner burning aviation fuels can reduce contrail cloudiness, Commun. Earth Environ., 2, 114, https://doi.org/10.1038/s43247-021-00174-y, 2021.
Vu, K. T., Dingle, J. H., Bahreini, R., Reddy, P. J., Apel, E. C., Campos, T. L., DiGangi, J. P., Diskin, G. S., Fried, A., Herndon, S. C., Hills, A. J., Hornbrook, R. S., Huey, G., Kaser, L., Montzka, D. D., Nowak, J. B., Pusede, S. E., Richter, D., Roscioli, J. R., Sachse, G. W., Shertz, S., Stell, M., Tanner, D., Tyndall, G. S., Walega, J., Weibring, P., Weinheimer, A. J., Pfister, G., and Flocke, F.: Impacts of the Denver Cyclone on regional air quality and aerosol formation in the Colorado Front Range during FRAPPÉ 2014, Atmos. Chem. Phys., 16, 12039–12058, https://doi.org/10.5194/acp-16-12039-2016, 2016.
Willis, M. D., Burkart, J., Thomas, J. L., Köllner, F., Schneider, J., Bozem, H., Hoor, P. M., Aliabadi, A. A., Schulz, H., Herber, A. B., Leaitch, W. R., and Abbatt, J. P. D.: Growth of nucleation mode particles in the summertime Arctic: a case study, Atmos. Chem. Phys., 16, 7663–7679, https://doi.org/10.5194/acp-16-7663-2016, 2016.
Xu, W., Croteau, P., Williams, L., Canagaratna, M., Onasch, T., Cross, E., Zhang, X., Robinson, W., Worsnop, D., and Jayne, J.: Laboratory characterization of an aerosol chemical speciation monitor with PM2.5 measurement capability, Aerosol Sci. Technol., 51, 69–83, https://doi.org/10.1080/02786826.2016.1241859, 2017.
Zelenyuk, A. and Imre, D.: Single particle laser ablation Time-of-Flight mass spectrometer: An introduction to SPLAT, Aerosol Sci. Technol., 39, 554–568, https://doi.org/10.1080/027868291009242, 2005.
Zelenyuk, A., Imre, D., Wilson, J., Zhang, Z., Wang, J., and Mueller, K.: Airborne Single Particle Mass Spectrometers (SPLAT II & miniSPLAT) and New Software for Data Visualization and Analysis in a Geo-Spatial Context, J. Am. Soc. Mass. Spectrom., 26, 257–270, https://doi.org/10.1007/s13361-014-1043-4, 2015.
Zhang, X., Smith, K. A., Worsnop, D. R., Jimenez, J., Jayne, J. T., and Kolb, C. E.: A Numerical Characterization of Particle Beam Collimation by an Aerodynamic Lens-Nozzle System: Part I. An Individual Lens or Nozzle, Aerosol Sci. Technol., 36, 617–631, https://doi.org/10.1080/02786820252883856, 2002.