the Creative Commons Attribution 4.0 License.
the Creative Commons Attribution 4.0 License.
 | 20 Jun 2023
Particle shapes and infrared extinction spectra of nitric acid dihydrate (NAD) crystals: optical constants of the β-NAD modification
Alexander D. James
Victoria L. Frankland
Ottmar Möhler
Benjamin J. Murray
John M. C. Plane
Harald Saathoff
Ralf Weigel
Martin Schnaiter
Satellite- and aircraft-based mid-infrared measurements of polar stratospheric clouds (PSCs) have provided spectroscopic evidence for the presence of β-NAT (nitric acid trihydrate) particles. Metastable nitric acid hydrate phases such as α-NAT and α-NAD (nitric acid dihydrate) have been frequently observed in laboratory experiments but not yet detected as a constituent of PSCs in atmospheric measurements. As for the β-NAD modification, its formation was first observed in X-ray diffraction measurements when the low-temperature α-NAD phase was warmed to a temperature above 210 K. Its infrared spectrum has been reported, but so far no optical constants have been derived that could be used as input for infrared retrievals of PSC composition. In this work, we show that β-NAD particles were efficiently formed in isothermal heterogeneous crystallisation experiments at 190 K from supercooled HNO3/H2O solution droplets containing an embedded mineral dust or meteoric smoke particle analogue. An inversion algorithm based on a T-matrix optical model was used to derive for the first time the mid-infrared complex refractive indices of the β-NAD modification from the measured extinction spectrum of the particles. In contrast to the heterogeneous crystallisation experiments, the α-NAD phase was formed when the HNO3/H2O solution droplets did not contain a solid nucleus and crystallised homogeneously. Using a light-scattering detector that recorded two-dimensional scattering patterns of the crystallised NAD particles, we were able to determine predominant shapes of the α- and β-NAD crystals. We found that α-NAD grew into elongated, needle-shaped crystals, while β-NAD particles were compact in shape. This agrees with previously reported images of α- and β-NAD particles grown on the cryo-stage of an environmental scanning electron microscope. While direct evidence for the existence of metastable NAD in the polar stratosphere is still lacking, our experiments add to the wealth of previous laboratory studies that have identified various conditions for the rapid growth of metastable compositions. In the atmosphere, these could be intermediate states that transform into thermodynamically stable NAT on longer timescales in aged PSCs.
- Article
(6350 KB) - Full-text XML
- BibTeX
- EndNote


Laboratory studies, field campaigns, and space-borne observations have led to a comprehensive knowledge of the formation, occurrence, and composition of polar stratospheric clouds (PSCs) (Lowe and MacKenzie, 2008; Peter and Grooß, 2012; Molleker et al., 2014; Tritscher et al., 2021). An important constituent of PSCs are crystalline nitric acid hydrates, in particular nitric acid trihydrate (NAT) and nitric acid dihydrate (NAD), both of which exist in two different phases, called the α and β modifications (Koehler et al., 1992; Toon et al., 1994; Lebrun et al., 2001a, b; Tizek et al., 2002; Grothe et al., 2008; Iannarelli and Rossi, 2015). For each compound, the α phase denotes the low-temperature modification that irreversibly transforms into the more stable β phase upon annealing at higher temperature. The trihydrate NAT, along with the monohydrate NAM, is one of the two thermodynamically stable hydrate phases of the HNO3/H2O system (Lebrun et al., 2001b; Beyer and Hansen, 2002), and the first detection of NAT in the polar vortex was carried out with a balloon-borne mass spectrometer (Voigt et al., 2000). Mid-infrared limb-emission measurements with the satellite-based spectrometer MIPAS (Michelson Interferometer for Passive Atmospheric Sounding) identified which of the two NAT modifications was predominant. The distinctive PSC spectral signature at a wavenumber of 820 cm−1, corresponding to the ν2 symmetric deformation mode of the NO ion (Höpfner et al., 2002; Spang and Remedios, 2003), could be best matched by refractive index data for β-NAT (Höpfner et al., 2006). The β-NAT phase was also identified in broadband infrared transmittance spectra recorded between 4400 and 750 cm−1 with the Fourier transform spectrometer on board the Atmospheric Chemistry Experiment (ACE) satellite (Lecours et al., 2022, 2023).
Homogeneous nucleation of NAT particles from supercooled ternary solution droplets (STS; H2SO4/HNO3/H2O) has been considered to proceed too slowly under stratospheric conditions to explain the observed NAT number densities in the stratosphere (Koop et al., 1995; Knopf, 2006). Instead, the heterogeneous nucleation of NAT on pre-existing ice particles is a widely accepted formation mechanism (Tritscher et al., 2021; Weimer et al., 2021), supported, for example, by the detection of NAT particles downwind from mountain-wave-induced ice clouds (Carslaw et al., 1998). Furthermore, there is growing evidence for an additional ice-free NAT formation pathway (Pagan et al., 2004; Voigt et al., 2005), which could involve the heterogeneous nucleation of NAT on refractory aerosol particles (Bogdan and Kulmala, 1999; Hoyle et al., 2013; James et al., 2018, 2023). The origin of these particles includes the input of meteoric ablation material from the upper stratosphere and mesosphere (Murphy et al., 2014; Weigel et al., 2014; Ebert et al., 2016; Schneider et al., 2021).
Although only β-NAT – but no metastable phase such as α-NAD, β-NAD, or α-NAT – has been observed in the stratosphere so far, it is not certain whether β-NAT must necessarily be the polymorph that crystallises first by either homogeneous or heterogeneous nucleation. This is a consequence of Ostwald's step rule, which states that the formation of the thermodynamically stable polymorph can proceed via various intermediate, metastable states, whose crystallisation may have a lower kinetic barrier due to a better structural match with the short-range order of the supersaturated liquid phase (Ostwald, 1897). The kinetic stability of a certain metastable phase in the HNO3/H2O system depends on the temperature, the stoichiometry of the supersaturated liquid phase, and other factors such as stabilising effects due to an ice surface (Tizek et al., 2002, 2004; Grothe et al., 2008; Weiss et al., 2016). In a study using an aerosol flow tube, supercooled HNO3/H2O solution droplets of 1 : 3 molar stoichiometry were first cooled to 153 K and then warmed to 178 K to accelerate the crystal growth of the nuclei formed homogeneously at 153 K (Bertram and Sloan, 1998b). This technique allowed the infrared extinction spectrum of the completely crystalline particle ensemble to be recorded at 178 K, showing a good match with a Mie theory calculation using the optical constants for α-NAT (Richwine et al., 1995). Recent work emphasised the importance of the α-NAT phase also with respect to the heterogeneous nucleation pathway involving ice particles (Weiss et al., 2016). This study showed that α-NAT could be easily grown on a water ice film at temperatures below 188 K due to the absence of a significant nucleation barrier. Upon warming, α-NAT completely converted to β-NAT within a narrow temperature range of 187.5 to 195 K (Weiss et al., 2016). A considerable number of aerosol chamber and flow tube studies have also demonstrated the nucleation of NAD particles (Barton et al., 1993; Disselkamp et al., 1996; Bertram and Sloan, 1998a; Prenni et al., 1998; Tisdale et al., 1999; Möhler et al., 2006a; Stetzer et al., 2006; Iannarelli and Rossi, 2015). The occurrence of this nucleation process is understandable due to the lower nucleation barrier for NAD formation compared to the high saturation ratios required for NAT nucleation (Salcedo et al., 2001). In the vast majority of cases, these studies found the formation of the α-NAD modification, which can be explained by the fact that the α-NAD structure corresponds better to the short-range order of the supersaturated liquid phase than the three-dimensional network of H bonds characteristic of β-NAD (Grothe et al., 2004). Only the infrared spectra presented in Tisdale et al. (1999) of NAD particles formed below 160 K, which were annealed at temperatures between 160 and 221 K, clearly showed the spectral signatures later ascribed to β-NAD (Grothe et al., 2004).
In addition to the question of which polymorphic form predominates, the particle shape of the nitric acid hydrates is another important factor as it can influence the vertical redistribution of HNO3 in the winter stratosphere by changing the settling velocities of the particles (Grooß et al., 2014; Woiwode et al., 2014). The peak-like signature of the ν2 nitrate mode at 820 cm−1 analysed by Höpfner et al. (2006) was best fit with compact particle shapes, representing high densities of small β-NAT particles with radii <3 µm. Further airborne and space-borne MIPAS measurements revealed a modified, shoulder-like signature at 820 cm−1 first observed in local Arctic PSC flights and later detected as a vortex-wide signature in the 2011/12 Arctic winter stratosphere (Woiwode et al., 2016, 2019). This signature could only be accurately fitted for larger (equal-volume sphere radii of 3–7 µm) and highly aspherical β-NAT particles, which have needle- or platelet-like shapes with aspect ratios (ARs) of 1:10 and 10:1, respectively. The best overall agreement between simulation and measurement was achieved for elongated, needle-shaped particles with AR =0.1, which is supported by laboratory experiments showing that needles can develop when β-NAT grows at an ice boundary at 193 K (Grothe et al., 2006). Note that the particle size distribution parameters of β-NAT can also change the spectral features in the range from 810 to 820 cm−1, even if the simulations are limited to spherical particles (Kalicinsky et al., 2021). Increasing the median diameter transforms the 820 cm−1 peak into a shifted peak and further into a step-like signature (Kalicinsky et al., 2021). But only highly aspherical particle shapes could also explain the unexpectedly large optical diameters (in some cases larger than 20 µm) of HNO3-containing particles detected with aircraft-borne optical in situ instruments (forward scattering and optical array imaging probes) (Molleker et al., 2014). For compact particle shapes, such sizes could not be reconciled with simulations based on realistic values for the sedimentation velocity and the time available for particle growth (Molleker et al., 2014). However, they can now likely be interpreted as the maximum dimension of highly elongated β-NAT particles (Molleker et al., 2014; Woiwode et al., 2016). Tritscher et al. (2021) argued that although particle growth probably starts with a nearly spherical geometry, further growth in slightly supersaturated vapours can lead to a higher degree of asphericity, resulting in different particle shapes depending on the nucleation mechanism and growth history.
The same effect has been observed in our previous AIDA (Aerosol Interaction and Dynamics in the Atmosphere) cloud chamber study on the homogeneous nucleation of α-NAD particles from aqueous HNO3/H2O solution droplets (Wagner et al., 2005a). The infrared spectrum of α-NAD particles generated by shock freezing of a gas mixture of nitric acid and water could be accurately fitted using Mie theory with tabulated optical constants of α-NAD (Toon et al., 1994; Niedziela et al., 1998), pointing to compact, near-spherical particle shapes. In contrast, homogeneous nucleation of α-NAD from populations of slowly evaporating supercooled HNO3/H2O solution droplets at 193 and 195 K over a timescale of 4 h yielded markedly different α-NAD infrared extinction spectra, which could no longer be reconciled with Mie theory. In particular, we observed a strong change in the relative peak intensities of the characteristic nitrate doublet feature with components at about 1450 and 1280 cm−1. These spectral changes could be modelled satisfactorily when strongly aspherical particle shapes were considered in the calculation of the α-NAD extinction spectrum, i.e. AR ≤0.2 for prolate and ≥5 for oblate shapes (Wagner et al., 2005a). We concluded that the platelet-like, oblate shapes matched the measured extinction spectra slightly better than the needle-like, prolate ones, but we did not have an instrument to directly measure particle shape at that time. A few years later, the growth of needle-like α-NAD crystallites was observed on the cryo-stage of an ESEM (environmental scanning electron microscope) (Grothe et al., 2008). With regard to the characterisation of airborne α-NAD particles, which grew to median equal-volume sphere diameters of about 2–3 µm in our previous studies, we highlighted the possibility of growing them in future experiments to sizes larger than 10 µm so that their shape could be resolved by a commercial cloud particle imager (Wagner et al., 2005a). However, further instrumental developments such as the small ice detector 3 (SID-3), which measures high-resolution two-dimensional scattering patterns, make it possible to circumvent the size limitation of imaging probes and obtain shape information even for particle sizes below 10 µm (Ulanowski et al., 2014; Vochezer et al., 2016). In the first part of this article, we report the repetition of the homogeneous nucleation experiment from our earlier study but now including particle characterisation with the SID-3, in order to finally answer the question of the predominant shape of homogeneously nucleating α-NAD particles that grow slowly in a supersaturated environment.
In the second and central part of this article, we look at a different type of experiment to investigate one of the heterogeneous nucleation mechanisms of nitric acid hydrates. Specifically, we targeted the crystallisation of HNO3/H2O solution droplets with an embedded refractory component that was either a mineral dust particle (illite SE, Arginotec) or a surrogate for meteoric ablation material (sol–gel synthesised olivine, MgFeSiO4). Illite SE is a mixture of several minerals, dominated by illite (Pinti et al., 2012), hereafter referred to simply as “illite”. Nucleation activities of meteoric materials for the formation of nitric acid hydrates have already been measured with a drop freezing assay (James et al., 2018, 2023). While the onset of melting of the frozen droplets was mostly in agreement with the NAT/ice eutectic, some experiments indicated the melting or recrystallisation of metastable phases (James et al., 2023). The nature of these metastable phases or that of the phase that first nucleated from the solution droplets was not the focus of these studies. In the AIDA chamber, the infrared extinction and SID-3 measurements allow for an unambiguous identification of the phase and shape of the nucleated nitric acid hydrate particles. We will show that the heterogeneous nucleation experiments led to crystallisation and growth of compact β-NAD particles. To our knowledge, direct nucleation of β-NAD has not yet been observed in experiments with suspended particles. Furthermore, β-NAD is the only polymorph whose infrared optical constants have not yet been determined. We therefore present an analysis to derive the refractive index data set for β-NAD from our measured infrared extinction spectrum, following an approach recently applied to crystalline ammonium nitrate particles (Wagner et al., 2021). Although not yet identified in the polar stratosphere, our experiments further support the assumption that the formation of metastable NAD phases should not be excluded a priori. The new optical constants should thus fill a gap for the analysis of current and future infrared measurements of polar stratospheric clouds. In anticipation of a later more detailed discussion of possible NAD/NAT nucleation mechanisms, we would like to emphasise here that our experiments address a particular heterogeneous nucleation process for β-NAD, i.e. immersion freezing induced by specific solid seed aerosol particles. This differs from other studies such as Iannarelli and Rossi (2015), where the deposition of HNO3 vapour on pure H2O ice led to the almost barrier-free growth of α-NAT and NAD. Iannarelli and Rossi (2015) also showed that the type of particles formed was sensitive to the partial pressure of HNO3, with lower values favouring the formation of α-NAT. Depending on the freezing mechanism, neither α- nor β-NAD could therefore be accessible at all.
Our article is organised as follows. Section 2 summarises our experimental and theoretical methods, including the instrumentation of the AIDA chamber and the general procedure of the crystallisation studies (Sect. 2.1), the image analysis of the SID-3 scattering patterns (Sect. 2.2), and the retrieval scheme for determining the infrared optical constants of β-NAD (Sect. 2.3). In the results section, we first give a general overview of the AIDA data for the two types of experiments that yielded different NAD polymorphs, i.e. α-NAD in the homogeneous experiment and β-NAD in the heterogeneous nucleation experiment (Sect. 3.1). Section 3.2 describes the predominant shape of the α-NAD particles based on the analysis of the SID-3 measurements, while Sect. 3.3 then presents the new data set of optical constants for β-NAD. A summary with an outlook on future chamber experiments concludes our article (Sect. 4).
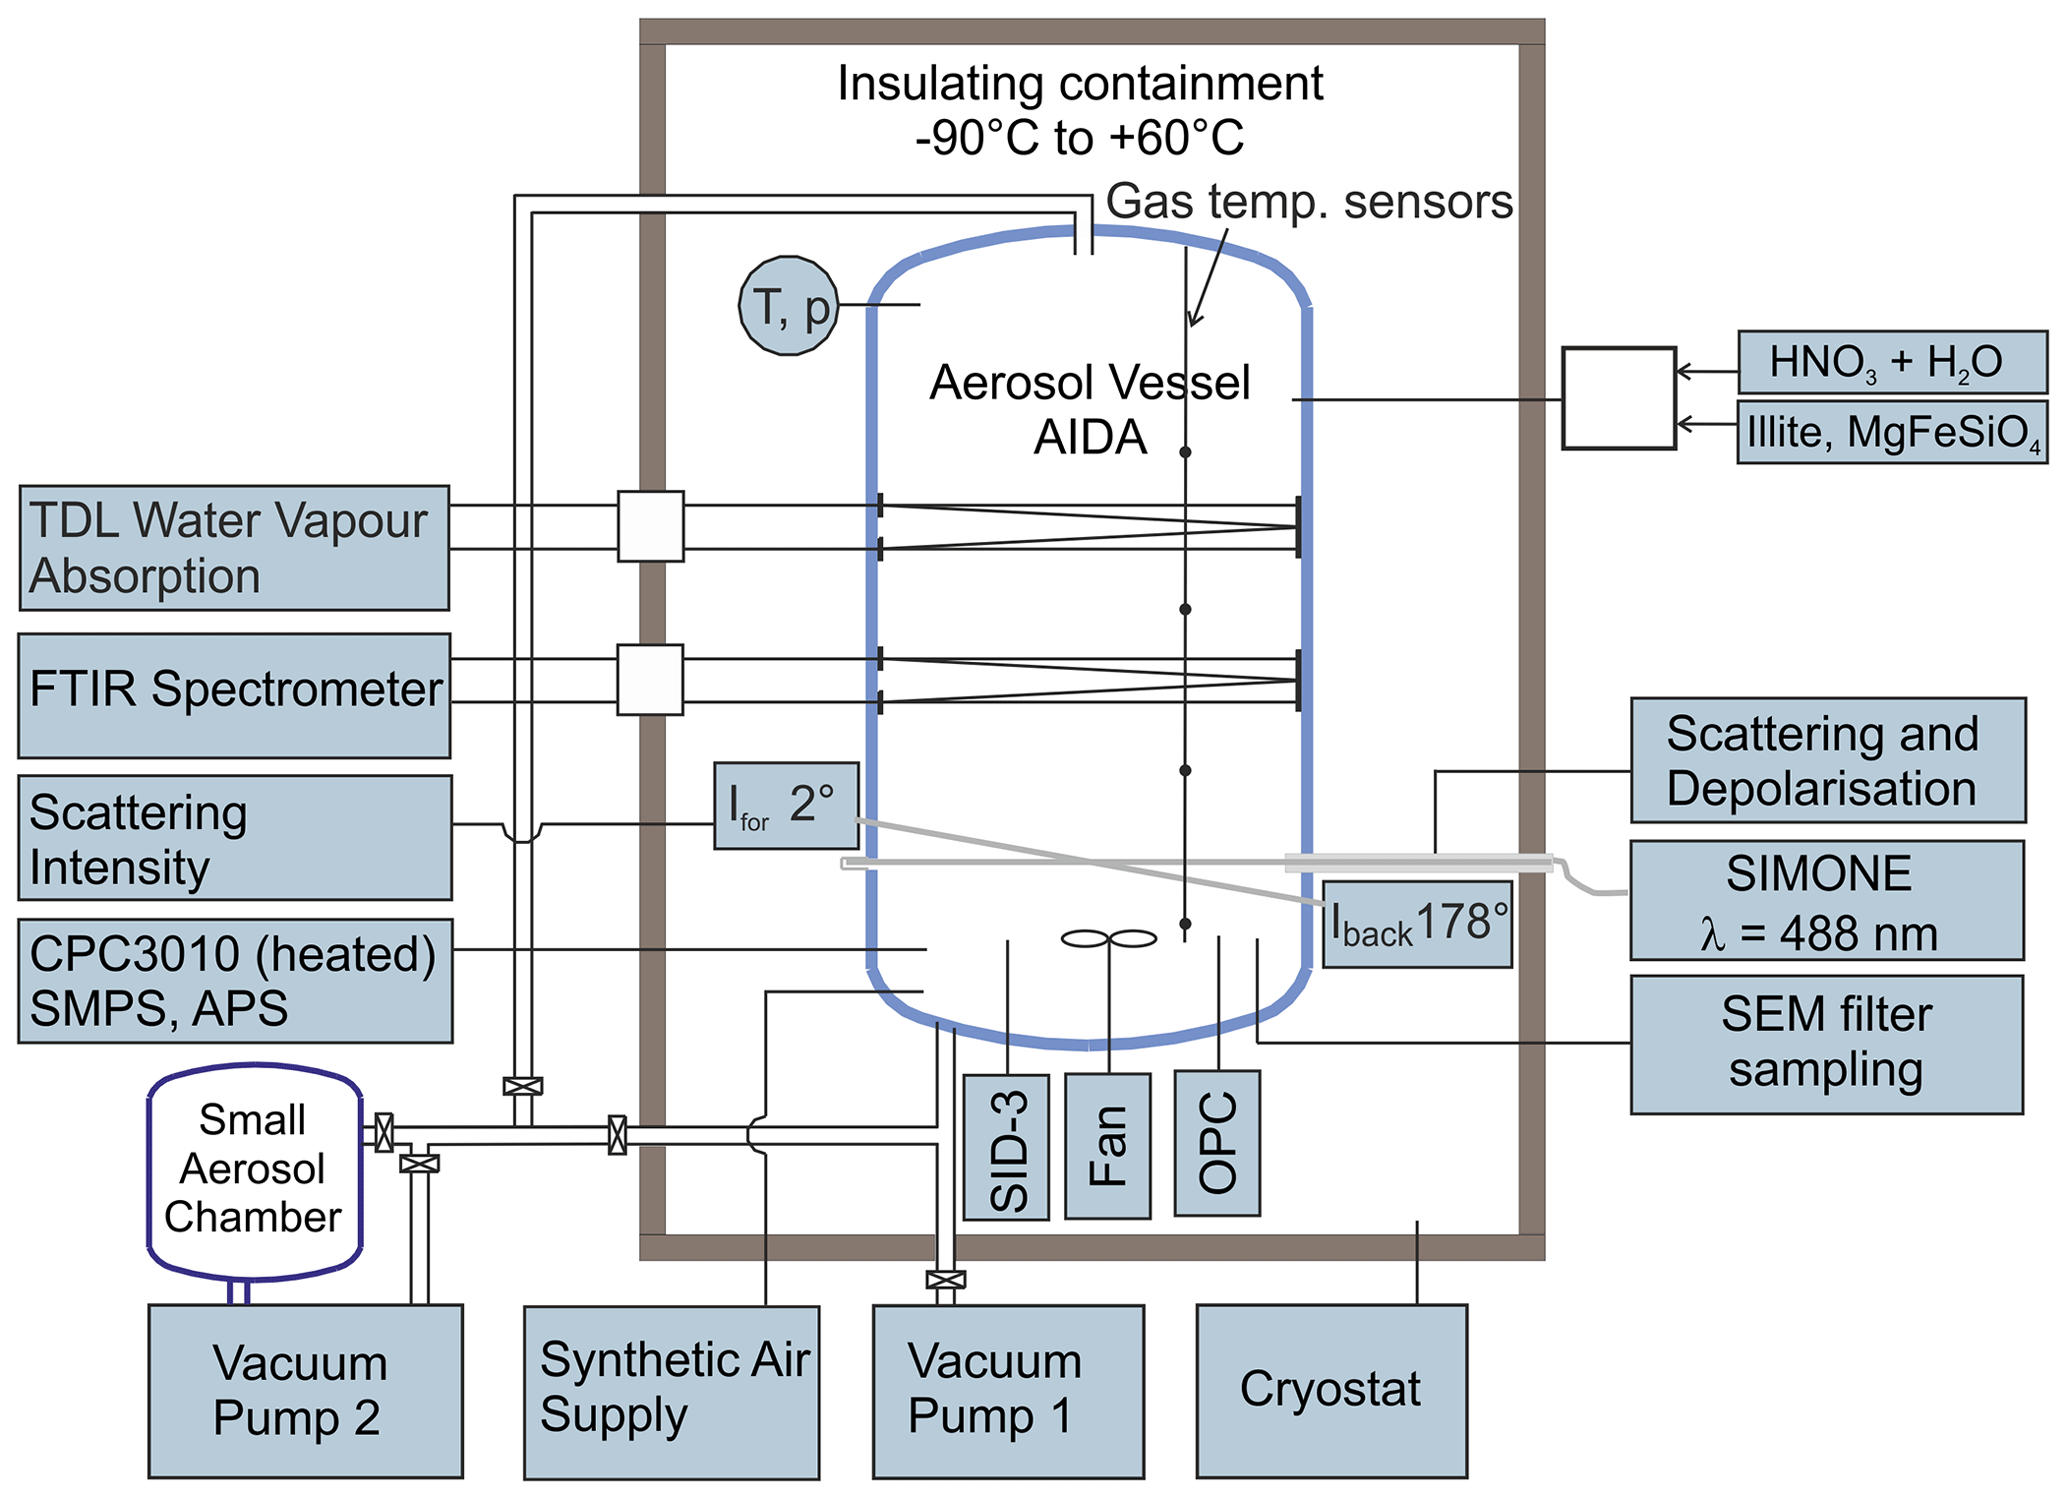
Figure 1Schematic diagram of the instrumentation of the AIDA aerosol and cloud chamber facility. The instruments (and their respective abbreviations) used in this work are described in more detail in Sect. 2.1 and 2.2.
2.1 Instrumentation and experimental procedure
The AIDA aerosol and cloud chamber is a coolable and evacuable aluminium chamber with a volume of 84 m3 (Fig. 1). Its scope of application ranges from dynamic expansion cooling experiments on cloud formation on timescales of a few minutes to long-term studies on aerosol particle nucleation and ageing on timescales of several days, both at ambient temperatures and conditions of the upper troposphere and lower stratosphere, with a minimum achievable temperature of about 180 K (Wagner et al., 2006b). The experiments presented here are largely based on the procedure and instrumentation used in our earlier studies on the homogeneous nucleation of α-NAD from binary supercooled HNO3/H2O solution droplets (Wagner et al., 2005a; Möhler et al., 2006a; Stetzer et al., 2006). In the following, we will briefly summarise this set-up and include the novel aspects of our current work, i.e. the addition of refractory particles to induce heterogeneous nucleation.
As a first step, the insulating containment that houses the AIDA chamber was cooled within 24 h from room temperature to about 190 K, where most of the experiments described in this article were performed. The gas temperature was calculated as the average value from four thermocouple sensors mounted at different heights inside the chamber, with an estimated uncertainty of ±0.3 K. Before each experiment, the chamber was cleaned by evacuating it to a pressure <1 hPa, flushing it several times with particle-free and dry synthetic air, and refilling it with the synthetic air to ambient pressure. The initial relative humidity of the chamber air with respect to ice (RHice) was about 10 %, given as the percentage of the ratio between the water vapour pressure measured directly with an in situ tuneable diode laser (TDL) absorption spectrometer (Fahey et al., 2014) and the saturation water vapour pressure of ice at the mean AIDA gas temperature (Murphy and Koop, 2005). The relative uncertainty of RHice was estimated to ±5 % (Fahey et al., 2014). A mixing fan mounted about 1 m above the floor of the chamber was in operation for the entire duration of the experiments, resulting in a mixing time of 1.5 min.
To generate pure HNO3/H2O solution droplets for the homogeneous crystallisation experiments that yielded α-NAD, we prepared carrier gases of water and nitric acid by passing two synthetic air flows over flasks filled with ultrapure water (Barnstead NanoPure System, Thermo Scientific) and concentrated nitric acid (65 %, Merck). The mixed carrier gases were injected into the AIDA chamber through a heated Teflon tube. The individual flow rates were adjusted to yield a molar ratio of H2O to HNO3 of about 3:1 in the gas mixture. Upon entering the cold chamber interior, the now supersaturated nitric acid–water gas mixture condensed into supercooled HNO3/H2O solution droplets by binary homogeneous nucleation. Injection was continued until an aerosol mass concentration of about 2.2–2.7 mg m−3 was reached, which provided a sufficient reservoir to ensure a good signal-to-noise ratio in the infrared measurements for the long-term observation of the slowly evaporating solution droplets that eventually led to the crystallisation of α-NAD particles after a couple of hours. For the experiments on heterogeneous nucleation that yielded β-NAD, we admixed a gas flow that contained the dispersed illite or MgFeSiO4 particles to the gaseous nitric acid–water mixture. This ensured that a part of the HNO3 and H2O gases condensed onto the solid particles as they entered the cooled AIDA chamber, resulting in a certain fraction of internally mixed solid–liquid particles whose crystallisation behaviour was markedly different from that of the pure liquid HNO3/H2O solution droplets. A rotating-brush generator (Palas GmbH, RBG 1000) was used to disperse the illite and the amorphous MgFeSiO4 powder sample. The latter was synthesised using a sol–gel technique (Frankland et al., 2015; James et al., 2017). The number concentration of the co-added solid seed aerosol particles was measured with a condensation particle counter (model CPC3010, TSI) connected to a heated sampling line. Aerosol size distribution measurements will be described later in this article.
The temporal evolution of the HNO3/H2O droplet mode (with and without seed aerosol particles) and the crystallisation of nitric acid hydrates were observed by using four types of instruments. They either provided in situ measurements or sampled the particles and probed them inside the cooled insulating containment at the same temperature as inside the AIDA chamber. The instrument set-up included an infrared spectrometer, a device for light-scattering and depolarisation measurements, an optical particle counter (OPC), and the SID-3 instrument. In the following, we give a brief description of the first three measurement techniques, whereas the operation of the SID-3 and the analysis of its measurement data are described in detail in Sect. 2.2. The use and mutual complementarity of the individual instrumental techniques are further discussed in Sect. 3.1, where we show time series of the AIDA data for the homogeneous and heterogeneous crystallisation experiments.
The infrared extinction measurements were carried out in situ by coupling a Fourier transform infrared spectrometer (IFS66v, Bruker) with an internal multiple reflection cell set to an optical path length of 197 m (Wagner et al., 2006a). The spectra were recorded at wavenumbers between 6000 and 800 cm−1 with a resolution of 4 cm−1. All measured spectra displayed in this article were corrected for imbalances in the gas-phase CO2 concentration between the reference runs before aerosol injection and the later sample runs in the wavenumber range from 2400 to 2280 cm−1. In the initial phase of the experiment, the infrared spectra could be analysed to determine the composition and mass concentration of the supercooled solution droplets (Stetzer et al., 2006), based on Mie calculations using the temperature- and composition-dependent optical constants of HNO3/H2O (Norman et al., 1999). In the later period, the crystallisation of the particles could be clearly detected by changing frequencies and intensities of the vibrational modes during the transition from the liquid to the solid phase (Wagner et al., 2005a). The detailed steps that were necessary to retrieve the optical constants of β-NAD from its measured infrared extinction spectrum are described in Sect. 2.3. The light-scattering and depolarisation measurements were equally carried out in situ with the so-called SIMONE instrument, which mimics the atmospheric polarisation lidar technique inside the AIDA chamber (Schnaiter et al., 2012). In this set-up, the linearly polarised light of a continuous-wave semiconductor laser with an emission wavelength of 488 nm was guided horizontally through the aerosol vessel and absorbed by a beam dump on the opposite chamber side. The light backscattered from the aerosol particles in the centre of the chamber was collected by telescope optics at a scattering angle of 178∘. A Glan laser prism separated the backscattered light into its parallel and perpendicular components with respect to the polarisation state of the incident laser, and the respective scattering intensities were measured by two independent photomultipliers. Taking into account the relative sensitivities of the two individual photomultipliers, the intensity ratio of the perpendicular and parallel components yielded the near-backscattering linear depolarisation ratio, δ. While δ is zero for light scattering by homogeneous, spherical solution droplets, aspherical particles such as crystalline nitric acid hydrates cause non-zero depolarisation, with the exact magnitude revealing a complex relationship with particle size and aspect ratio (Mishchenko et al., 1996). Most importantly, the magnitude of δ cannot be simply related to the degree of asphericity, which means that δ is not necessarily higher the more the aspect ratio of the particles deviates from unity. For example, it has been shown that highly aspherical particles have only a weak depolarisation capability (Zakharova and Mishchenko, 2000, 2001), an aspect we will return to when discussing the δ values observed for the α- and β-NAD particles in our homogeneous and heterogeneous nucleation experiments.
Both the OPC sensor and the SID-3 instrument were mounted in the free space between the bottom of the cloud chamber and the floor of the insulating housing (see Fig. 1). Vertical connecting tubes were used to minimise particle transport losses. The OPC sensor (welas, Palas GmbH) measured the intensity and pulse duration of the light-scattering signals caused by individual particles as they passed through its measurement cell. The electronic unit of the OPC with light source and photomultiplier detector was located outside the insulating housing and was connected to the sensor unit with optical fibres. Based on the number of pulses, their duration, and the volume of the measurement cell, the total number concentration of particles detected could be calculated with an estimated uncertainty of ±20 % (Möhler et al., 2006b). Furthermore, based on Mie calculations that took into account the spectrum of the incident light, the scattering geometry of the sensor, and the refractive index of the particles, the intensity of the scattering signal was assigned to an optical particle diameter. For a refractive index of 1.45, the size classification ranged from 0.45 to 24.0 µm. For aspherical particles such as nitric acid hydrates, these diameters can only be interpreted as apparent sizes, as the scattering phase function is a function of particle shape and also depends on the orientation of the particles in the detection volume (Benz et al., 2005).
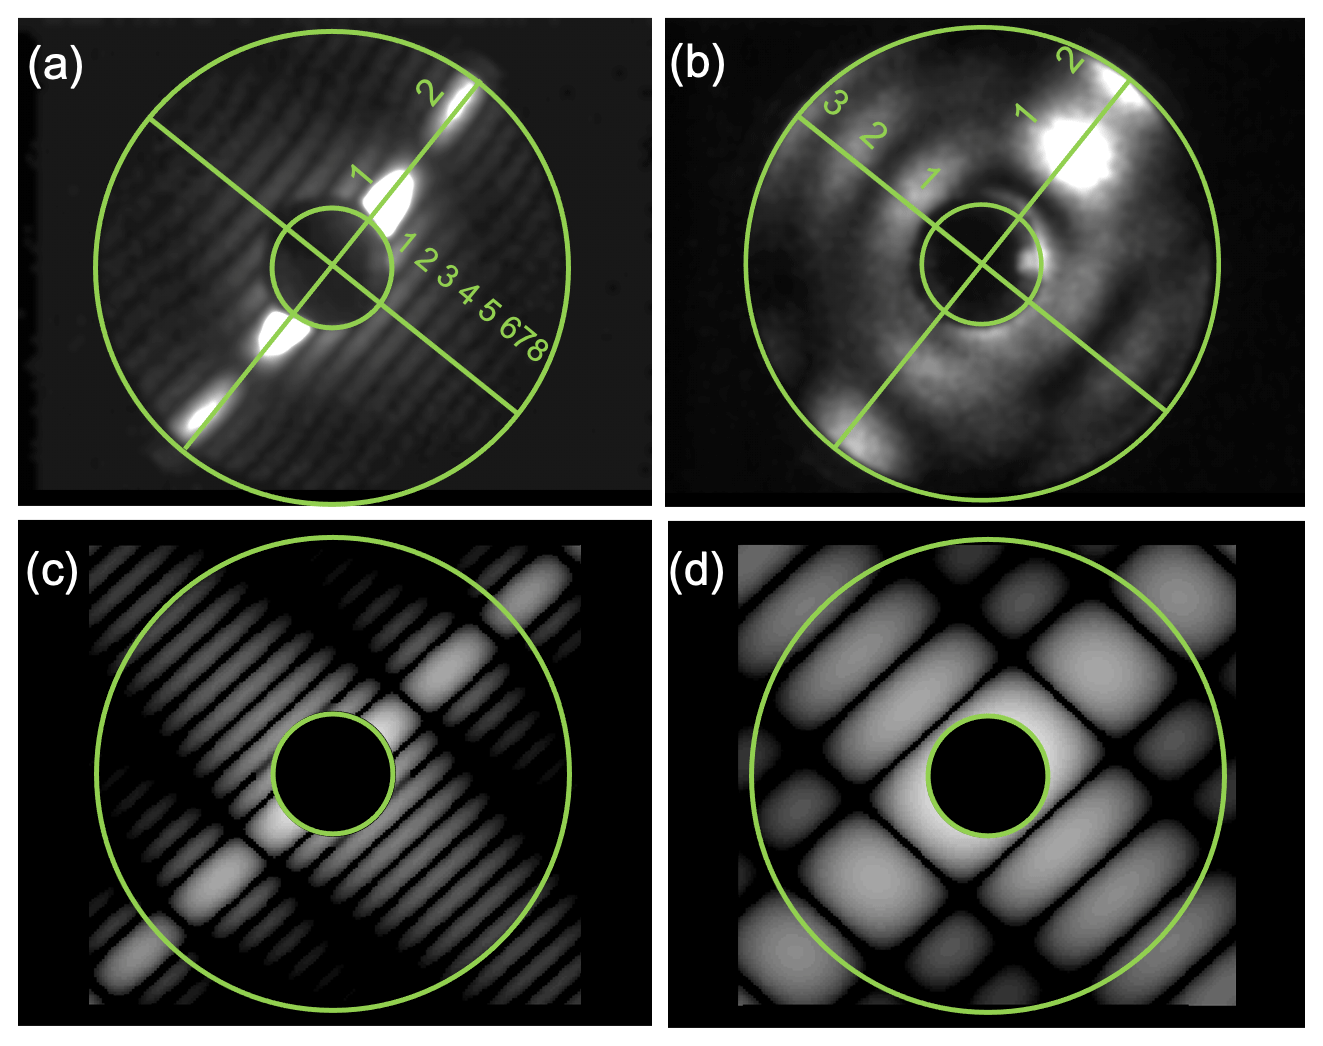
Figure 2Examples of 2-D forward-scattering patterns of an α-NAD particle (a) and a β-NAD particle (b) captured by SID-3 during homogeneous and heterogeneous NAD nucleation experiments in AIDA, respectively. The two-fold azimuthal symmetry of the patterns indicates particles with two main orthogonal axes like cylinders or spheroids. The ratio of the number of maxima counted along the two symmetry directions in the patterns (diagonal green lines and numbers in a and b) is used to determine the aspect ratio of the particle. Simulated far field diffraction patterns of 2-D rectangular obstacles with aspect ratios of 4 and 1.5 are shown in (c) and (d), respectively.
2.2 The SID-3 instrument: operation and analysis of the scattering images
The small ice particle detector Mk. 3 (SID-3) is an airborne single-particle probe developed by the University of Hertfordshire, UK. It is part of the SID family used to discriminate between supercooled liquid droplets and ice particles in mixed-phase clouds (SID-1) (Hirst et al., 2001), as well as to characterise the size, shape, and structural complexity of small ice crystals and large aerosol particles (SID-2 and SID-3) (Cotton et al., 2013; Schnaiter et al., 2016). The basic measurement concept of SID-3 is to acquire two-dimensional (2-D) light-scattering patterns of individual particles in the 7 to 23∘ forward angular range with a high resolution of better than 0.1∘. This is realised by capturing a full azimuthal scattering annulus by an intensified charged-coupled device (ICCD) camera equipped with a Fourier lens system. Since coherent laser light with a wavelength of 532 nm is used in SID-3, the forward-scattering pattern contains a significant contribution from light diffraction that is analysed to classify the particle shape (Fig. 2). Details of the SID-3 image analysis and shape classification software can be found in Vochezer et al. (2016). In this work we used SID-3 to determine the aspect ratio of α- and β-NAD particles that frequently showed two-fold symmetrical scattering patterns with clearly countable diffraction maxima along the two main axes of the particle (Fig. 2a and b). Representative scattering patterns were selected from the individual experiments and manually inspected to deduce the aspect ratio of the particle as the number ratio of diffraction maxima that were counted along the two symmetry axes of the scattering pattern. In this analysis, the SID-3 ICCD images are interpreted as far field diffraction patterns generated from 2-D obstacles, i.e. rectangles or ellipses. In fact, far field diffraction pattern simulations assuming simple 2-D obstacles nicely mimic the measured patterns (Fig. 2c and d). However, a discrimination between 3-D particle shape attributes like “prolate” and “oblate” is not possible based on this analysis.
The SID-3 instrument was installed into a heatable, vacuum-sealed stainless-steel canister in a strict vertical orientation underneath the AIDA chamber. One of the 10 mm inner diameter vertical sampling tubes of the chamber was connected to the SID-3 canister in a way that the tube end was located about 10 mm in front of the sensing area of the instrument. During the experiments air from the chamber was sampled through the sampling tube and through the instrument canister by applying a constant mass flow of 50 slpm resulting in a terminal particle speed of about 10 m s−1 at the sensing area of the instrument.
2.3 Retrieval scheme for deriving the optical constants of β-NAD
The iterative scheme for deriving the optical constants of β-NAD from the measured infrared extinction spectrum follows our approach recently developed for ammonium nitrate particles (Wagner et al., 2021). We briefly summarise it here with the adjustments that were necessary for the case of β-NAD. The flowchart of the retrieval procedure is shown in Fig. 3. The wavenumber-dependent optical constants are the real, , and the imaginary part, , of the complex refractive index ; that is, . The two quantities are not independent but are connected by the Kramers–Kronig relationship, which in its subtractive form can be written as follows (Ahrenkiel, 1971; Milham et al., 1981; Segal-Rosenheimer and Linker, 2009):
P is the notation for the Cauchy principal value of the integral. The real part of can thus be calculated for any given wavenumber , provided that is known for a sufficiently large wavenumber range. The integral is evaluated around the anchor point value , which is a known value for the real part of the complex refractive index at a certain wavenumber . The basic idea of the retrieval method is to start with an initial guess of the spectrum, derive the corresponding spectrum with Eq. (1), and use these in an optical model together with the size distribution of the β-NAD particles to calculate the infrared extinction spectrum. An optimisation algorithm is then used to iteratively adjust the spectrum to minimise the root mean square deviation (RMSD) between the measured and the calculated extinction spectrum.
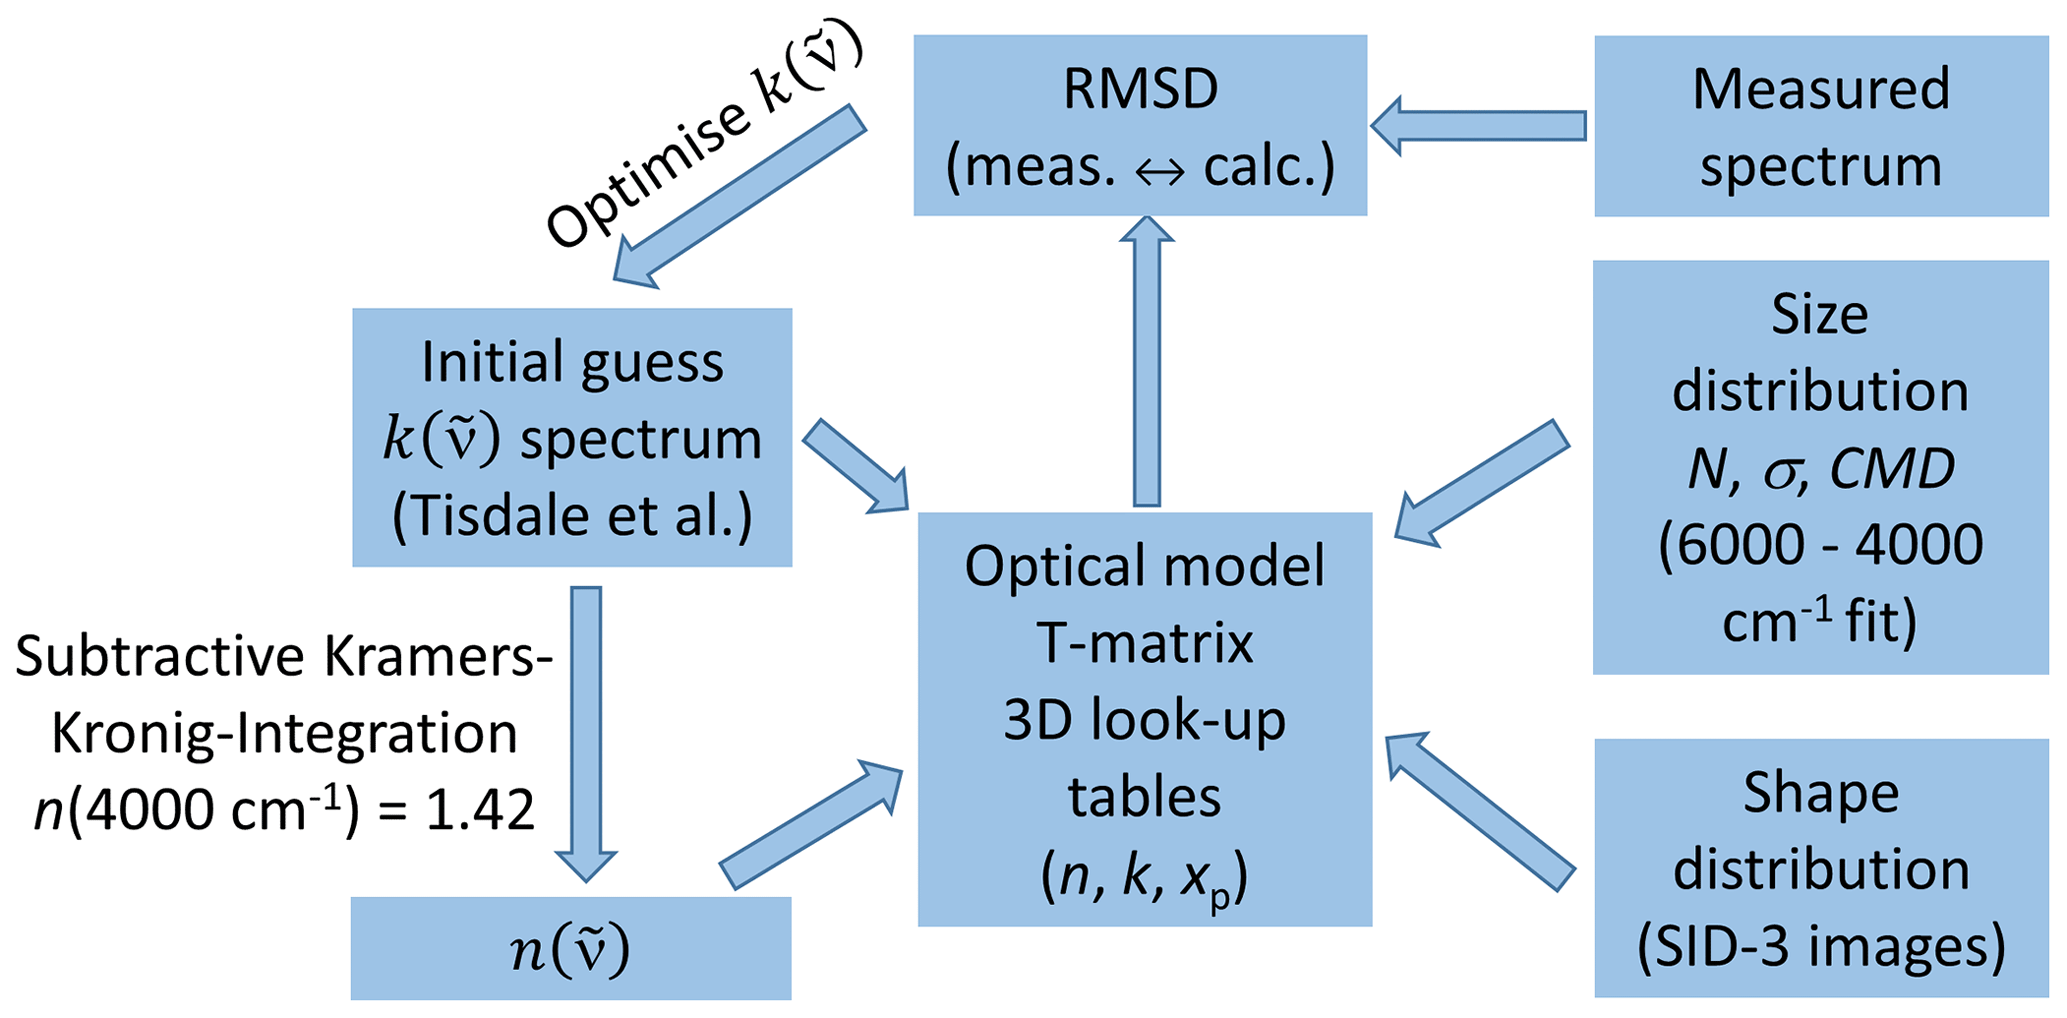
Figure 3Retrieval scheme for deriving the optical constants of β-NAD. See Sect. 2.3 for more details and explanation of abbreviations.
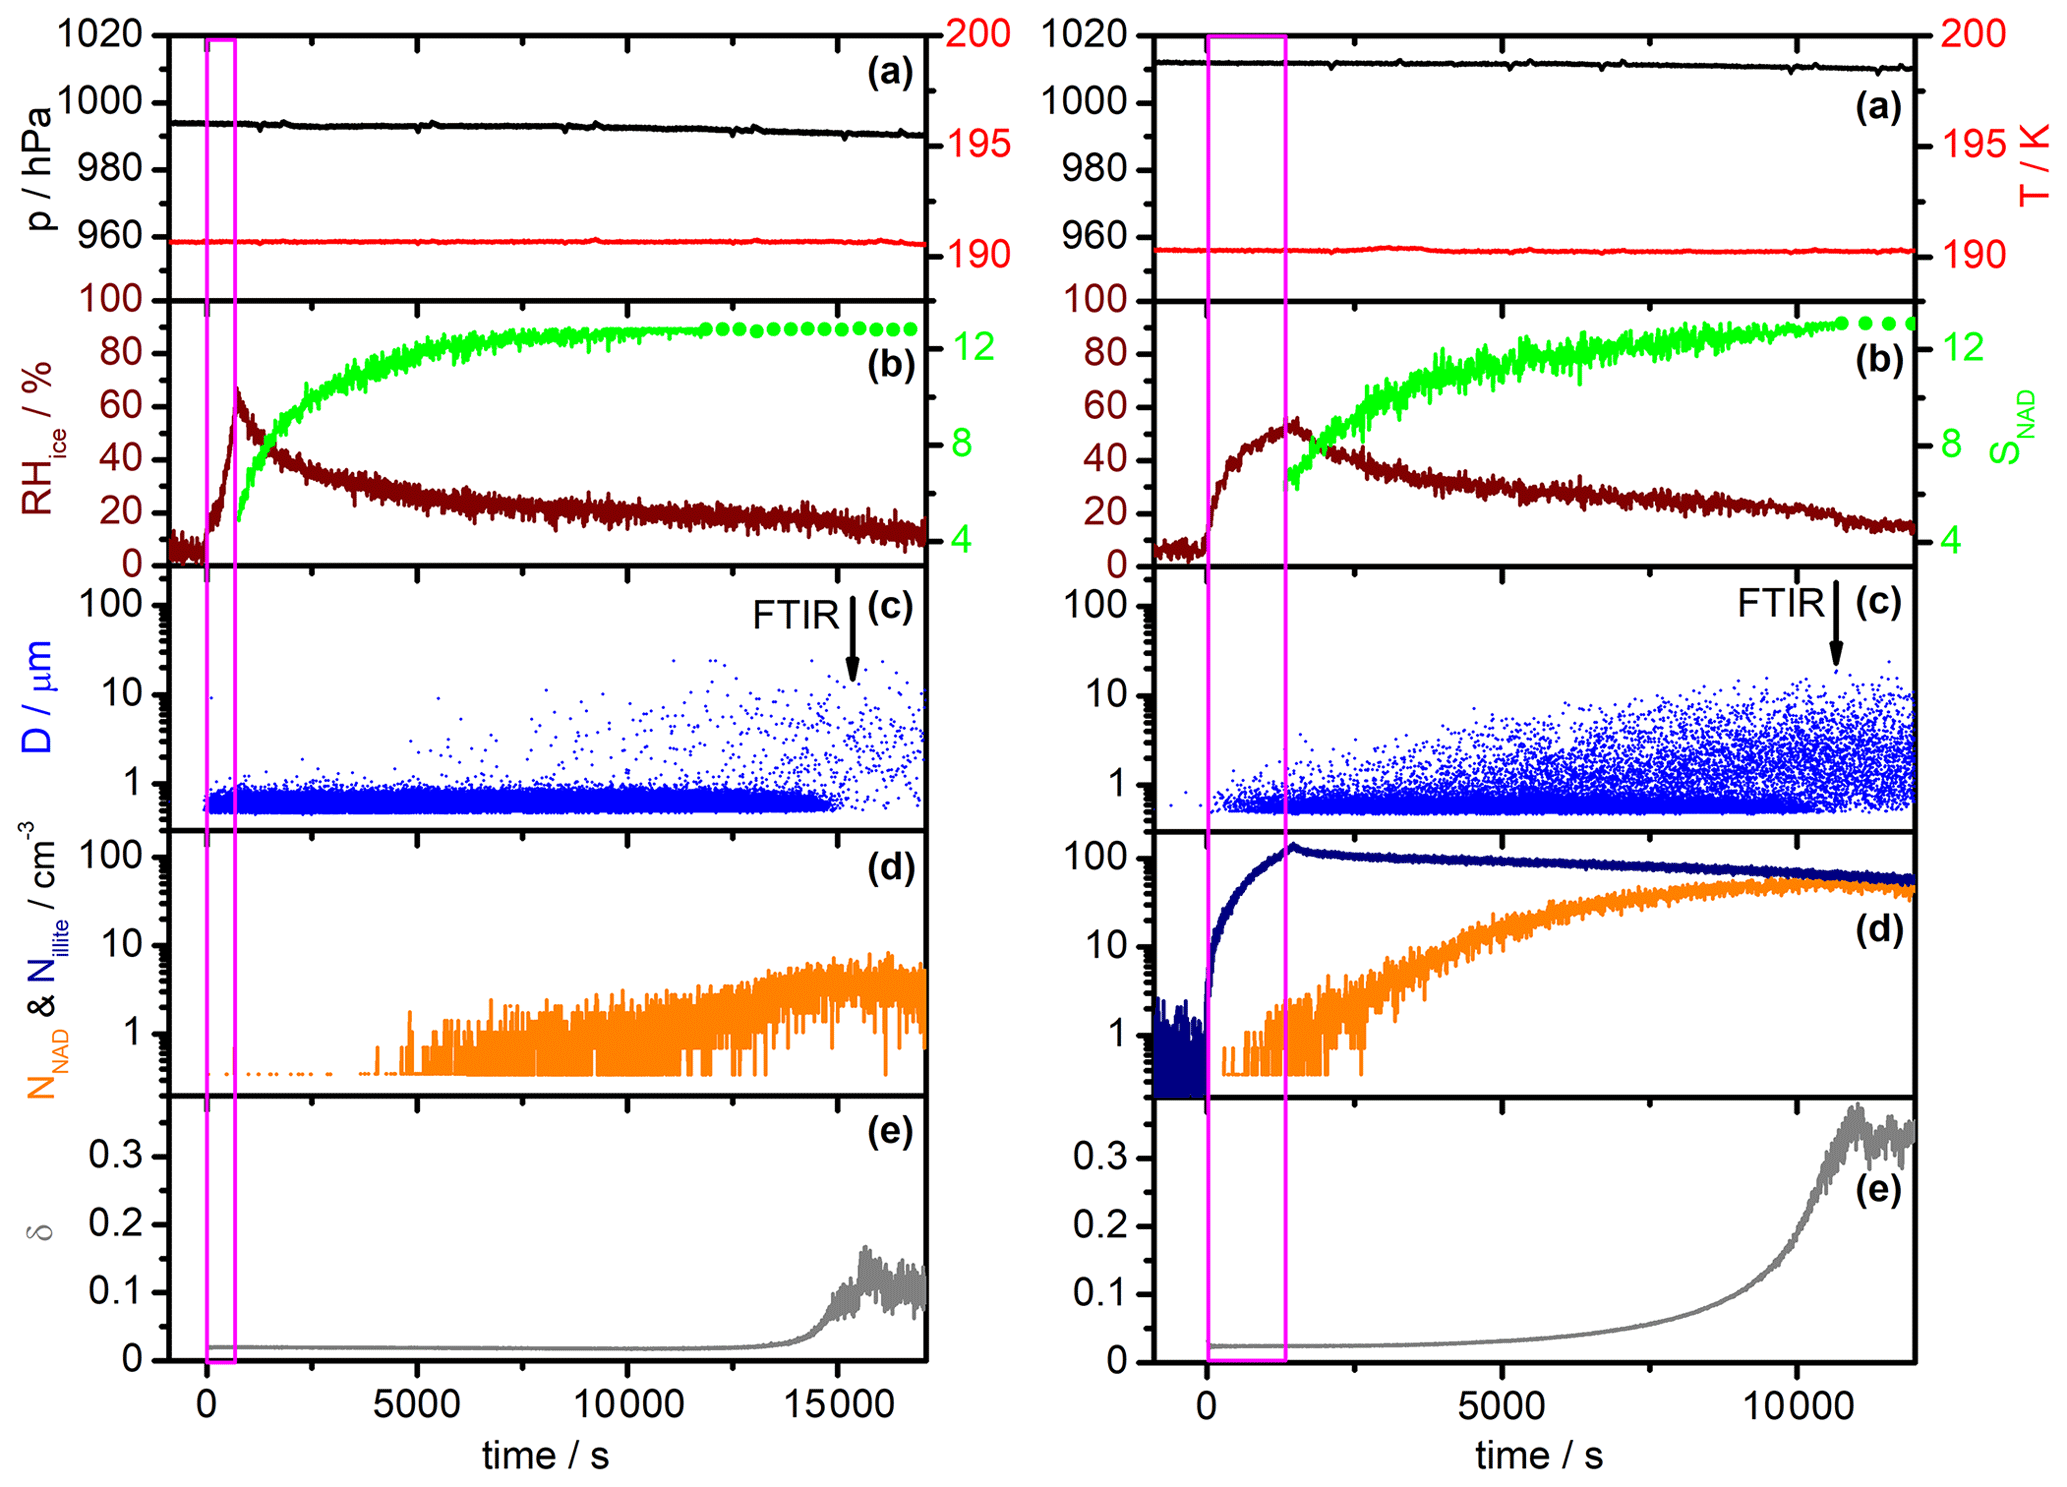
Figure 4Comparison of AIDA measurement data for a homogeneous α-NAD nucleation experiment (left part) and a heterogeneous β-NAD nucleation experiment with illite particles (right part). Time zero denotes the start of aerosol injection, and the duration is indicated by the magenta frame. Each part consists of five panels containing the following data sets: (a) AIDA pressure (black) and mean gas temperature (red); (b) relative humidity with respect to ice (RHice, brown) and saturation ratio with respect to NAD (SNAD, green); (c) size classification of single particles by the welas OPC (blue); (d) number concentration of crystallised NAD particles (NNAD, orange) and number concentration of injected illite particles (Nillite, dark blue); and (e) near-backscattering linear depolarisation ratio (δ, grey). See Sect. 3.1 for a detailed description.
The initial guess for was derived from a literature spectrum. For this purpose, we digitised the spectrum of the annealed film from the NAD spectra collection by Tisdale et al. (1999) (their Fig. 4, trace b), which, similar to the spectrum of the annealed particles mentioned in the Introduction, clearly exhibits the spectral characteristics of β-NAD reported in Grothe et al. (2004). The spectrum was interpolated to the wavenumber grid of our measurement, which was provided at a digital resolution of about 2 cm−1, resulting from an approximate doubling of the size of the original interferogram due to zero-filling by a factor of 2 (Aroui et al., 2012). For thin-film spectra, the absorbance is directly proportional to . Hence, we were able to immediately derive with an estimate for the proportionality factor, i.e. the film thickness, and scale it such that the resulting spectrum had peak values similar to α-NAD in the wavenumber range of the O–H stretching modes (3500–3000 cm−1) (Toon et al., 1994; Niedziela et al., 1998). The initial guess spectrum derived in this way from Tisdale et al. (1999) extended to a wavenumber of about 500 cm−1, whereas our infrared measurements had a low cut-off frequency of 800 cm−1. The iterative adjustment of the spectrum was therefore limited to 800 cm−1, but we always used the 800–500 cm−1 range of the initial guess spectrum as a low-frequency extension when calculating the Kramers–Kronig integral to minimise truncation errors caused by a limited integration range (Segal-Rosenheimer and Linker, 2009). The Kramers–Kronig integration was performed using Maclaurin's formula method (Ohta and Ishida, 1988). The anchor point was set at 4000 cm−1. All previously derived data sets of infrared refractive indices for α- and β-NAT (Toon et al., 1994; Richwine et al., 1995) and α-NAD (Toon et al., 1994; Niedziela et al., 1998) showed little variation in the real part of the complex refractive index at this wavenumber (1.40–1.41 for α- and β-NAT, 1.42 for α-NAD). Hence, we chose a value of n (4000 cm for the anchor point.
Regarding the optical model, it was essential to go beyond Mie theory, which is computationally efficient but only applies to spherical particles, and explicitly consider aspherical particle habits. We already mentioned in the Introduction that the nucleated β-NAD particles are rather compact in shape and do not differ too much from a spherical geometry (a more detailed investigation is presented in Sect. 3.3). However, even small deviations from a spherical shape can notably affect the spectral habitus under certain resonance conditions (n≈0 and ), where so-called Fröhlich or surface modes appear in the particle extinction spectrum (Bohren and Huffman, 1983; Clapp and Miller, 1993; Wagner et al., 2021). Averaging over a distribution of aspect ratios does not cancel the shape effect, i.e. does not reproduce the Mie solution. We therefore used the T-matrix method and modelled the β-NAD particles as randomly oriented spheroids (Mishchenko and Travis, 1998), employing the aspect ratio distribution derived from the analysis of the two-dimensional SID-3 scattering patterns presented above. The extinction spectrum of the particles was calculated by interpolation from look-up tables of the extinction efficiency on a three-dimensional parameter space of n, k, and the size parameter xp (xp=πdp/λ; dp: equal-volume sphere diameter, λ: wavelength) (Wagner et al., 2021). These look-up tables were computed for five different aspect ratios in the parameter space of n between 0.4 and 4 (37 values with Δn=0.1), k between 0.0001 and 3.5 (39 values: 0.0001, 0.025, 0.05, 0.075, 0.1–3.5 with Δk=0.1), and xp between 0.005 and 6 (31 values: 0.005, 0.01, 0.03, 0.05, 0.1, 0.2–4.0 with Δxp=0.2, 4.25, 4.5, 4.75, 5, 5.5, and 6), summing up to 44 733 calculations for each aspect ratio. Both oblate (φ>1) and prolate (φ<1) particle shapes (φ=0.5, 0.67, 1, 1.5, and 2) were considered in the computations, onto which the aspect ratio distribution measured with the SID-3 was then projected to calculate the shape-averaged extinction spectrum of the β-NAD particles. It was assumed that the shape distribution is identical in all particle size bins.
In addition to the optical constants and the shape distribution, the T-matrix calculation requires the particle size distribution as a further input variable. While the number concentration of the volatile β-NAD particles was measured with an accuracy of ±20 % with the welas OPC in the cold isolating containment of the AIDA chamber, particle sizing by the instrument is less accurate for aspherical particle shapes. However, we have already mentioned above that, according to previous studies, the real index of refraction at non-absorbing wavenumbers >4000 cm−1 is very similar for all NAD and NAT polymorphs. We therefore used the α-NAD optical constants by Toon et al. (1994) between 6000 and 4000 cm−1, i.e. in the range of the extinction spectrum that is dominated by light scattering and does not contain any absorption bands, as an estimate for the β-NAD optical constants. We specified the size distribution as log-normal and retrieved the best-fitted parameters for the mode width and the count median diameter of the β-NAD crystals (expressed as equal-volume sphere diameter) by minimising the RMSD between the measured and the computed extinction spectrum, fixing the particle number concentration to the OPC measurement. A similar strategy has been successfully applied in previous infrared measurements to determine the growth of supercooled H2SO4/H2O solution droplets during an expansion cooling experiment in the AIDA chamber (Wagner et al., 2008).
With the size and shape distribution of the β-NAD crystals and the initial guess of the spectrum, we could then compute the size- and shape-averaged extinction spectrum as well as the RMSD with respect to the measured spectrum. In the optimisation step, which consisted of minimising the RMSD by iterating , we first fitted the spectrum derived from Tisdale et al. (1999) by a superposition of 20 Gaussian modes, each defined by its amplitude, width, and peak location. This reduced the retrieval procedure to only 60 optimisation parameters and allowed for a good approximation of the true spectrum in a reasonable amount of computer time. The downhill simplex method was used as the optimisation algorithm (Press et al., 1992). For the fine-tuning of the spectrum, we then included all 1601 individual wavenumber points between 4000 and 800 cm−1 in the optimisation procedure. To improve and accelerate the convergence behaviour of the optimisation algorithm at wavenumber ranges that contained only weak and spectrally broad absorption bands, we smoothed the spectrum in such ranges with a Savitzky–Golay filter (quadratic polynomial fit with five data points in the moving window) (Press et al., 1992; Wagner et al., 2021).
The procedure described above implies that the infrared extinction spectra recorded during the heterogeneous crystallisation experiments can be interpreted to a good approximation as pure β-NAD spectra; that is, the inclusions of illite and MgFeSiO4 particles in the β-NAD crystals have a negligible influence on the infrared spectral signatures. In Sect. 3.3, we will analyse the uncertainties of this approximation using simulations with a coated sphere optical model.
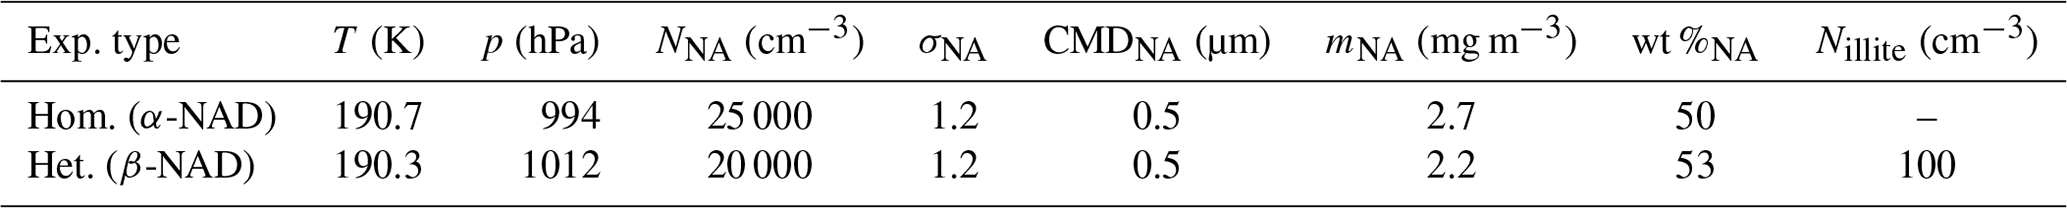
Table 1Start parameters of the homogeneous α-NAD and the heterogeneous β-NAD nucleation experiment shown in Fig. 4. AIDA temperature (T), pressure (p), and number concentration of added illite particles (Nillite) were directly measured. Mass concentration (mNA) and composition (wt %NA) of the HNO3/H2O solution droplets were retrieved from the FTIR spectra. The log-normal parameters of the size distribution of the HNO3/H2O solution droplets (NNA, σNA, CMDNA) were constrained using the welas OPC measurements.
3.1 Overview: homogeneous α-NAD and heterogeneous β-NAD nucleation experiments
In Fig. 4, we show selected time series of the most important AIDA measurement data in the course of a homogeneous (left part) and a heterogeneous NAD nucleation experiment (right part, illite as refractory material). Time zero denotes the start of the injection of the mixed HNO3 and H2O carrier gases without (left) and with added solid seed aerosol particles (right). The duration of the injection is indicated by the magenta-coloured frame. Panels (a) show the AIDA pressure (black line) and the mean AIDA gas temperature (red line). The time evolution of the relative humidity with respect to ice (RHice, brown line) and the saturation ratio with respect to NAD (SNAD, green line) are shown in panels (b). SNAD is the saturation ratio of the liquid phase with respect to solid NAD. Explicitly, it is the quotient between the activity product of the ions (H+, NO) and the solvent (H2O) in the liquid phase, i.e. a(H(NO(H2O), and the respective activity product in a solution saturated with respect to solid NAD (Ks) (Salcedo et al., 2001). Assuming that the liquid and the gas phase are at equilibrium, we first calculated the above activity product for the temperature and relative humidity conditions prevalent in the AIDA chamber with the E-AIM model (Clegg et al., 1998; Massucci et al., 1999). The formation of solid phases was hereby prevented. Afterwards, the activity product for NAD-saturated conditions, Ks, was computed according to the temperature-dependent function given in Eq. (A9) of Massucci et al. (1999). The ratio of these two activity products then yielded SNAD. When the solid green lines in panels (b) turn into dotted lines, RHliq has fallen below the 10% input range of the E-AIM model, and the further evolution of SNAD is calculated using this fixed RHliq lower limit. SNAD thus represents a lower limit in these periods as RHliq decreased even further. The blue dots in panels (c) symbolise the single-particle measurements with the welas OPC, where each dot represents a particle that has been assigned a specific optical diameter according to its scattering intensity. The vertical arrows indicate the times of the FTIR spectra, which are shown and analysed later in Figs. 5 and 6. The number concentration of solid NAD particles nucleated during the experiments is shown as the orange line in panels (d). While HNO3/H2O solution droplets without and with embedded illite particles were still present, we defined an optical threshold size of 1 µm and counted all particles above that size as either α- or β-NAD crystals. During this period, the reported number concentrations of NAD particles are slightly underestimated due to the small fraction of crystals whose optical diameters overlapped with those of the solution droplets. For the heterogeneous nucleation experiment, we also included the records of the number concentration of co-added illite particles measured with the CPC3010 through a heated sampling line (dark blue line). Finally, panels (e) show the trace of the near-backscattering linear depolarisation ratio from the SIMONE instrument (δ, grey line). Relevant start parameters of the two nucleation experiments are summarised in Table 1.
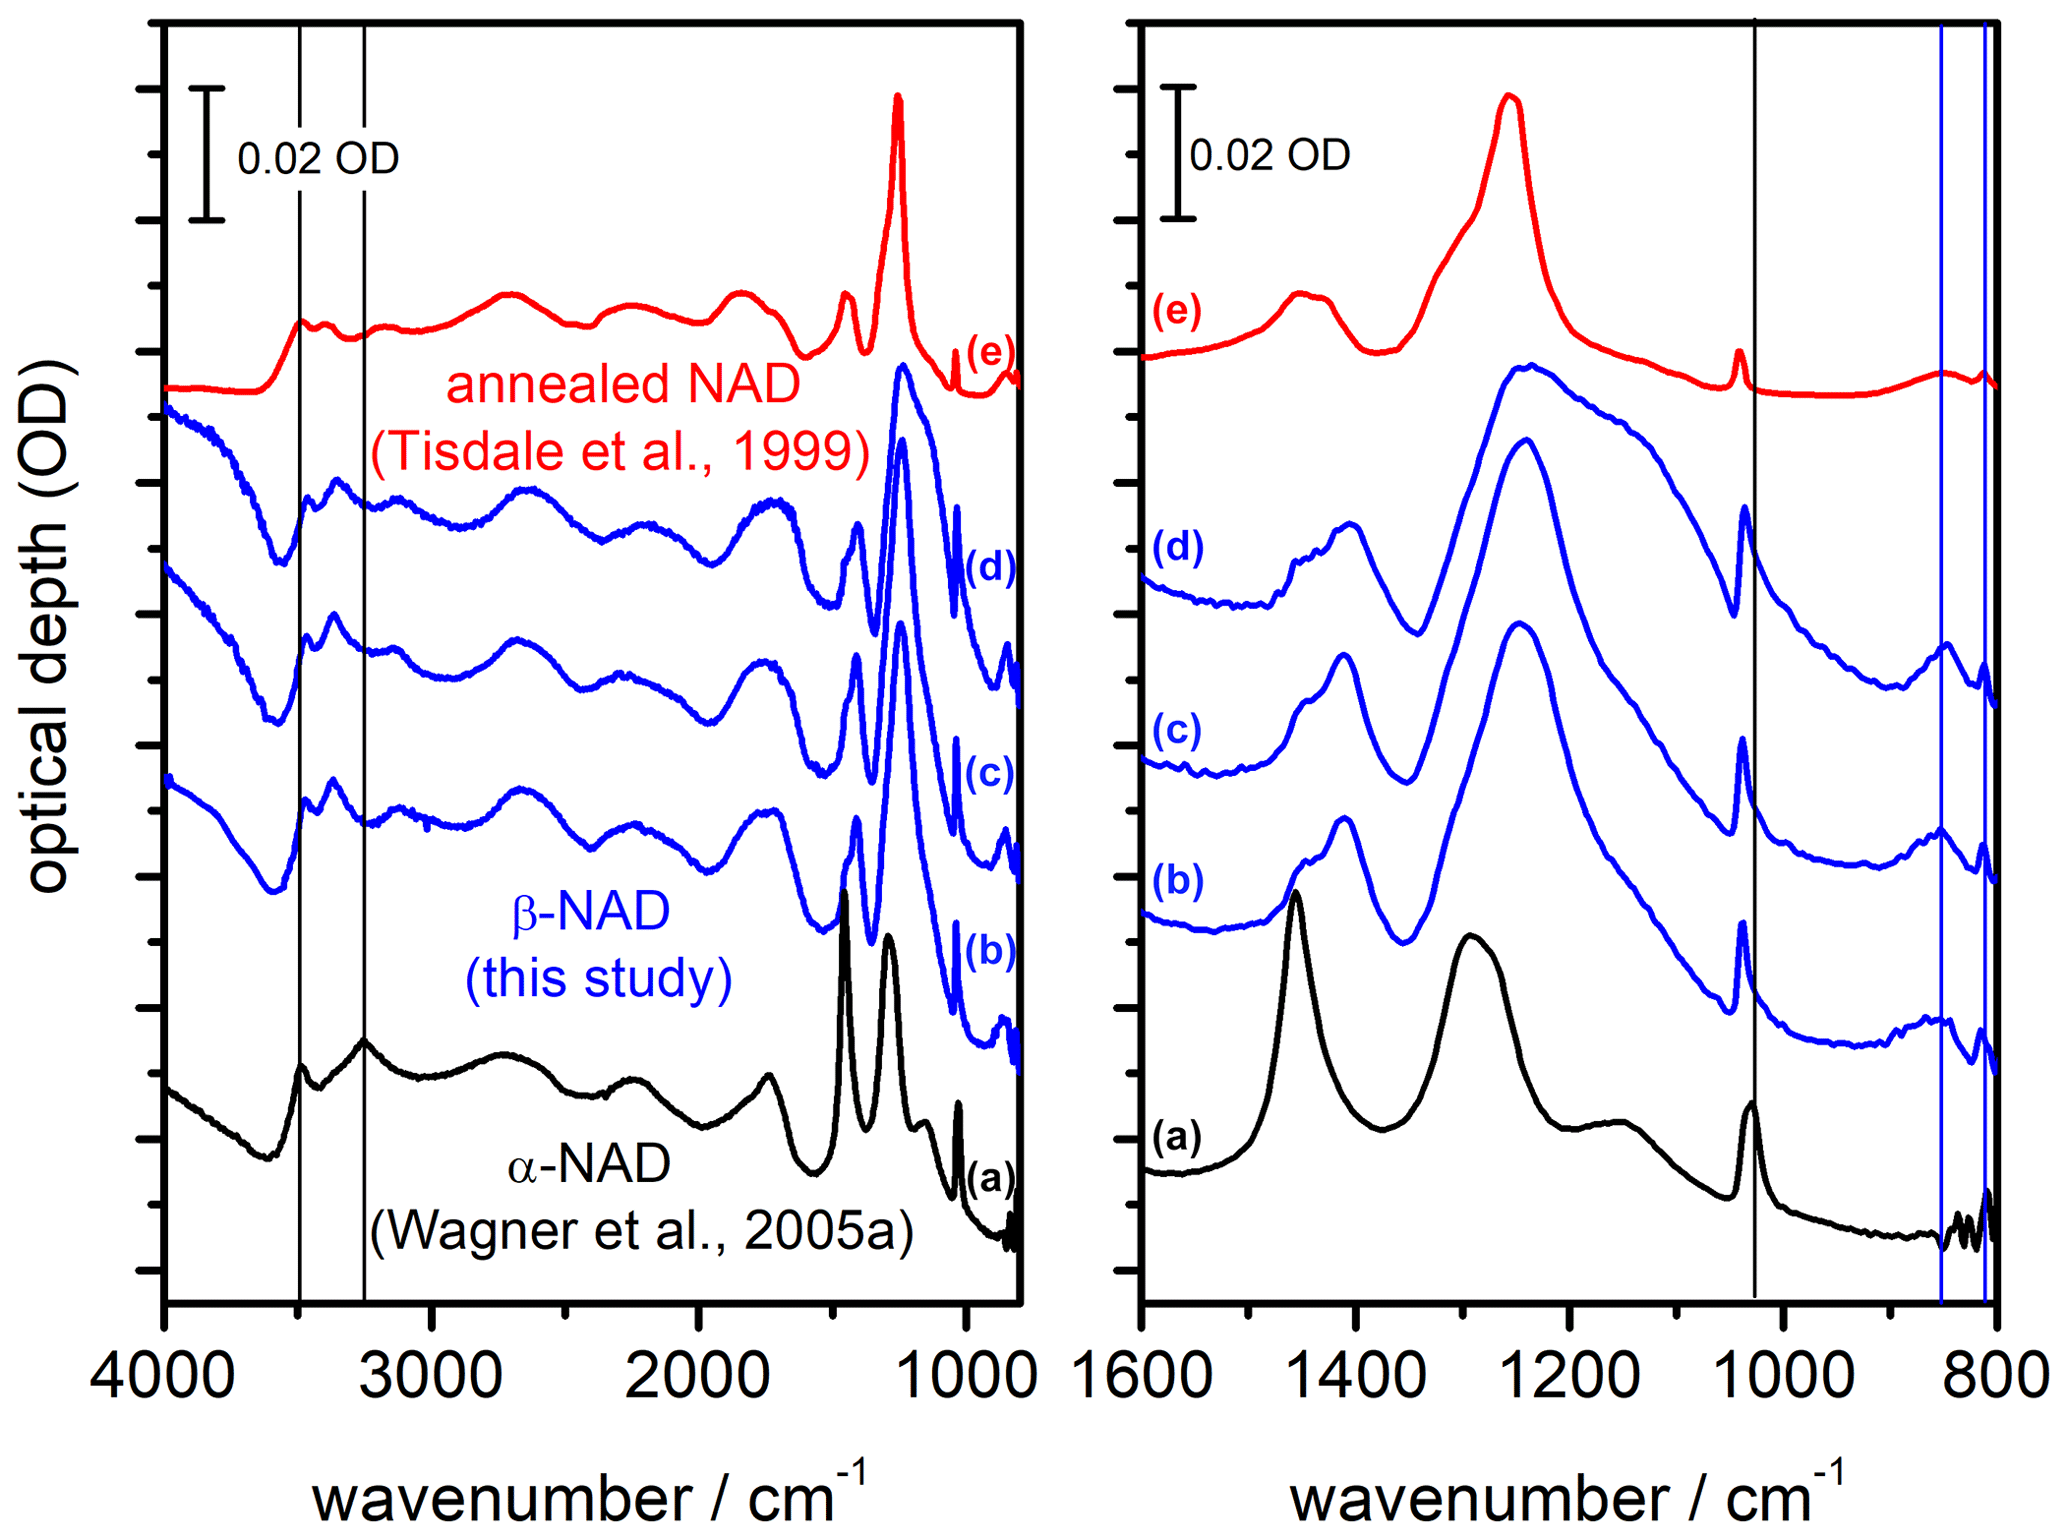
Figure 5Comparison of infrared extinction spectra of α- and β-NAD particles. The left part shows the wavenumber range from 4000 to 800 cm−1, while the right part shows an enlarged view from 1600 to 800 cm−1. (a) α-NAD particles generated by shock-freezing a gas mixture of nitric acid and water (Wagner et al., 2005a; Fig. 3 therein, exp. A). (b–d) β-NAD particles generated in this study from heterogeneous crystallisation experiments with illite particles at 190 K (b) and 200 K (d), as well as with MgFeSiO4 particles at 190 K (c). (e) NAD particles formed below 160 K and crystallised between 160 and 221 K during rapid warming (Tisdale et al., 1999; Fig. 4 therein, digitised version of spectrum (E) using WebPlotDigitizer version 4.5). Vertical black and blue lines indicate selected extinction bands characteristic of α- and β-NAD particles, respectively. Individual spectra have been offset for clarity. The digitised absorbance spectrum (e) does not adhere to the optical depth scale and has been arbitrarily scaled to allow for comparison with the AIDA measurements.
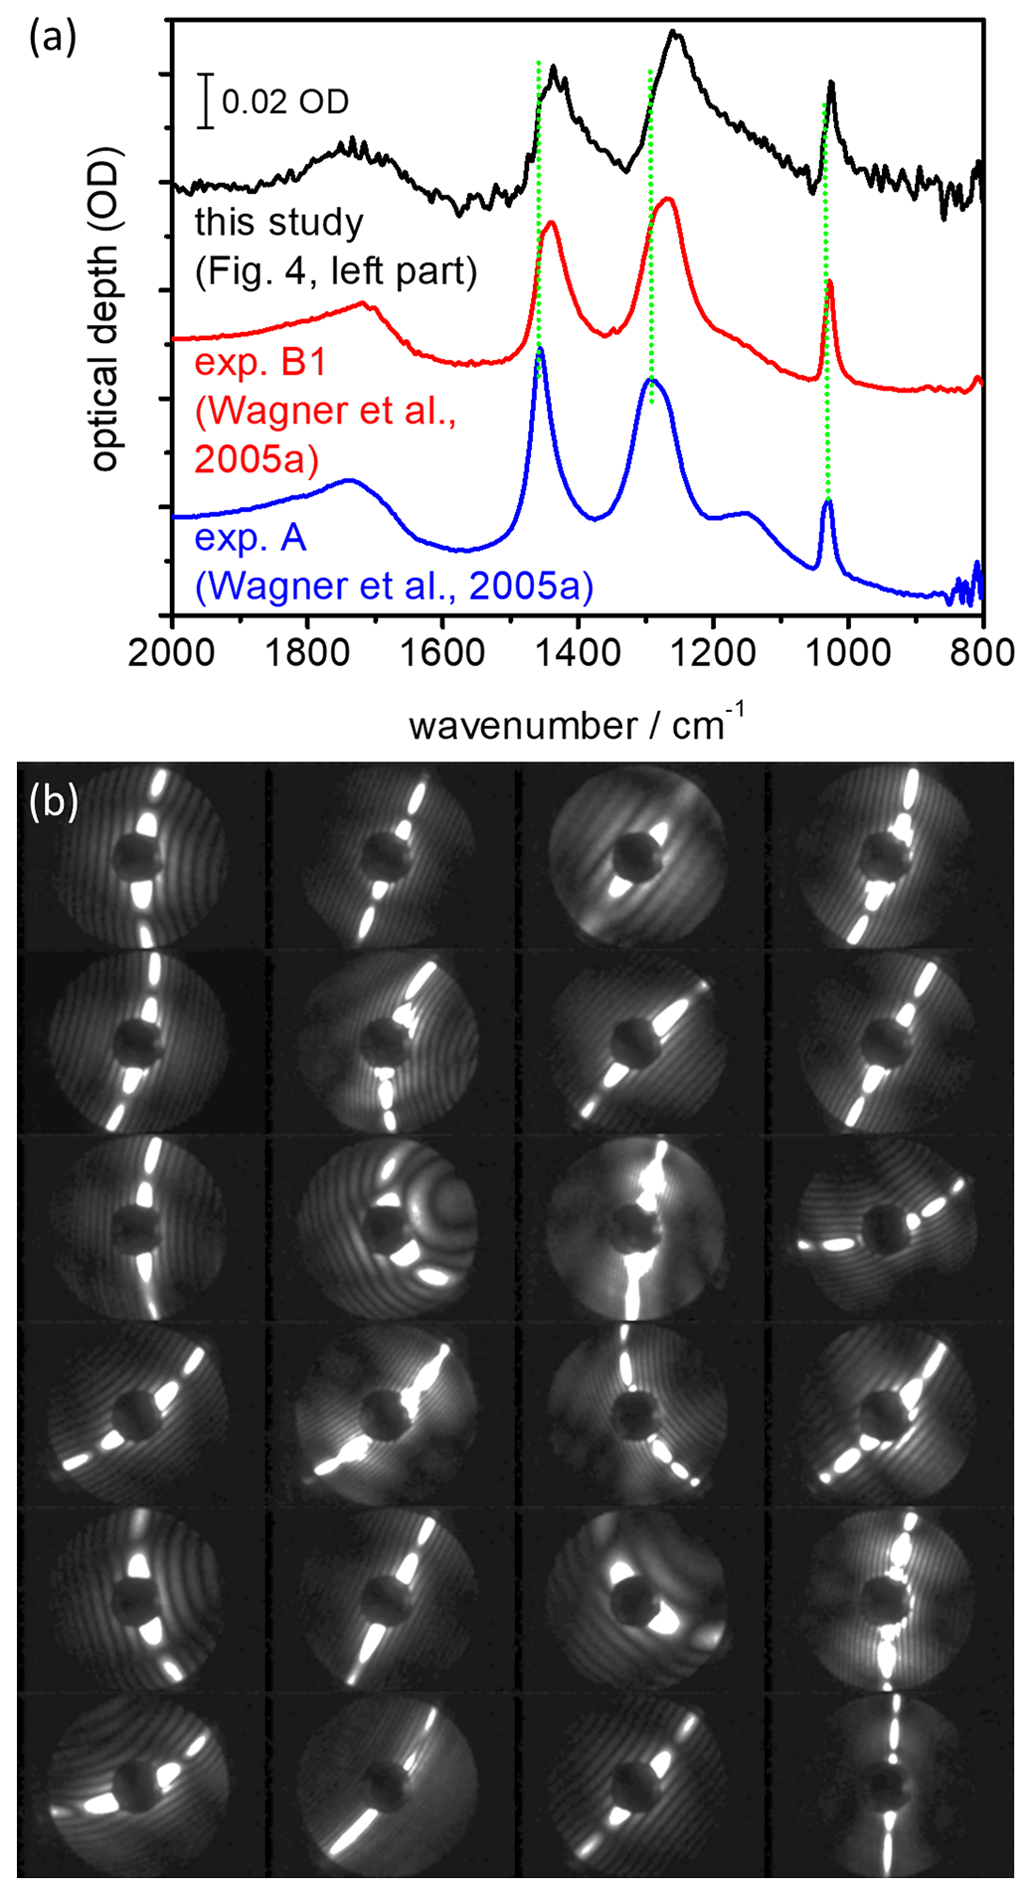
Figure 6(a) Shape-dependent infrared spectral signature of airborne α-NAD crystals. The blue-coloured spectrum was recorded during exp. A from Wagner et al. (2005a) where the α-NAD particles were generated by shock-freezing a gaseous nitric acid–water mixture. In exp. B1 from Wagner et al. (2005a), the α-NAD crystals were formed by homogeneous nucleation from slowly evaporating supercooled HNO3/H2O solution droplets at 193 K. A similar long-term crystallisation experiment was performed in this study at 190 K (see Fig. 4, left part), and the infrared spectrum of the nucleated α-NAD crystals is shown in black. Vertical dotted green lines indicate the shifts in band positions between the different spectra. Individual spectra have been offset for clarity. (b) SID-3 measurements: representative two-dimensional scattering patterns of the α-NAD crystals that formed during the long-term crystallisation experiment at 190 K from this study.
The initial composition and mass concentration of the HNO3/H2O solution droplets in the homogeneous nucleation experiment, as determined from the FTIR spectra, were about 50 wt % HNO3 and 2.7 mg m−3, respectively. The fact that the FTIR retrieval is only sensitive to the mass concentration but not to the exact shape of the size distribution of the aerosol particles is a consequence of the submicron size of the droplets; that is, the size parameter at infrared wavelengths is still close to the Rayleigh scattering regime (Bohren and Huffman, 1983). However, as shown in Fig. 6 of Stetzer et al. (2006), we can use the tail of the size distribution, quantitatively measured with the welas OPC at diameters above 0.7 µm, to constrain the individual parameters of the assumed log-normal size distribution of the added HNO3/H2O solution droplets. Such an analysis yielded a droplet number concentration of about 25 000 cm−3, a mode width σg of about 1.2, and a count median diameter of about 0.5 µm. During the injection of the carrier gases and the associated nucleation of the HNO3/H2O solution droplets, RHice temporarily increased to about 60 %. In the course of the following observation period of 4.5 h, the HNO3/H2O solution droplets slowly evaporated with different rates for the deposition of water and nitric acid vapours to the cold chamber walls (Möhler et al., 2006a; Stetzer et al., 2006). As a result, the relative humidity decreased and the nitric acid content in the solution droplets increased to about 63 wt % by the end of the observation period. About 5000 s after the start of the injection, when SNAD had risen above a value of 10, we observed the nucleation of the first larger NAD crystals in the records of the welas OPC (Fig. 4c, left part). The fact that the NAD crystals appeared with larger diameters in the OPC recordings is initially due to the typically higher scattering efficiency of non-spherical particles compared to equal-volume spheres at scattering angles around 90∘ used in the OPC's detection system, so they are assigned a larger optical diameter. However, in the course of the observation period, the nucleated NAD crystals also actually grew in size at the expense of the HNO3/H2O solution droplets, due to the higher partial pressures over the liquid phase. After about 15 000 s, the droplet mode had disappeared, leaving behind a population of pure NAD crystals with a number concentration of about 3 cm−3, which led to an increase in the near-backscattering depolarisation ratio to about 11 % (Fig. 4e, left part). We will show in Sect. 3.2 that the recorded infrared spectrum of the crystalline particles was consistent with the α-NAD modification and exhibited the same spectral changes indicative of strongly aspherical particle habits as discussed in Wagner et al. (2005a). However, before we look at the shape of the homogeneously nucleated α-NAD crystals, we would like to describe the general observations made during the heterogeneous NAD nucleation experiment shown in the right-hand part of Fig. 4. Note that the corresponding panels (a–e) of Fig. 4 are vertically scaled identically to allow for an immediate comparison of the two types of experiments.
The heterogeneous nucleation experiment was carried out in the same way as its homogeneous counterpart at a constant temperature of approximately 190 K. Using the same analysis as described above for the homogeneous nucleation experiment, we deduced a number concentration of approximately 20 000 cm−3 for the generated HNO3/H2O solution droplets. With a mode width of 1.2 and a count median diameter of 0.5 µm, the aerosol mass concentration was approximately 2.2 mg m−3. The initial HNO3 content of the droplets was about 53 wt %. The number concentration of illite particles co-added with the HNO3–H2O vapour mixture reached a maximum value of about 100 cm−3 (Fig. 4d, right part, dark blue line). Thus, apart from a small subset of internally mixed illite/HNO3/H2O particles, the injection also produced a large reservoir of purely liquid nitric acid solution droplets. Already during the injection and in the initial observation period, when SNAD was still below 10, we observed a considerable number of larger, crystalline particles in the OPC records, documenting a much faster nucleation compared to the homogeneous run shown next to it, which can only be explained by the presence of the illite particles acting as immersion nuclei for the crystallisation of the HNO3/H2O solution droplets. More than an order of magnitude higher numbers of NAD crystals were formed in the heterogeneous nucleation experiment than in the homogeneous run, and more than 80 % of the co-added illite particles acted as heterogeneous nuclei for the crystallisation of NAD (ratio of the orange line to the dark blue line in the right part of Fig. 4d). The large reservoir of HNO3/H2O solution droplets already disappeared shortly after 10 000 s, leaving behind an ensemble of NAD crystals that caused a much higher depolarisation ratio of 36 % compared to the homogeneous crystallisation experiment.
Figure 5 shows a compilation of FTIR spectra illustrating that the heterogeneous crystallisation experiments not only accelerated the formation of solid particles, but also led to the formation of a different phase of the nucleated NAD particles, namely β-NAD. The infrared spectrum recorded at the end of the heterogeneous nucleation experiment with illite particles (Fig. 4c, right part, t=11 000 s) is shown as trace b. A very similar spectrum was obtained in a different experiment at 190 K when using MgFeSiO4 as refractory material to induce the crystallisation of the HNO3/H2O solution droplets (trace c). We first discuss these two spectra in comparison with a reference spectrum of compactly shaped α-NAD particles from our previous work (Wagner et al., 2005a), which were produced by shock freezing a gas mixture of nitric acid and water (trace a). The spectral differences between spectra b and c compared to spectrum a show the same features discussed by Grothe et al. (2004) to distinguish between β- and α-NAD. In the left part of Fig. 5, which shows the full wavenumber range from 4000 to 800 cm−1, we have marked with black vertical lines the two distinct maxima of α-NAD at 3486 and 3254 cm−1 in the range of the O–H stretching modes. In contrast, the extinction spectra of the β-NAD particles reveal three distinct peaks at 3464, 3362, and 3138 cm−1. Due to the contribution of light scattering, the peak positions of these extinction bands are shifted by 20–30 cm−1 to lower wavenumbers in comparison with the IR absorption bands of β-NAD tabulated in Grothe et al. (2004), where the infrared spectrum of a β-NAD film deposited on a gold-platted sample support was measured in the specular reflectance mode. A more straightforward analysis of the band positions is presented later in Sect. 3.3, when we can use the retrieved spectrum of the imaginary part of the complex refractive index of β-NAD to compare the location of the absorption peaks. In the wavenumber range between 3000 and 2000 cm−1, which is dominated by symmetric and asymmetric stretching modes of the H3O+ ion, and between 2000 and 1700 cm−1, which contains the asymmetric deformation mode of H3O+, ν4(H3O+), the spectral differences between β- and α-NAD are rather subtle and manifest themselves in only minor changes of the band shapes. More distinct changes are again clearly visible at wavenumbers between 1600 and 800 cm−1, which are shown in an expanded view in the right part of Fig. 5. A distinct marker to distinguish between the two NAD polymorphs is the location of the ν1(NO) mode, which experiences a considerable blue shift from about 1026 cm−1 for α-NAD (vertical black line the right part of Fig. 5) to about 1038 cm−1 in the case of β-NAD. Characteristic of β-NAD are also two bands at lower wavenumbers, as indicated by the vertical blue lines in the right part of Fig. 5, namely the so far unassigned mode at about 852 cm−1 and the intense ν2(NO) mode at about 812 cm−1 (Grothe et al., 2004).
Clear spectral differences between β- and α-NAD also appear at wavenumbers between 1500 and 1100 cm−1, where the observed extinction signatures are due to the intense ν3(NO) mode and the somewhat weaker ν2(H3O+) mode (Fernandez et al., 2003). However, as we will see in Sect. 3.2 and 3.3, the spectral habitus in this wavenumber range is also very sensitive to the size and shape of the NAD crystals, which makes this not the best criterion for distinguishing between the two polymorphs. Figure 5 contains a third exemplary extinction spectrum of β-NAD crystals that we recorded at the end of a heterogeneous crystallisation experiment with the illite particles conducted at a higher temperature of 200 K (trace d). It bears all the characteristic markers of β-NAD discussed in the preceding paragraph but shows a more pronounced shoulder at 1150 cm−1, which we will discuss as an effect of particle size in Sect. 3.3. The recordings b, c, and d are, to our knowledge, the first infrared spectra of aerosol particles where direct crystallisation of β-NAD from the supercooled liquid phase has been observed. While we have compiled in Fig. 5 only the spectra after full crystallisation (i.e. after the disappearance of the droplet mode), we also investigated the spectral habitus at earlier stages of the heterogeneous crystallisation experiments, where we subtracted the signature of the HNO3/H2O solution droplets to deduce the spectrum of the freshly crystallised particles. In this analysis, we also observed all characteristic markers of β-NAD. Furthermore, as we will see in Sect. 3.2, homogeneously nucleated α-NAD crystals produced very peculiar two-dimensional scattering patterns in the SID-3 images, whereas no such scattering patterns were ever detected in the course of the heterogeneous crystallisation experiments. So the α-NAD phase either did not form at all or was very rapidly transformed into β-NAD. Regardless of which case applies, it can be summarised that heterogeneous crystallisation aided by the surface of refractory materials (e.g. of the meteoric smoke or mineral dust type) leads to the efficient formation of the more stable, three-dimensionally ordered β-NAD phase. In contrast, the α-NAD polymorph, whose structure matches more the short-range order of the liquid phase, crystallises from HNO3/H2O solution droplets without solid inclusions, in accordance with Ostwald's step rule (Grothe et al., 2004). The transformation into β-NAD can then only be induced by warming (Tisdale et al., 1999; Grothe et al., 2004, 2008). Spectrum e in Fig. 5 shows the annealed particle spectrum from Tisdale et al. (1999) (Fig. 4 therein, trace E). The smaller particle size in that spectrum compared to our experiments (spectra b–d) reduces the scattering contribution and alters the signature of the extinction bands, but the key features typical of β-NAD are clearly visible, so this is presumably the first record of β-NAD, even if it was not identified as such at that time.
3.2 Particle shape of homogeneously nucleated α-NAD crystals
In Fig. 6a we show our earlier FTIR measurements, which led us to believe that strongly aspherical α-NAD crystals can form when supercooled HNO3/H2O solution droplets freeze and slowly grow in a supersaturated environment (Wagner et al., 2005a). In the wavenumber range between 1600 and 800 cm−1, we observed a strong modulation of the infrared spectral habitus between near-spherical α-NAD particles obtained by shock-freezing a gaseous mixture of nitric acid and water (exp. A from Wagner et al., 2005a, blue line) and that of α-NAD crystals generated by homogeneous nucleation from slowly evaporating supercooled HNO3/H2O solution droplets at 193 K over a timescale of several hours (exp. B1 from Wagner et al., 2005a, red line). As shown in the accompanying analysis, aspect ratios ≤0.2 or ≥5 were required to adequately describe the band shape of spectrum B1 (Wagner et al., 2005a). However, the spectral analysis did not provide an unambiguous indication of whether the crystals were of prolate or oblate shape. The black coloured infrared spectrum in Fig. 6a was recorded at the end of the homogeneous nucleation experiment from this study (see left part of Fig. 4), and its habit is consistent with that of the earlier experiment B1. A collection of representative two-dimensional SID-3 scattering images of the nucleated α-NAD crystals from this experiment is shown in Fig. 6b. The images reveal two-fold symmetrical scattering patterns with large differences in the number of diffraction maxima along the two symmetry axes, which is indicative of highly elongated, needle-like particle shapes. The quantitative analysis of the scattering patterns in terms of the number ratio of diffraction maxima along the two symmetry axes gave a median inverse aspect ratio of 5±2, with maximum values up to 10. These values are in very good agreement with the observation of prolate α-NAD particles of similar aspect ratio on the cryo-stage of an ESEM (Grothe et al., 2008).
Our measurements with the SIMONE light-scattering instrument indicate that elongated nitric acid hydrate crystals only cause a relatively low near-backscattering linear depolarisation ratio of about 11 % (Fig. 4e, left part). In T-matrix computations where non-spherical nitric acid hydrates were modelled as randomly oriented spheroids or cylinders, moderate aspect ratios between 1.2 and 2 (both prolate and oblate shapes were considered) gave linear depolarisation ratios in the range of about 25 %–40 % for particles with equal-volume sphere diameters between 2 and 4 µm (Liu and Mishchenko, 2001). In fact, this range agrees with the near-backscattering linear depolarisation ratios that we observed in the heterogeneous nucleation experiments where β-NAD particles were formed (see Fig. 4e, right part). In Sect. 3.3, we will use the SID-3 images to prove that the nucleated β-NAD crystals did indeed have a rather compact particle shape within that range of aspect ratios. The much lower depolarisation ratio of the α-NAD crystals compared to β-NAD is due to the peculiar scattering properties of particles with aspect ratios that greatly deviate from unity. Using ice crystals as an example, Zakharova and Mishchenko (2000) have shown that wavelength-sized needle- and plate-like particles, modelled as spheroids with aspect ratios of 0.05 and 20, have unique scattering properties. While some scattering parameters, such as the phase functions and the asymmetry parameters, are similar to those of surface-equivalent spheres, other quantities, such as the extinction efficiencies and the depolarisation ratios (linear and circular), resemble those of Rayleigh particles. In particular, such needle- and plate-like particles cause much less backscattering linear depolarisation than surface-equivalent particles with moderate aspect ratios of 0.5 and 2. The large variability of the depolarisation ratio as a function of particle shape, as seen in Fig. 4e, could impact the accuracy by which the amount of nitric acid hydrates in mixtures with STS droplets can be retrieved from lidar measurements (Pitts et al., 2009, 2018).
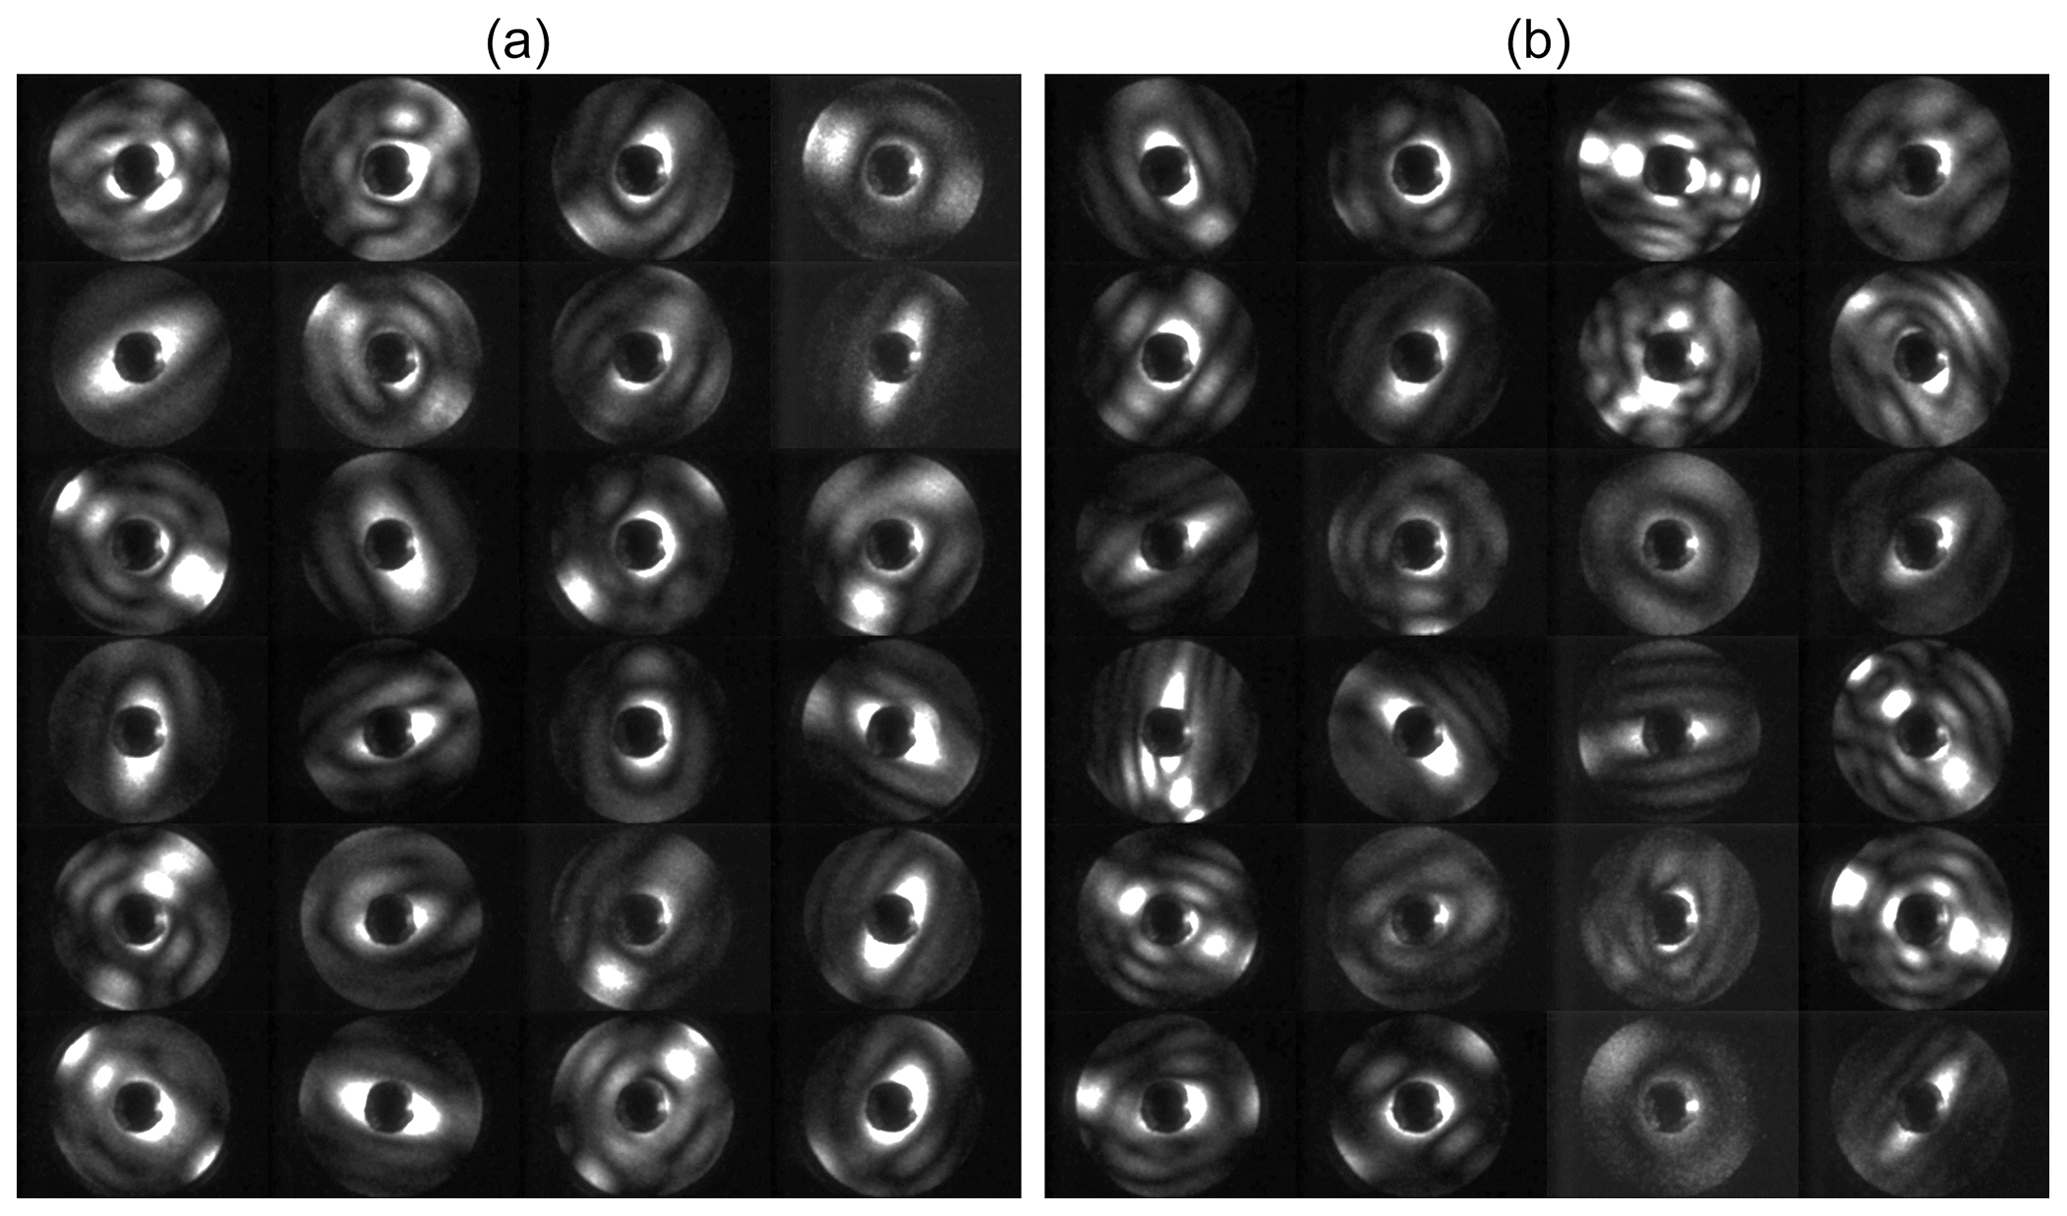
Figure 7SID-3 scattering patterns of β-NAD crystals generated during heterogeneous crystallisation experiments with illite (a) and MgFeSiO4 (b) as seed aerosol particles.
3.3 Particle shape and infrared optical constants of β-NAD particles
In the previous section, we already anticipated that one would expect a rather compact particle shape for the β-NAD crystals due to the magnitude of the measured near-backscattering linear depolarisation ratio. In Fig. 7 we now show a selection of SID-3 scattering patterns from two heterogeneous crystallisation experiments, with the left part showing the measurements from the experiment with illite as refractory seeding material (as shown in the right part of Fig. 4) and with the right part from a similarly performed experiment with MgFeSiO4 as solid inclusion. None of the elongated scattering patterns typical of homogeneously nucleated α-NAD crystals can be seen in these images. As already discussed in connection with Fig. 4, heterogeneous nucleation proceeded very rapidly and at low SNAD; hence, we conclude from the lack of elongated scattering patterns that in fact the entire aerosol population had crystallised heterogeneously and that only β-NAD was formed. The large proportion of HNO3/H2O solution droplets without solid inclusion therefore only served as a reservoir of condensable material for the growth of the nucleated β-NAD crystals and was consumed in the process. Figure 5 reveals that the two infrared spectra of the β-NAD crystals from the illite and the MgFeSiO4 experiment are very similar (spectra b and c), as are the two sets of SID-3 scattering patterns shown in Fig. 7. They feature a spatially more uniform and thus less directional illumination of the ICCD sensor compared to the highly directional patterns that are characteristic for α-NAD particles. For β-NAD, the analysis in terms of diffraction maxima along the two symmetry axes yielded a median value of 1.5±0.5. Less than 5 % of the images had an axial ratio greater than two. For these compactly shaped β-NAD crystals, it is not evident from the scattering patterns whether the particles have a prolate or an oblate shape, so the value given above can be assigned either to oblate particles with an aspect ratio of 1.5:1 or to prolate particles with an aspect ratio of 1:1.5. Within the range from 1 to 2, the histogram of axial ratios was relatively evenly distributed, so we computed an averaged look-up table of the extinction efficiencies for an equivalent mixture of all five considered aspect ratios, i.e. φ=0.5, 0.67, 1, 1.5, and 2, to retrieve the optical constants of β-NAD.
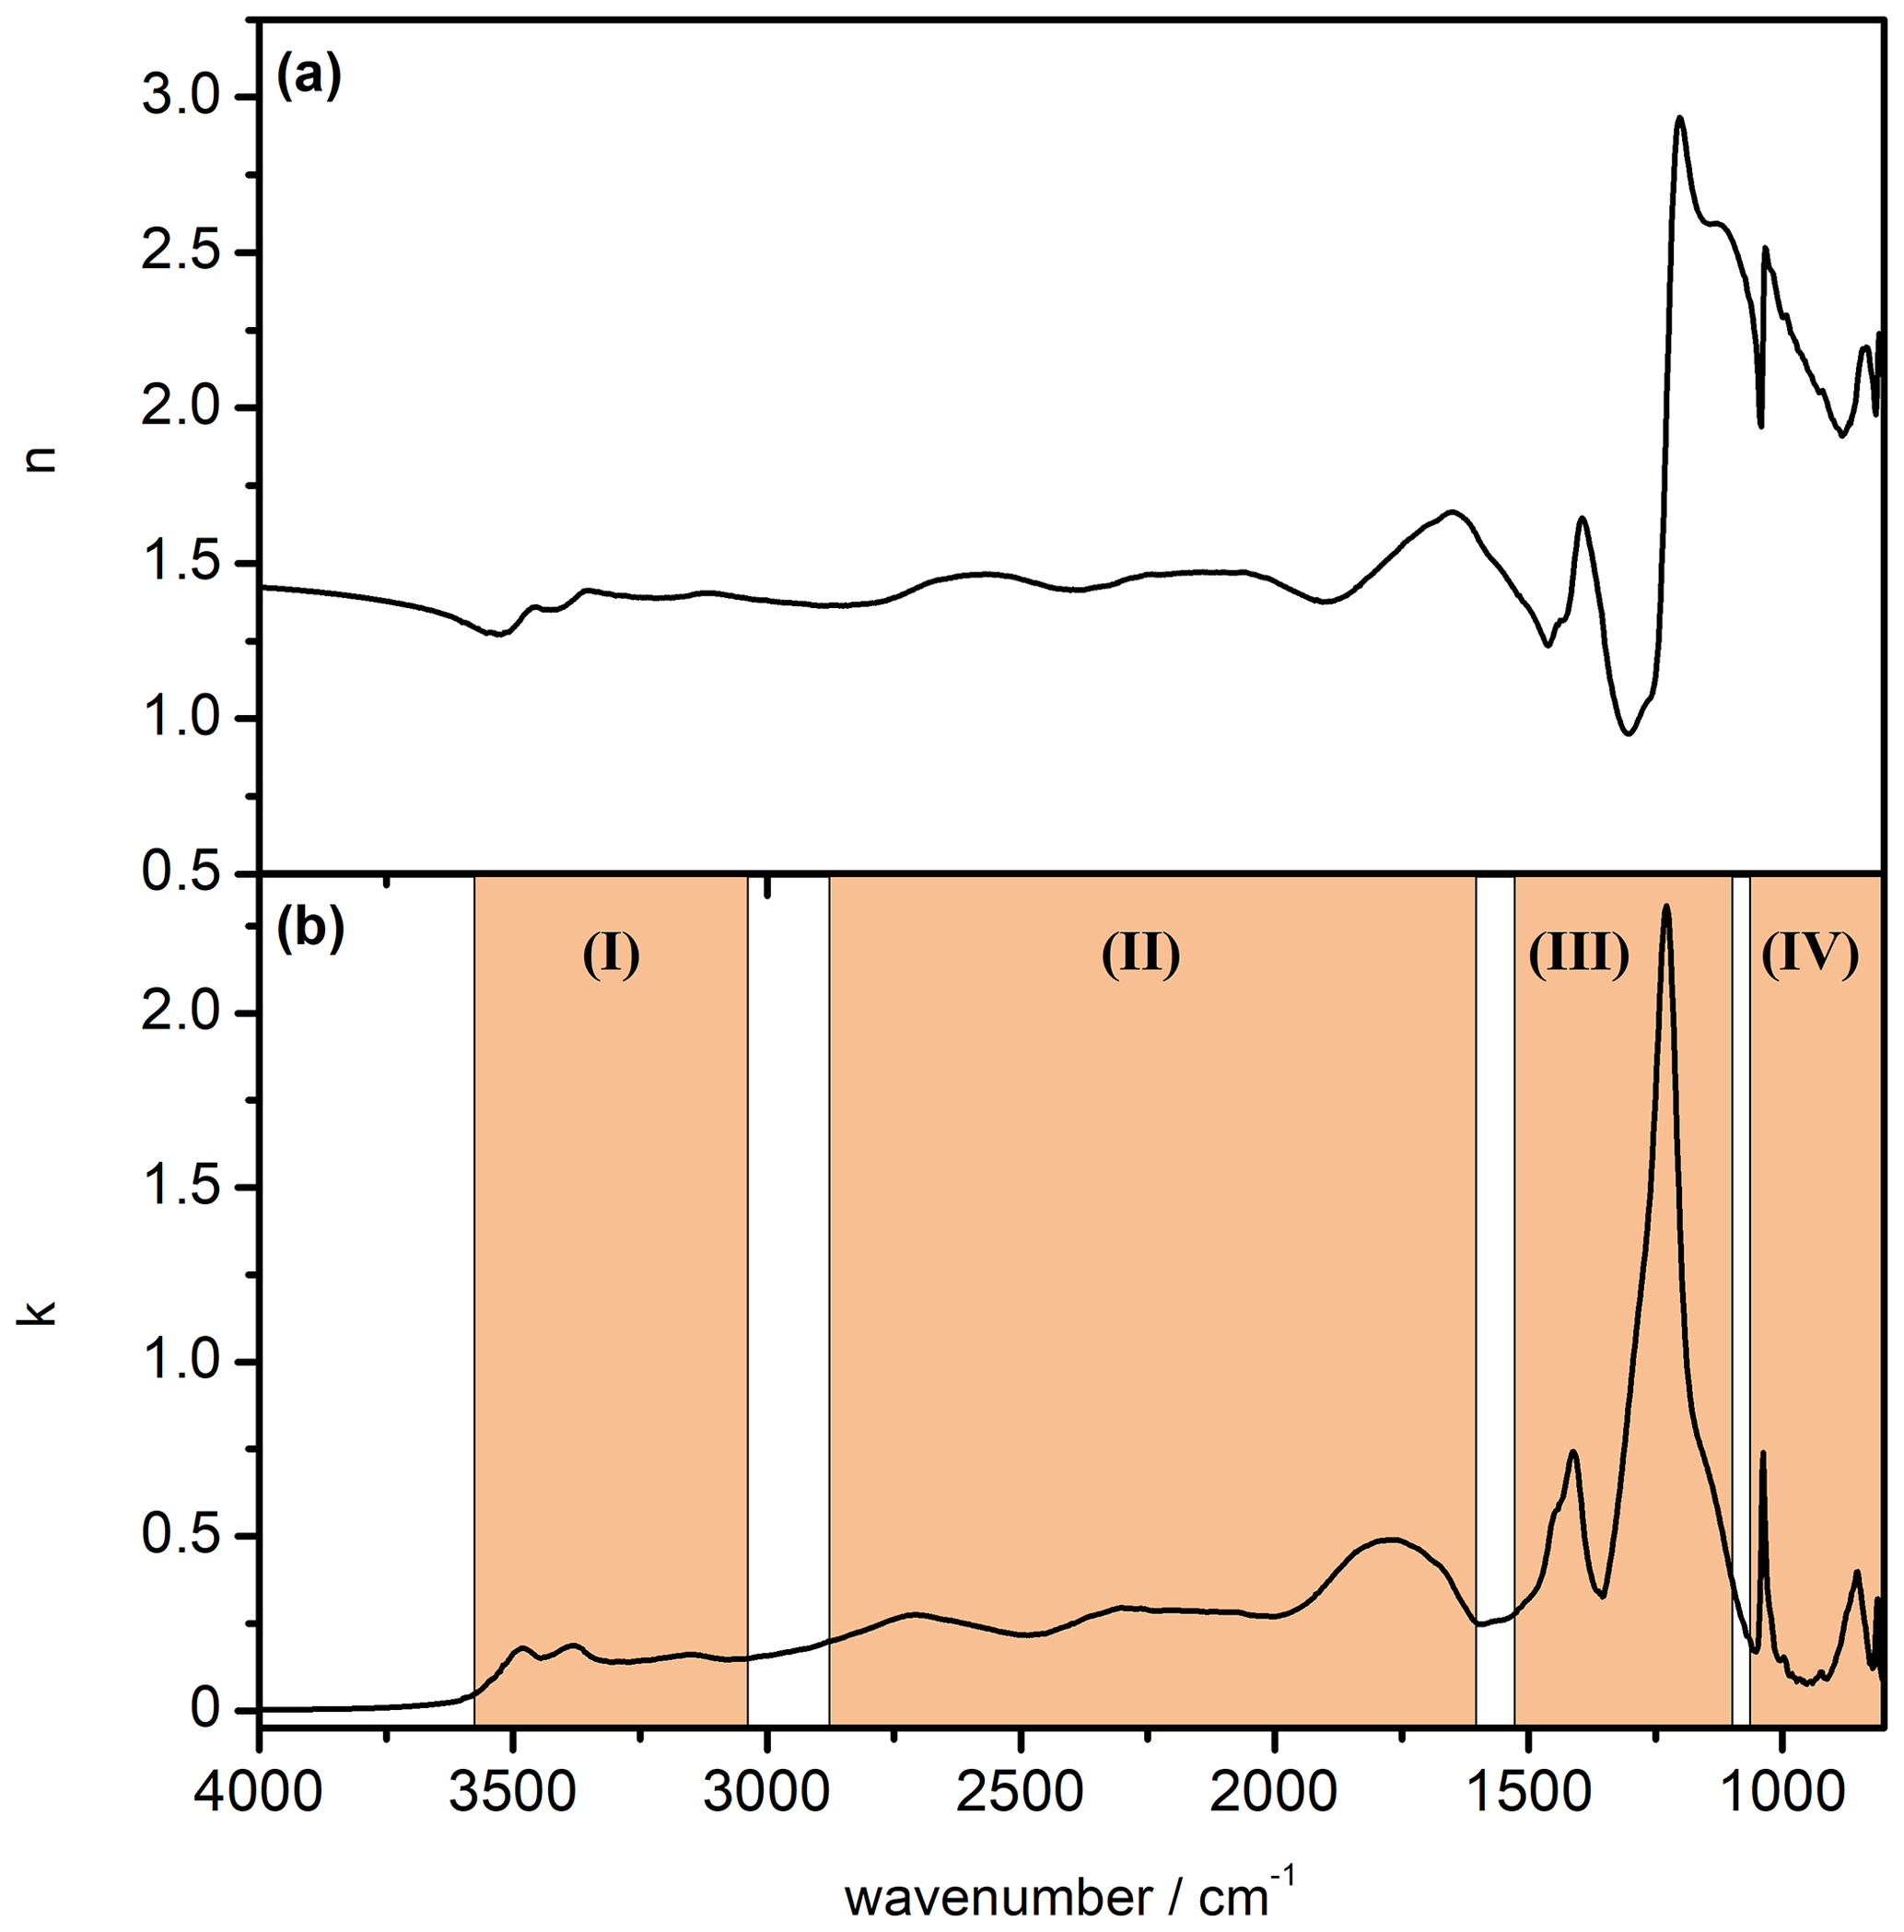
Figure 8Newly derived data set of mid-infrared optical constants for β-NAD. (a) Real part of the complex refractive index (n spectrum). (b) Imaginary part of the complex refractive index (k spectrum). The four spectral regions highlighted in part (b) are discussed in the text.
Figure 8 shows the newly derived data set of optical constants of β-NAD. We have highlighted four regions of the k spectrum whose absorption signatures are discussed in the following. In Table 2 we have listed the location of the infrared absorption bands in comparison with those assigned by Grothe et al. (2004). In regions (I), (II), and (IV), there is a good match between the peak positions from both studies. Our k spectrum shows the splitting of the ν1,3(H2O) vibration into three bands, which is characteristic for the β-NAD modification (region I). Three spectrally broad absorption bands due to the ν1,3(H3O+) and ν4(H3O+) modes cover the wavenumber range from 2900 to 1600 cm−1 (region II). In region (IV), in very good agreement with Grothe et al. (2004), we find two narrow peaks at 1038 and 812 cm−1 attributed to the ν1(NO) and ν2(NO) modes, respectively, and another band at 852 cm−1 yet unassigned. In the range between about 1500 and 1100 cm−1 with the ν3(NO) and ν2(H3O+) modes (region III), we observe a particularly strong absorption band at 1228 cm−1. This strong resonance signal is also clearly visible in the spectra of the annealed film and annealed particles of Tisdale et al. (1999) but is much less pronounced and shifted in wavenumber in the vibrational spectra presented in Grothe et al. (2004). While the thin films in Tisdale et al. (1999) were studied by single-pass transmission infrared spectroscopy on a silicon wafer, Grothe et al. (2004) used a reflective gold-platted support to deposit the samples. Using the example of a crystalline α-NAT film, it was shown that the specific orientation of the molecules on an underlying gold surface can either enhance or suppress the intensities of the infrared bands in reflection–absorption spectroscopy compared to transmission measurements, depending on the orientation of the transition dipole moment (Koch et al., 1996). For example, the ν3(NO) mode of crystalline α-NAT was considerably less infrared active when the sample was deposited on a gold substrate compared to a transmission measurement on a silicon wafer (Koch et al., 1996; Tisdale et al., 1997). We assume that such orientation effects might contribute to the partial discrepancies between the k spectrum we determined for β-NAD and the infrared measurement by Grothe et al. (2004).
Table 2Assignment of infrared absorption bands (cm−1, “sh”: shoulder) of β-NAD by Grothe et al. (2004) in comparison with the peak positions from the k spectrum retrieved in this study (Fig. 8).
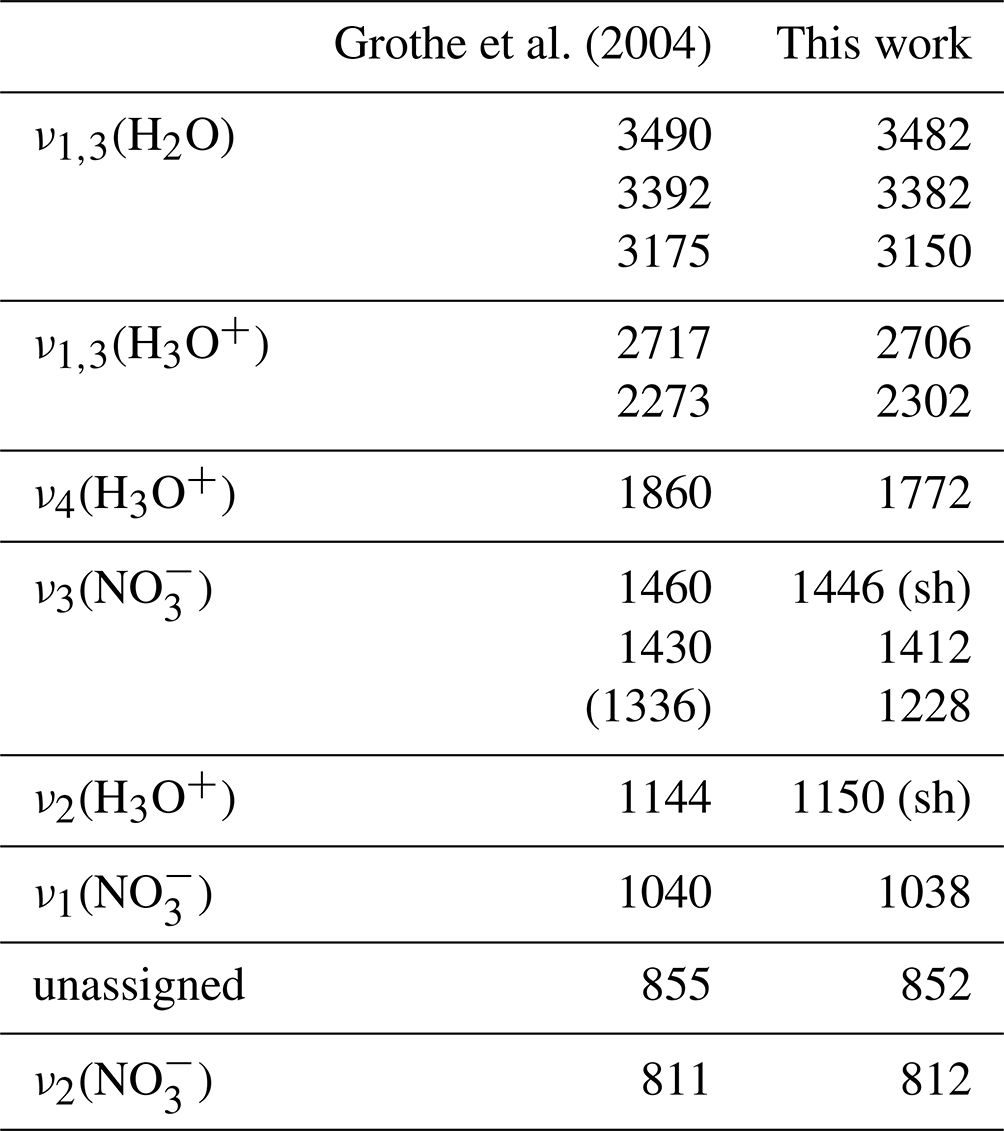
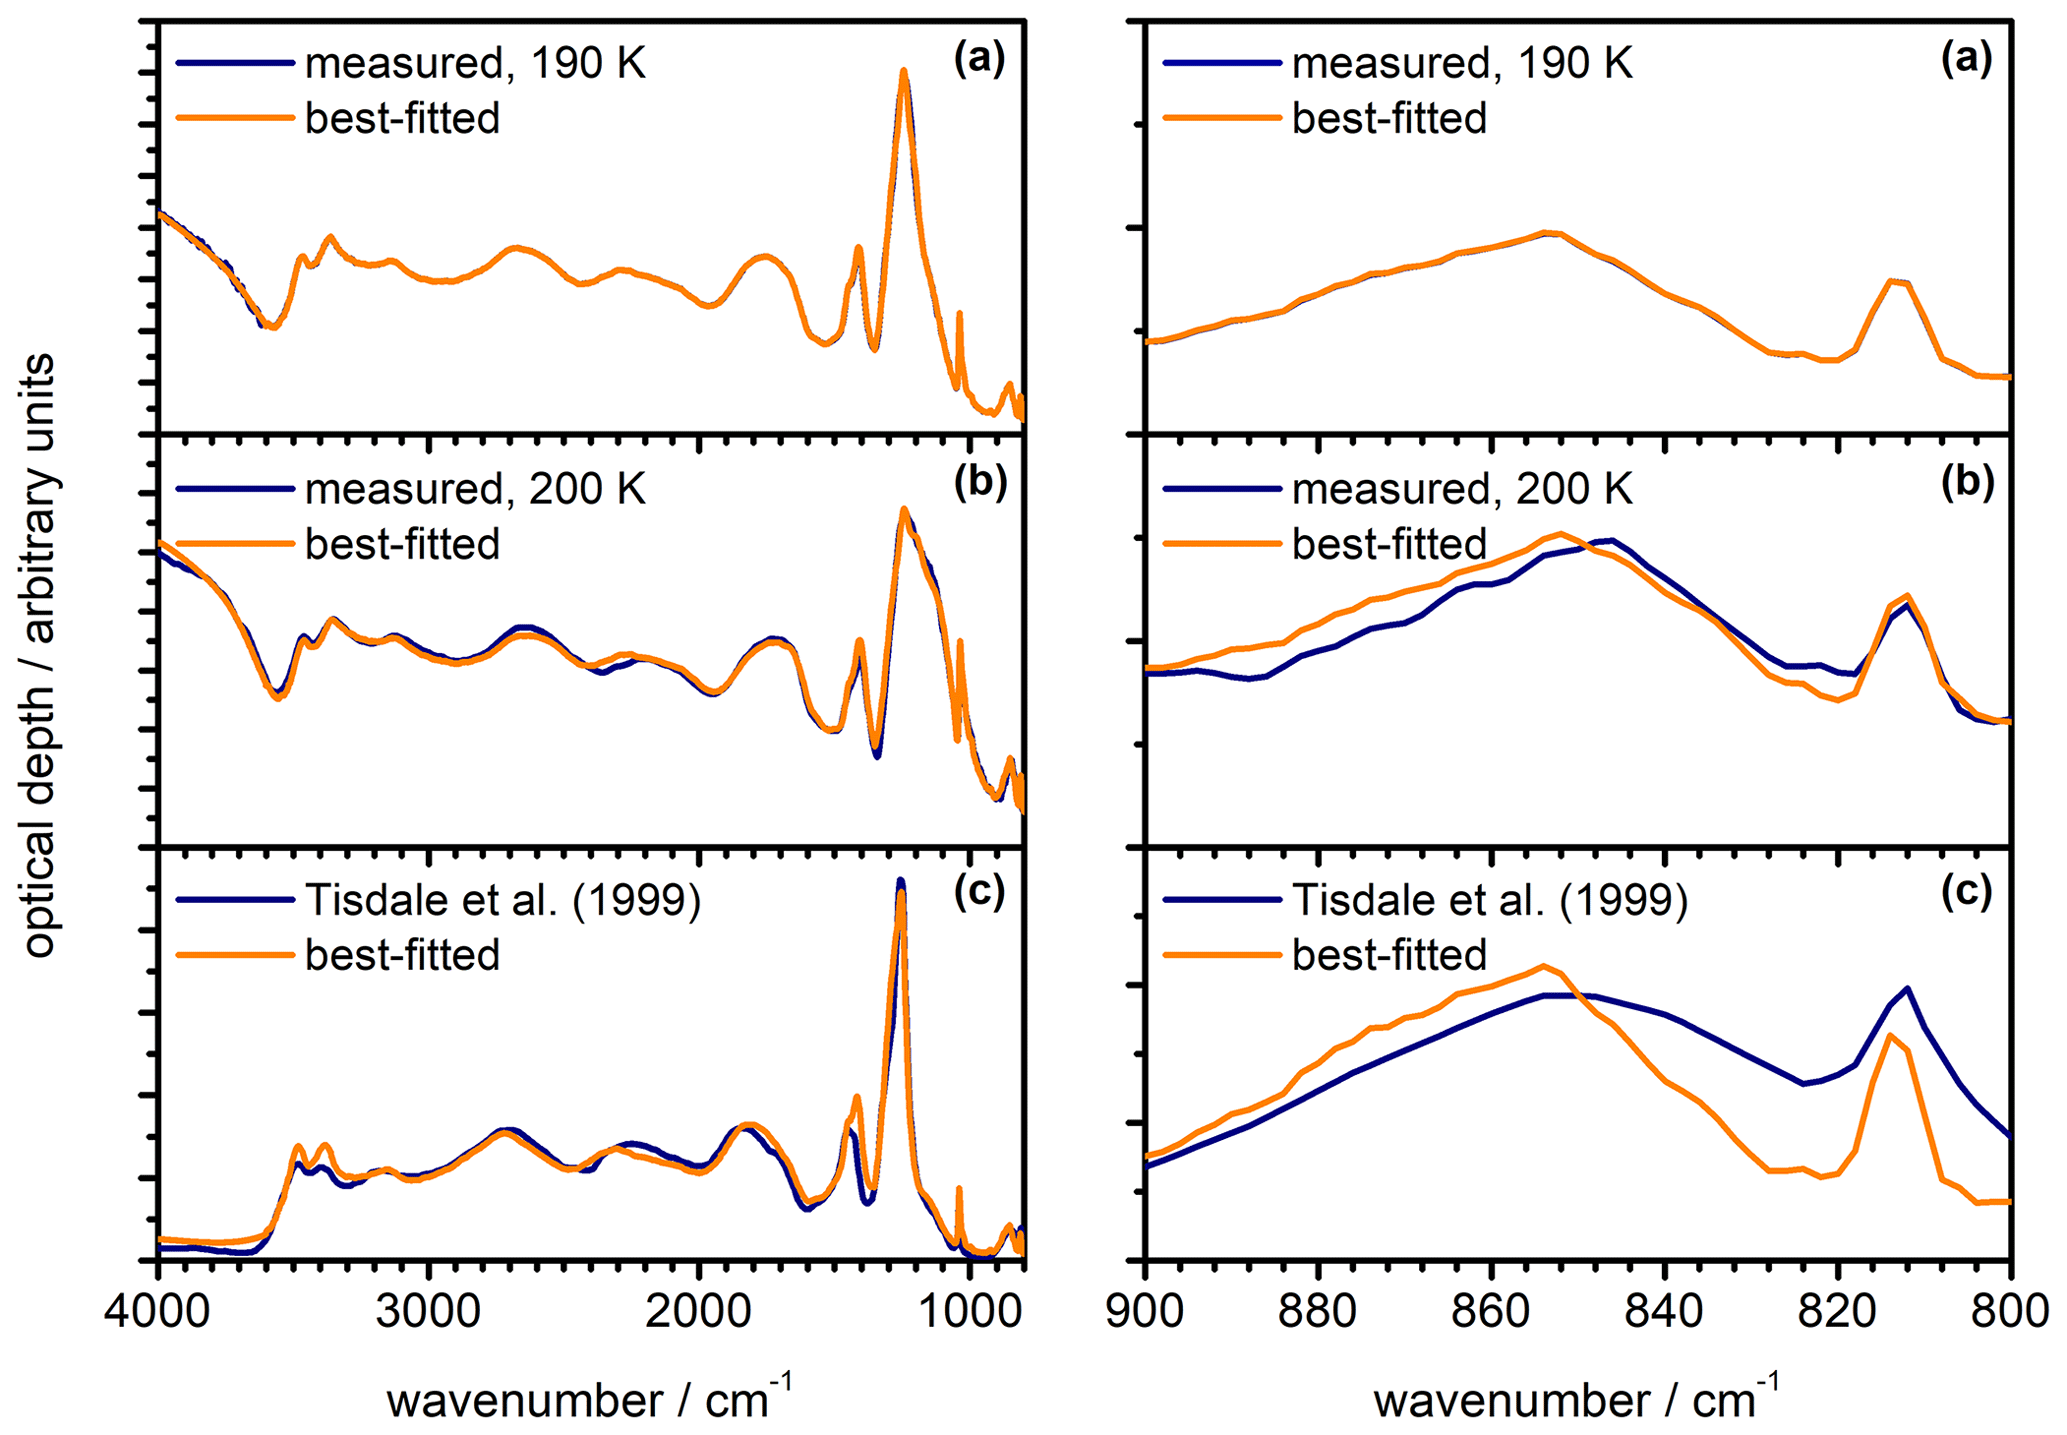
Figure 9Measured infrared extinction spectra of β-NAD particles (dark blue) in comparison with best-fitted spectra (orange) using the newly derived optical constants displayed in Fig. 8. The left part shows the full wavenumber range from 4000 to 800 cm−1, while the right part shows an expanded view from 900 to 800 cm−1. (a) Heterogeneous crystallisation experiment with illite at 190 K. The measured spectrum was used as template for the iterative adjustment of the optical constants, hence the very close agreement between measurement and calculation. (b) Heterogeneous crystallisation experiment with illite at 200 K. (c) Annealed particles from Tisdale et al. (1999), digitised from trace (E) in Fig. 4 therein. The NAD particles were formed below 160 K and crystallised between 160 and 221 K during rapid warming. For (a) and (b), we used an equivalent mixture of five different aspect ratios in the calculations, whereas the best fit in (c) was obtained for φ=2.
In Fig. 9a, we show the measured spectrum of β-NAD from the heterogeneous nucleation experiment with illite at 190 K together with the calculated spectrum after the convergence of the optimisation algorithm, which yielded the optical constants displayed in Fig. 8. We then used this new n and k data set to fit the β-NAD spectrum from the crystallisation experiment conducted at 200 K where we observed the pronounced shoulder at 1150 cm−1 in the spectral habitus (see Fig. 5, trace d). In this fit we used the same shape distribution and just varied the log-normal parameters of the size distribution of the β-NAD particles until the best agreement between the measured and the calculated spectrum was obtained. Figure 9b shows that the shoulder-like signature can be reproduced very accurately. The difference in the habitus compared to the spectra shown in Fig. 9a is simply related to particle size. While the particle diameter in the experiment at 190 K corresponded to about 2 µm, a value of about 2.5 µm was retrieved for the experiment at 200 K. We also attempted to reproduce the annealed particle extinction spectrum of Tisdale et al. (1999), which has a much lower scattering contribution because the particles were in the submicron size range. Our best-fitted spectrum, as shown in Fig. 9c, agrees quite well with the measured spectrum, in particular the strong extinction band between 1400 and 1100 cm−1 is accurately reproduced. Minor spectral inaccuracies must be acknowledged due to the necessary digitisation of the spectrum from the figure in the publication. Other, more physical reasons for the remaining differences between the measured and calculated spectra could be the temperature dependence of the optical constants, an incomplete conversion from the α to the β modification during annealing, and the simplified assumption of a spheroidal particle shape and an identical shape distribution in all size bins in the optical model. Nevertheless, the three fitting examples from Fig. 9 highlight that we can accurately reproduce the β-NAD extinction signatures for different particle sizes, which is an indication of the robustness of the derived n and k data set.
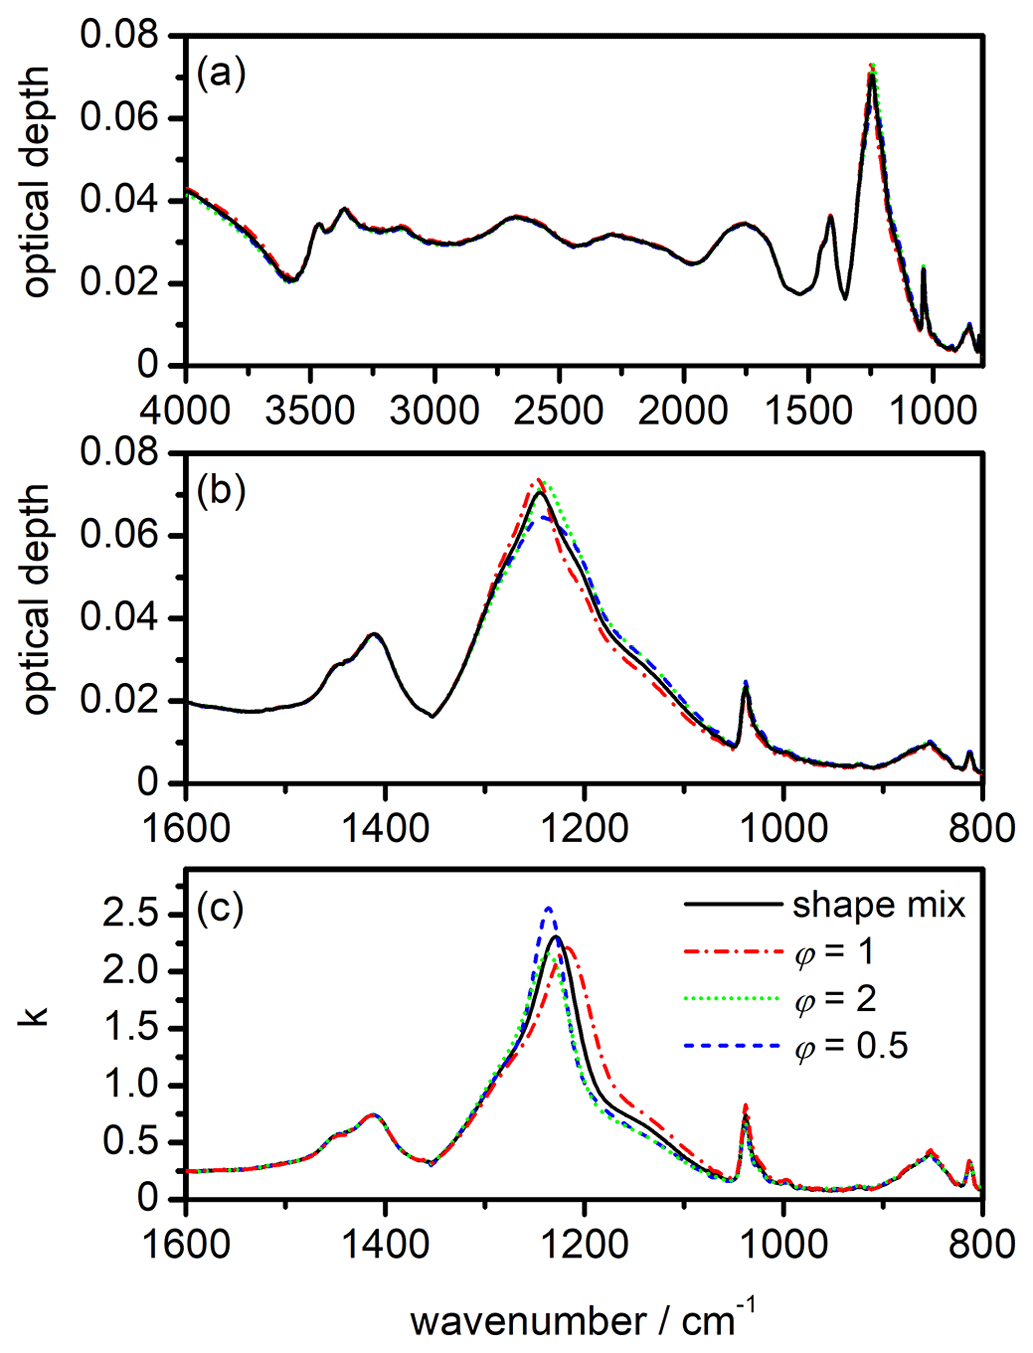
Figure 10Shape dependency of the infrared extinction spectrum and the retrieval results for the k spectrum of β-NAD. The colour and line style coding shown in panel (c) applies to all subpanels. (a) Calculation of the β-NAD extinction spectrum from the heterogeneous nucleation experiment with illite at 190 K (see Fig. 9a) for different particle habits. The black spectrum is the same as the best-fitted spectrum in Fig. 9a and was calculated for an equivalent mixture of five aspect ratios, φ=0.5, 0.67, 1, 1.5, and 2 (shape mix). For the same underlying size distribution and refractive indices, the additional computations show the spectral habitus when other values are used for the aspect ratio of the particles. (b) Enlarged view of the spectra from panel (a) in the range between 1600 and 800 cm−1. (c) Spectral changes in the retrieved k spectrum for β-NAD when other values for the aspect ratio of the particles are used instead of the shape mix.
In the quantitative assessment of the uncertainty of our new data set, we consider two important aspects, namely the influence of the particle shape on the extinction signatures and the treatment of the β-NAD particles as pure crystals with neglect of refractory inclusions. Regarding the first point, we show in Fig. 10 the results of a series of T-matrix computations with the retrieved n and k data set where we varied the aspect ratio of the β-NAD particles. Panel (a) covers the entire wavenumber range from 4000 to 800 cm−1, whereas panel (b) contains an expanded view from 1600 to 800 cm−1. The black spectrum is the calculation for the equivalent mixture of the five aspect ratios (φ=0.5, 0.67, 1, 1.5, and 2) as used in the retrieval of the optical constants. This spectrum is equal to the best-fitted spectrum shown in Fig. 9a for the heterogeneous nucleation experiment with illite at 190 K, where the β-NAD particles grew to a size of 2 µm. For the other three calculations, the particle size distribution was kept constant, but individual aspect ratios of φ=1, 2, and 0.5 were used instead of the shape mixture. The extent of the shape-dependent variations in the extinction spectrum of β-NAD was similar to that observed in our preceding study with crystalline ammonium sulfate (Wagner et al., 2021). While the influence of particle shape is negligible in spectral regions with small or moderate k values (k<0.5), the strong absorption centred at 1228 cm−1 corresponds to a situation where high values for the imaginary index (k≫1) are accompanied by anomalous dispersion signals with large amplitude in the n spectrum. Such conditions favour the occurrence of Fröhlich or surface modes that are strongly dependent on the particle shape (Bohren and Huffman, 1983; Clapp and Miller, 1993). The maximum of the extinction signal is shifted with respect to the centre of the k absorption peak and is located at 1244 cm−1 in the calculation for the shape mixture. Pure prolate (φ=0.5) and oblate (φ=2) particles cause a small shift in the position of this 1244 cm−1 band compared to the shape mixture and change its intensity in opposite directions. The sphere calculation (φ=1) does not represent an average of the two spheroidal shapes but agrees better with the computation for φ=2 in terms of band intensity. If the individual shapes φ=1, 2, and 0.5 and not the shape mixture were used to determine the optical constants, the spectral differences in Fig. 10b would be reflected in changes in the retrieved n and k data set. In Fig. 10c we show the result of such an analysis in which we repeated the retrieval procedure but used φ=1, 2, and 0.5 to represent the shape of the β-NAD crystals. We only show the range of the k spectrum from 1600 to 800 cm−1, because the changes in other spectral regions were insignificant. We observe maximum variations of ±12 % for the peak intensities of both the 1228 cm−1 band and the ν1(NO) mode at 1038 cm−1 in comparison with the retrieval result for the shape mixture. The 1228 cm−1 mode is also subject to band shifts of ±10 cm−1, while the position of the ν1(NO) mode does not depend on the particle shape. We consider these variations as the error regime of the retrieval results in terms of shape dependency. The n and k spectra for the equivalent mixture of five shapes are in the middle of the range of results for individual particle shapes, and are considered by us to be the most reliable solution. Therefore, we offer this data set as a download via the link provided under Data availability.
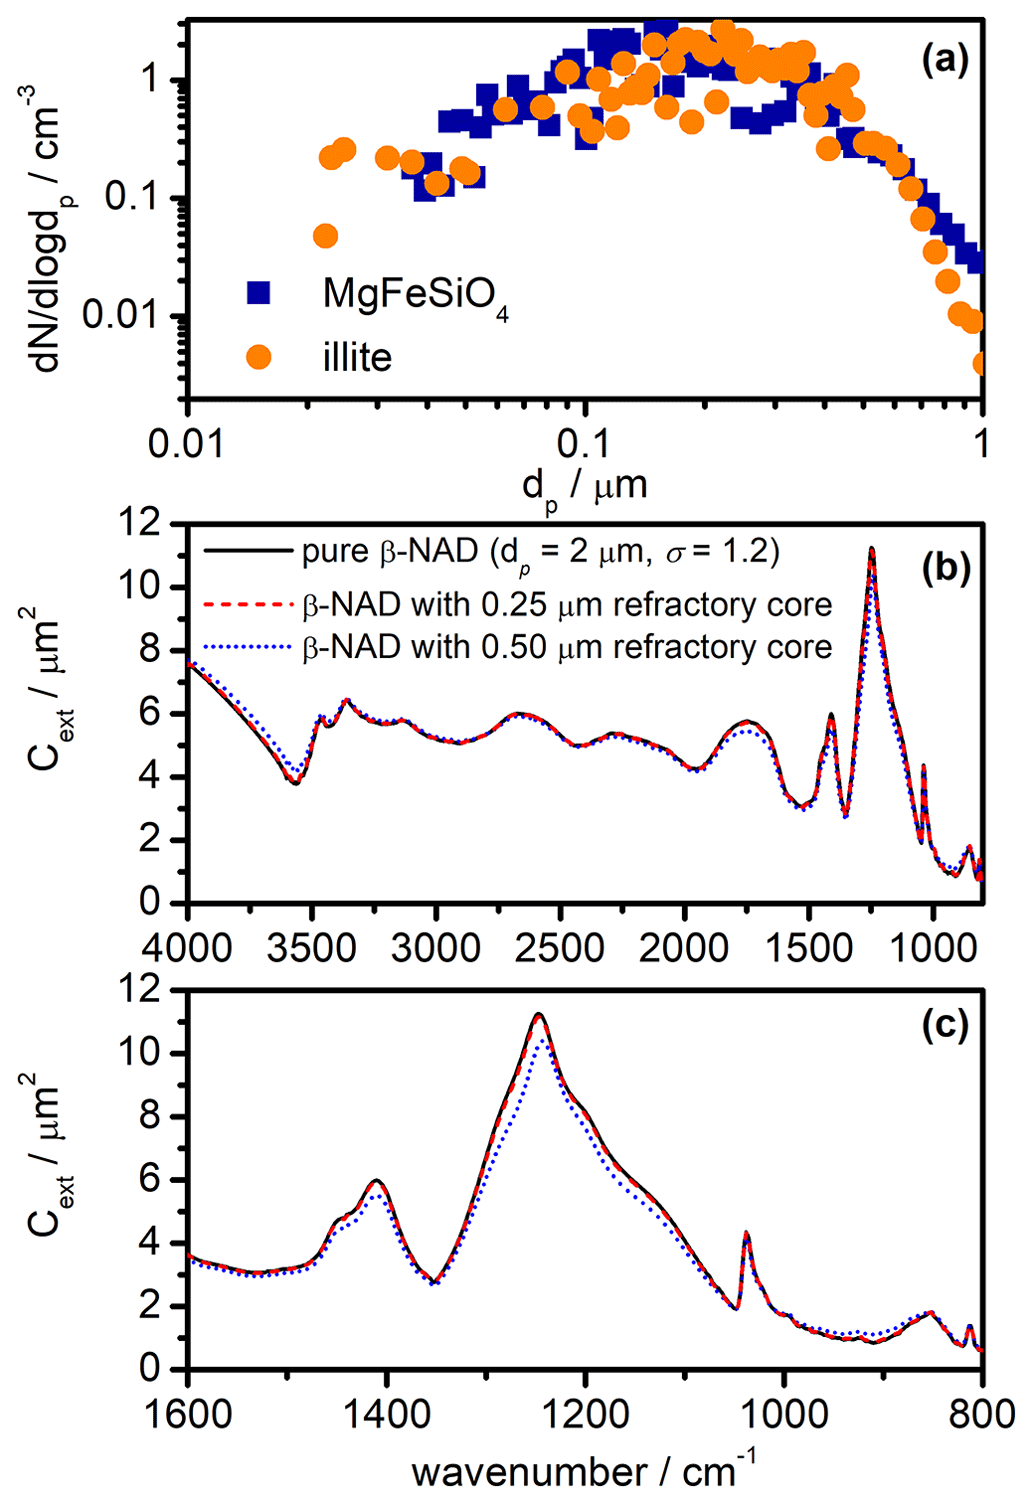
Figure 11Influence of refractory inclusions on the infrared extinction spectrum of β-NAD particles. (a) Measurements of the size distribution of pure MgFeSiO4 and illite particles dispersed with a rotating-brush generator and introduced into the AIDA chamber. The size spectra were merged from the recordings of a scanning mobility particle sizer (SMPS, TSI) and an aerodynamic particle spectrometer (APS, TSI). In order to convert measured mobility and aerodynamic diameters into the equal-volume sphere diameter, dp, we used values of 2.6 g cm−3 for the particle density and 1.4 for the dynamic shape factor. (b) Infrared extinction cross sections of pure, log-normally distributed spherical β-NAD crystals with a count median diameter of 2 µm and a mode width of 1.2 (black) in comparison with core-shell Mie simulations in which the centre of the β-NAD particles was replaced by spherical refractory inclusions with diameters of 0.25 (dashed red line) and 0.50 µm (dotted blue line). Note that the black line is almost identical to the dashed red line and therefore difficult to see. (c) Expanded view of the extinction cross sections from panel (b) between 1600 and 800 cm−1.
As mentioned in Sect. 2.3, our retrieval procedure implies that the infrared extinction spectra recorded during the heterogeneous crystallisation experiments can be interpreted to a good approximation as pure β-NAD spectra; that is, the inclusions of the illite and MgFeSiO4 particles in the β-NAD crystals can be neglected. Independent measurements of the number size distribution of the two refractory particle types after dispersion with the rotating-brush generator are shown in Fig. 11a. The count median diameters are in the range between 0.20 and 0.25 µm. More than 95 % of the particles had sizes ≤0.50 µm. As explained above, β-NAD particles that crystallised on these seed aerosol particles, when mixed internally with aqueous nitric acid, were able to grow at the expense of the reservoir of pure aqueous HNO3/H2O solution droplets, reaching a median size of ≥2 µm. In the following, we discuss the results of a Mie simulation in which we modelled the composite particles as coated spheres using the BHCOAT subroutine from Bohren and Huffman (1983). First, we computed the wavenumber-dependent extinction cross sections, Cext, of log-normally distributed, pure β-NAD spheres with a count median diameter of 2 µm and a mode width, σ, of 1.2. Then, we recalculated the spectrum with all β-NAD crystals containing a monodisperse, spherical refractory inclusion of diameters varying between 0.20 and 0.50 µm. The inclusions replaced the inner part of the β-NAD crystals, leaving the overall particle diameter unchanged. For the Mie computations, we used our retrieved refractive indices for the β modification to model the NAD part of the composite particles, while for the refractory inclusions we used optical constants for meteoric dust (Shettle and Volz, 1976). Selected results of our simulations are shown in Fig. 11b and c for the entire wavenumber range between 4000 and 800 cm−1 and for the expanded region between 1600 and 800 cm−1, respectively. With a diameter of 0.25 µm for the refractory inclusion, there is hardly any change compared to the extinction spectrum of the pure β-NAD particles. A slight shift in peak position and a 7 % decrease in peak intensity of the strong extinction band at 1244 cm−1 is observed when the diameter of the inclusion is increased to 0.50 µm. As noted above, there is a small fraction of seed aerosol particles with diameters larger than 0.50 µm that, if included in the composite particles, would trigger even larger changes in the extinction signatures compared to a pure β-NAD crystal than shown for the calculation with an inclusion size of 0.50 µm. However, we have emphasised in Sect. 3.1 that a very large proportion >80 % of the seed aerosol particles has acted as nuclei for the crystallisation of β-NAD. Therefore, crystallisation is not preferentially induced by the small number fraction of particles >0.50 µm, so the largest fraction of β-NAD crystals still forms on smaller seed aerosol particles, whose influence on the extinction spectrum is very small. Therefore, we consider the computation for an inclusion with a diameter of 0.50 µm as a conservative upper estimate for the changes in the extinction signatures due to the simplified treatment of the composite particles as pure β-NAD crystals in the retrieval scheme. The uncertainty is thus similar to that discussed above in relation to the influence of particle shape.
We have derived the first data set of infrared optical constants for the β modification of nitric acid dihydrate. β-NAD is considered to be the system's high-temperature phase, because it was first observed and structurally characterised by X-ray diffraction when the low-temperature α-NAD modification was heated above 210 K (Lebrun et al., 2001a). However, we have shown in this work that β-NAD particles were also efficiently formed during isothermal crystallisation experiments at 190 K, when the pre-added HNO3/H2O solution droplets contained a solid inclusion of illite or MgFeSiO4. Apparently, the surface of the embedded refractory materials supported the development of the three-dimensional network of H bonds typical of β-NAD. Nitric acid solution droplets that did not contain a solid inclusion crystallised more slowly into the α-NAD modification, whose structure better matches the short-range order of the liquid phase (Grothe et al., 2004). The two-dimensional scattering patterns measured with the SID-3 instrument revealed that the α-NAD particles predominantly grew into needle-like crystals, while the β-NAD particles had a more compact shape, which is consistent with the ESEM images by Grothe et al. (2008).
As outlined in the Introduction, the potential ice-free formation pathway of nitric acid hydrates via heterogeneous nucleation on particles of meteoric origin has inspired a number of laboratory studies, including recent work parameterising the nucleation activities of a variety of materials as active sites per unit surface area as a function of SNAT (James et al., 2018, 2023). Remarkably, all AIDA crystallisation experiments performed so far with binary HNO3/H2O solution droplets (with or without solid inclusions) resulted in metastable nitric acid hydrates, i.e. either β- or α-NAD. In satellite- and aircraft-based infrared measurements, however, only β-NAT has been clearly identified, e.g. by its signature at 820 cm−1 (Höpfner et al., 2002, 2006; Spang and Remedios, 2003; Woiwode et al., 2016, 2019; Lecours et al., 2022, 2023). The new data set of optical constants for β-NAD clearly does not question this assignment, since the ν2(NO) mode in β-NAD is located at 812 cm−1. One could therefore ask about the missing link between the AIDA laboratory experiments (formation of α, β-NAD) and the atmospheric observations (detection of β-NAT). It was shown that β-NAD begins to decompose into NAM and β-NAT at a temperature of about 220 K (Grothe et al., 2004, 2008). Therefore, it cannot be ruled out that such a transformation also occurs at lower temperatures on timescales longer than the observation time in AIDA, which is only a few hours and limited by sedimentation of the large, micrometre-sized crystals. But are there scenarios in which β-NAT particles would crystallise directly? As mentioned before, an important aspect controlling the type and distribution of solid phases in the HNO3/H2O system during crystallisation is the stoichiometry of the underlying liquid phase (Tizek et al., 2002, 2004; Grothe et al., 2008). In our experiments, we started with a rather high nitric acid concentration of about 50 wt % in the HNO3/H2O solution droplets, which is already at the upper end of HNO3 concentrations reported for STS droplets (Meilinger et al., 1995), and these droplets were further concentrated during crystallisation. Moreover, we have neglected the third component of the STS solution droplets, i.e. sulfuric acid, which could also influence the crystallisation behaviour.
A more atmospherically relevant experiment would therefore be to study the crystallisation of STS droplets containing an inclusion of meteoric material. Previously, we have shown that we can simulate the uptake of nitric acid in sulfuric acid solution droplets to form pure STS particles at temperatures below 195 K in the AIDA chamber (Wagner et al., 2005b). In this study, N2O5 formed by the gas-phase reaction between NO2 and O3 was hydrolysed on pre-added H2SO4/H2O solution droplets to form STS aerosol particles with a final composition of about 45 wt % HNO3, 5 wt % H2SO4, and 50 wt % H2O. For the above purpose, we would like to modify the procedure in a future experiment as follows. In the first step, we would inject the solid particles that serve as a proxy for meteoric ablation material. In the second step, we would coat these particles in situ at low temperature with sulfuric acid, which is formed by the oxidation of sulfur dioxide with hydroxyl radicals (Bertozzi, 2021). The latter could be produced by the gas-phase reaction between ozone and tetramethylethylene. Hydrolysis of N2O5 on the aqueous sulfuric acid coating layer would finally yield the desired STS droplets with a meteoric inclusion, whose crystallisation behaviour could then be studied. Another promising experiment for observing direct nucleation of β-NAT in AIDA would be to adjust the environmental conditions (temperature and relative humidity) such that SNAD<1 and to choose a material from the studies by James et al. (2018, 2023) where high nucleation activity was observed for such conditions so that the formation of β-NAD should be excluded. In a third type of experiment, the homogeneous freezing of pure STS solution droplets at T<188 K could be investigated. As the experiments by Weiss et al. (2016) have shown, α-NAT could easily form on the surface of the ice crystals and convert to β-NAT at T>195 K.
Although it is tempting to look for direct NAT crystallisation pathways in future laboratory studies, our current experiments once again highlight how effectively metastable NAD phases can be formed due to a lower free-energy barrier for nucleation compared to NAT (Worsnop et al., 1993; Salcedo et al., 2001). Atmospheric observations should therefore continue to look for metastable phases, and as far as infrared measurements are concerned, our study has filled a gap by providing the necessary optical constants for the β-NAD modification.
The refractive index data set derived in this work can be downloaded from the KITopen repository, the central publication platform for KIT (Karlsruhe Institute of Technology) scientists, at https://doi.org/10.5445/IR/1000158540 (Wagner et al., 2023).
MS, RaW, and JMCP conceptualised and supervised the project. MS, RoW, ADJ, VLF, HS, OM, and RaW conducted the experiments at the AIDA chamber. ADJ and VLF synthesised the MgFeSiO4 sample. RoW and MS analysed the data. RoW wrote the original manuscript draft with input from MS and RaW. All authors contributed to review and editing.
At least one of the (co)-authors is a member of the editorial board of Atmospheric Chemistry and Physics. The peer-review process was guided by an independent editor, and the authors also have no other competing interests to declare.
Publisher’s note: Copernicus Publications remains neutral with regard to jurisdictional claims in published maps and institutional affiliations.
We gratefully acknowledge the continuous support by all members of the Engineering and Infrastructure group of IMK-AAF, in particular by Olga Dombrowski, Rainer Buschbacher, Tomasz Chudy, Steffen Vogt, and Georg Scheurig.
This research has been supported by the Helmholtz-Gemeinschaft (Atmosphere and Climate), the European Research Council, FP7 Ideas: European Research Council (grant no. project number 291332 – CODITA), and the Leverhulme Trust (grant no. F/00 122/BB – PETALS).
The article processing charges for this open-access publication were covered by the Karlsruhe Institute of Technology (KIT).
This paper was edited by Hinrich Grothe and reviewed by Michel J. Rossi and one anonymous referee.
Ahrenkiel, R. K.: Modified Kramers-Kronig Analysis of Optical Spectra, J. Opt. Soc. Am., 61, 1651–1655, 1971.
Aroui, H., Orphal, J., and Tchana, F. K.: Fourier Transform Infrared Spectroscopy for the Measurement of Spectral Line Profiles, in: Fourier Transform – Materials Analysis, edited by: Salih, S. M., InTech, New York, 69–102, https://doi.org/10.5772/36120, 2012.
Barton, N., Rowland, B., and Devlin, J. P.: Infrared-Spectra of Large Acid Hydrate Clusters – Formation Conditions of Submicron Particles of HNO3⋅ 2H2O and HNO3⋅ 3H2O, J. Phys. Chem., 97, 5848–5851, 1993.
Benz, S., Megahed, K., Möhler, O., Saathoff, H., Wagner, R., and Schurath, U.: T-dependent rate measurements of homogeneous ice nucleation in cloud droplets using a large atmospheric simulation chamber, J. Photochem. Photobio. A, 176, 208–217, 2005.
Bertozzi, B.: Ice nucleation ability of secondary aerosol particles at cirrus cloud conditions, PhD, Department of Physics, Karlsruhe Institute of Technology, Karlsruhe, https://doi.org/10.5445/IR/1000146739, 2021.
Bertram, A. K. and Sloan, J. J.: Temperature-dependent nucleation rate constants and freezing behavior of submicron nitric acid dihydrate aerosol particles under stratospheric conditions, J. Geophys. Res.-Atmos., 103, 3553–3561, 1998a.
Bertram, A. K. and Sloan, J. J.: The nucleation rate constants and freezing mechanism of nitric acid trihydrate aerosol under stratospheric conditions, J. Geophys. Res.-Atmos., 103, 13261–13265, https://doi.org/10.1029/98JD00921, 1998b.
Beyer, K. D. and Hansen, A. R.: Phase Diagram of the Nitric Acid/Water System: Implications for Polar Stratospheric Clouds, J. Phys. Chem. A, 106, 10275–10284, https://doi.org/10.1021/jp025535o, 2002.
Bogdan, A. and Kulmala, M.: Aerosol silica as a possible candidate for the heterogeneous formation of nitric acid hydrates in the stratosphere, Geophys. Res. Lett., 26, 1433–1436, https://doi.org/10.1029/1999GL900254, 1999.
Bohren, C. F. and Huffman, D. R.: Absorption and Scattering of Light by Small Particles, John Wiley & Sons, Inc., New York, https://doi.org/10.1002/9783527618156, 1983.
Carslaw, K. S., Wirth, M., Tsias, A., Luo, B. P., Dörnbrack, A., Leutbecher, M., Volkert, H., Renger, W., Bacmeister, J. T., and Peter, T.: Particle microphysics and chemistry in remotely observed mountain polar stratospheric clouds, J. Geophys. Res.-Atmos., 103, 5785–5796, https://doi.org/10.1029/97JD03626, 1998.
Clapp, M. L. and Miller, R. E.: Shape Effects in the Infrared Spectrum of Ammonia Aerosols, Icarus, 105, 529–536, 1993.
Clegg, S. L., Brimblecombe, P., and Wexler, A. S.: Thermodynamic model of the system H+-NH-SO-NO-H2O at tropospheric temperatures, J. Phys. Chem. A, 102, 2137–2154, 1998.
Cotton, R. J., Field, P. R., Ulanowski, Z., Kaye, P. H., Hirst, E., Greenaway, R. S., Crawford, I., Crosier, J., and Dorsey, J.: The effective density of small ice particles obtained from in situ aircraft observations of mid-latitude cirrus, Q. J. Roy. Meteor. Soc., 139, 1923–1934, https://doi.org/10.1002/qj.2058, 2013.
Disselkamp, R. S., Anthony, S. E., Prenni, A. J., Onasch, T. B., and Tolbert, M. A.: Crystallization kinetics of nitric acid dihydrate aerosols, J. Phys. Chem., 100, 9127–9137, 1996.
Ebert, M., Weigel, R., Kandler, K., Günther, G., Molleker, S., Grooß, J.-U., Vogel, B., Weinbruch, S., and Borrmann, S.: Chemical analysis of refractory stratospheric aerosol particles collected within the arctic vortex and inside polar stratospheric clouds, Atmos. Chem. Phys., 16, 8405–8421, https://doi.org/10.5194/acp-16-8405-2016, 2016.
Fahey, D. W., Gao, R.-S., Möhler, O., Saathoff, H., Schiller, C., Ebert, V., Krämer, M., Peter, T., Amarouche, N., Avallone, L. M., Bauer, R., Bozóki, Z., Christensen, L. E., Davis, S. M., Durry, G., Dyroff, C., Herman, R. L., Hunsmann, S., Khaykin, S. M., Mackrodt, P., Meyer, J., Smith, J. B., Spelten, N., Troy, R. F., Vömel, H., Wagner, S., and Wienhold, F. G.: The AquaVIT-1 intercomparison of atmospheric water vapor measurement techniques, Atmos. Meas. Tech., 7, 3177–3213, https://doi.org/10.5194/amt-7-3177-2014, 2014.
Fernandez, D., Botella, V., Herrero, V. J., and Escribano, R.: A theoretical study of the structure and spectra of nitric acid hydrates crystals, J. Phys. Chem. B, 107, 10608–10614, 2003.
Frankland, V. L., James, A. D., Feng, W. H., and Plane, J. M. C.: The uptake of HNO3 on meteoric smoke analogues, J. Atmos. Sol.-Terr. Phy., 127, 150–160, https://doi.org/10.1016/j.jastp.2015.01.010, 2015.
Grooß, J.-U., Engel, I., Borrmann, S., Frey, W., Günther, G., Hoyle, C. R., Kivi, R., Luo, B. P., Molleker, S., Peter, T., Pitts, M. C., Schlager, H., Stiller, G., Vömel, H., Walker, K. A., and Müller, R.: Nitric acid trihydrate nucleation and denitrification in the Arctic stratosphere, Atmos. Chem. Phys., 14, 1055–1073, https://doi.org/10.5194/acp-14-1055-2014, 2014.
Grothe, H., Myhre, C. E. L., and Tizek, H.: Vibrational spectra of nitric acid dihydrate (NAD), Vib. Spectrosc., 34, 55–62, 2004.
Grothe, H., Tizek, H., Waller, D., and Stokes, D. J.: The crystallization kinetics and morphology of nitric acid trihydrate, Phys. Chem. Chem. Phys., 8, 2232–2239, https://doi.org/10.1039/B601514J, 2006.
Grothe, H., Tizek, H., and Ortega, I. K.: Metastable nitric acid hydrates – possible constituents of polar stratospheric clouds?, Faraday Discuss., 137, 223–234, 2008.
Hirst, E., Kaye, P. H., Greenaway, R. S., Field, P., and Johnson, D. W.: Discrimination of micrometre-sized ice and super-cooled droplets in mixed-phase cloud, Atmos. Env., 35, 33–47, https://doi.org/10.1016/S1352-2310(00)00377-0, 2001.
Höpfner, M., Oelhaf, H., Wetzel, G., Friedl-Vallon, F., Kleinert, A., Lengel, A., Maucher, G., Nordmeyer, H., Glatthor, N., Stiller, G., Clarmann, T. v., Fischer, H., Kröger, C., and Deshler, T.: Evidence of scattering of tropospheric radiation by PSCs in mid-IR limb emission spectra: MIPAS-B observations and KOPRA simulations, Geophys. Res. Lett., 29, 119-111–119-114, https://doi.org/10.1029/2001GL014443, 2002.
Höpfner, M., Luo, B. P., Massoli, P., Cairo, F., Spang, R., Snels, M., Di Donfrancesco, G., Stiller, G., von Clarmann, T., Fischer, H., and Biermann, U.: Spectroscopic evidence for NAT, STS, and ice in MIPAS infrared limb emission measurements of polar stratospheric clouds, Atmos. Chem. Phys., 6, 1201–1219, https://doi.org/10.5194/acp-6-1201-2006, 2006.
Hoyle, C. R., Engel, I., Luo, B. P., Pitts, M. C., Poole, L. R., Grooß, J.-U., and Peter, T.: Heterogeneous formation of polar stratospheric clouds – Part 1: Nucleation of nitric acid trihydrate (NAT), Atmos. Chem. Phys., 13, 9577–9595, https://doi.org/10.5194/acp-13-9577-2013, 2013.
Iannarelli, R. and Rossi, M. J.: The mid-IR Absorption Cross Sections of α- and β-NAT (HNO3⋅ 3H2O) in the range 170 to 185 K and of metastable NAD (HNO3⋅ 2H2O) in the range 172 to 182 K, J. Geophys. Res.-Atmos., 120, 11707–11727, https://doi.org/10.1002/2015JD023903, 2015.
James, A. D., Frankland, V. L. F., Trigo-Rodriguez, J. M., Alonso-Azcarate, J., Martin, J. C. G., and Plane, J. M. C.: Synthesis and characterisation of analogues for interplanetary dust and meteoric smoke particles, J. Atmos. Sol.-Terr. Phy., 162, 178–191, https://doi.org/10.1016/j.jastp.2016.08.011, 2017.
James, A. D., Brooke, J. S. A., Mangan, T. P., Whale, T. F., Plane, J. M. C., and Murray, B. J.: Nucleation of nitric acid hydrates in polar stratospheric clouds by meteoric material, Atmos. Chem. Phys., 18, 4519–4531, https://doi.org/10.5194/acp-18-4519-2018, 2018.
James, A. D., Pace, F., Sikora, S. N. F., Mann, G. W., Plane, J. M. C., and Murray, B. J.: The importance of acid-processed meteoric smoke relative to meteoric fragments for crystal nucleation in polar stratospheric clouds, Atmos. Chem. Phys., 23, 2215–2233, https://doi.org/10.5194/acp-23-2215-2023, 2023.
Kalicinsky, C., Griessbach, S., and Spang, R.: A new method to detect and classify polar stratospheric nitric acid trihydrate clouds derived from radiative transfer simulations and its first application to airborne infrared limb emission observations, Atmos. Meas. Tech., 14, 1893–1915, https://doi.org/10.5194/amt-14-1893-2021, 2021.
Knopf, D. A.: Do NAD and NAT Form in Liquid Stratospheric Aerosols by Pseudoheterogeneous Nucleation?, J. Phys. Chem. A, 110, 5745–5750, https://doi.org/10.1021/jp055376j, 2006.
Koch, T. G., Holmes, N. S., Roddis, T. B., and Sodeau, J. R.: Low-temperature photochemistry of submicrometer nitric acid and ammonium nitrate layers, J. Phys. Chem., 100, 11402–11407, 1996.
Koehler, B. G., Middlebrook, A. M., and Tolbert, M. A.: Characterization of Model Polar Stratospheric Cloud Films Using Fourier-Transform Infrared-Spectroscopy and Temperature Programmed Desorption, J. Geophys. Res.-Atmos., 97, 8065–8074, 1992.
Koop, T., Biermann, U. M., Raber, W., Luo, B. P., Crutzen, P. J., and Peter, T.: Do Stratospheric Aerosol Droplets Freeze above the Ice Frost Point, Geophys. Res. Lett., 22, 917–920, 1995.
Lebrun, N., Mahe, F., Lamiot, J., Foulon, M., and Petit, J. C.: A new crystalline phase of nitric acid dihydrate, Acta Crystallogr. C, 57, 1129–1131, https://doi.org/10.1107/S0108270101010101, 2001a.
Lebrun, N., Mahe, F., Lamiot, J., Foulon, M., Petit, J. C., and Prevost, D.: Kinetic behaviour investigations and crystal structure of nitric acid dihydrate, Acta Crystallogr. B, 57, 27–35, https://doi.org/10.1107/s0108768100014506, 2001b.
Lecours, M., Bernath, P., Boone, C., and Crouse, J.: Infrared transmittance spectra of polar stratospheric clouds, J. Quant. Spectrosc. Ra., 294, 108406, https://doi.org/10.1016/j.jqsrt.2022.108406, 2023.
Lecours, M. J., Bernath, P. F., Sorensen, J. J., Boone, C., Johnson, R. M., and LaBelle, K.: Atlas of ACE spectra of clouds and aerosols, J. Quant. Spectrosc. R., 292, 108361, https://doi.org/10.1016/j.jqsrt.2022.108361, 2022.
Liu, L. and Mishchenko, M. I.: Constraints on PSC particle microphysics derived from lidar observations, J. Quant. Spectrosc. Ra., 70, 817–831, 2001.
Lowe, D. and MacKenzie, A. R.: Polar stratospheric cloud microphysics and chemistry, J. Atmos. Sol.-Terr. Phy., 70, 13–40, https://doi.org/10.1016/j.jastp.2007.09.011, 2008.
Massucci, M., Clegg, S. L., and Brimblecombe, P.: Equilibrium partial pressures, thermodynamic properties of aqueous and solid phases, and Cl2 production from aqueous HCl and HNO3 and their mixtures, J. Phys. Chem. A, 103, 4209–4226, https://doi.org/10.1021/jp9847179, 1999.
Meilinger, S. K., Koop, T., Luo, B. P., Huthwelker, T., Carslaw, K. S., Krieger, U., Crutzen, P. J., and Peter, T.: Size-dependent stratospheric droplet composition in Lee wave temperature fluctuations and their potential role in PSC freezing, Geophys. Res. Lett., 22, 3031–3034, https://doi.org/10.1029/95GL03056, 1995.
Milham, M. E., Frickel, R. H., Embury, J. F., and Anderson, D. H.: Determination of optical constants from extinction measurements, J. Opt. Soc. Am., 71, 1099–1106, 1981.
Mishchenko, M. I. and Travis, L. D.: Capabilities and limitations of a current FORTRAN implementation of the T-matrix method for randomly oriented, rotationally symmetric scatterers, J. Quant. Spectrosc. Ra., 60, 309–324, 1998.
Mishchenko, M. I., Travis, L. D., and Mackowski, D. W.: T-matrix computations of light scattering by nonspherical particles: A review, J. Quant. Spectrosc. Ra., 55, 535–575, 1996.
Möhler, O., Bunz, H., and Stetzer, O.: Homogeneous nucleation rates of nitric acid dihydrate (NAD) at simulated stratospheric conditions – Part II: Modelling, Atmos. Chem. Phys., 6, 3035–3047, https://doi.org/10.5194/acp-6-3035-2006, 2006a.
Möhler, O., Field, P. R., Connolly, P., Benz, S., Saathoff, H., Schnaiter, M., Wagner, R., Cotton, R., Krämer, M., Mangold, A., and Heymsfield, A. J.: Efficiency of the deposition mode ice nucleation on mineral dust particles, Atmos. Chem. Phys., 6, 3007–3021, https://doi.org/10.5194/acp-6-3007-2006, 2006b.
Molleker, S., Borrmann, S., Schlager, H., Luo, B., Frey, W., Klingebiel, M., Weigel, R., Ebert, M., Mitev, V., Matthey, R., Woiwode, W., Oelhaf, H., Dörnbrack, A., Stratmann, G., Grooß, J.-U., Günther, G., Vogel, B., Müller, R., Krämer, M., Meyer, J., and Cairo, F.: Microphysical properties of synoptic-scale polar stratospheric clouds: in situ measurements of unexpectedly large HNO3-containing particles in the Arctic vortex, Atmos. Chem. Phys., 14, 10785–10801, https://doi.org/10.5194/acp-14-10785-2014, 2014.
Murphy, D. M. and Koop, T.: Review of the vapour pressures of ice and supercooled water for atmospheric applications, Q. J. Roy. Meteor. Soc., 131, 1539–1565, 2005.
Murphy, D. M., Froyd, K. D., Schwarz, J. P., and Wilson, J. C.: Observations of the chemical composition of stratospheric aerosol particles, Q. J. Roy. Meteor. Soc., 140, 1269–1278, https://doi.org/10.1002/qj.2213, 2014.
Niedziela, R. F., Miller, R. E., and Worsnop, D. R.: Temperature- and frequency-dependent optical constants for nitric acid dihydrate from aerosol spectroscopy, J. Phys. Chem. A, 102, 6477–6484, 1998.
Norman, M. L., Qian, J., Miller, R. E., and Worsnop, D. R.: Infrared complex refractive indices of supercooled liquid HNO3/H2O aerosols, J. Geophys. Res.-Atmos., 104, 30571–30584, 1999.
Ohta, K. and Ishida, H.: Comparison among Several Numerical Integration Methods for Kramers-Kronig Transformation, Appl. Spectrosc., 42, 952–957, 1988.
Ostwald, W.: Studien über die Bildung und Umwandlung fester Körper: 1. Abhandlung: Übersättigung und Überkaltung, Z. Physik. Chem., 22U, 289–330, https://doi.org/10.1515/zpch-1897-2233, 1897.
Pagan, K. L., Tabazadeh, A., Drdla, K., Hervig, M. E., Eckermann, S. D., Browell, E. V., Legg, M. J., and Foschi, P. G.: Observational evidence against mountain-wave generation of ice nuclei as a prerequisite for the formation of three solid nitric acid polar stratospheric clouds observed in the Arctic in early December 1999, J. Geophys. Res.-Atmos., 109, D04312, https://doi.org/10.1029/2003JD003846, 2004.
Peter, T. and Grooß, J.-U.: Chapter 4 – Polar Stratospheric Clouds and Sulfate Aerosol Particles: Microphysics, Denitrification and Heterogeneous Chemistry, in: Stratospheric Ozone Depletion and Climate Change, Roy. Soc. Ch., 108–144, 2012.
Pinti, V., Marcolli, C., Zobrist, B., Hoyle, C. R., and Peter, T.: Ice nucleation efficiency of clay minerals in the immersion mode, Atmos. Chem. Phys., 12, 5859–5878, https://doi.org/10.5194/acp-12-5859-2012, 2012.
Pitts, M. C., Poole, L. R., and Thomason, L. W.: CALIPSO polar stratospheric cloud observations: second-generation detection algorithm and composition discrimination, Atmos. Chem. Phys., 9, 7577–7589, https://doi.org/10.5194/acp-9-7577-2009, 2009.
Pitts, M. C., Poole, L. R., and Gonzalez, R.: Polar stratospheric cloud climatology based on CALIPSO spaceborne lidar measurements from 2006 to 2017, Atmos. Chem. Phys., 18, 10881–10913, https://doi.org/10.5194/acp-18-10881-2018, 2018.
Prenni, A. J., Onasch, T. B., Tisdale, R. T., Siefert, R. L., and Tolbert, M. A.: Composition-dependent freezing nucleation rates for HNO3/H2O aerosols resembling gravity-wave-perturbed stratospheric particles, J. Geophys. Res.-Atmos., 103, 28439–28450, 1998.
Press, W. H., Teukolsky, S. A., Vetterling, W. T., and Flannery, B. P.: Numerical Recipes in C: The Art of Scientific Computing, Cambridge University Press, Cambridge, ISBN 0-521-43108-5, 1992.
Richwine, L. J., Clapp, M. L., Miller, R. E., and Worsnop, D. R.: Complex Refractive-Indexes in the Infrared of Nitric-Acid Trihydrate Aerosols, Geophys. Res. Lett., 22, 2625–2628, 1995.
Salcedo, D., Molina, L. T., and Molina, M. J.: Homogeneous freezing of concentrated aqueous nitric acid solutions at polar stratospheric temperatures, J. Phys. Chem. A, 105, 1433–1439, 2001.
Schnaiter, M., Büttner, S., Möhler, O., Skrotzki, J., Vragel, M., and Wagner, R.: Influence of particle size and shape on the backscattering linear depolarisation ratio of small ice crystals – cloud chamber measurements in the context of contrail and cirrus microphysics, Atmos. Chem. Phys., 12, 10465–10484, https://doi.org/10.5194/acp-12-10465-2012, 2012.
Schnaiter, M., Järvinen, E., Vochezer, P., Abdelmonem, A., Wagner, R., Jourdan, O., Mioche, G., Shcherbakov, V. N., Schmitt, C. G., Tricoli, U., Ulanowski, Z., and Heymsfield, A. J.: Cloud chamber experiments on the origin of ice crystal complexity in cirrus clouds, Atmos. Chem. Phys., 16, 5091–5110, https://doi.org/10.5194/acp-16-5091-2016, 2016.
Schneider, J., Weigel, R., Klimach, T., Dragoneas, A., Appel, O., Hünig, A., Molleker, S., Köllner, F., Clemen, H.-C., Eppers, O., Hoppe, P., Hoor, P., Mahnke, C., Krämer, M., Rolf, C., Grooß, J.-U., Zahn, A., Obersteiner, F., Ravegnani, F., Ulanovsky, A., Schlager, H., Scheibe, M., Diskin, G. S., DiGangi, J. P., Nowak, J. B., Zöger, M., and Borrmann, S.: Aircraft-based observation of meteoric material in lower-stratospheric aerosol particles between 15 and 68° N, Atmos. Chem. Phys., 21, 989–1013, https://doi.org/10.5194/acp-21-989-2021, 2021.
Segal-Rosenheimer, M. and Linker, R.: Impact of the non-measured infrared spectral range of the imaginary refractive index on the derivation of the real refractive index using the Kramers-Kronig transform, J. Quant. Spectrosc. Ra., 110, 1147–1161, 2009.
Shettle, E. P. and Volz, F. E.: Optical constants for meteoric dust aerosol models, Atmospheric Aerosols: Their Optical Properties and Effects; a topical meeting on atmospheric aerosols sponsored by the Optical Society of America and NASA Langley Research Center, Williamsburg, VA, 13–15 December 1976, NASA Conference Publication CP 2004, 1976.
Spang, R. and Remedios, J. J.: Observations of a distinctive infra-red spectral feature in the atmospheric spectra of polar stratospheric clouds measured by the CRISTA instrument, Geophys. Res. Lett., 30, 1875, https://doi.org/10.1029/2003GL017231, 2003.
Stetzer, O., Möhler, O., Wagner, R., Benz, S., Saathoff, H., Bunz, H., and Indris, O.: Homogeneous nucleation rates of nitric acid dihydrate (NAD) at simulated stratospheric conditions – Part I: Experimental results, Atmos. Chem. Phys., 6, 3023–3033, https://doi.org/10.5194/acp-6-3023-2006, 2006.
Tisdale, R. T., Middlebrook, A. M., Prenni, A. J., and Tolbert, M. A.: Crystallization Kinetics of HNO3/H2O Films Representative of Polar Stratospheric Clouds, J. Phys. Chem. A, 101, 2112–2119, https://doi.org/10.1021/jp9624156, 1997.
Tisdale, R. T., Prenni, A. J., Iraci, L. T., Tolbert, M. A., and Toon, O. B.: Variation of the infrared spectra of nitric acid hydrates with formation conditions: Impact on PSC identification, Geophys. Res. Lett., 26, 707–710, 1999.
Tizek, H., Knözinger, E., and Grothe, H.: X-ray diffraction studies on nitric acid dihydrate, Phys. Chem. Chem. Phys., 4, 5128–5134, 2002.
Tizek, H., Knozinger, E., and Grothe, H.: Formation and phase distribution of nitric acid hydrates in the mole fraction range x(HNO3) <0.25: A combined XRD and IR study, Phys. Chem. Chem. Phys., 6, 972–979, 2004.
Toon, O. B., Tolbert, M. A., Koehler, B. G., Middlebrook, A. M., and Jordan, J.: Infrared optical constants of H2O ice, amorphous nitric acid solutions, and nitric acid hydrates, J. Geophys. Res.-Atmos., 99, 25631–25654, 1994.
Tritscher, I., Pitts, M. C., Poole, L. R., Alexander, S. P., Cairo, F., Chipperfield, M. P., Grooß, J.-U., Höpfner, M., Lambert, A., Luo, B., Molleker, S., Orr, A., Salawitch, R., Snels, M., Spang, R., Woiwode, W., and Peter, T.: Polar Stratospheric Clouds: Satellite Observations, Processes, and Role in Ozone Depletion, Rev. Geophys., 59, e2020RG000702, https://doi.org/10.1029/2020RG000702, 2021.
Ulanowski, Z., Kaye, P. H., Hirst, E., Greenaway, R. S., Cotton, R. J., Hesse, E., and Collier, C. T.: Incidence of rough and irregular atmospheric ice particles from Small Ice Detector 3 measurements, Atmos. Chem. Phys., 14, 1649–1662, https://doi.org/10.5194/acp-14-1649-2014, 2014.
Vochezer, P., Järvinen, E., Wagner, R., Kupiszewski, P., Leisner, T., and Schnaiter, M.: In situ characterization of mixed phase clouds using the Small Ice Detector and the Particle Phase Discriminator, Atmos. Meas. Tech., 9, 159–177, https://doi.org/10.5194/amt-9-159-2016, 2016.
Voigt, C., Schreiner, J., Kohlmann, A., Zink, P., Mauersberger, K., Larsen, N., Deshler, T., Kroger, C., Rosen, J., Adriani, A., Cairo, F., Di Donfrancesco, G., Viterbini, M., Ovarlez, J., Ovarlez, H., David, C., and Dornbrack, A.: Nitric acid trihydrate (NAT) in polar stratospheric clouds, Science, 290, 1756–1758, 2000.
Voigt, C., Schlager, H., Luo, B. P., Dörnbrack, A., Roiger, A., Stock, P., Curtius, J., Vössing, H., Borrmann, S., Davies, S., Konopka, P., Schiller, C., Shur, G., and Peter, T.: Nitric Acid Trihydrate (NAT) formation at low NAT supersaturation in Polar Stratospheric Clouds (PSCs), Atmos. Chem. Phys., 5, 1371–1380, https://doi.org/10.5194/acp-5-1371-2005, 2005.
Wagner, R., Möhler, O., Saathoff, H., Stetzer, O., and Schurath, U.: Infrared spectrum of nitric acid dihydrate – influence of particle shape, J. Phys. Chem. A, 109, 2572–2581, 2005a.
Wagner, R., Naumann, K. H., Mangold, A., Möhler, O., Saathoff, H., and Schurath, U.: Aerosol chamber study of optical constants and N2O5 uptake on supercooled H2SO4/H2O/HNO3 solution droplets at polar stratospheric cloud temperatures, J. Phys. Chem. A, 109, 8140–8148, 2005b.
Wagner, R., Benz, S., Möhler, O., Saathoff, H., and Schurath, U.: Probing ice clouds by broadband mid-infrared extinction spectroscopy: case studies from ice nucleation experiments in the AIDA aerosol and cloud chamber, Atmos. Chem. Phys., 6, 4775–4800, https://doi.org/10.5194/acp-6-4775-2006, 2006a.
Wagner, R., Bunz, H., Linke, C., Möhler, O., Naumann, K. H., Saathoff, H., Schnaiter, M., and Schurath, U.: Chamber Simulations of Cloud Chemistry: The AIDA Chamber, Proceedings of the NATO Advances Research Workshop on Environmental Simulation Chambers: Application to Atmospheric Chemical Processes, Zakopane, Poland, 1–4 October 2004, 67–82, https://doi.org/10.1007/1-4020-4232-9, 2006b.
Wagner, R., Benz, S., Bunz, H., Möhler, O., Saathoff, H., Schnaiter, M., Leisner, T., and Ebert, V.: Infrared Optical Constants of Highly Diluted Sulfuric Acid Solution Droplets at Cirrus Temperatures, J. Phys. Chem. A, 112, 11661–11676, 2008.
Wagner, R., Testa, B., Höpfner, M., Kiselev, A., Möhler, O., Saathoff, H., Ungermann, J., and Leisner, T.: High-resolution optical constants of crystalline ammonium nitrate for infrared remote sensing of the Asian Tropopause Aerosol Layer, Atmos. Meas. Tech., 14, 1977–1991, https://doi.org/10.5194/amt-14-1977-2021, 2021.
Wagner, R., James, A. D., Frankland, V. L., Möhler, O., Murray, B. J., Plane, J. M. C., Saathoff, H., Weigel, R., and Schnaiter, M.: Data set for the research article ”Particle shapes and infrared extinction spectra of nitric acid dihydrate crystals: Optical constants of the β-NAD modification” by Wagner et al. (2023) in Atmospheric Chemistry and Physics, KITopen [data set], https://doi.org/10.5445/IR/1000158540, 2023.
Weigel, R., Volk, C. M., Kandler, K., Hösen, E., Günther, G., Vogel, B., Grooß, J.-U., Khaykin, S., Belyaev, G. V., and Borrmann, S.: Enhancements of the refractory submicron aerosol fraction in the Arctic polar vortex: feature or exception?, Atmos. Chem. Phys., 14, 12319–12342, https://doi.org/10.5194/acp-14-12319-2014, 2014.
Weimer, M., Buchmüller, J., Hoffmann, L., Kirner, O., Luo, B., Ruhnke, R., Steiner, M., Tritscher, I., and Braesicke, P.: Mountain-wave-induced polar stratospheric clouds and their representation in the global chemistry model ICON-ART, Atmos. Chem. Phys., 21, 9515–9543, https://doi.org/10.5194/acp-21-9515-2021, 2021.
Weiss, F., Kubel, F., Gálvez, Ó., Hoelzel, M., Parker, S. F., Baloh, P., Iannarelli, R., Rossi, M. J., and Grothe, H.: Metastable Nitric Acid Trihydrate in Ice Clouds, Angew. Chem. Int. Edit., 55, 3276–3280, https://doi.org/10.1002/anie.201510841, 2016.
Woiwode, W., Grooß, J.-U., Oelhaf, H., Molleker, S., Borrmann, S., Ebersoldt, A., Frey, W., Gulde, T., Khaykin, S., Maucher, G., Piesch, C., and Orphal, J.: Denitrification by large NAT particles: the impact of reduced settling velocities and hints on particle characteristics, Atmos. Chem. Phys., 14, 11525–11544, https://doi.org/10.5194/acp-14-11525-2014, 2014.
Woiwode, W., Höpfner, M., Bi, L., Pitts, M. C., Poole, L. R., Oelhaf, H., Molleker, S., Borrmann, S., Klingebiel, M., Belyaev, G., Ebersoldt, A., Griessbach, S., Grooß, J.-U., Gulde, T., Krämer, M., Maucher, G., Piesch, C., Rolf, C., Sartorius, C., Spang, R., and Orphal, J.: Spectroscopic evidence of large aspherical β-NAT particles involved in denitrification in the December 2011 Arctic stratosphere, Atmos. Chem. Phys., 16, 9505–9532, https://doi.org/10.5194/acp-16-9505-2016, 2016.
Woiwode, W., Höpfner, M., Bi, L., Khosrawi, F., and Santee, M. L.: Vortex-Wide Detection of Large Aspherical NAT Particles in the Arctic Winter 2011/12 Stratosphere, Geophys. Res. Lett., 46, 13420–13429, https://doi.org/10.1029/2019GL084145, 2019.
Worsnop, D. R., Fox, L. E., Zahniser, M. S., and Wofsy, S. C.: Vapor-Pressures of Solid Hydrates of Nitric-Acid – Implications for Polar Stratospheric Clouds, Science, 259, 71–74, https://doi.org/10.1126/science.259.5091.71, 1993.
Zakharova, N. T. and Mishchenko, M. I.: Scattering properties of needlelike and platelike ice spheroids with moderate size parameters, Appl. Optics, 39, 5052–5057, 2000.
Zakharova, N. T. and Mishchenko, M. I.: Scattering by randomly oriented thin ice disks with moderate equivalent-sphere size parameters, J. Quant. Spectrosc. Ra., 70, 465–471, 2001.