Introduction
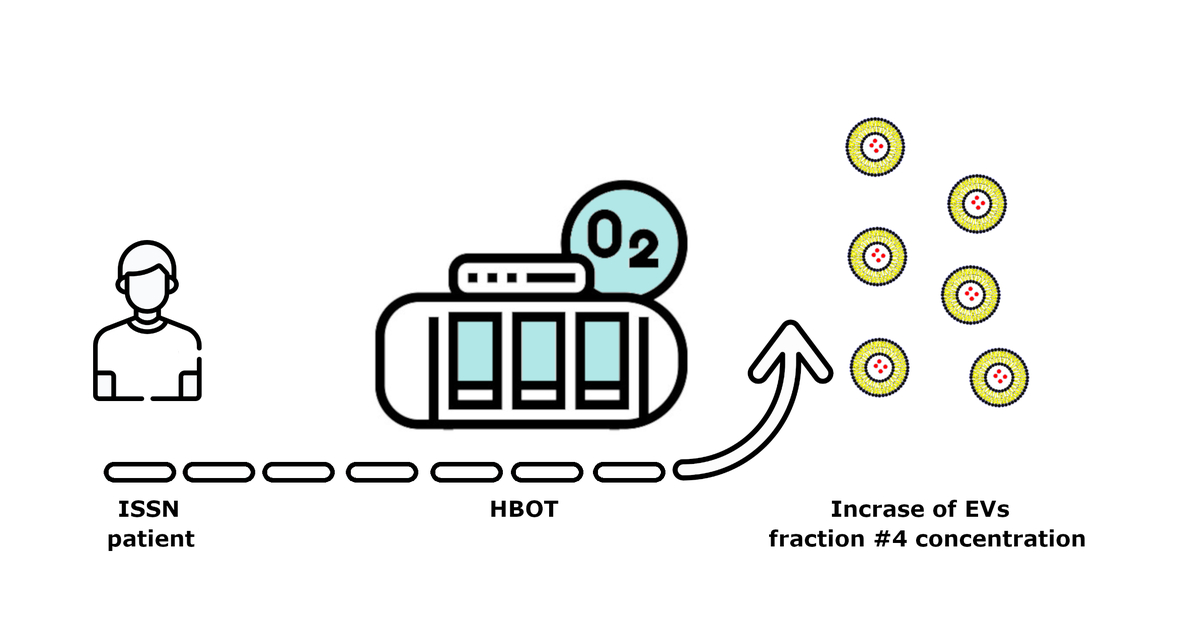
Hyperbaric oxygen therapy (HBOT) is a medical treatment that involves the inhalation of pure oxygen at a partial pressure exceeding the values achievable under atmospheric conditions. Therefore, patients undergoing HBOT are placed in a hyperbaric chamber and inhale oxygen through a specially constructed respiratory system [1]. In this setting, patients typically receive a series of treatments throughout consecutive days (20–40 days) and are exposed to pressures of up to 2.5 absolute atmosphere (2.5 ATA) [2]. HBOT was shown to be effective in the causative treatment of conditions such as decompression sickness, carbon monoxide poisoning and air embolism. It is also used as an adjunct therapy in the treatment of difficult-to-heal wounds, Fournier’s gangrene, and other necrotic soft tissue infections caused by anaerobic microorganisms and mixed flora [3].
The beneficial effects of hyperbaric oxygenation can be explained by various underlying mechanisms, which vary according to the patients’ disease condition: 1) direct tissue oxygenation through physical oxygen dissolution in plasma, 2) reduction of edema, 3) physical reduction of air bubbles, 4) stimulation of stem cells in the bone marrow, 5) alterations of gene expression levels, and 6) modification of cytokine release [4]. With regards to necrotic infections of soft tissues, reduction of local hypoxia and tissue edema and stimulation of angiogenesis are considered the main effects of hyperbaric oxygenation [5]. HBOT was shown to stimulate angiogenesis by affecting the release of vascular endothelial growth factor (VEGF) from several cell populations, including lymphocytes, macrophages or fibroblasts, all of which promote endothelial mitosis and increase vascular permeability [6]. It was shown in multiple tissues that HBOT can be used to induce angiogenesis and therefore increase tissue vascularization [7]. Other studies also suggest that HBOT can decrease hypoxic environments in inflamed tissues by increasing diffusion between capillaries and damaged cells [8]. HBOT has also been shown to be an effective therapy for reducing inflammation of damaged tissue in wounds through bacteriostatic and bactericidal effects, as well as for inducing the ability to activate neutrophils, suppressing bacteria-derived exotoxins, and reducing the release of multiple cytokines [9].
Both angiogenesis and inflammation are orchestrated by a variety of signaling pathways which rely on intercellular communication within the tissue environment and with distant sites. Recent research indicates that much of this communication is mediated by factors that are associated with the membrane or the lumen of extracellular vesicles (EVs) [10]. Especially small extracellular vesicles (sEVs), also called exosomes, the subset of EVs with diameters of 30 to 150 nm, have been found to participate in a variety of biological processes [11]. They are produced by all cells and are characterized by a distinct biogenesis, involving the origin from multivesicular bodies in the endocytic compartment and the subsequent release to the extracellular space [12]. Increased amounts of sEVs are released from cells during both inflammation and angiogenesis. Recent research in rat models has indicated the possibility of using macrophage-derived sEVs as novel therapeutics to inhibit inflammation and ameliorate wound healing [13]. Improved methods for isolation and characterization of sEVs have made it possible to assess their levels as a prognostic factor or an indicator of therapeutic efficacy. Some cancer studies [14–16] have demonstrated the significance of EVs in the development or inhibition of tumor growth. Anticancer potential has been reported in cytotoxicity towards cancer cells from activated by exosomes DCs [14]. On the other hand, DLBCL-derived exosomes can mediate tumor growth by macrophage polarization to M2 phenotypes [15]. These results take into account the importance of the tumor microenvironment, one of the main features of which is hypoxia [16], which then induces EV production in such conditions [10].
Nevertheless, reports assessing the effects of HBOT on the levels of circulating sEVs in humans are lacking. Most molecular studies on HBOT have been conducted in vitro using cell culture models such as human umbilical vein endothelial cells (HUVECs) or in vivo using a variety of animal models. Therefore, the current pilot study for the first time shows that HBOT can induce changes in circulating sEVs. Validating these data in a larger scale cohort and looking at the detailed composition of the sEV cargo will be our follow-up study.
The aim of this study was to quantify serum-derived sEVs in different groups of patients treated with HBOT, i.e., with an active infectious process, chronic aseptic inflammation, and those receiving high doses of steroids due to acute illness (sudden deafness). Therefore, we assume that HBOT therapy will have an influence on the levels of circulating sEVs.
Material and methods
Patients
A total of 92 patients from the Department of Hyperbaric Medicine, Military Institute of Medicine in Warsaw, receiving HBOT between June 2019 and January 2020, were included in the study. Twelve patients who did not complete their treatment according to the proposed protocol were excluded from the analysis. We analyzed samples from 80 patients undergoing HBOT for: 1) necrotizing soft-tissue infections (NSTI; group 1; n = 21), 2) idiopathic sudden sensory neural hearing loss (ISSNHL; group 2; n = 53), and 3) aseptic bone necrosis (ABN; group 3; n = 6). Patients from the three groups were compared to a cohort of normal controls (NCs; group 4; n = 18). NCs did not receive treatment with either HBOT or steroids.
Hyperbaric oxygen (HBOT) therapy and sample collection
All sessions were performed in a multiplace hyperbaric chamber under the direct supervision of medical personnel. The patients were exposed to 100% O2 at a pressure of 2.5 ATA for 60 min with two air breaks of 5 min each. The sessions lasted about 90 min, including compression and decompression. In group 1 (NSTI), the HBOT sessions were performed once daily with up to 30 sessions in total (depending on the patient’s condition); in groups 2 (ISSNHL) and 3 (ABN), the sessions were performed once daily with up to 15 and 60 sessions in total, respectively. Additional procedures, including local surgical debridement and antibiotic therapy in group 1 (NSTI) and steroid therapy in group 2 (ISSNHL), were performed in accordance with the orders of the attending physicians in the given medical wards. Antibiotic therapy in group 1 (NSTI) involved broad-spectrum treatment, followed by targeted treatment (after obtaining microbiological results). Steroid therapy in group 2 (ISSNHL) was continued for 7 days with down-titrated doses of dexamethasone. Patients in group 3 (ABN) did not receive any immunomodulatory drugs. Blood samples were collected before HBOT onset and after completion of all HBOT sessions under aseptic conditions from peripheral veins. After centrifugation, serum was frozen at –80°C until the assays were performed.
Isolation of small extracellular vesicles (sEVs)
sEVs were isolated from serum by size-exclusion chromatography (SEC) according to a previously described protocol [17]. Briefly, 500 μl of serum was diluted with 800 μl of phosphate buffered saline (PBS) and pre-cleared by centrifugation at room temperature (RT) for 10 min at 2,000 x g, at 4°C for 30 min at 10,000 x g, and filtration using a 0.22 μm bacterial filter (Millipore). An aliquot of 1 ml of pre-cleared serum was loaded on a SEC column and 1 ml fractions were eluted with PBS. Fraction #4 enriched in sEVs was collected and used for subsequent analysis.
Cryogenic electron microscopy (cryo-EM)
Images of sEVs were obtained from two samples, one from the test group after HBOT and the other from controls before HBOT. Fresh fraction #4 sEV samples were prepared from serum and small aliquots (3 μl) from each sample were prepared by concentration using Amicon Centrifugal Filters for 40 min at 4,000 x g at RT. Samples were applied to Quantifoil grids, blotted, and cryo-plunged. Cryo-electron micrographs were obtained using a 200 kV Glacios cryo-TEM microscope equipped with a Falcon 3EC direct detection camera at a magnification of 52,000×.
Western blot analysis
The presence of CD9 and TSG101, both considered sEV markers according to the MISEV2018 guidelines, in sEVs was confirmed by Western blot analyses [18]. First, fraction #4 obtained from each patient was concentrated with an Amicon Centrifugal Filter for 40 min at 4,000 x g at RT. Similarly to method previously reported [17, 19], the protein concentration was determined using a BCA Protein Assay Kit (Thermo Fisher) and Multiskan GO (Thermo Fisher Scientific). sEV preparations were then normalized for protein content (20 μl each), and 2 μl of RIPA buffer (Sigma-Aldrich) and protease inhibitor (2 μl) were added to each sample and incubated on ice for 20 min. Proteins were separated by non-reducing buffer (6 μl) for CD9 antibody and reducing buffer (5 μl) for TSG101 antibody, then boiled at 99°C for 10 min and cooled on ice for 5 min, loaded onto a 5–12% SDS-polyacrylamide gel gradient (SDS-PAGE), and separated with electrophoresis (Bio-Rad). Proteins were then transferred onto a polyvinylidene difluoride (PVDF) membrane (0.45 μm Millipore) using Bio-Rad semi-dry electrophoretic transfer. Next, the membranes were blocked in 5% non-fat dry milk in 1x Tris buffered saline with 0.5% Tween-20 (TBS-T) for 1 h at RT and then incubated overnight at 4°C with primary goat anti-CD9 (Thermo Fisher Scientific #10626D, 1 : 400) and rabbit anti-TSG101 (Abcam #ab228013, 1 : 400) antibodies. Membranes were then washed 3× with TBS-T for 5 min and incubated with respective secondary antibodies: goat anti-mouse IgG (Sigma-Aldrich #12-349, 1 : 1000) and goat anti-rabbit IgG (Abcam #ab205718, 1 : 1000) for 1 h and again washed 3x with TBS-T for 5 min. Next, protein bands were detected with SuperSignal West Femto and images were acquired using the Odyssey Fc Imaging System (Li-Cor).
Quantitative analysis of sEVs
Size distributions and concentrations of sEVs in fraction #4 samples were analyzed using ZetaView (Particle Matrix) [19]. For method optimization, varying concentrations of fraction #4 were loaded onto the machine, while the final number of particles in 1 ml of serum was calculated taking all the dilutions from the previous step into account.
Institutional Review Board Statement
The study was conducted according to the guidelines of the Declaration of Helsinki and approved by the Bioethical Commission of the Military Medical Institute (#28; June 19, 2019 to J.S. and #AKBE/86/2018 to P.M.).
Statistical analysis
The R programming language was used for data analysis, using lme4, multcomp and dplyr libraries in RStudio v1.4 [20]. Differences in the number of sEVs before and after HBOT were assessed by a mixed-design analysis of variance, in which the intergroup (diagnosis) and intragroup (measurement) effects were analyzed. A regression analysis was performed in the model considering the interaction effect (diagnosis * therapy) and random effects to check whether HBOT changes the quantities of sEVs. Post hoc analysis with Tukey’s test was performed to verify the significance of differences between pairs of variables. The significance level was established at p < 0.05.
Results
Characteristics of the patient cohort
The size of the groups by diagnosis and gender is presented in Table I. Patients diagnosed with idiopathic sudden sensory neural hearing loss (group 2: ISSNHL, n = 53) and patients with necrotizing soft tissue infection (group 1: NSTI, n = 21) were the larger groups, while patients with aseptic bone necrosis (group 3: ABN, n = 6) constituted the smallest group. The median number of sessions for all patients was 30 (15–60) and varied depending on the diagnosis. Patients with ABN (median = 60) had the highest number of sessions, whereas patients with ISSNHL (median = 15 (15–30) had the lowest number of sessions. The median number of sessions was 15 (15–30) in patients with NSTI.
Table I
Number of patients, mean age, mean BMI, and median number of sessions by diagnosis and gender
Characterization of sEVs
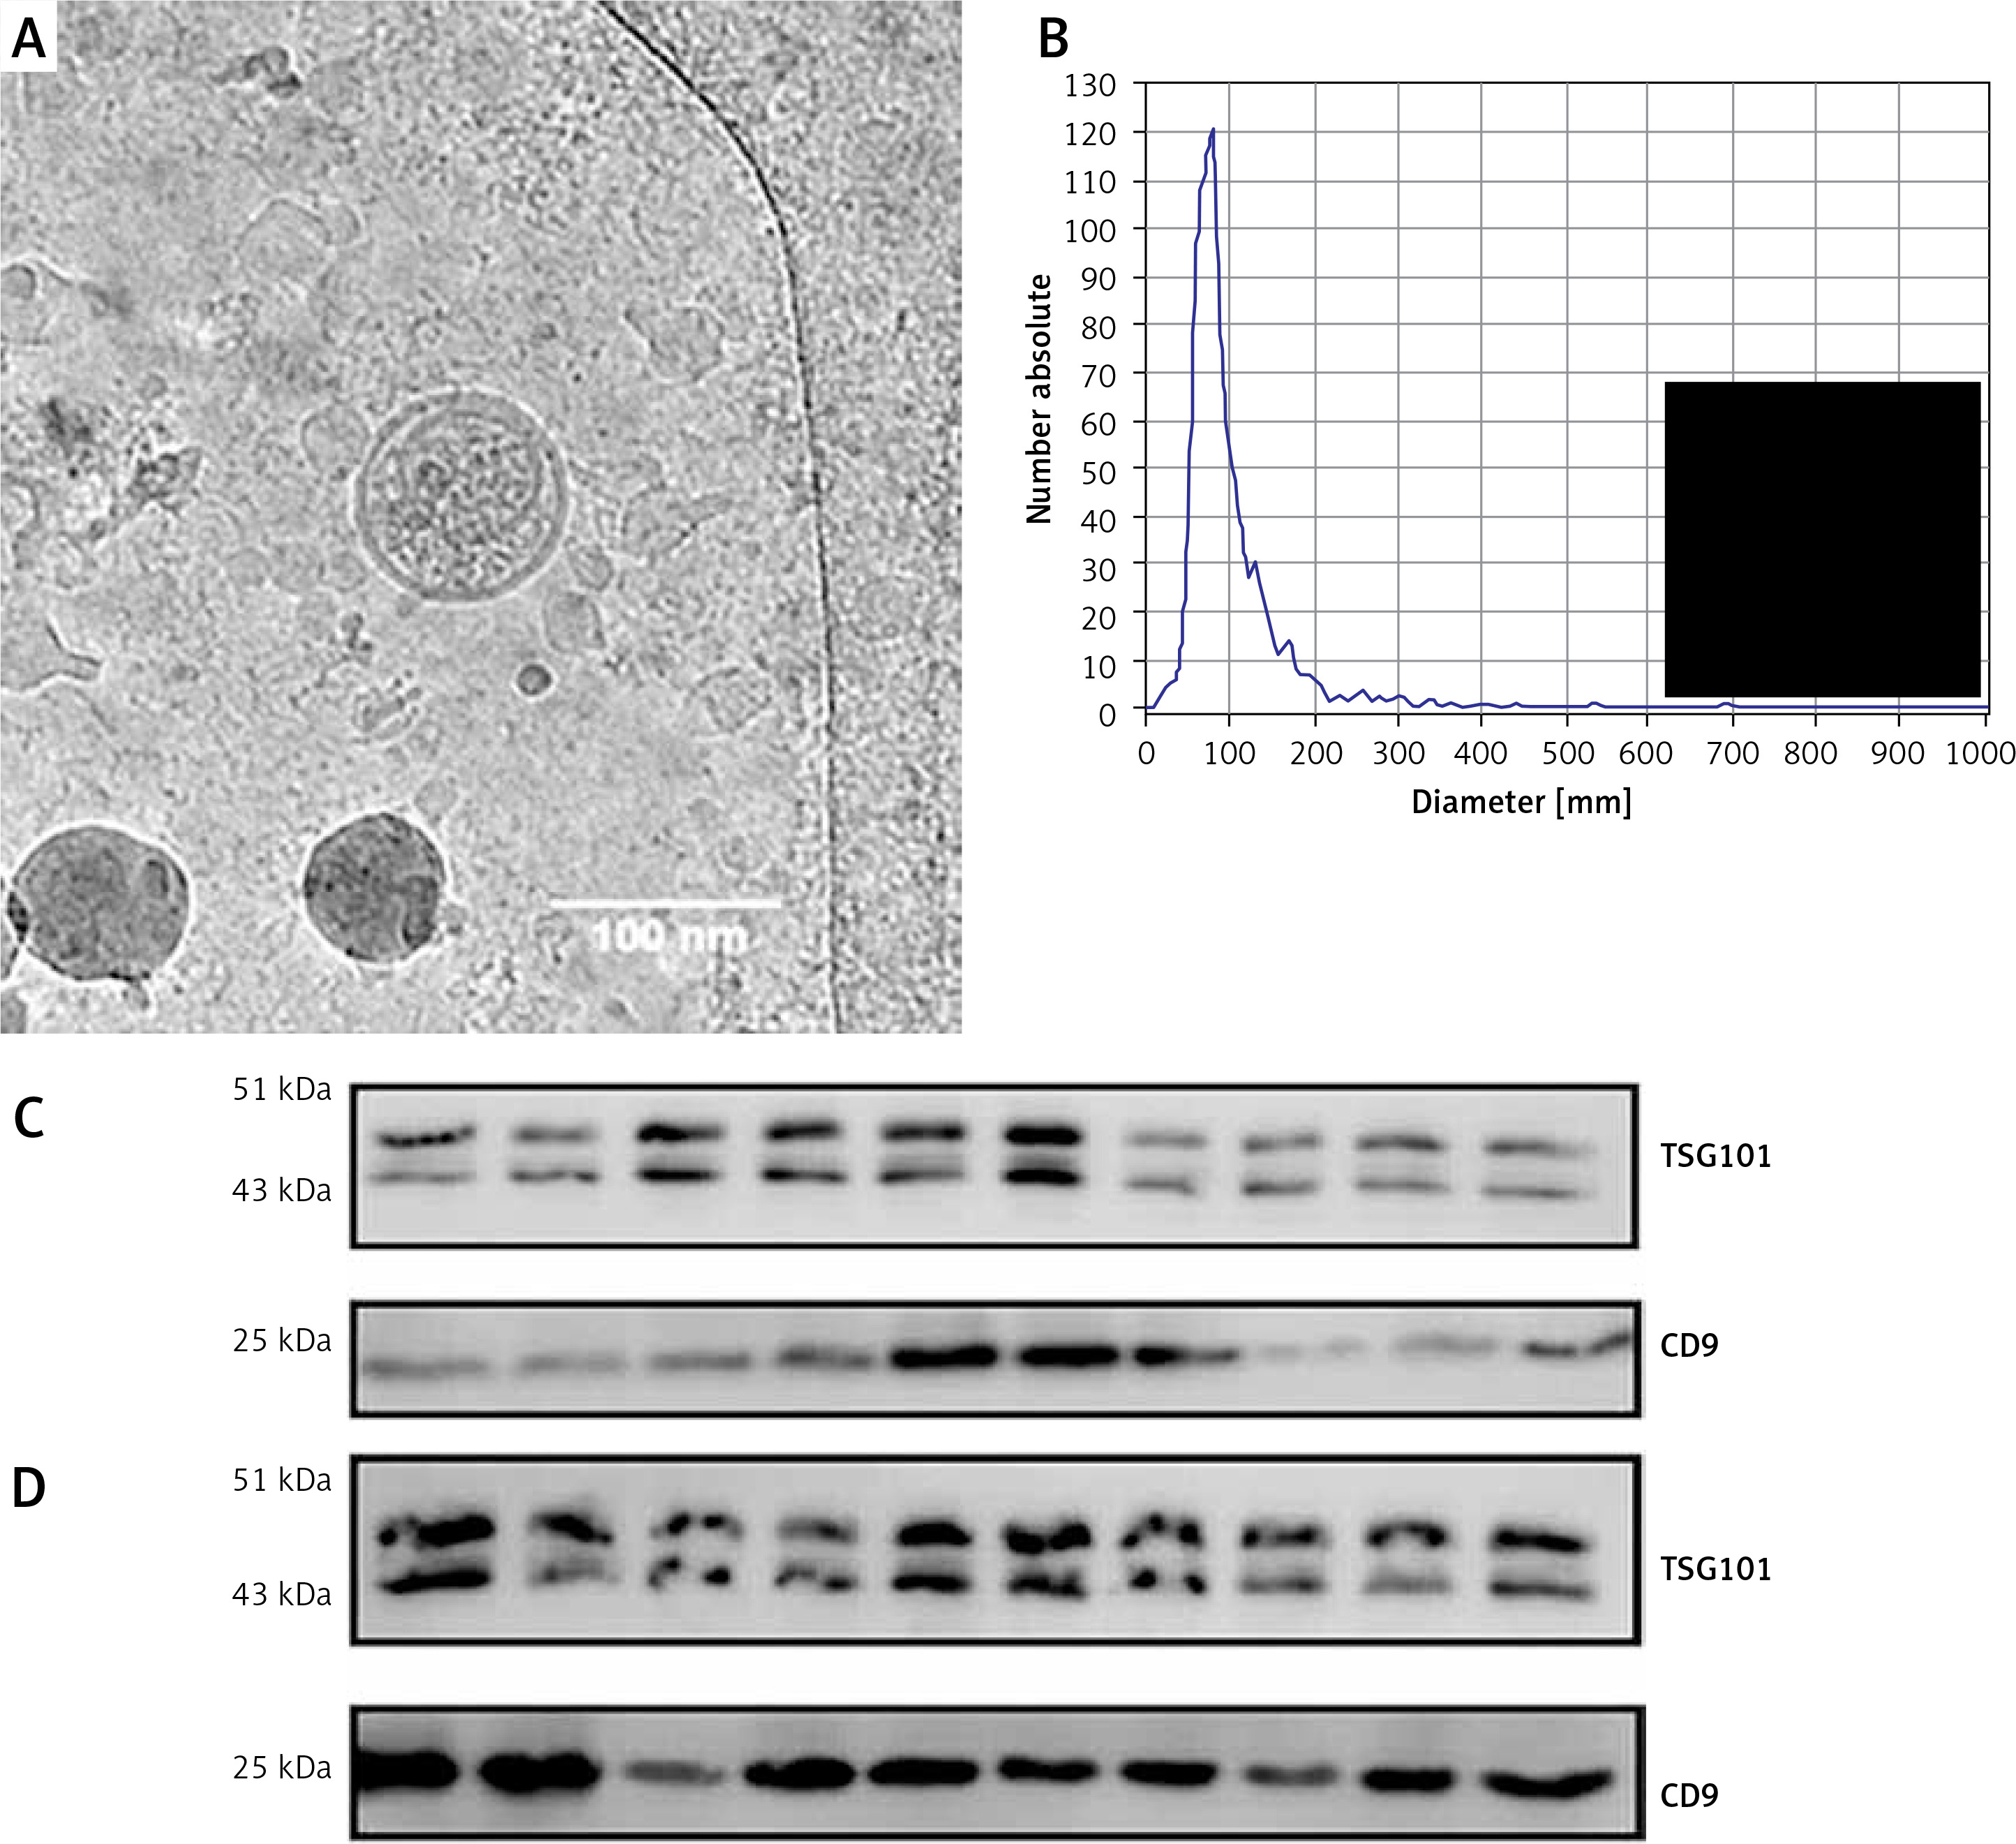
sEVs were isolated using a SEC-based protocol and as previously described by us. The isolated EVs in fraction #4 met the criteria established for sEVs [14, 15]. Characterization of sEVs was performed in 20 randomly selected samples. Specifically, fraction #4 sEVs showed the typical size and vesicular morphology as visualized by cryo-EM (Figure 1 A). Analysis of size distribution by ZetaView revealed sizes in the range of 30 to 150 nm in diameter (Figure 1 B). Western blot analysis confirmed the presence of the sEV markers TSG101 and CD9 (Figures 1 C and D).
Figure 1
Characterization of sEVs. A – Representative cryo-EM image of fraction #4 serum-derived sEVs. Note the double-membrane sEVs with a size of approximately 100 nm. B – Representative nanoparticle tracking analysis size distribution plot of fraction #4 serum-derived sEVs. C – Western blot results for TSG101 and CD9 in serum-derived sEVs isolated from 10 patients of the NSTI group. D – Western blot results for TSG101 and CD9 in serum-derived sEVs isolated from 10 patients of the ISSNHL group
Quantification of sEVs
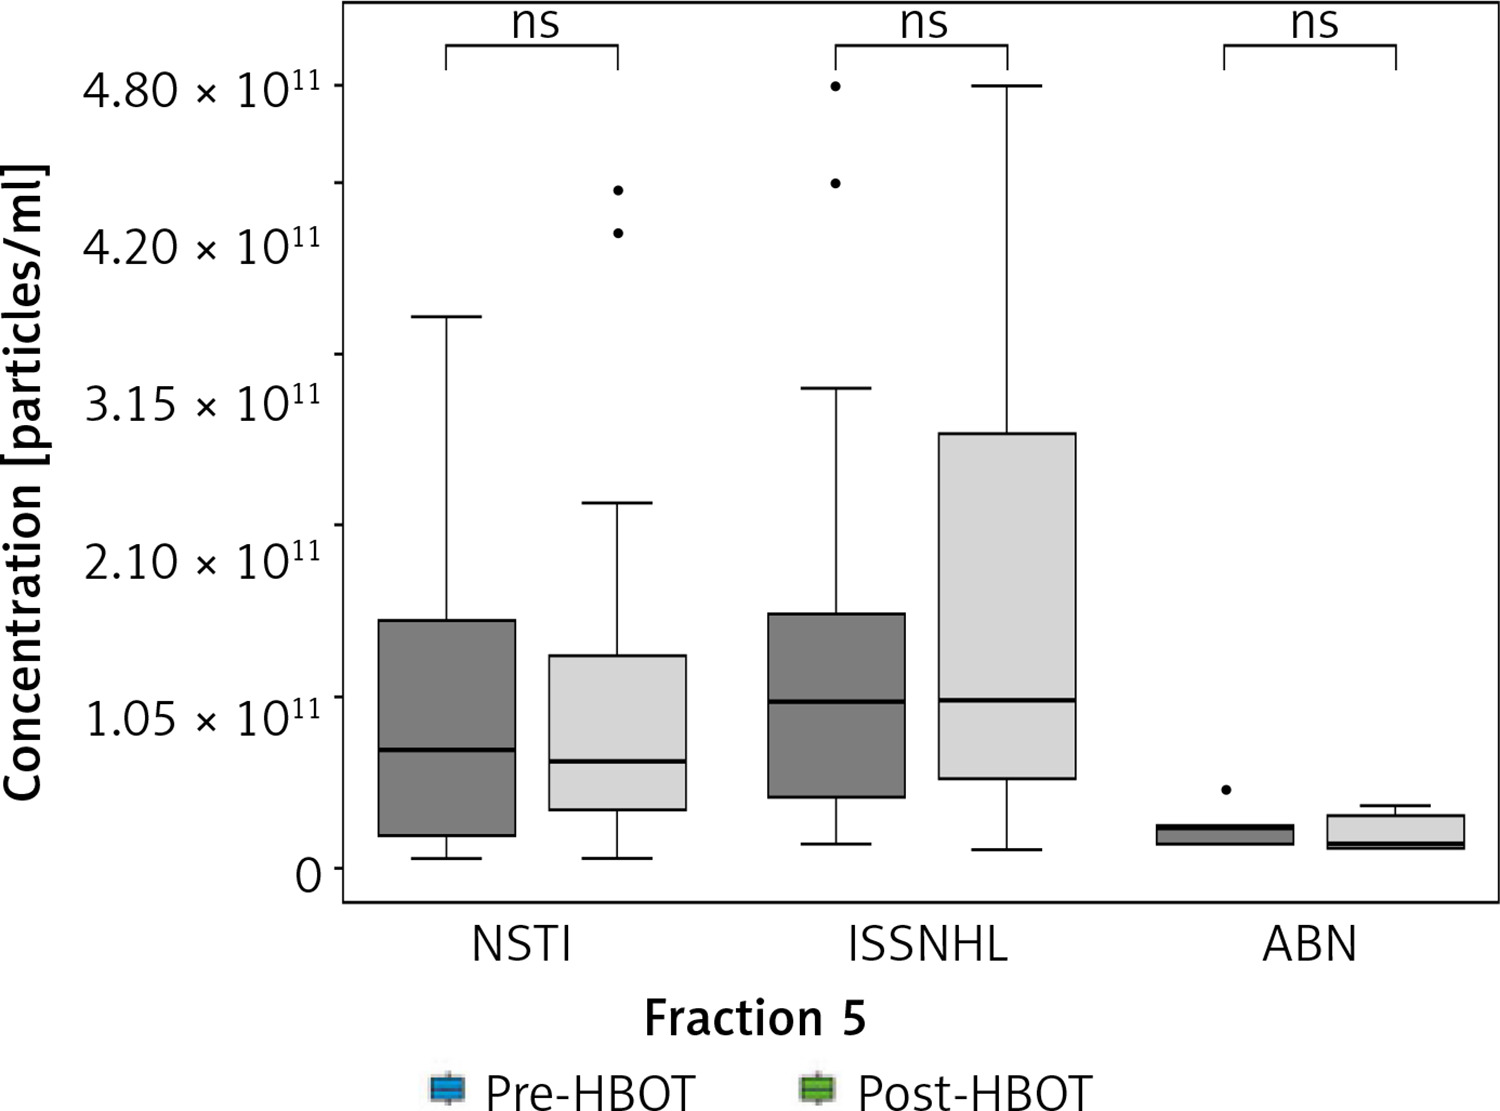
Nanoparticle tracking analysis was used to quantify sEVs in fraction #4 samples of patients undergoing HBOT and was performed before and after HBOT. This analysis revealed statistically significant main effects of the analyzed groups (F (5.156) = 6.605; p < 0.0001). The results of post hoc analysis are presented in Figure 2. When comparing the levels of circulating sEVs in patients with ISSNHL (group 2) before and after HBOT, a significant increase after HBOT was observed (46% increase; p < 0.05). Moreover, 38 of the total 53 patients showed increased levels of circulating sEVs after HBOT, whereas only 15 patients showed a decrease in sEV levels (Figure 2). For validation of these results, the same analysis was performed in fraction #5 samples of patients undergoing HBOT. In fraction #5, the amount of co-isolated proteins was increased; therefore, the analysis was less specific for sEVs. In fraction #5 samples, no significant pre- and post-HBOT differences were detected (Figure 3).
Figure 2
Inter- and intra-group comparisons of fraction #4 sEVs isolated from the serum of patients undergoing HBOT. Fraction #4 sEVs were quantified using nanoparticle tracking analysis. No significant differences were observed when comparing the basal levels of circulating sEVs from each group before HBOT
NSTI – necrotizing soft-tissue infections, ISSNHL – idiopathic sudden sensory neural hearing loss, ABN – aseptic bone necrosis, NC – normal control, ns – no significant difference, *p < 0.05, **p < 0.01, ***p < 0.001.
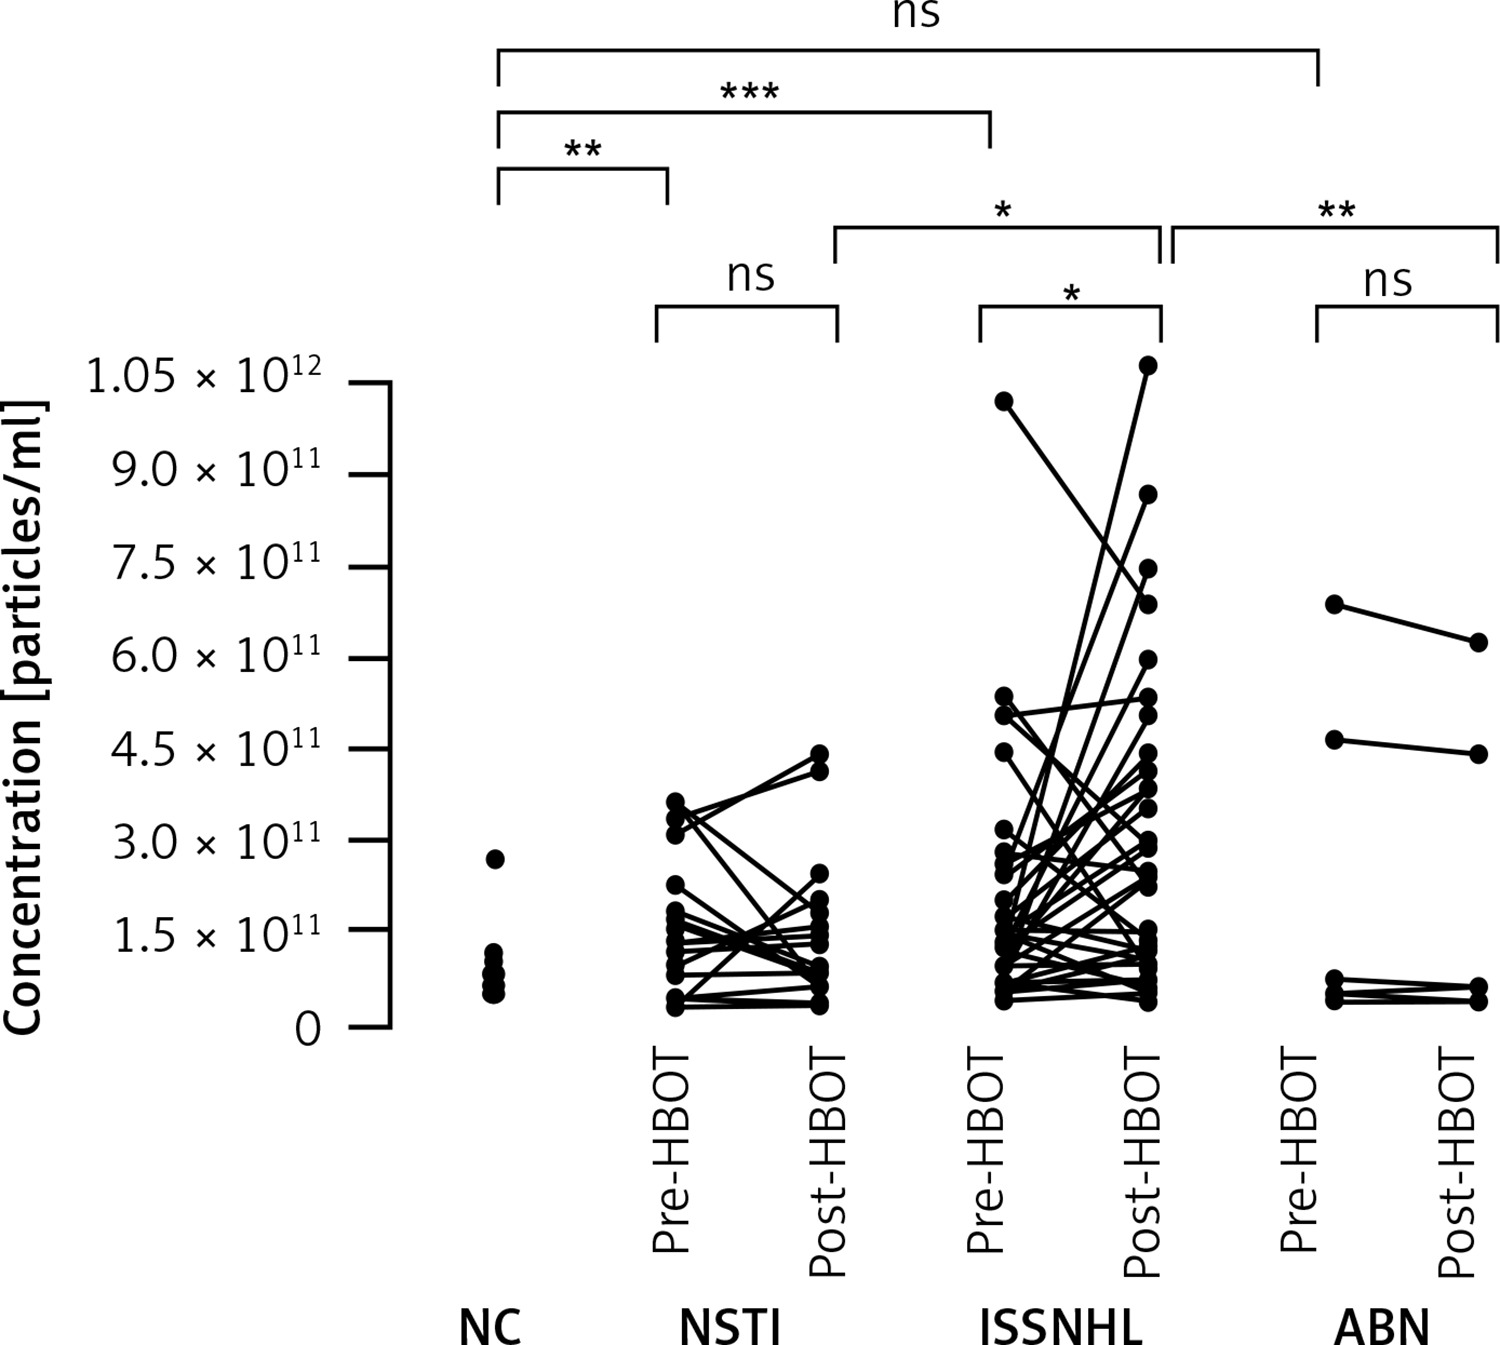
Figure 3
Inter- and intra-group comparisons of fraction #5 sEVs isolated from the serum of patients undergoing HBOT. Fraction #5 sEVs were quantified using nanoparticle tracking analysis. No significant differences were observed for groups
NSTI – necrotizing soft-tissue infections, ISSNHL – idiopathic sudden sensory neural hearing loss, ABN – aseptic bone necrosis, ns – no significant difference.
The comparison between the groups revealed significant differences in the levels of circulating sEVs after HBOT in patients with ISSNHL compared to patients with NSTI (117% more in ISSNHL; p < 0.05) and compared to patients with ABN (922% more in ISSNHL; p < 0.01). No significant differences of circulating sEVs were observed in patients with NSTI and ABN before and after HBOT (Figure 2). These findings were validated with a regression analysis considering the interaction effect (diagnosis*therapy) and random effects to assess the impact of HBOT on the levels of circulating sEVs. We obtained statistically significant results for patients with ISSNHL (Table II). Also, basal levels of circulating sEVs from each group of patients before HBOT were compared and no significant differences were observed (Figure 2).
Table II
Results of regression analysis considering the random effects to assess the impact of HBOT on the levels of circulating sEVs
| Predictor | Estimate | SE | t | P-value |
|---|---|---|---|---|
| Intercept | 25.207 | 0.209 | 120.334 | < 0.0001 |
| HBOT | 0.366 | 0.120 | 3.046 | < 0.01 |
| Diagnosis (Group 1–3)* | 0.252 | 0.274 | 0.921 | 0.359 |
| Group 1: NSTI x HBOT | 0.109 | 0.154 | 0.707 | 0.4796 |
| Group 2: ISSNHL x HBOT | 0.529 | 0.127 | 4.182 | < 0.0001 |
| Group 3: ABN x HBOT | -0.391 | 0.234 | –1.675 | 0.0939 |
However, when comparing the levels of circulating sEVs in NCs with the basal levels in each group of patients before HBOT, patients with NSTI and ISSNHL had significantly higher levels of circulating sEVs (p < 0.01 and p < 0.001, respectively). Similar levels of circulating sEVs were observed when comparing NCs with ABN patients (Figure 2).
Discussion
The number of scientific publications describing the biological functions and possible therapeutic use of sEVs has been exponentially increasing in recent years. sEVs are considered to contribute to intercellular communication by interaction with both distant cells and those in the immediate vicinity. They have been reported to mediate a variety of biological processes including immune responses [21], signal transductions [22], antigen presentation [23], angiogenesis, and endothelial function [24–26]. The wide range of sEV functions in cell biology can be explained by the complex cargo composition, which includes a wide variety of molecules, including proteins [27], lipids [21], and nucleic acids [28, 29]. The amount of secreted sEVs highly depends on environmental conditions and is often stimulated in pathologic states such as infections or sepsis [30, 31]. Since sEVs can be secreted by all cells in the body, including reticulocytes [32], B cells [33], dendritic cells [34], platelets [35], cardiomyocytes [36], endothelial cells, and stem cells [37], the circulating sEVs in the bloodstream are heterogenous in terms of their cellular origins. This heterogeneity is also reflected in a variety of biological functions, such as modification of tissue regeneration [38] and wound healing [39, 40]. Some sEVs have been designated specific functions, such as macrophage-derived sEVs, which have been demonstrated to play an important role in modulating inflammation [41, 42]. However, our findings are supported by the results of other studies. A study with application of normoxic and hypoxic conditions found no effect of the conditions on particle concentration, apart from healthy subjects in normoxic conditions, in whom a statistically significant increase in the number of EVs was detected [43]. In another study with healthy individuals and patients with idiopathic inflammatory myopathies, the healthy people had on average a lower concentration of EVs than the patients [44] (Table III).
Table III
Results of basic statistics for sEVs #4 concentration in each condition and each group
In our study, we assessed the levels of serum-derived sEVs in patients before and after treatment with cyclically administered doses of hyperbaric oxygen. The selection of study groups allowed for comparison of patients with infectious tissue necrosis, sterile bone necrosis, and patients with no tissue necrosis, who were treated with HBOT for ISSNHL. It should be noted that aseptic bone necrosis in the ABN group consisted of small necrotic lesions located in the proximal and distal epiphyses of the femur. It can be presumed that the low baseline levels of sEVs in this group reflect a relatively low local severity of the necrotic process without activation of a systemic inflammatory process. This is emphasized by the similar levels of circulating sEVs in patients with ABN before HBOT and NCs. Significantly elevated serum levels of sEVs were observed only in the group with ISSNHL. None of the necrotic processes treated with HBOT, neither sterile nor the one caused by extensive infection, were associated with a statistically significant increase in the serum levels of sEVs. Severe necrotizing infections of soft tissues are associated with a significant increase in intercellular communication related to immune responses as well as apoptotic and repair processes.
Consequently, these diseases are accompanied by an increased presence of signaling molecules, which are released into the bloodstream either as soluble factors or encapsulated in sEVs. This effect was not observed under conditions of tissue hyperoxia cyclically induced by hyperbaric oxygenation with oxygen partial pressure of more than 2,000 mm Hg in the respiratory mixture, and the treatment had no effect on the increase or reduction of the number of circulating sEVs in the serum. The increase in sEV levels only in the group of patients treated for ISSNHL can be attributed to systemic corticosteroid therapy received by the patients within 7 days of the diagnosis. It has to be noted that the patients with ISSNHL and NSTI had elevated levels of circulating sEVs before the HBOT when compared to healthy donors. This can be attributed to either the disease condition or the systemic treatment which they received prior to HBOT. Also, the interaction between steroids and hyperbaric oxygen remains an open question, although the concomitant use of steroids and hyperbaric oxygen in ISSNHL is clinically documented as effective [45]. The observed increase in the levels of sEVs may be evidence for both the intended reduction of inflammation as a result of steroid therapy and the inhibitory effect of oxidative stress induced by HBOT. At present, publications to resolve these doubts are lacking.
One limitation of the study is the methodological approach to quantify sEVs. According to the MISEV2018 guidelines the quantification of sEVs remains difficult, especially when sEVs are isolated from a complex biofluid such as human serum [18]. Since all isolation methods for sEVs result in some extent of co-isolated impurities, it is possible that the nanoparticle tracking analysis (NTA) measurements count additional particles besides sEVs, such as lipoproteins. The MISEV guidelines report that absolute EV sizing and counting methods are currently imperfect and will require further improvement, aided by appropriate EV reference standards that are now in development. To overcome this problem, the guidelines suggest combining a general characterization and a single-particle characterization (we combined western blotting and NTA, respectively) [44]. Although NTA is widely used to quantify sEVs [18], future studies are necessary to validate our findings. However, we believe that this pilot study provides the first insights into the HBOT-mediated alterations of circulating sEVs.
Other limitations of this observational pilot study are the high heterogeneity of the compared groups, the steroid therapy and antibiotics among selected groups, and the lack of a control group in the form of patients who did not undergo HBOT. HBOT is the standard care in all examined disease entities; therefore, a lack of treatment for a selected group of patients would not be approved by the bioethics committee. This pilot study is the first report demonstrating alterations of circulating sEVs in patients treated with HBOT. Future studies will be necessary to carefully explore the qualitative changes in cells exposed to hyperoxic oxygen partial pressures and analyze the sEV-associated cargo components. Another aim will be to investigate whether the increase in circulating sEVs also translates into distinct biological functions.
In conclusion, the release of sEVs depends on a variety of factors, such as the disease entity, environmental conditions, and presence of therapeutics. Surprisingly, a significant increase in the levels of circulating sEVs was observed in patients with ISSNHL who received concomitant treatment with systemic steroid therapy and HBOT. Such an increase was not observed in HBOT-treated patients with systemic inflammation caused by NSTI or in the case of ABN, which is not accompanied by stimulation of systemic reactions. Qualitative research on the composition of cargo carried by sEVs may uncover a potential functional role of circulating sEVs in ISSNHL patients in future studies.