Nutritional and Safety Evaluation of Local Weight-Gain Formulas in the Kingdom of Saudi Arabia (KSA) Markets ()
1. Introduction
Underweight and obesity are associated with an increased risk of mortality compared with people of a healthy weight [1] . Underweight is typically defined as a body mass index (BMI) < 18.5 kg/m2 [2] . Underweight may also be defined as 15% to 20% lower than the standard weight for a person’s age and height [3] . Malnutrition or underweight is increasingly recognized as a significant contributor to the global burden of diseases [4] -[6] . The majority of underweight women of reproductive age (15 - 44 y) are in lowand middle-income countries. In most low-income countries, the rates of maternal malnutrition range from 10% to 19% and >20% of women in those regions have BMI < 18.5 kg/m2 [5] .
The percentage of underweight adults in the Kingdom of Saudi Arabia (KSA) reached 2.5% [7] . Chronic energy deficiency due to an inadequate food intake may be the cause of malnutrition in adults [2] [8] .
Formulas containing herbal remedies are commonly used to prevent disease and promote health [9] . Many of these formulas are marketed irrespective of strict rules, sales conditions, and advertisement control for them [10] . Moreover, contamination with metals or adulteration with synthetic drugs has been reported in some prepared formulas [11] . Therefore, users of these formulas remedies are at risk of toxicity and adverse reactions related to the formula ingredients. Al-Faris et al. [12] in a cross-sectional survey conducted in Riyadh region reported that 68% of the responding residents had used alternative remedies in the KSA. Prednisolone and Betamethasone are members of the corticosteroid drugs, which are similar to the hormone cortisol, produced by the human. They are used in therapy for some diseases which can cause several side effects such as gain in weight [13] . Bogusz et al. [11] found eight remedies marketed in the KSA for weight gain contained synthetic drugs. In addition, AlMajed et al. [14] reported that the local prepared formulas for gaining weight in the KSA contained factors that enhance or inhibit appetite and may adversely affect the nervous system. Nuts are an integral part of the Mediterranean food pattern (MFP) which includes a substantial intake of fat up to 35% to 40% of total energy intake [15] . An association was noticed between nut consumption and an increase in serum lipid and Lipoprotein profiles. An increase in consumption of this energy-dense, high-fat food will lead to excessive weight gain [16] . Moghat (Grlossostemonbruguieri) is an Egyptian plant of nutritional and medicinal value. The plant powder is used in Egypt as tonic, nutritive ingredient to increase body weight. The effect of both plant powder and its alcoholic extract proved to be non-toxic up to 2500 mg/kg body weight in the experimental mice [17] . Fenugreek seed has been long used as a herbal medicine to treat various pathological conditions. These seeds have glucose and lipid-lowering properties. Also antioxidant properties have been observed in animal studies [18] [19] . In addition, Rguibi and Belahsen [20] reported that fenugreek-based preparations are used in humans to stimulate appetite and promote weight gain.
In Saudi Arabia, local weight gain formulas are increasingly used. However, many of these formulas may be contaminated by microbes, trace elements or alternative remedies. Therefore, the aim of this study was to investigate the effect of local prepared formulas used for gaining weight, and their safety and efficacy in case of long-term consumption, using experimental animals.
2. Materials and Methods
2.1. Materials
2.1.1. The Local Prepared Formulas
Three prepared formulas were purchased from the local market at the Riyadh city in the KSA.
1) Formula (1): named Mokasrat Moshaklah contained peanuts, cashews, hazelnuts and sesame seeds (w/w).
2) Formula (2): named Mosamanah contained moghat (Lossostemonbruguieri) spermaceti, royal jelly and honey (w/w).
3) Formula (3): named mofatgah contained fenugreek (Trigonellafoenum-graecuml) spermaceti, royal jelly and honey (w/w).
These formulas were selected for this study based on the information of their popularity in local markets for gaining weight.
The formulas were dried in an oven air drier according to the method described in AOAC [21] . The dried formulas were milled into powder then packed in polyethylene bags and kept at 4˚C until used.
2.2. Methods
2.2.1. Chemical Analysis
Proximate chemical analysis of the prepared formulas: moisture, protein, crude fiber, fat and ash contents were determined according to the method of AOAC (2005). Total carbohydrate was calculated by difference.
Calorific value of the formulas was calculated by using the factors as described by FAO/WHO/UNU [22] according to the following equation:

2.2.2. Determination of Minerals
formulas were ached at 500˚C. Calcium and iron were determined by using Atomic Absorption, Spectrometry (AA6800, Shimadzu Instruments-7102 River Wood Drive Columbia MD, 21046, USA). Phosphorous was determined using atomic absorption spectrometry (AAS-6650, Shimadzu, Japan) according to AOAC method number 991025 [21] .
2.2.3. Determination of Vitamins
Thiamine HCL, riboflavin, nicotinamide and pyridoxine were determined according to AOAC [21] by using high-performance liquid chromatography (HPLC) (Class VP 5, Shimadzu Instruments 7102).
2.2.4. Determination of Heavy Metals
The content of cadmium mercury, arsenic and lead were determined according to the method described in AOAC [21] by using Shimadzu AA-6800 atomic absorption spectrophotometer, Shimadzu Instruments-7102 with a graphite and flame auto switchover mode, an ASC 6100 auto sampler, and an HVGI hydride generator.
2.2.5. Prednisolone and Betamethasone Determination
They determined according to the method of Chan et al. [23] by using the HPLC system comprised of Shimadzu LC-10ADVP.
2.2.6. Microbiological Examination
For determination of the total viable aerobic count a serial dilution of the pre-treated products was prepared using a buffered sodium chloride peptone solution to obtain an expected bacterial colony count of not more than 300 and fewer than 100 colonies of fungi. The total bacterial and fungal counts were determined using the standard plate-count method, performed according to the procedures described in the WHO/PHARM [24] with plate count agar and Sabouraud agar, respectively. After the specified period of incubation, the colonies grown in the culture plates were counted using the colony counter equipment. For the total count of aerobic bacteria, only the plates showing 5 - 300 colonies were counted while the Sabouraud plates were counted for the total viable count of fungi after 3, 4, and 5 days of incubation. After 5 days, the plates containing fewer than 100 colonies were retained for counting.
2.2.7. Animal-Based Toxicity Studies
Toxicity studies were conducted using 40 male albino rats (6 - 7 weeks old), with a mean weight of 316 ± 5 grams and mean fasting glucose < 145 mg/dl from the Animal House, Central Laboratory for Drug and Food Analysis Ministry of Health, Riyadh, Saudi Arabia. Ethical clearance in relation to the use of these animals was also granted by the ethical review board of Central Laboratory for Drug and Food Analysis in Saudi Arabia.
The animals were maintained under standard conditions of humidity, temperature, and light (12 h dark/12 h light). Food was prepared according to the American Institute of Nutrition (AIN) guidelines [25] . The feed was stored at 5˚C based on recommendations from the WHO scientific group [26] and Mossberg and Hayes [27] .
A ninety day chronic toxicity test was conducted to assess the effects of long-term low-dose exposure to the selected formulas on the target organs in addition to the physiological and metabolic tolerance to the formulas. The parameters included in the study were based on standard toxicological screening program [23] and [27] .
2.2.8. Control and Experimental Diets
The rats were randomly divided and assigned to the control group diet or 1 to 3 formulas treatment groups diets (10 male rats in each group). Table 1 provides the composition of the control and experimental diets. The tested formulas was ground and mixed with other ingredients (Source AIN), so that the feed contained 15% carbohydrates according to formulas regulatory guidelines in case of the selection of the dose for long-term treatment

Table 1 . Constituents of control and experimental diets (g/100g).
1) Mokasarat Moshakalah, 2) Mosamanah, and 3) Mofatgah formulas.
with minimal toxicity [27] . The dose was monitored throughout the study because body weight and water intake increased over time.
2.2.9. Determination of Body and Organ Weights
The changes in body weight were determined by weighing the animals on a balance seals (kern. 822, KERN & SOHN GmbH, Ziegelei, 1.72336 Balingen—Germany) prior to the experiment and after 90 days, following it. At the end of the experiment the organs (heart, lungs, kidneys, spleen, liver, and testes) were removed and washed with saline solution and dried using filter paper then weighted using the same balance. Relative organs weights were calculated according to the following equation:

2.2.10. Oral Glucose Tolerance Test (OGTT)
An oral glucose tolerance test was performed after overnight fasting. An oral glucose solution (1.75 g/kg body weight) was given to the rats, and blood glucose was measured at 1, 2 and 3 h after glucose administration. The test was repeated weekly starting from the end of the first week, and the average of the readings was recorded.
2.2.11. Hematological and Biochemical Analyses
The hematological profile included white blood cell count (WBC), red blood cell count (RBC), hemoglobin, haematocrit (HCT), and mean corpuscular volume (Mcv). Biochemical assays for liver function, kidney function, and lipid profile were also conducted. These analyses were performed prior to and following rat feeding experiment.
Blood was collected at the end of the experiment and the serum was separated and stored at −20˚C. The serum samples were later analyzed for glucose levels [28] , liver function (Alanine Aminotransferase (ALT/GPT; [29] )) and aspartate aminotransferase (AST/GOT; [30] ), kidney function (urea [31] and creatinine [32] ), lipid profile (total cholesterol, triglycerieds [33] and (HDL) [34] and (LDL) [35] ). The parameters were analysed by an enzymatic colorimetric methods using test combination reagents (Boehringer Mannheim GmbH, Diagnostica, Ingelheim and Rhein, Germany). The measurements were carried out using a spectrophotometer (Introspect 11 [LKB], Mississauga, ON, Canada).
2.2.12. Statistical Analyses
Statistical analyses were performed using SPSS version16 (SPSS Inc., Chicago USA). For evaluation of the results obtained during the chronic toxicity studies: t-test and Chi-square tests were used to assess the differences between means of the control group and each of the experimental groups.
3. Results and Discussion
3.1. Chemical Composition
Data in Table 2 showed that the contents of fat, protein, fiber and ash were higher in formula (1) than those in both formula (2) and (3). This could be ascribed to that formula (1) contained nuts. In this respect, Mattes and Dreher [36] indicated that nuts are rich source of fat (up to 70%) and protein (10 - 25 g/100g), and good sources of dietary fiber as well as unsaturated fats. On the other hand, formula (2) contained the highest content of carbohydrate (81.49%) followed by formula (3) (77.85%) while formula (1) recorded the lowest value (20.36%).
The high carbohydrates content in formulas 2 and 3 could be attributed to the presence of honey, fenugreek or moghat which are rich in carbohydrates. In this respect National Nutrition Institute [37] reported that the contents of carbohydrates of both honey and fenugreek were 80.3 and 55.2 (g/100g fresh wt) respectively. Also, Doaa et al. [38] found that moghat contained 24% starch, 5% pectin and 3% sugar.
The highest calorific content in formula (1) (715.91 kcal) reflects the high amount of fat in the nuts. Data showed that each 100 g of the three formulas (1), (2) and (3) provided about 35.8%, 17.5% and 17.8%, respectively of daily energy requirement for adult women (2000 Kcal). In this respect, Sabate and Wien [39] reported that, nuts are an energy dense food as they contain between 44% to 76% total fat by weight.
Regarding Ca and Fe content, it could noticed from Table 2 that the formula (1) contained higher amounts of Ca & Fe (22.35 and 52.00 mg, respectively), than those of the other formulas (9.89, 10.67 and 17.00, 30.00 mg for Ca and Fe, respectively). The high Ca and Fe content in formula (1) could be attributed to that peanut and sesame have high amounts of both Ca and Fe. As mentioned in the Egyptian food composition tables by National Nutrition Institute [37] .
In terms of vitamins, formulas (3) had a similar amount of thiamine to formula (1) while formula (2) recorded lower thiamine content than other formula. Unfortunately, the chemical analysis found that none of the three tested formulas contained nicotinamide, pyridoxine or riboflavin. This may be ascribed to the equipment sensitivity. Also, the chemical analysis revealed that none of the three local formulas contained chemicals that cause abnormal weight gain such as betamethasone or prednisolone. In addition, none of these formulas have heavy metals such as lead, mercury, arsenic or cadmium.
3.2. Microbiological Examination of Local Formulas
With regard to the microbiological aspects of the local prepared formulas, data presented in Table 3 showed that the formula (1) had lower total viable count of fungi than that in formulas (2) and (3) (>100 for each). Concerning microbial counts, the same table revealed that formulas (1) and (3) had >300 meanwhile, in formula (2) was <10. It could be concluded that bacterial contamination was noticed in formula (1) and (3), while fungal contamination was detected in formulas (2) and (3). Therefore, formula (3) was the more contaminated one in comparison with the others. This contamination could be attributed to either ingredients contained in the formulas or to the high moisture content which may gives a chance for microbial growth especially during preparation, handling, packaging and storage period because these formulas were produced locally and may be under uncontrolled sanitary conditions.
In this respect, Levy [40] reported techniques to reduce bacterial contamination when handling formulas and include appropriate infection control practices.
3.3. Body Gain of Rats Fed Local Prepared Formulas
Results in Table 4 revealed that the tested formulas recorded an increase in rat bodies weight compared to the control group. The highest final body weight was noticed in group (G3) although its mean daily food intake was lower (36.3 g) in comparison with those of the other rat groups. It could be noticed that feeding rats on formula (2) (containing moghat) increased the body weight, this could be due to the high amount of available carbohydrate (81.49%). No significant differences in food intake between the control group and each of the experimental groups were noticed. However, there were significant differences in body weight changes among the three tested rat groups and the control group. Concerning body weight gain, it could be observed that the rat groups (2, 3 and 4) recorded highest body gain compared to the control group. Meanwhile, there were slightly changes in body gain among the three tested rat groups. This may be ascribed to the quality and the quantity of the tested formulas, in addition, the local formulas have high calorific value as mentioned in Table2 These findings are
Table 2 . Chemical composition of local formulas (g/100g) on fresh wt.
*Total carbohydrates calculated by difference.
Table 3. Microbiological examination of local formulas in KSA (CFU/g−1)*.
Formula (1): Mokasrat; formula (2): Mosamanah; and formula (3): Mofatgah; *CFU: Colony Forming Unit.
Table 4. Mean (±standard deviation) values of daily feed intake and body gain of rats fed local prepared formulas.
G1: rats fed control diet; G2: rats fed formula (1); G3: rats fed formula (2); and G4: rats fed formula (3); *: P < 0.05 (T test).
comparable to the results obtained by Bes-Rastrollo et al. [16] who indicated that nut consumption was positively associated with higher values of total fat intake and higher values of total energy intake which lead to gain weight. Also, Rguibi and Belahsen [20] reported that fenugreek-based preparations are used in humans to stimulate appetite and promote weight gain.
3.4. The Relative Organs Weight (%) of Rats Fed the Tested Local Formulas
Data in Table 5 showed that the control group recorded highest mean value of relative organs weight except for the kidney compared to those in the three tested rat groups (G2, G3 and G4). Similar mean values of relative organs weight (heart, liver, spleen, kidney, lung and testes) for the rat groups (G2, G3 and G4) were showed in Table5 No significant differences were noticed among the control group (G1) and the three tested rat groups (G2, G3 and G4) with regard to the mean value of organs weight and relative organs weight. It could be concluded that the ingredients present in the formulas had no deterioration effect because most of them (nuts, honey, moghat, royal jelly and fenugreek), have beneficial effects such as acting as antioxidants.
In this concern, Sabate and Wien [39] indicated that nuts have a unique fatty acid profile, an important contributing factor to the beneficial health effects of nut consumption. For example cardio protective nutrients found in nuts include vegetable protein, fiber, vitamins, mineral, and other phytochemicals.
Table 5. Mean value of organs weight (g) and the relative organs weight (%) of rats fed the local formulas.
G1: rats fed control diet; G2: rats fed formula (1); G3: rats fed formula (2); and G4: rats fed formula (3); P < 0.05 (T test).
3.5. Effect of Local Formulas Intake on Hematological Parameters
The effect of local formulas intake on hematological parameters is shown in Table6 The experimental groups G2 and G4 exhibited significant increases in WBC and HCT compared to the rat control group (G1). However, rat group (G3) showed no significant changes in these parameters as in G2 and G4.
Data showed a remarkable increase in the WBC and HCT levels in groups G2 and G4 which fed formulas diet 1 or 3. It could be cleared that the local prepared formulas (1) and (3) had positive effect upon the WBC and HCT in rat serum. Body increases WBC production in order to eradicate pathogenic bacteria, and HCT levels also increase in response to a bacterial infection. These changes in WBC and HCT levels in case of formulas (1) and (3) (Table 3) unique features of these formulas. On the other hand, the local formulas have no effect upon the rest of hematological parameters in rats (Table 6).
3.6. Effect of Local Prepared Formulas on Urea Creatinine, AST and ALT in Tested Rat’s Serum
The results in Table 7 show that the urea levels did not change upon feeding rats on the local tested formula diets. Also rat serum creatinine did not show any significant change in comparison with the control group (G1).
The serum levels of AST and ALT could be taken as indicators of liver function or activity. There are no significant differences among rat groups (Cr2, Cr3 and G4) concerning AST and ALT enzymes concentration and control group (G1). This could be attributed to good quality of ingredients used in tested formulas. In this respect, Sabate and Wien [39] indicated that nuts as hazelnuts and peanut are excellent natural sources of antioxidant, vitamins, minerals as well as nuts contained many bioactive constituents.
Figure 1 illustrated the blood sugar levels during oral glucose tolerance test (OGTT) of rat groups fed on local formulas and the control group at 1, 2 and 3 h. Formulas (2) and (3) have high glucose level and contained honey, which are rich in fructose a simple sugar that has been implicated in the development of type 2 diabetes. These results are involved with findings by Teff et al. [41] . The blood sugar levels increased in the rat groups (G3 and G4) in which these formulas (2) and (3) were consumed. These groups also had significantly higher fasting blood glucose levels (245.29 ± 2.60 mg/dl and 226.75 ± 2.27 mg/dl, respectively) compared to the control group (145.29 ± 2.60 mg/dl). However, the rat group G2 showed a decrease in blood glucose at 3 h fed on formula (1) which may be explained by the short-term effect of fenugreek. In this respect, Gupta et al. [42] and Chevassus et al. [43] reported that fenugreek seed have glucose and lipid-lowering properties. In addition, Baquer et al. [44] also showed that the action of fenugreek in lowering blood glucose levels is almost comparable to the effect of insulin.
The results of the experimental animals (Figure 2) demonstrated an increase in the values of serum total cholesterol and LDL-cholesterol levels. However, a decrease in HDL-cholesterol level was found in the rat group (G2) fed formula (1) contained nuts, peanut and sesame seeds that are good sources for unsaturated fatty acids
Table 6 . Effect of local formulas intake on the hematological parameters of tested rats (mean ± standard deviation).
G1: rats fed control diet, G2: rats fed formula (1), G3: rats fed formula (2) and G4: rats fed formula (3). WBC: white blood cell count, RBC: red blood cell count, Hb: hemoglobin, MCV: mean corpuscular volume and HCT: haematocrit volume. *P < 0.05 (T test).
Table 7. Urea, creatinine levels, AST and ALT enzymes in serum of rats fed local formulas.
G1: rats fed control diet, G2: rats fed formula (1), G3: rats fed formula (2) and G4: rats fed formula (3). *U/L: unit per liter, AST: aspartate aminotransferase, ALT: alanine aminotransferase.
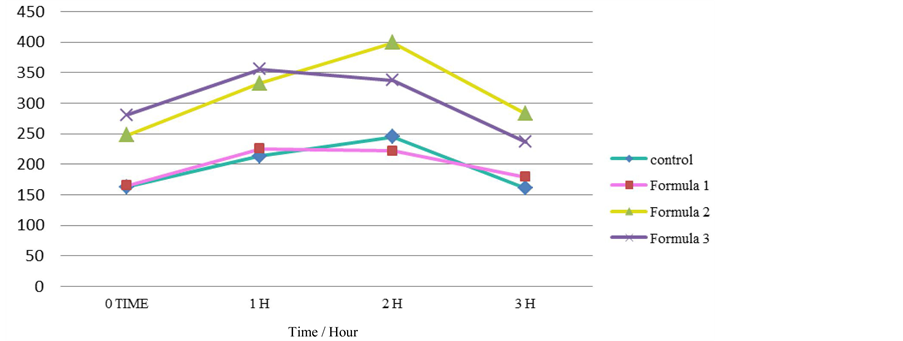
Figure 1. Effect of local formulas on oral glucose tolerance test (OGTT) of rat groups.
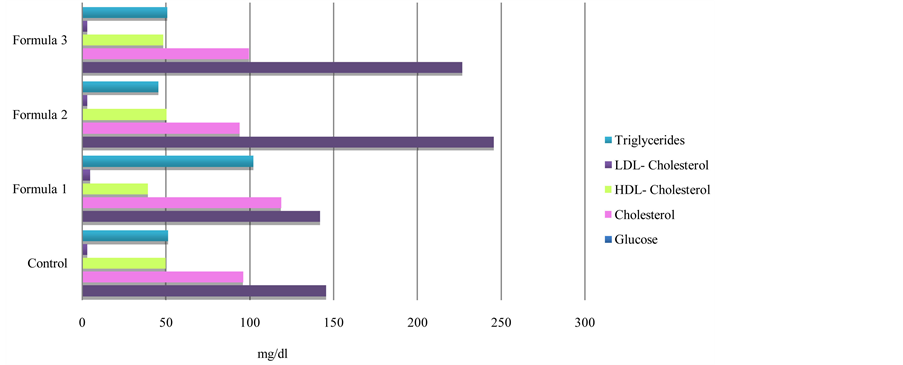
Figure 2. Effect of local formulas on blood glucose and lipid profile of rat groups.
which are beneficial for human being. Unsaturated fatty acids may be affected by the oxidation which may be attributed to the bad handling or storage of this formula (1). The rat groups (G3 and G4) fed formula diets (2 and 3). Containing simple sugars (as honey) showed greater increases in blood glucose than the control and group G2. The blood tests indicated significantly greater increase in the levels of total cholesterol, LDL-cholesterol and triglycerides, a significantly greater decrease in HDL-cholesterol level in the rat group (G2) compared to the control one. These results are in the accordance with those obtained by Ibrahim et al. [45] and Bocarsly et al. [46] . Also, Ostos et al. [47] , and Teff et al. [41] indicated that meals rich in fructose not only play a role in weight gain, but also increase triglyceride and cholesterol levels in experimental animals.
4. Conclusion
This work may be considered as the first in studying the nutritional, contamination levels and biological safety evaluation of selected local prepared formulas in Saudi Arabia. It can be concluded that all formulas have high energy dense composition, which causes weight gain for under-weight individuals, and the weight gain in tested rats assured these results. Although glucose levels increased with formulas (2) and (3) consumptions, the lipid profile did not change significantly. Moreover, the findings indicate that these formulas marketed for weight gain in the KSA may not be safe and further studies are required to understand the consequences of long-term ingestion of these formulas.
Acknowledgements
The author thanks King Abdul-Aziz City for Science and Technology (KACST), Riyadh, the KSA, for the financial assistance provided to conduct this research, as part of the research project (M-S 13-23).