Research Article - (2018) Volume 8, Issue 5
Indentification of Novel Biomarkers for Paroxysmal Non- Kinesigenic Dyskinesia Diagnosis Via Cerebrospinal Fluid and Plasma Proteomic Analysis
- Corresponding Author:
- Shuli Liang MD, PhD
Department of Neurosurgery, First Affiliated Hospital of PLA General Hospital , No. 51, Fucheng Road, Beijing 100048, China
Tel: 0086-10-68989063
Abstract
Purpose
Paroxysmal non-kinesigenic dyskinesia (PNKD) is a rare autosomal dominant movement disorder characterized by spontaneous attacks. The purpose of this study was to find and analyze the differentially expressed proteins between PNKD patients and their healthy family members with matched age and gender, thus providing potential biomarkers for early diagnosis of patients with PNKD.
Methods
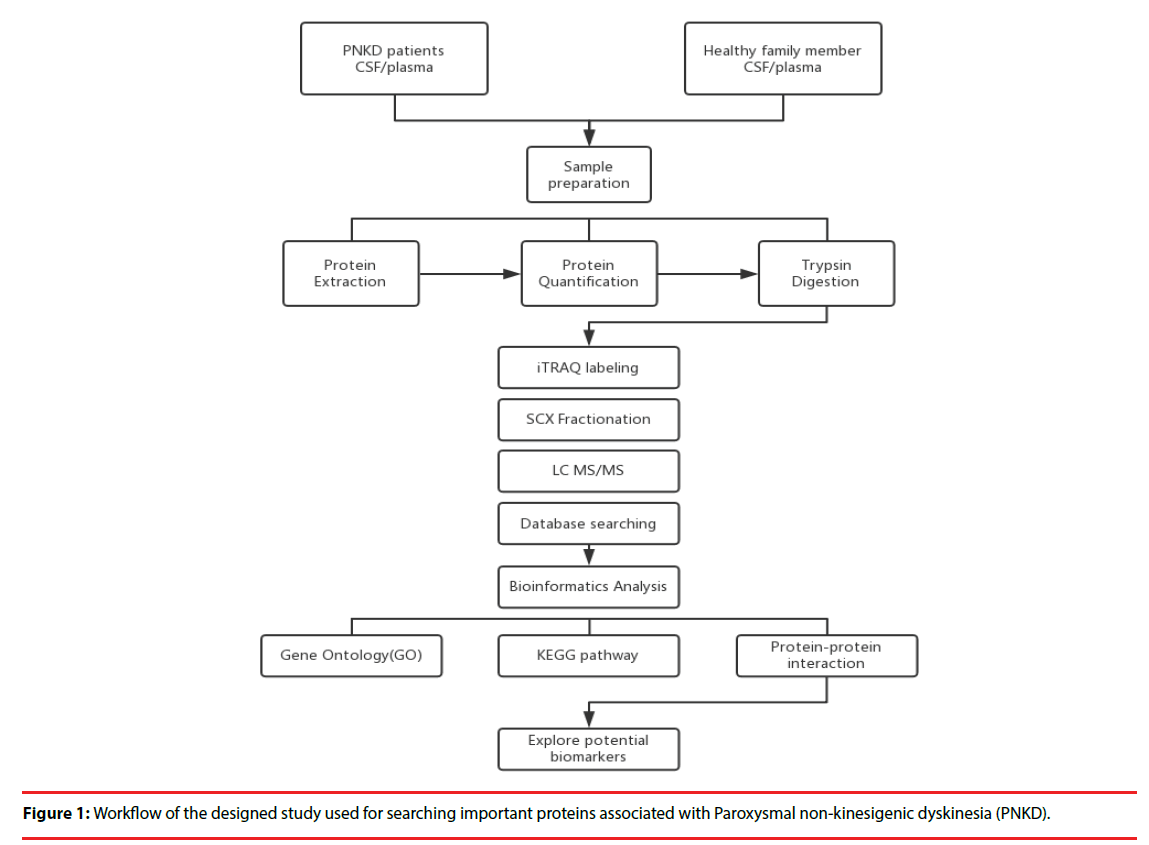
Four PNKD patients and four healthy family members were selected. Isobaric tags for relative and absolute quantitation (iTRAQ) coupled with LC-MS/MS were used to identify the differential proteins obtained from CSF and plasma of PNDK patients and healthy family members. Bioinformatic analyses of differential proteins were performed included Gene Ontology (GO) enrichment, pathway enrichment and protein-protein interaction network analysis.
Results
A total of 1242 and 512 unique proteins were identified in CSF and plasma respectively. The numbers of proteins that were differentially expressed between PNKD patients and their healthy family members were 42 in CSF and 57 in plasma respectively. Proteins that were differentially expressed were further analyzed based on bioinformatics. Two differentially expressed proteins in the CSF, CALML5 and PDGFA, and one in the plasma, ACTB, showed close links with the PNKD protein in the protein–protein interaction network.
Conclusion
CALML5 and PDGFA in the CSF and ACTB in the plasma may take part in PNKD pathogenesis and act as the potential biomarkers for PNKD diagnosis.
Keywords
Paroxysmal non-kinesigenic dyskinesia (PNKD), Isobaric tags for relative and absolute quantitation (iTRAQ), Bioinformatics analysis, Protein–protein interaction network
Abbreviations
CALML5: Calmodulin-Like 5; CSF: Cerebro- Spinal Fluid; GO: Gene Ontology; iTRAQ: Isobaric Tags For Relative And Absolute Quantitation; KEEG: Kyoto Encyclopedia Of Genes And Genomes; MAPK3: Mitogen-Activated Protein Kinase 3; MR- 1: Myofibrillogenesis Regulator 1; PDGFA: Platelet-Derived Growth Factor Subunit A; PNKD: Paroxysmal Non-Kinesigenic Dyskinesia; PPI: Protein–Protein Interaction
Introduction
Paroxysmal non-kinesigenic dyskinesia (PNKD) is a kind of the familial paroxysmal dyskinesias which are a group of hyperkinetic movement disorders [1]. It was first reported by Mount and Reback in 1940 that PNKD is an autosomal dominant disorder with high penetrance [2]. PNKD is characterized by intermittent attacks with any combination of dystonia, chorea, athetosis or ballismus, which can be precipitated by stress, fatigue, coffee, alcohol and menstruation [1-5]. The disease is associated with single amino acid changes (A7V, A9V or A33P) in myofibrillogenesis regulator 1 (MR-1) on chromosome 2q35 which is the causative gene of PNKD [6-10]. We have previously reported the first large Chinese PNKD pedigree, and found a novel mutation of A7V on exon 1 of the PNKD/ MR-1 gene [11].
Cerebrospinal fluid (CSF) reflects the ongoing biochemical changes occurring in the central nervous system, thus providing a potential source of biomarkers of neurodegenerative diseases such as Alzheimer’s disease and progressive supranuclear palsy [12,13].
As PNKD is a rare neurological disorder characterized by paroxysmal movement disorders, CSF might also act as an ideal source for screening and identifying novel PNKDrelated biomarkers. However, the collection of CSF is an invasive process. In this case, plasma, which contains thousands of proteins available for potential biomarker evaluation, offers a promising alternative choice for PNKD biomarker screening [12].
Proteomic technologies have been largely used to search for differentially expressed proteins, in order to clarify the diagnosis and prognosis of diseases such as tumor and neurodegenerative disorders [14-16]. Isobaric tags for relative and absolute quantitation (iTRAQ) technique is one of the most widely used approaches because it can simultaneously analyze 8 different specimens, thus increasing throughput while reducing experimental error [17-19]. In this study, we used iTRAQ labeling followed by 2D-LC-MS/ MS for the quantitative proteomic analysis of the CSF and plasma samples from PNKD patients and their healthy family members to discover potential effective biomarkers for PNKD diagnosis.
Materials and Methods
▪ Recruitment of Subjects:
Four patients with PNKD from previously reported Chinese family and four healthy family members were enrolled in 2015. Each patient was matched with a healthy family member of the same gender and the age gap of 0-3 years (Figure 1).
▪ Sample Preparation:
All plasma and CSF samples were obtained at 10 o’clock in the morning after 12 hours’ fasting. Each sample was obtained within 30 minutes and centrifuged at 2,000 rpm for 10 minutes at 4℃. The supernatants were transferred into Eppendorf tubes and stored at -80℃.
▪ Protein extraction, quantitation and digestion:
500 μl SDT lysates were added to each sample and homogenized, before being placed in a boiling water bath and undergoing ultrasonic lysis. The samples were then centrifuged, and the supernatant was collected and proteins with a molecular weight cutoff of 3 kD were extracted by ultrafiltration. After elution, the protein content of each subgroup was quantified with a BCA Kit (Thermo Scientific™). One hundred mictoliters of the processed protein were taken out of each sample solution and then the protein was digested with Trypsin Gold (Promega, Madison, WI, USA) at a ratio of protein : trypsin = 100 : 1 at 37ºC for 12 hours.
▪ iTRAQ labeling and SCX Fractionation
80 μg of samples in each group were labeled according to the manufacturer’s instructions (AB Company: iTRAQ Reagent-8plex Multiplex Kit, AB SCIEX). Briefly, one unit of iTRAQ reagent (defined as the amount of reagent required for the labeling of 40 μg of protein) was thawed and reconstituted in 24 μl isopropanol. Peptides were labeled with 113 to 119, and 121 iTRAQ tags by incubation at room temperature for 2 hours. The resulting labeled peptide samples were then pooled together, dried up and then, the mixtures were fractionated by SCX (strong cation exchange) separation.
▪ LC-MS/MS analysis
After separation by SCX chromatography, equal amounts of digested protein were loaded into a 10-cm analytical C18 column packed in-house, and then washed with solvent A (0.5% FA / H2O), solvent B (0.5% FA / ACN), the peptides were eluted with a gradient 150 min at 300 nl/ min flow rate. MS/MS was carried out with a Q-Exactive mass spectrometer (Thermo Finnigan, USA) setting in data-dependent mode with the previously reported ion scanning parameters [14]. Fragmented peptide masses were set in dynamic exclusion for 120 seconds and singly charged ions were excluded from MS/MS analysis.
▪ Database Search
The resulting MS/MS spectra were searched against the Ensembl database Homo sapiens, IWGSC1.0 + popseq 28 with Proteome Discoverer 1.4 software (version 1.4.0.288, Thermo Fisher Scientific). Retrieval of peptides and spectrogram matching (PSM) was filtered with the Percolator algorithm and FDR<0.01.. Retrieving peptides were merged into protein using the maximum parsimony principle.
▪ GO Enrichment Analysis
The Gene Ontology (GO) database (http://www.geneontology.org) was used to classify and group the differentially expressed proteins with a 1.5- fold change according to Fisher’s exact test. The Parent-Child-Intersection method was used for enrichment analysis, and Benjamini-Hochberg was used for multiple test correction. Curated association (i.e., all evidence codes except IEA, ND, and NR) was used for enrichment analysis.
▪ Pathway enrichment analysis:
Pathway analysis was used to determine the significant pathways of the differential proteins according to the Kyoto Encyclopedia of Genes and Genomes (KEGG) databases. Fisher’s exact test was performed to select the significant pathway, and the threshold of significance was p < 0.05.
▪ Protein-protein interaction network:
Hypergeometric distribution was used in order to calculate pathway enrichment, and FDR was used to adjust the p-values for multiple comparisons. After parsing the whole KEGG database, all of the pathways were extracted for the studied genes, and the pathway network was generated with the help of the pathway topology gleaned from the KEGG database. Network construction was performed by Cytoscape 3.4.0 (http:// www.cytoscape.org/).
Results
▪ Identification of differential proteins in CSF and plasma between PNKD patients and healthy family members:
In the CSF proteome, peptide lengths were mainly distributed between 8 and 17 (mean 14.0), with most at a length of 10 peptides. In total, 18258 PSMs were identified in the CSF, among which 17797 were labeled with the iTRAQ reagent, achieving a labeling efficiency of 97.5%. A total of 1424 proteins were identified. 22 up- and 20 down-regulated proteins in PNKD patients were found when compared against healthy with 1.5-fold change (Table 1).
| Accession | Protein name | Gene symbol | Fold change(PNKD vs normal) |
|---|---|---|---|
| P31151 | Protein S100-A7 | S100A7 | 2.75 |
| Q9NYL2-3 | Isoform 3 of Mitogen-activated protein kinase kinase kinase MLT | MLTK | 2.55 |
| P04206 | Ig kappa chain V-III region GOL | KV307 | 2.45 |
| G3V1N2 | HCG1745306, isoform CRA_a | HBA2 | 2.39 |
| P06702 | Protein S100-A9 | S100A9 | 2.24 |
| Q03188 | Centromere protein C 1 | CENPC1 | 2.05 |
| P02538 | Keratin, type II cytoskeletal 6A | KRT6A | 1.92 |
| P29508-2 | Isoform 2 of Serpin B3 | SERPINB3 | 1.90 |
| A8MXB6 | Dynamin-like 120 kDa protein, mitochondrial (Fragment) | OPA1 | 1.84 |
| K7ERI9 | Truncated apolipoprotein C-I (Fragment) | APOC1 | 1.80 |
| B8ZZE5 | Augurin | C2orf40 | 1.76 |
| Q9NZT1 | Calmodulin-like protein 5 | CALML5 | 1.73 |
| P47929 | Galectin-7 | LGALS7 | 1.69 |
| D6REY1 | Chitotriosidase-1 | CHIT1 | 1.68 |
| P22004 | Bone morphogenetic protein 6 | BMP6 | 1.66 |
| P23083 | Ig heavy chain V-I region V35 | HV103 | 1.62 |
| P01608 | Ig kappa chain V-I region Roy | KV116 | 1.59 |
| P86790 | Vacuolar fusion protein CCZ1 homolog B | CCZ1B | 1.58 |
| H0Y6W5 | Zinc finger protein basonuclin-2 (Fragment) | BNC2 | 1.53 |
| Q504Y0-2 | Isoform 2 of Zinc transporter ZIP12 | SLC39A12 | 1.53 |
| P78563-2 | Isoform 2 of Double-stranded RNA-specific editase 1 | ADARB1 | 1.51 |
| P05109 | Protein S100-A8 | S100A8 | 1.51 |
| F8VSC5 | SCY1-like protein 2 (Fragment) | SCYL2 | 0.66 |
| P04085-2 | Isoform Short of Platelet-derived growth factor subunit A | PDGFA | 0.65 |
| E5RGY1 | Disintegrin and metalloproteinase domain-containing protein 28 | ADAM28 | 0.65 |
| P01877 | Ig alpha-2 chain C region | IGHA2 | 0.64 |
| E7EPS8 | Receptor-type tyrosine-protein phosphatase mu | PTPRM | 0.64 |
| C9J2Z9 | Histone-lysine N-methyltransferase SETD1A (Fragment) | SETD1A | 0.63 |
| A6NEL2 | Ankyrin repeat domain-containing protein SOWAHB | SOWAHB | 0.62 |
| P13284 | Gamma-interferon-inducible lysosomal thiol reductase | IFI30 | 0.61 |
| H0Y987 | Phosphoacetylglucosamine mutase (Fragment) | PGM3 | 0.61 |
| C9JRE9 | C-reactive protein(1-205) | CRP | 0.60 |
| O43493-2 | Isoform TGN46 of Trans-Golgi network integral membrane protein 2 | TGOLN2 | 0.59 |
| O76061 | Stanniocalcin-2 | STC2 | 0.57 |
| F8W8P9 | Rho guanine nucleotide exchange factor 11 | ARHGEF11 | 0.56 |
| O14793 | Growth/differentiation factor 8 | MSTN | 0.55 |
| P01860 | Ig gamma-3 chain C region | IGHG3 | 0.53 |
| Q8N895 | Zinc finger protein 366 | ZNF366 | 0.46 |
| Q9UI40-2 | Isoform 2 of Sodium/potassium/calcium exchanger 2 | SLC24A2 | 0.42 |
| K7EQJ5 | 40S ribosomal protein S15 (Fragment) | RPS15 | 0.41 |
| P01614 | Ig kappa chain V-II region Cum | KV201 | 0.40 |
| P01880 | Ig delta chain C region | IGHD | 0.39 |
Table 1: The differential expressed proteins in CSF.
In the plasma proteome, peptide lengths were mainly distributed between 10 and 15(mean 13.0), with most consisting of 11 peptides. 6942 PSMs were labeled with the iTRAQ reagent, and 512 proteins were identified. 32 up- and 25 down-regulated proteins in PNKD patients were found when compared against healthy with 1.5- fold change (Table 2).
| Accession | Protein name | Gene symbol | Fold change(PNKD vs normal) |
|---|---|---|---|
| P01814 | Ig heavy chain V-II region OU | HV201 | 2.367 |
| Q96M19 | Transmembrane protein LINC00477 | LINC00477 | 2.132 |
| P05534 | HLA class I histocompatibility antigen, A-24 alpha chain | HLA-A | 2.110 |
| P49326-3 | Isoform 3 of Dimethylaniline monooxygenase [N-oxide-forming] 5 | FMO5 | 2.042 |
| P11226 | Mannose-binding protein C | MBL2 | 2.027 |
| O95810 | Serum deprivation-response protein | SDPR | 1.970 |
| Q9H4B7 | Tubulin beta-1 chain | TUBB1 | 1.892 |
| P07737 | Profilin-1 | PFN1 | 1.887 |
| Q12951-2 | Isoform 2 of Forkhead box protein I1 | FOXI1 | 1.839 |
| P63267 | Actin, gamma-enteric smooth muscle | ACTG2 | 1.827 |
| P60709 | Actin, cytoplasmic 1 | ACTB | 1.811 |
| P01722 | Ig lambda chain V-VI region NIG-48 | LV602 | 1.795 |
| E9PAQ1 | Properdin | CFP | 1.790 |
| Q16610 | Extracellular matrix protein 1 | ECM1 | 1.787 |
| P43652 | Afamin | AFM | 1.769 |
| H7C2W2 | E3 ubiquitin-protein ligase SHPRH (Fragment) | SHPRH | 1.760 |
| B8X2Z3 | CARMIL2b | RLTPR | 1.757 |
| B4DV03 | HCG1780060, isoform CRA_b | CCDC163P | 1.738 |
| P01612 | Ig kappa chain V-I region Mev | KV120 | 1.712 |
| F5H677 | Nucleolar complex protein 3 homolog | NOC3L | 1.682 |
| Q96EU6-2 | Isoform 2 of Ribosomal RNA processing protein 36 homolog | RRP36 | 1.650 |
| F5H125 | Cell adhesion molecule 1 (Fragment) | CADM1 | 1.635 |
| P01699 | Ig lambda chain V-I region VOR | LV101 | 1.624 |
| Q5SZK8-2 | Isoform 2 of FRAS1-related extracellular matrix protein 2 | FREM2 | 1.614 |
| Q86UX7-2 | Isoform 2 of Fermitin family homolog 3 | FERMT3 | 1.601 |
| Q6UXB8 | Peptidase inhibitor 16 | PI16 | 1.594 |
| P08514-3 | Isoform 3 of Integrin alpha-IIb | ITGA2B | 1.563 |
| Q8NDW8-6 | Isoform 6 of Tetratricopeptide repeat protein 21A | TTC21A | 1.546 |
| C9JPQ9 | Fibrinogen gamma chain (Fragment) | FGG | 1.531 |
| B1ALQ8 | Complement factor H-related protein 4 | CFHR4 | 1.527 |
| Q96JK4-2 | Isoform 2 of HHIP-like protein 1 | HHIPL1 | 1.512 |
| P01703 | Ig lambda chain V-I region NEWM | LV105 | 1.507 |
| P42356 | Phosphatidylinositol 4-kinase alpha | PI4KA | 0.649 |
| P18428 | Lipopolysaccharide-binding protein | LBP | 0.644 |
| P02656 | Apolipoprotein C-III | APOC3 | 0.639 |
| Q9UJY5-4 | Isoform 4 of ADP-ribosylation factor-binding protein GGA1 | GGA1 | 0.632 |
| P02042 | Hemoglobin subunit delta | HBD | 0.623 |
| P02747 | Complement C1q subcomponent subunit C | C1QC | 0.619 |
| Q9H4Z2-2 | Isoform 2 of Zinc finger protein 335 | ZNF335 | 0.613 |
| P14780 | Matrix metalloproteinase-9 | MMP9 | 0.579 |
| P02745 | Complement C1q subcomponent subunit A | C1QA | 0.563 |
| P01860 | Ig gamma-3 chain C region | IGHG3 | 0.538 |
| M0QZV5 | Endophilin-A2 | SH3GL1 | 0.535 |
| M0R1F2 | Zinc finger protein 208 (Fragment) | ZNF208 | 0.527 |
| F5GZM4 | Phosphoenolpyruvate carboxykinase, cytosolic [GTP] | PCK1 | 0.522 |
| E5RH81 | Carbonic anhydrase 1 (Fragment) | CA1 | 0.476 |
| A6NIW5 | Peroxiredoxin 2, isoform CRA_a | PRDX2 | 0.448 |
| P01816 | Ig heavy chain V-II region DAW | HV203 | 0.407 |
| P01859 | Ig gamma-2 chain C region | IGHG2 | 0.399 |
| P69905 | Hemoglobin subunit alpha | HBA1 | 0.371 |
| P00918 | Carbonic anhydrase 2 | CA2 | 0.357 |
| P68871 | Hemoglobin subunit beta | HBB | 0.338 |
| H0YMN4 | SH2 domain-containing adapter protein F (Fragment) | SHF | 0.326 |
| P07996 | Thrombospondin-1 | THBS1 | 0.283 |
| P02741 | C-reactive protein | CRP | 0.234 |
| P01880 | Ig delta chain C region | IGHD | 0.194 |
| A0FGR8-4 | Isoform 4 of Extended synaptotagmin-2 | ESYT2 | 0.124 |
Table 2: The differential expressed proteins in plasma.
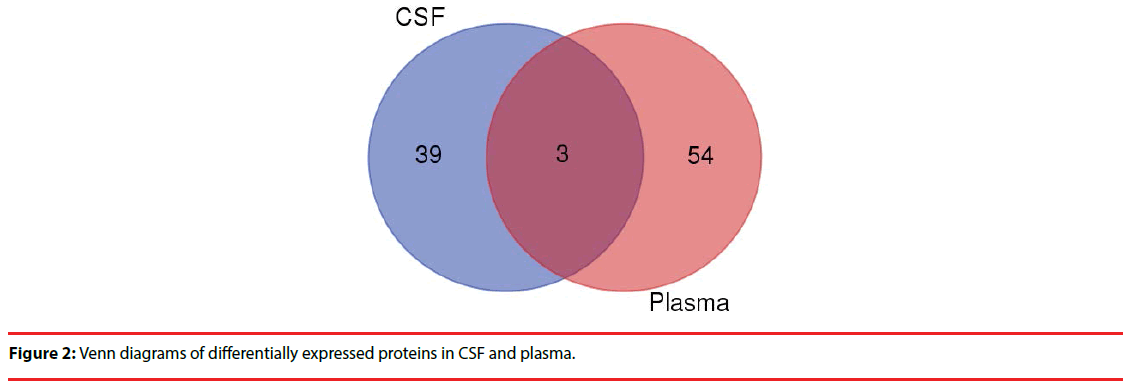
Comparing the two groups of differentially expressed proteins , we found 3 co-down regulated proteins in CSF and plasma (CRP,IGHG3,IGHD) (Figure 2), but further analysis showed no clear evidence of association with the PNKD.
▪ Functional annotation of the differentially expressed proteins in CSF and plasma:
In order to obtain a global functional view of the differentially expressed proteins, GO enrichment analysis and KEGG pathway analysis were employed. The GO annotation was categorized including biological process, molecular function, and cellular component.
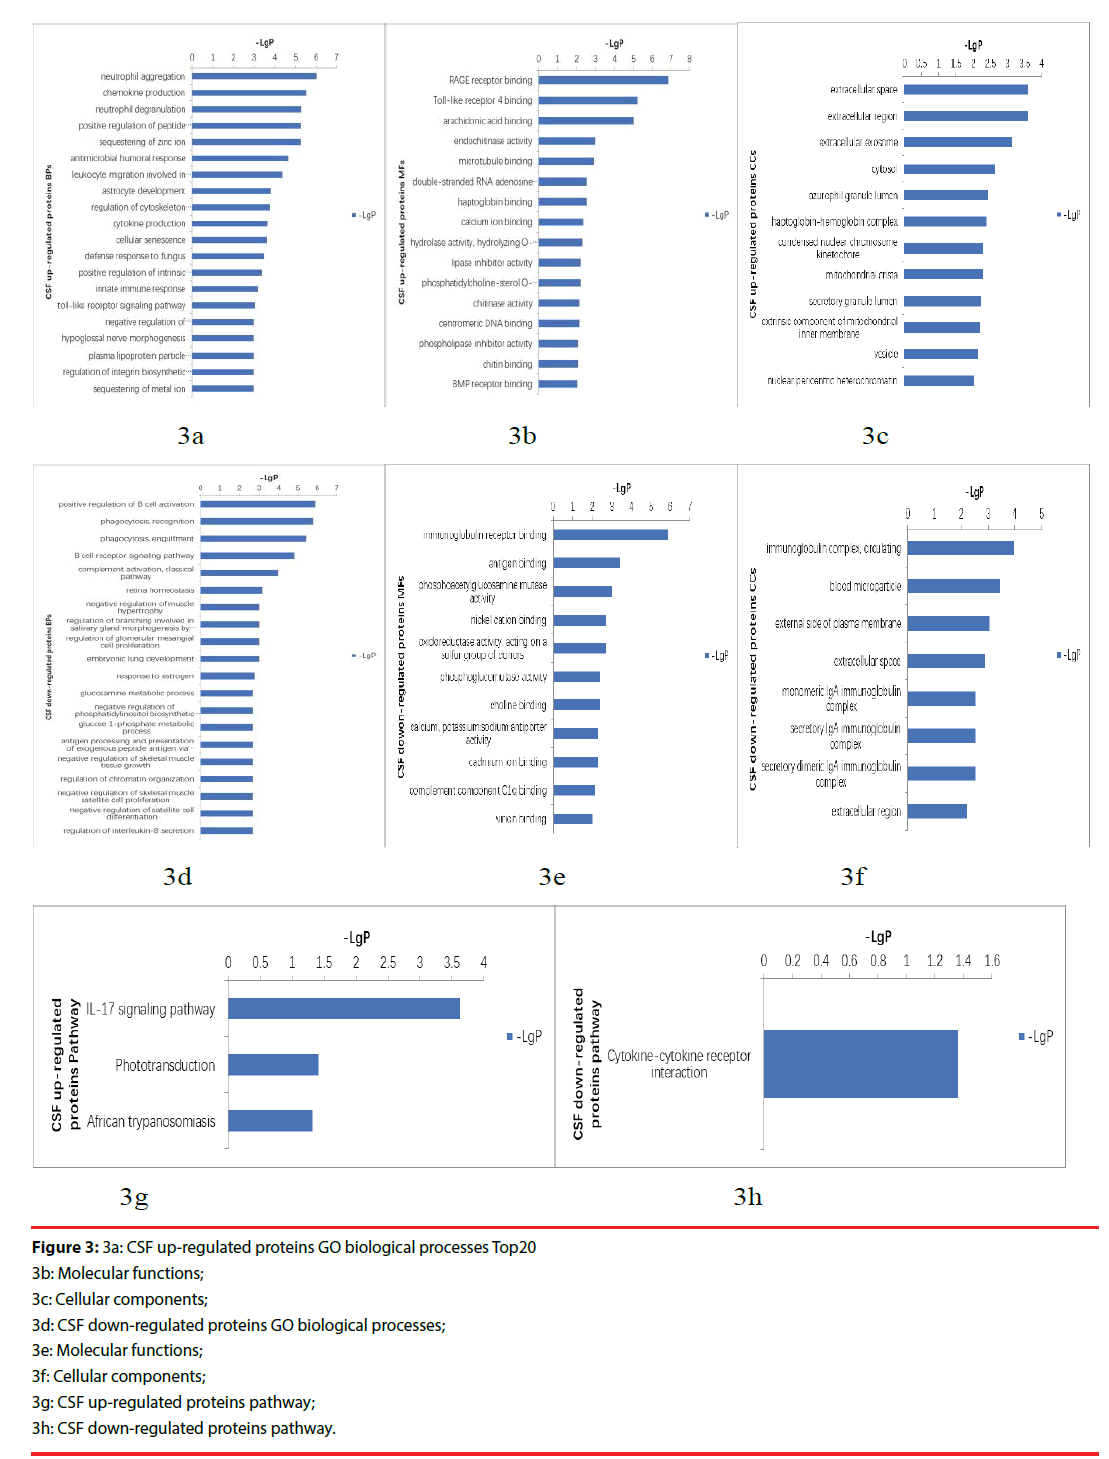
The up-regulated proteins in CSF participated in biological processes included neutrophil aggregation, chemokine production, neutrophil degranulation, positive regulation of peptide secretion etc., The molecular functions categories included RAGE receptor binding, Toll-like receptor 4 binding, arachidonic acid binding. The top three cellular components were classified in extracellular space, extracellular region, extracellular exosome (Figure 3a-3c). The down-regulated proteins’ biological processes categorized positive regulation of B cell activation, phagocytosis, recognition, phagocytosis, engulfment, B cell receptor signaling pathway, complement activation, classical pathway etc.. Top three molecular functions categories included immunoglobulin receptor binding, antigen binding, phosphoacetylglucosamine mutase activity. The cellular components categories included immunoglobulin complex, circulating, blood microparticle, external side of plasma membrane (Figure 3d-3f).The differentially expressed proteins were further defined based on KEGG. The up-regulated proteins in CSF were participated in IL-17 signaling pathway, phototransduction, African trypanosomiasis. And the down-regulated proteins were categorized in cytokine-cytokine receptor interaction (Figure 3g, 3h).
Figure 3: 3a: CSF up-regulated proteins GO biological processes Top20
3b: Molecular functions;
3c: Cellular components;
3d: CSF down-regulated proteins GO biological processes;
3e: Molecular functions;
3f: Cellular components;
3g: CSF up-regulated proteins pathway;
3h: CSF down-regulated proteins pathway.
▪ PNKD protein–protein interaction networks:
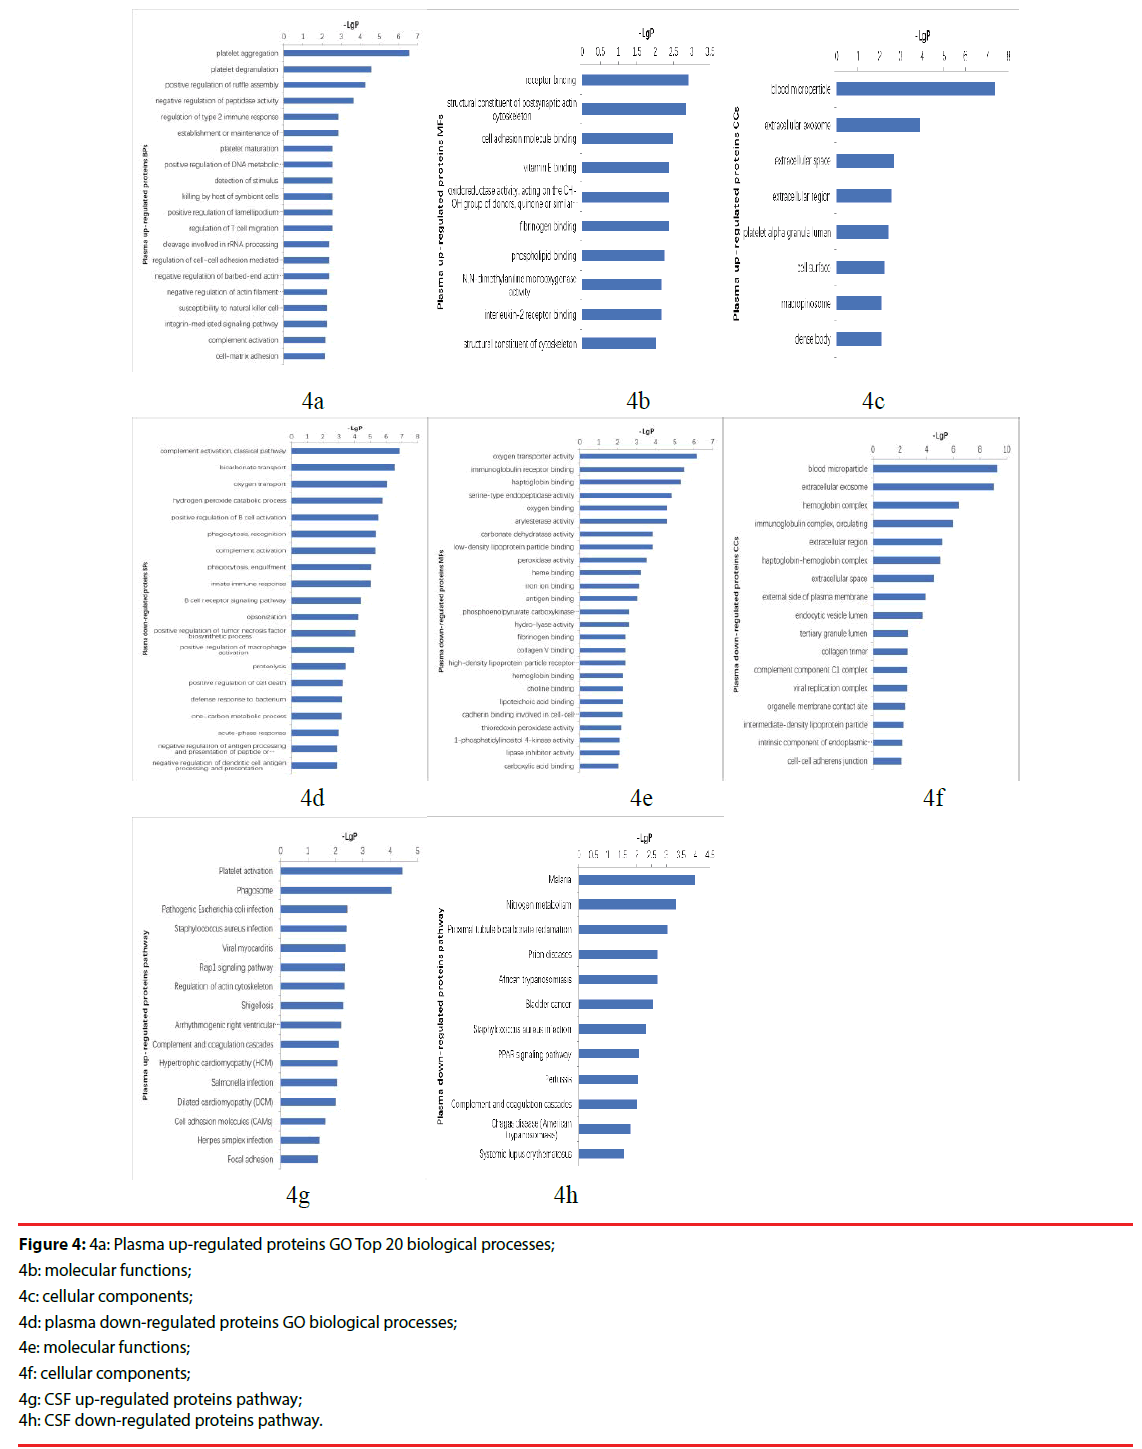
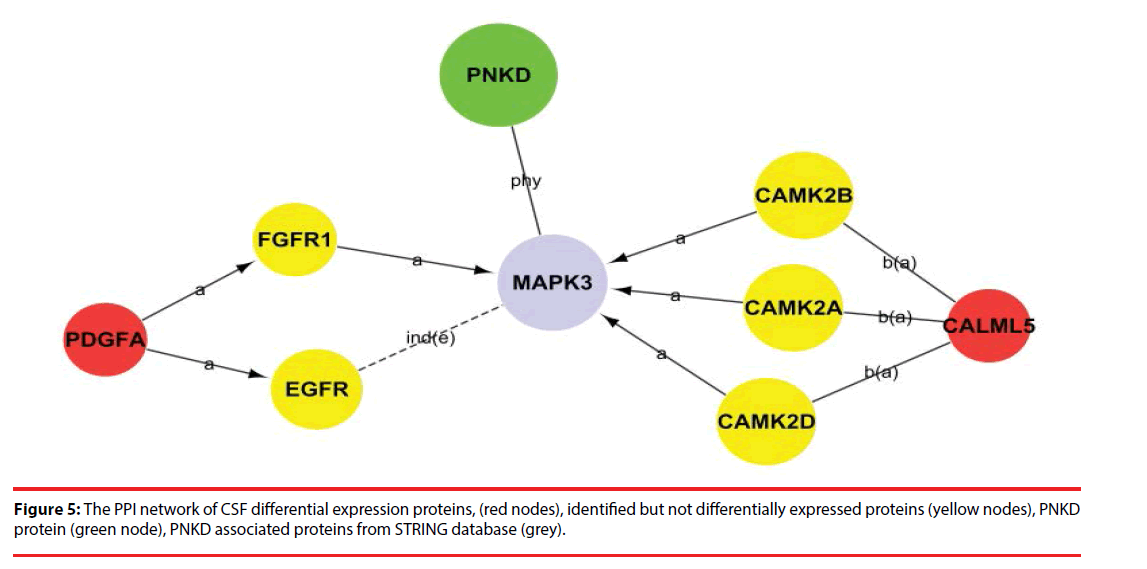
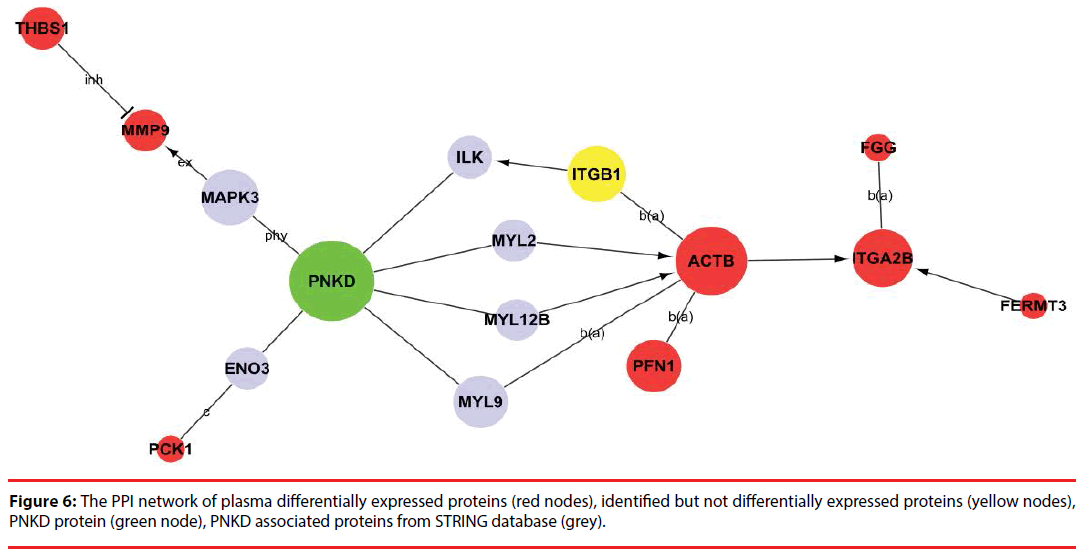
In order to provide a landscape of what and how the differentially expressed proteins participate in PNKD pathogenesis, PPI network was constructed based on PNKD protein, identified proteins( include differentially expressed proteins) and PNKD associated proteins from STRING database in CSF and plasma respectively (Figure 4a-4h).
Figure 4: 4a: Plasma up-regulated proteins GO Top 20 biological processes;
4b: molecular functions;
4c: cellular components;
4d: plasma down-regulated proteins GO biological processes;
4e: molecular functions;
4f: cellular components;
4g: CSF up-regulated proteins pathway;
4h: CSF down-regulated proteins pathway.
Among the network in the CSF, calmodulin-like 5 (CALML5) and platelet-derived growth factor subunit A (PDGFA) were able to link together with PNKD through several different pathways with the interaction of certain identified proteins and the intermediate partner mitogen-activated protein kinase 3 (MAPK3) as shown in Figure 5 and Supplementary Figure 1. This indicates that CALML5 and PDGFA might regulate PNKD through MAPK3 pathway and be the potential biomarkers of PNKD diagnosis in CSF.
Among the network in the plasma, 8 differentially expressed proteins (ACTB, ITGA2B, PFN1, FGG, PCK1, THBS1, MMP9 and FERMT3) were capable of linking together with PNKD through different pathways by interacting with the intermediate partners (grey) and/or identified proteins at the PPI level, as shown in Figure 6 and Supplementary Figure 2. These results indicate that ACTB, ITGA2B, PFN1, FGG, PCK1, THBS1, MMP9 and FERMT3 are the potential biomarkers of PNKD diagnosis in plasma.
Discussion
Myofibrillogenesis regulator 1 (MR-1) gene is reported to be responsible for PNKD, and it is transcribed into three spliced isoforms: long (MR-1L/PNKD-L), medium (MR-1M/ PNKD-M) and short (MR-1S/PNKD-S) [6,10]. We focused on the MR-1L/PNKD-L isoform in this study, because it is only expressed in the brain [6,10]. The results of LC-MS/MS analysis showed that neither wild type nor mutant PNKD-L proteins were found in the CSF or plasma, and confirmed that wild type and mutant PNKD-L proteins are specifically expressed in brain tissue.
The GO is a structured and controlled vocabulary of terms, and widely recognized as the premier tool for the organization and functional annotation of molecular characteristics [18,20,21]. By interpreting the GO of differentially expressed proteins and then analyzing them statistically, we have obtained 42 significant CSF proteins and 57 significant plasma proteins. Pathway analyses showed the distinct biological processes and significant pathways in which the differentially expressed proteins were involved. PNKD-related proteins were searched using the NCBI and STRING Database, and their relationships and pathways were merged the KEGG Database. KEGG is a knowledge base for systematic analysis of gene functions, linking genomic information with higher order functional information, and is widely utilized for pathway related analysis [22,23].
According to these pathways, we then constructed a PNKD-related protein-protein interaction network, which helped us to not only understand the interactions and inter-regulation of these integral genes, but also identify the key genes in these networks as determined by their Degree value. Among the PPI network in CSF, CALML5 (also known as CLSP) is reported as secreted bioactive peptide that inhibits neuronal cell death. [24], was identified as a potential pathway component of PNKD pathogenic mechanism. Another potential biomarker in CSF of PNKD diagnosis was PDGFA, which regulates the proliferation and self-renewal in stem cells such as skin adipocyte stem cell and glioblastoma stem cell [25,26],and may participate in the development of malignant middle cerebral artery infarction (MMI) [27].
Furthermore, the major potential pathway component of the PNKD pathogenic mechanism in plasma is ACTB, which has been regarded as a housekeeping gene and a reference gene/protein in different diseases like cancers and Baraitser- Winter syndrome [28-31] and may have an important role in AD pathology [32]. ACTB can bind to MYL9 and MYL2 through the tight junction pathway. MYL9 and MYL2 are both able to bind to the PNKD protein. However, the relationships of these proteins and the pathogenic mechanisms of PNKD still require further research.
In conclusion, 42 differentially expressed proteins in CSF and 57 differentially expressed proteins in plasma were found between PNKD patients and their healthy family members. Among the newly discovered differentially expressed proteins, CALML5 and PDGFA in the CSF and ACTB in the plasma are the potential biomarkers for PNKD diagnosis.
Acknowledgments
The authors would like to show gratitude to the proband and family members of his family for their long-term cooperation. We appreciate the contribution provided by Prof. XH Liu from Department of Pathophysiology, PLA Medical College. We thank Junlin Feng from CNKINGBIO for technical assistance. This research was funded by Chinese National Nature & Science Foundation (81271437, 81771388). This fund didn’t involve the study design, data collection and analysis, interpretation of data and the writing of the report.
Ethical approval
The experiment complied with the Ethics Committee of the First Affiliated Hospital of PLA General Hospital Beijing, China.
References
- Fouad GT, Servidei S, Durcan S, et al. A gene for familial paroxysmal dyskinesia (FPD1) maps to chromosome 2q. Am. J. Hum. Genet 59(1), 135-139 (1996).
- Mount LA, Reback S. Familial paroxysmal choreoathetosis - Preliminary report on a hitherto undescribed clinical syndrome. Arch. Neur. Psych 44(4), 841-847 (1940).
- Bressman SB, Fahn S, Burke RE. Paroxysmal non-kinesigenic dystonia. Adv. Neurol 50, 403-413 (1988).
- Richards RN, Barnett HJ. Paroxysmal dystonic choreoathetosis. A family study and review of the literature. Neurology 18(5), 461-469 (1968).
- Matsuo H, Kamakura K, Saito M, et al. Familial paroxysmal dystonic choreoathetosis: clinical findings in a large Japanese family and genetic linkage to 2q. Arch. Neurol 56(6), 721-726 (1999).
- Rainier S, Thomas D, Tokarz D, et al. Myofibrillogenesis regulator 1 gene mutations cause paroxysmal dystonic choreoathetosis. Arch. Neurol 61(7), 1025-1029 (2004).
- Shen Y, Lee HY, Rawson J, et al. Mutations in PNKD causing paroxysmal dyskinesia alters protein cleavage and stability. Hum. Mol. Genet 20(12), 2322-2332 (2011).
- Pons R, Cuenca-León E, Miravet E, et al. Paroxysmal non-kinesigenic dyskinesia due to a PNKD recurrent mutation: Report of two Southern European families. Eur. J. Paediatr. Neurol 16(1), 86-89 (2012).
- Ghezzi D, Viscomi C, Ferlini A, et al. Paroxysmal non-kinesigenic dyskinesia is caused by mutations of the MR-1 mitochondrial targeting sequence. Hum. Mol. Genet 18(6), 1058-1064 (2009).
- Lee HY, Xu Y, Huang Y, et al. The gene for paroxysmal non-kinesigenic dyskinesia encodes an enzyme in a stress response pathway. Hum. Mol. Genet 13(24), 3161-3170 (2004).
- Liang S, Yu X, Zhang S, et al. A case of familial paroxysmal nonkinesigenic dyskinesia due to mutation of the PNKD gene in Chinese Mainland. Brain. Res 1595, 120-126 (2015).
- Humpel C, Hochstrasser T. Cerebrospinal fluid and blood biomarkers in Alzheimer's disease. World. J. Psychiatry 1(1), 8-18 (2011).
- Jabbari E, Zetterberg H, Morris HR. Tracking and predicting disease progression in progressive supranuclear palsy: CSF and blood biomarkers. J. Neurol. Neurosurg. Psychiatry 88(10), 883-888 (2017).
- Ortea I, Roschitzki B, Ovalles JG, et al. Discovery of serum proteomic biomarkers for prediction of response to infliximab (a monoclonal anti-TNF antibody) treatment in rheumatoid arthritis: an exploratory analysis. J. Proteomics 77: 372-382 (2012).
- Ali A, Sheikh IA, Mirza Z, et al. Application of Proteomic Tools in Modern Nanotechnological Approaches Towards Effective Management of Neurodegenerative Disorders. Curr. Drug. Metab 16(5), 376-388 (2015).
- Poersch A, Grassi ML, Carvalho VP, et al. A proteomic signature of ovarian cancer tumor fluid identified by highthroughput and verified by targeted proteomics. J. Proteomics 145, 226-236 (2016).
- Su L, Cao L, Zhou R, et al. Identification of Novel Biomarkers for Sepsis Prognosis via Urinary Proteomic Analysis Using iTRAQ Labeling and 2D-LC-MS/MS. Plos. One 8(1), e54237 (2013).
- Larkin SE, Johnston HE, Jackson TR, et al. Detection of candidate biomarkers of prostate cancer progression in serum: a depletion-free 3D LC/MS quantitative proteomics pilot study. Br. J. Cancer 115(9), 1078-1086 (2016).
- Nishio T, Kurabe N, Goto-Inoue N, et al. Immunohistochemical expression analysis of leucine-rich PPR-motif-containing protein (LRPPRC), a candidate colorectal cancer biomarker identified by shotgun proteomics using iTRAQ. Clin. Chim. Acta 471, 276-282 (2017).
- Zhang L, Huang Y, Zhuo W, et al. Identification and characterization of biomarkers and their functions for Lapatinib-resistant breast cancer. Med. Oncol 34(5), (2017).
- Rai A, Nakamura M, Takahashi H, et al. High-throughput sequencing and de novo transcriptome assembly of Swertia japonica to identify genes involved in the biosynthesis of therapeutic metabolites. Plant. Cell. Rep 35(10), 2091-2111 (2016).
- Sadakata T, Shinoda Y, Ishizaki Y, et al. Analysis of gene expression in Ca2+-dependent activator protein for secretion 2 (Cadps2) knockout cerebellum using GeneChip and KEGG pathways. Neurosci. Lett 639, 88-93 (2017).
- Droste C, De Las Rivas J. Path2enet: generation of human pathway-derived networks in an expression specific context. BMC. Genomics 17 (8), 389-397 (2016).
- Hashimoto Y, Nawa M, Kurita M, et al. Secreted calmodulin-like skin protein inhibits neuronal death in cell-based Alzheimer’s disease models via the heterotrimeric Humanin receptor. Cell. Death. Dis 4(3), (2013).
- Rivera-Gonzalez GC, Shook BA, Andrae J, et al. Skin Adipocyte Stem Cell Self-Renewal Is Regulated by a PDGFA/AKT-Signaling Axis. Cell. Stem. Cell 19(6), 738-751 (2016).
- Sakakini N, Turchi L, Bergon A, et al. A Positive Feed-forward Loop Associating EGR1 and PDGFA Promotes Proliferation and Self-renewal in Glioblastoma Stem Cells. J. Biol. Chem 291(20), 10684-10699 (2016).
- Zhou Z, Zhang J, Li X, et al. Protein microarray analysis identifies key cytokines associated with malignant middle cerebral artery infarction. Brain. Behav 7(8), e00746 (2017).
- Di Donato N, Rump A, Koenig R, et al. Severe forms of Baraitser-Winter syndrome are caused by ACTB mutations rather than ACTG1 mutations. Eur. J. Hum. Genet 22(2), 179-183 (2014).
- Johnston JJ, Wen KK, Keppler-Noreuil K, et al. Functional analysis of a de novo ACTB mutation in a patient with atypical Baraitser-Winter syndrome. Hum. Mutat 34(9), 1242-1249 (2013).
- Guo C, Liu S, Wang J, et al. ACTB in cancer. Clin. Chim. Acta 417, 39-44 (2013).
- Rivière JB, van Bon BW, Hoischen A, et al. De novo mutations in the actin genes ACTB and ACTG1 cause Baraitser-Winter syndrome. Nat. Genet 44(4), 440-444 (2012).
- Hu W, Lin X, Chen K, et al. Integrated analysis of differential gene expression profiles in hippocampi to identify candidate genes involved in Alzheimer’s disease. Mol. Med. Rep 12(S5), 6679-6687 (2015).
