

Abstract
Objective. To explore the accuracy of tricuspid regurgitation velocity (TRV) to right ventricular outflow tract time-velocity integral (TVIRVOT) ratio by Doppler to determine pulmonary vascular resistance (PVR) in patients with systemic sclerosis (SSc).
Methods. Thirty-five consecutive adult patients with SSc, fulfilling the 2013 European League Against Rheumatism/American College of Rheumatology classification criteria, with sinus rhythm referred for right heart catheterization (RHC), were retrospectively included. All patients underwent a transthoracic echocardiogram (TTE) performed within 24 h of RHC. Patients with SSc were recruited regardless of disease activity, cardiac symptoms, and treatment regimen. Doppler measurements were compared to RHC measurements. A linear regression equation was generated to predict PVR by echocardiogram based on the TRV/TVIRVOT ratio. The accuracy of Doppler measurements for predicting PVR > 3 Wood units was assessed by computing the areas under the receiver-operating characteristic curves.
Results. There were 20 (57%) females in the study. The mean age was 65 ± 12 years. Mean and systolic pulmonary arterial pressures were 31 ± 8 and 53 ± 15 mmHg, respectively. There was a good correlation between TRV/TVIRVOT ratio assessed by Doppler and PVR measured by RHC (R = 0.743, p < 0.001). The equation generated by this analysis was the following: PVR by Doppler = 11.3 × (TRV/TVIRVOT) + 1.7. A cutoff value of 0.21 for TRV/TVIRVOT ratio provided the best sensitivity (86%) and specificity (86%) to determine PVR > 3 Wood units.
Conclusion. Our study suggests that TTE using Doppler could be a useful and noninvasive tool for estimating PVR in patients with SSc.
Systemic sclerosis (SSc) is a connective tissue disorder characterized by 3 pathogenetic landmarks: endothelial dysfunction and vasculopathy, activation of the immune system, fibroblast dysregulation, and increase of extracellular matrix deposition in the skin and internal organs1. Hemodynamically confirmed pulmonary hypertension (PH) complicates SSc, with an estimated prevalence of 8–12%2, and is a leading cause of death in this population3,4. Cardiac involvement is common in SSc even in the absence of cardiac symptoms, and includes chronic myocardial inflammation as well as focal and diffuse myocardial fibrosis5. The prevalence of cardiac involvement has been reported to range from 23 to 32% in patients with SSc6. Inflammation and endothelial injury lead to progressive remodeling of small- to medium-sized pulmonary vasculature resulting in the increase of pulmonary vascular resistance and group 1 PH (pulmonary arterial hypertension; PAH), which is defined by a resting mean pulmonary arterial pressure (mPAP) ≥ 25 mmHg, pulmonary capillary wedge pressure (PCWP) ≤ 15 mmHg, and pulmonary vascular resistance (PVR) > 3 Wood units at right heart catheterization (RHC)7. Cardiac involvement leads to group 2 (postcapillary) PH, defined as a resting mPAP ≥ 25 mmHg, PCWP > 15 mmHg, and most of the time, PVR ≤ 3 Wood units at RHC7. Consequently, the main difference between group 1 and group 2 PH is the PVR, which justifies the necessity to develop noninvasive tools for PVR assessment in patients with SSc.
In clinical practice, detection of PH is based on the estimation of pulmonary artery systolic pressure (PASP) by transthoracic echocardiogram (TTE). PASP estimation by echocardiogram is based on the right ventricular–to right atrial pressure gradient using peak tricuspid regurgitation velocity (TRV) and considering right atrial pressure. Given the inaccuracies of right atrial pressure estimation and the increase in measurement errors by using derived variables, current European Society of Cardiology (ESC)/European Respiratory Society (ERS) guidelines recommend using the continuous wave Doppler measurement of peak TRV (and not the estimated PASP) as the main variable for assigning the echocardiographic probability of PH7. However, this technique does not consider the possibility of cardiac involvement and increases in PCWP. As a result, the assessment and followup of PVR in patients with SSc is a major challenge.
Abbas, et al demonstrated that the ratio of TRV to the right ventricular outflow tract time–velocity integral (TVIRVOT) can be used as a reliable method to determine PVR noninvasively8. This technique was applied primarily to patients with normal or mildly elevated PVR9, then before liver transplantation10, and in patients with severe PAH regardless of origin11. However, this technique was not validated for patients with SSc.
The aim of our study was to examine the ability of Doppler techniques by TTE to determine PVR in patients with SSc.
MATERIALS AND METHODS
Study population
Between 2013 and 2016, 35 adult SSc patients with sinus rhythm followed up at Toulouse University Hospital were retrospectively enrolled in this cross-sectional study. All patients underwent TTE performed within 24 h of RHC. Patients with SSc were recruited regardless of disease activity (active or in remission), the presence or absence of cardiac symptoms or cardiovascular comorbidities (coronary artery disease, essential hypertension, significant valvular abnormalities), the presence or absence of pulmonary symptoms or significant pulmonary functional abnormalities, or treatment regimen. All patients with SSc fulfilled the 2013 European League Against Rheumatism/American College of Rheumatology classification criteria12. All patients were informed on admission that their clinical data could be used for research purposes, and all gave their consent. The data were collected as part of routine clinical care, in accordance with the principles of the Declaration of Helsinki. In accordance with applicable standards in France, this study has received ethics committee approval from the French Data Protection Authority (CNIL, no. 2186606).
TTE
Echocardiograms were performed by 3 experienced senior cardiologists using a commercially available ultrasound Vivid E9 system (GE Vingmed Ultrasound AS) with a 2.5-MHz transducer. Images were acquired in accordance with the guidelines of the American Society of Echocardiography, the European Society of Echocardiography, and the Canadian Society of Echocardiography13. A complete Doppler, M-mode, and 2-dimensional greyscale echocardiogram including the 3 standard apical views (4-, 3-, and 2-chamber) was obtained for all patients.
Offline image analysis was performed retrospectively and independently by 2 blinded observers unaware of clinical and hemodynamic data (SB, OL), and the formula was derived from this population using the EchoPAC software version 110.1.2 (GE Vingmed Ultrasound AS) in a standard fashion. In cases of discrepancy, a consensus was reached by discussion. Briefly, the TVIRVOT was obtained by pulsed Doppler from the proximal right ventricular outflow tract just within the pulmonary valve in the parasternal short-axis view. TRV was obtained by continuous Doppler and the highest velocity obtained from multiple views was used. The TRV/TVIRVOT ratio was then calculated as previously described1. The PASP was assessed by measuring the systolic pressure gradient (∆P) between right ventricle and right atrium7 calculated by the modified Bernoulli equation using the TRV (PASP = ∆P + right atrial pressure with ∆P = 4*TRV2). The right atrial pressure estimation was based on the diameter and respiratory variation in diameter of the inferior vena cava: right atrial pressure was estimated to be 5 mmHg when the inferior vena cava diameter was < 21 mm and collapsed > 50% with a sniff, whereas it was estimated to be 15 mmHg when the inferior vena cava diameter was > 21 mm and collapsed < 50% with a sniff or < 20% on quiet inhalation. When the inferior vena cava diameter and collapse did not fit this pattern, right atrial pressure was estimated to be 10 mmHg13. The systolic displacement of the lateral portion of the tricuspid annular plane systolic excursion (TAPSE) was measured on the M-mode tracing under 2-dimensional guidance from an apical 4-chamber view. The tricuspid annular peak systolic velocity was measured from a sample volume placed on the tricuspid annulus at the place of attachment of the anterior leaflet of the tricuspid valve under 2-dimensional guidance from an apical 4-chamber view. Care was taken to obtain an ultrasound beam parallel to the direction of the tricuspid annular motion. Left ventricular end-diastolic and end-systolic volumes and ejection fraction were measured from apical 2- and 4-chamber views using the modified Simpson’s biplane method. All variables were measured over 3 heart cycles (no patients had atrial fibrillation). The mean value was calculated.
Invasive measurements
A Swan-Ganz catheter was used for RHC. PCWP, PASP, pulmonary artery diastolic pressure, and mPAP were measured. Cardiac output was calculated by thermodilution as a mean of 3 consecutive measurements not varying by > 10%. The PVR in Wood units was calculated using the equation: PVR = (mPAP − PCWP)/cardiac output.
Statistical analysis
Continuous variables were expressed with means ± SD for normally distributed variables, and medians and interquartile ranges for non–normally distributed variables. Nominal values were expressed as numbers and percentages. Association between the mean values of continuous variables was compared using the Mann-Whitney rank-sum test. Nominal variables were investigated by Fisher’s exact test. Doppler and invasive pressure gradients were correlated using Spearman analysis, and correlations were expressed by r. The predictability of the individual estimate of PVR by Doppler measurements compared with RHC was evaluated by the Bland-Altman concordance method14. Reliability between techniques was assessed by intraclass correlation coefficient (ICC). A linear regression equation was generated to predict PVR by echocardiogram based on the TRV/TVIRVOT ratio. The accuracy of Doppler measurements for predicting PVR > 3 Wood units was assessed by computing the areas under the receiver-operating characteristic (ROC) curves and the best cutoff value was defined as the point with the highest sum of sensitivity and specificity. Intra- and interrater reliabilities were assessed by ICC from 10 randomly selected studies reanalyzed by 2 observers. Differences were considered to be statistically significant for p values < 0.05. All analyses were performed using standard statistical software SPSS version 20 (SPSS Inc.).
RESULTS
The 35 SSc patients’ characteristics are listed in Table 1. Mean age was 65 ± 12 years. There were 20 women and 15 men in the study. There was no difference in heart rate between RHC and TTE (79 ± 18 and 80 ± 18, respectively; p = 0.578; Figure 1). Left ventricular ejection fraction was reduced (≤ 50%) in 2 (6%) patients. PH by RHC (i.e., mPAP ≥ 25 mmHg) was present in 29 (83%) patients: 25 (71%) group 1 PH and 4 (11%) group 2 PH. PVR ranged from 0.9 to 9.9 Wood units. Five (14%) patients had PVR < 2 Wood units. PCWP ranged from 2 to 20 mmHg and was > 12 mmHg in 7 (20%) patients.

TVIRVOT and TRV by transthoracic echocardiography in a patient without elevation of PVR. A. TVIRVOT = 15 cm. B. TRV = 2.3 m/s. The ratio TRV/TVIRVOT = 2.3/15 = 0.15. TRV: peak tricuspid regurgitant velocity; TVIRVOT: right ventricular outflow tract time-velocity integral; PVR: pulmonary vascular resistance.
Population characteristics, echocardiographic and invasive findings.
There was a significant correlation between the right ventricular–to right atrial pressure gradient estimated by Doppler and measured by RHC (r = 0.604, p < 0.001; Figure 2A). There was also a significant correlation between the PASP assessed by echocardiogram and measured by RHC (r = 0.615, p < 0.001; Figure 2B). The correlation between TRV/TVIRVOT ratio and PVR determined by RHC was r = 0.743 (p < 0.001; Figure 2C).
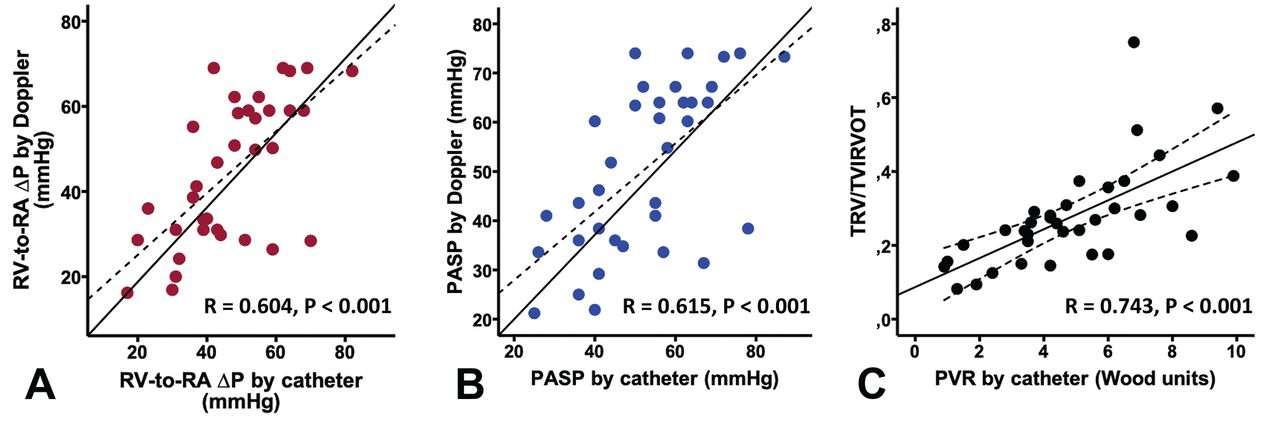
Doppler-estimated versus catheter-measured pressures and resistance. ∆P: pressure gradient; RV-to-RA: right ventricular–to–right atrial; TRV/TVIRVOT: peak tricuspid regurgitant velocity/right ventricular outflow tract time-velocity integral ratio; PASP: pulmonary arterial systolic pressure; PVR: pulmonary vascular resistance.
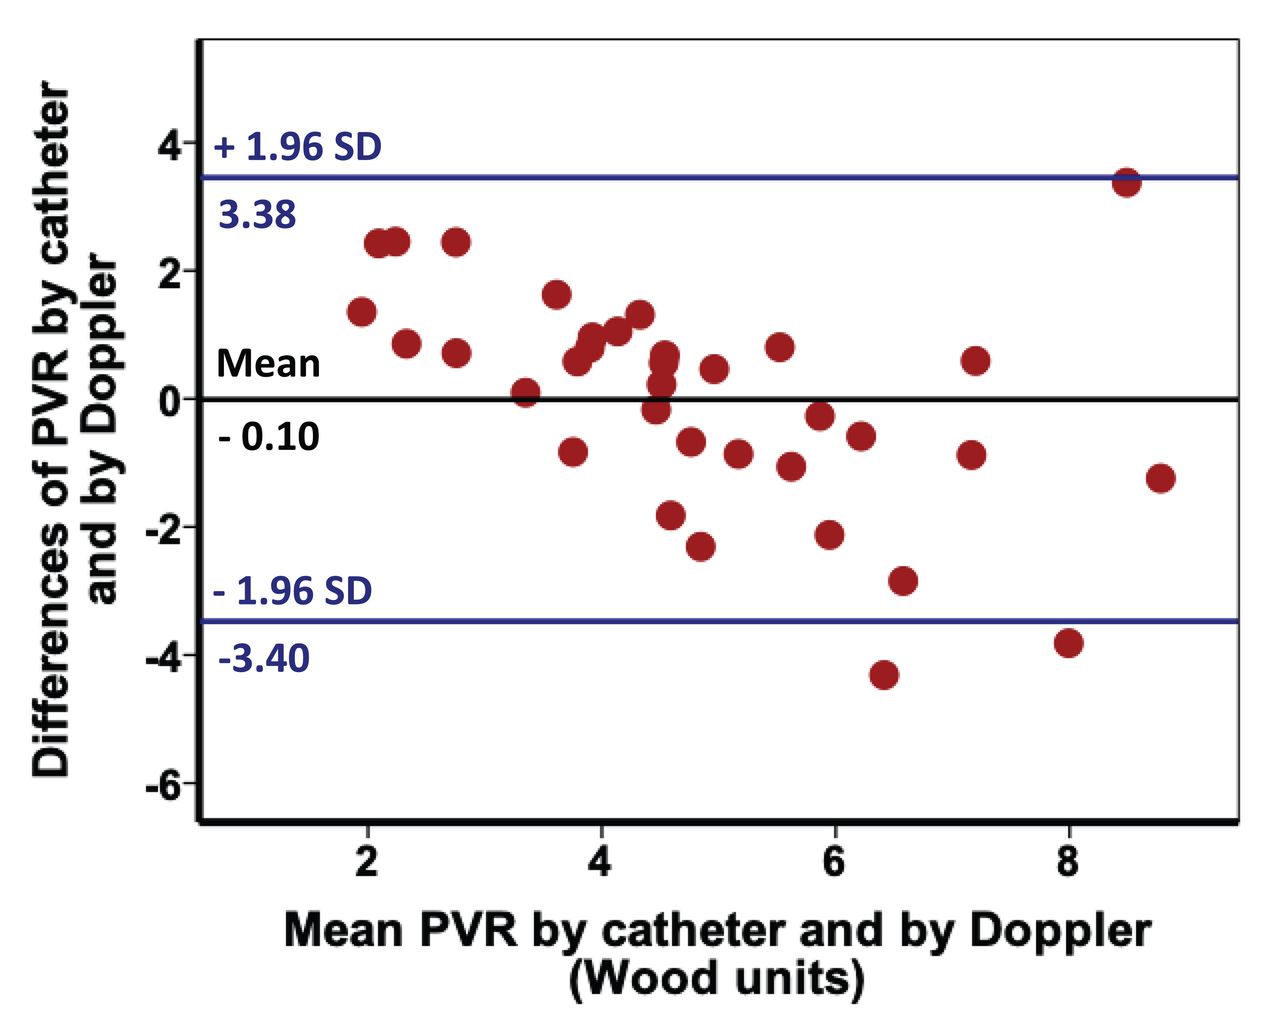
The equation generated by this analysis and derived from our population was the following: PVR by echocardiogram = 11.3 × (TRV/TVIRVOT) + 1.7. In our SSc population, PVR calculated by this formula were better correlated than the PVR calculated using the previous formula of Abbas, et al8 described in a population of wild referral diagnosis, without SSc (r = 0.738, p < 0.001). Using the Bland-Altman analysis, PVR by Doppler measurements derived from this equation showed satisfactory limits of agreement with PVR by RHC (Figure 3), with a mean value of 0.013 ± 1.731 (SD). The PVR by Doppler and PVR by RHC values were well within 1.96 SD, except for high values of PVR.

Bland-Altman analysis showing the limits of agreement between PVR by Doppler and PVR by RHC. PVR: pulmonary vascular resistance; RHC: right heart catheterization.
The ROC curves and the area under the curve (AUC) for the right ventricular–to right atrial pressure gradient, the PASP, and the TRV/TVIRVOT ratio to predict PVR > 3 are shown in Figure 4. The 3 variables were suitable for a diagnostic test, because their ROC curve area was significantly greater than 0.50. TRV/TVIRVOT ratio showed the best performance with the greatest AUC and a cutoff value of 0.21 provided the best-balanced sensitivity (86%) and specificity (86%) to determine PVR > 3 Wood units (AUC 0.921, 95% CI 0.817–1.000; p < 0.001; Figure 4).

Receiver-operating characteristic curves to predict pulmonary vascular resistance > 3 Wood units. ∆P: pressure gradient; AUC: area under the curve; PASP: pulmonary arterial systolic pressure; RV-to-RA: right ventricular–to right atrial; TRV/TVIRVOT: peak tricuspid regurgitant velocity/right ventricular outflow tract time–velocity integral ratio.
The ICC and CI for intra- and interrater reliabilities for TRV/TVIRVOT ratio were 0.956 (95% CI 0.870–0.985; p < 0.001) and 0.935 (95% CI 0.808–0.978; p < 0.001), respectively.
DISCUSSION
Our study demonstrates the good correlation between Doppler derivate TRV/TVIRVOT ratio and PVR estimated by RHC. We show that PVR in patients with SSc can be estimated from TRV/TVIRVOT ratio using the formula: PVR by echocardiography = 11.3 × (TRV/TVIRVOT) + 1.7. Further, we have shown that TRV/TVIRVOT has the best performance for identifying patients with PVR > 3 Wood units, and a cutoff value of 0.21 allows 86% sensitivity and 86% specificity. As illustrated by the Bland-Altman plot between catheter PVR and Doppler PVR, discrepancies between catheter and Doppler appear for the high levels of PVR, suggesting that the technique is a reliable method for screening patients with a less advanced stage of disease.
Among populations at risk for developing PH, SSc appears most suitable for noninvasive screening programs regarding prevalence and feasibility. Screening for PH in SSc improves outcomes and TTE may remain a potential first step for PH screening15. In the early stages, the symptoms of PH are usually very mild and nonspecific, making it difficult to identify patients who are developing PH. In patients with SSc, coexisting organ involvement such as interstitial lung disease or myocardial fibrosis makes the diagnosis of PH even more challenging. The limitations of ESC/ERS guidelines highlight the need for alternative approaches to improve the selection of patients referred for RHC: the gold standard test for diagnosing PAH. The DETECT16 and ASIG algorithms17 were developed for this purpose and they outperform the ESC/ERS guidelines, with a high sensitivity, the most important feature for a screening algorithm. But these algorithms are not sufficient and were not developed to identify other forms of PH. Nor do they consider other variables that may be relevant in clinical practice, for example, PVR. The TRV/TVIRVOT ratio addresses the major medical need in this patient population to improve the existing PH detection algorithms with its good performance for identifying SSc patients with PVR > 3 Wood units.
Doppler echocardiography is a recognized and useful tool for screening patients with SSc who have a high risk of developing PH16. However, despite good results, our correlation between TRV/TVIRVOT ratio and PVR determined by RHC was not as strong as Abbas, et al’s correlation, which reported R = 0.93 (95% CI 0.87–0.96)8. Because proper alignment of the ultrasound beam is a crucial factor in ensuring an accurate determination of TRV and TVIRVOT, this discrepancy illustrates the variability of the measure in clinical practice. These results emphasize that the measures need to be carried out by trained operators. The echocardiographer’s experience is crucial to accurately identify the tricuspid regurgitation jet on the ultrasound and therefore to detect PH. The tricuspid gradient may be underestimated if the ultrasound beam is not properly aligned with the regurgitation jet or if its signal is weak. Notably, the quality of the tricuspid regurgitation jet recording was only suitable for reliable measurement in 59–73.5%, but this figure reached 86% when the Doppler evaluation was performed by a highly experienced echocardiographer18. In SSc cohorts, TRV was recorded by a highly experienced echocardiographer in 81.5–83%16,19,20. Current guidelines confirm the need to rely on an experienced sonographer7. We can also assume that the reliability of the measurement varies from one population to another, and justifies confirming the technique for each population, as we did for patients with SSc. However, despite this difference between case series, our results highlight that TRV alone (and by extension, right ventricular–to right atrial pressure gradient and PASP) is less efficient than a combined index such as TRV/TVIRVOT ratio to predict PVR > 3 in patients with SSc. As previously proposed and in accordance with our results, an elevated PVR is suggested in patients with increased PASP on Doppler echocardiography and TRV/TVIRVOT > 0.28.
Cardiac involvement in SSc can lead to postcapillary (group 2) PH, defined by an increased PCWP. In clinical practice, estimating the left ventricular filling pressure is challenging and some studies suggest that echocardiographic tools used in daily practice lack accuracy21,22. Consequently, we think that direct estimation of PVR is of major interest. While RHC would still be needed to confirm PH and to differentiate group 1 and group 2 PH in patients with SSc, our study suggests that TTE could be a useful tool for estimating PVR in patients with both SSc and PH, and could be considered as a way to noninvasively monitor their response to treatment. Further studies assessing the ability of echocardiography to monitor PVR in patients with SSc and PH under treatment will be needed to permanently anchor transthoracic echocardiography in clinical practice, and to prevent RHC.
This study has all the limitations associated with retrospective, single-site, and small sample studies. A few other limitations should be considered. First, invasive and noninvasive measurements were not performed simultaneously: simultaneous echocardiogram measurements could have become inaccurate owing to suboptimal positioning of the patient during RHC. However, 24 h between the echocardiogram and catheterization seems acceptable. Second, because of the retrospective design of our study, all the echocardiograms were not performed by the same operator. As discussed above, because proper alignment of the ultrasound beam is crucial to ensure an accurate determination of flow velocities, we can suppose that prospective design could lead to better results and greater accuracy. Finally, the formula evaluated was derived from the data on which it was then tested, which include a small number of patients without PH and patients who already had RHC and definite PH. Accordingly, reliability of the TRV/TVIRVOT ratio may be restricted to patients with PH, and in turn was not sensitive enough to select patients with borderline PH23,24. Consequently, the formula should be validated in a large prospective study with an independent population and a significant number of patients in whom PH would be ruled out.
Transthoracic echocardiography with the TRV/TVIRVOT ratio is a useful screening test for estimating PVR in SSc patients with suspected PH. This noninvasive tool requires further invasive investigation to confirm its accuracy on larger cohorts and its suitability for monitoring response to treatment.
- Accepted for publication November 13, 2018.


