


Abstract
Hygroscopic salts within the Martian regolith may actively participate in the near-surface water cycle by exchanging water vapor via solid-state salt hydration and deliquescence. To elucidate this process, experimental work has constrained the phase diagram of Mars-relevant salts and the stability of the resultant brines. However, salt interactions with a Mars-like regolith, which itself can exchange water vapor with the atmosphere via adsorption, has not yet been well explored. Here, to better understand water exchange with a salty Mars-like regolith and, particularly, the potential to form brines, we have conducted a series of experiments using JSC Mars-1 regolith simulant mixed with calcium perchlorate in a Mars simulation chamber at a temperature <5°C and a relative humidity <20%. During the experiments, we measured the sample mass, as well as the temperature and relative humidity of the sample and the chamber. We found that the water uptake of a salty Mars-like regolith is about twice as fast as that of a salt-free regolith. Furthermore, we found evidence to suggest that deliquescence occurred; however, not all the salt within the sample may have entered solution. The amount of water in solution was small and did not lead to regolith darkening. Our results suggest that, under the tested experimental conditions, salt deliquescence and regolith adsorption can occur simultaneously.
Export citation and abstract BibTeX RIS

Original content from this work may be used under the terms of the Creative Commons Attribution 4.0 licence. Any further distribution of this work must maintain attribution to the author(s) and the title of the work, journal citation and DOI.
1. Introduction
The most sought-after requirement for present-day Martian habitability is the existence of liquid water. Recent work has shown that present-day conditions may allow for stable brines on its surface and shallow subsurface, though only for a small fraction of the year (Chevrier et al. 2020; Rivera-Valentín et al. 2020). Indeed, several in situ and orbital observations have suggested the potential presence of liquid on the Martian surface. The Phoenix lander, which was dedicated to the study of water in the polar regions, found evidence in support of transient liquids in the regolith through dielectric measurements (Stillman & Grimm 2011) and the heterogenous distribution of salts in the regolith (Cull et al. 2014), as well as potential direct observations of brine droplets on the lander struts (Rennó et al. 2009). Meteorological observations at the Mars Science Laboratory (MSL) rover landing site in Gale crater suggested that the surface conditions would permit the formation of perchlorate brines (Martin-Torres et al. 2015), though only in specific terrain units and for a short time (Rivera-Valentín et al. 2018). Observed active and seasonal flow features on crater walls, such as recurring slope lineae (RSL), have furthered the idea of present-day liquid formation (McEwen et al. 2011; Chevrier & Rivera-Valentin 2012; Levy 2012; Grimm et al. 2014; Heinz et al. 2016); however, a purely or mostly dry flow process cannot be ruled out (Edwards & Piqueux 2016; Dundas et al. 2017; Schmidt et al. 2017; Dundas 2020; Gough et al. 2020).
The formation of brines requires salts, a source of water, which can be subsurface ice or atmospheric water vapor, and appropriate temperatures to reach the eutectic. The Mars Odyssey Gamma Ray Spectrometer revealed the presence of abundant subsurface hydrogen interpreted as ice (Boynton et al. 2002; Feldman et al. 2004), which was confirmed in situ by the NASA Phoenix lander (Mellon et al. 2009). Additionally, the ExoMars Trace Gas Orbiter identified high water equivalent hydrogen content in several regions on Mars, including within Valles Marineris (Mitrofanov et al. 2022). Furthermore, widespread, shallow water ice, including surface exposed ice within craters in the midlatitudes, has been documented (Dundas et al. 2018; Piqueux et al. 2019; Morgan et al. 2021). Melting of ice has therefore been considered a possible mechanism for brine formation on Mars (e.g., Chevrier & Rivera-Valentin 2012; Fischer et al. 2014); however, this process would be limited to locations with shallow subsurface ice and constrained to quickly freezing in cold polar temperatures and rapid evaporation and boiling at midlatitude temperatures (e.g., Chevrier & Altheide 2008; Chevrier et al. 2019, 2020). Experimental work replicating near-surface diurnal conditions at the Phoenix landing site, though, have found that stable liquid formation can occur rapidly through melting (Fischer et al. 2014, 2016).
A potential formation pathway for brines on Mars is deliquescence (Zorzano et al. 2009; Gough et al. 2011, 2014; Nuding et al. 2014), the transition from a solid salt crystal into an aqueous solution when exposed to a humid atmosphere. Some experiments, though, suggest that under the Mars-relevant pairing of temperature and relative humidity the kinetics of deliquescence may be too slow to form brines (Fischer et al. 2014). Furthermore, salts in the regolith would be competing in a hyperarid environment for water vapor against other processes, such as adsorption (Zent et al. 1993; Chevrier et al. 2008; Rivera-Valentín & Chevrier 2015; Savijärvi et al. 2020) and solid-state salt hydration (Vaniman et al. 2004; Gough et al. 2020). These processes are dependent on water availability and temperature to different extents. As water vapor diffuses in a porous regolith, low-energy collisions with grains lead to the adsorption of water molecules (Langmuir 1932). Generally, water vapor adsorption is facilitated at low temperatures and high humidity, while at high temperatures and low humidity adsorbed water molecules readily desorb back into the local atmosphere. Solid-state salt hydration occurs when water is incorporated into a salt's crystal structure. This process is facilitated at lower temperatures and higher humidity. On the reverse end, dehydration occurs at high temperature and low humidity. Deliquescence occurs when the ambient temperature is above the eutectic, and the relative humidity with respect to liquid (RHl ) is above a threshold termed the deliquescence relative humidity (DRH). Although thermodynamically the solution effloresces once RHl < DRH, experiments have shown that a metastable solution persists until a much lower efflorescence relative humidity (ERH) is reached (e.g., Nuding et al. 2014). Such dynamics of water vapor through atmosphere–regolith interactions, particularly at short timescales, remains largely unexplored.
Experimental work so far has focused on defining the phase space for Mars-relevant brines, e.g., their stability and formation with respect to freezing, evaporation, deliquescence, efflorescence, and boiling. The interaction of processes occurring in the regolith and their effects on deliquescence, though, have not been well explored. Primm et al. (2018) found that the deliquescence of magnesium perchlorate was not hindered at the grain scale by a Mars-relevant regolith analog (montmorillite and Mojave Mars Simulant) for temperatures >−53°C. Nikolakakos & Whiteway (2018) found that at the small, grain scale deliquescence can occur when magnesium perchlorate is mixed with quartz sand or chabazite and results in grain darkening at moderate humidities (i.e., relative humidity with respect to liquid on the order of 50%).
In our work, we seek to investigate the effect of the Mars-relevant regolith analog JSC Mars-1 on the deliquescence of calcium perchlorate at the macroscale under low relative humidity conditions. To determine these processes, real-time deliquescence experiments in a shallow regolith column were conducted in the Mars Ares simulation chamber, at the W. M. Keck Laboratory for Planetary Simulation at the University of Arkansas Center for Space and Planetary Sciences. The chamber can simulate Martian temperature, pressure, and atmospheric composition. A series of experiments were conducted, which focused on determining water vapor transfer and potential deliquescence by mass, temperature, and relative humidity between the atmosphere and a layer of JSC Mars-1 regolith simulant with varying concentrations (0–5.5 wt.%) of calcium perchlorate Ca(ClO4)2. The experiments were conducted to understand the range of conditions over which deliquescence may readily lead to brine formation in a realistic regolith environment at a macroscale level.
2. Methods
2.1. Chamber
Experiments were conducted in the Ares simulation chamber (Figure 1), which is approximately 1 m tall and 0.6 m wide and made of stainless steel. The lower portion is surrounded by coils for cooling and then insulated with ceramic. The lid is raised and lowered by a motor and bolted down to the base for a vacuum seal during experiments. The chamber has an array of three Vaisala hygrometers (identical to those on board the MSL Curiosity Rover) wired to a Fuji Electric digital output with an accuracy of 0.3% for measurements of relative humidity with respect to liquid, four Omega thermocouples accurate within 1.1°C, an Ohaus Ranger 7000 laboratory balance with 0.01 g accuracy, and an LED light. All the feed-through ports for the equipment were replaced with stainless steel flanges for low-pressure experiments. This eliminated air leaks present at various access points around the chamber, allowing us to reach 3 mbar. The chamber also has an input and output connected to a Sterling chiller, which pumps an ethylene glycol mixture through the cooling coils surrounding the chamber (allowing a minimum temperature of −13°C). Lastly, there are two feed-through ports, which accommodate a vacuum pump, to achieve a desired pressure range, and gas exchange for continuously exchanging the atmosphere with CO2.
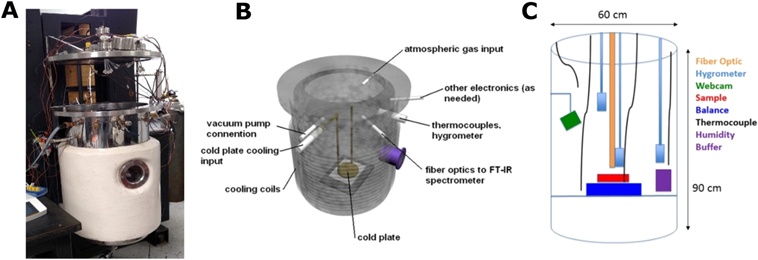
Figure 1. Picture and schematic of the Ares Mars simulation chamber and the components that were used to conduct the experiments. (a) Picture of the Ares chamber with the lid open. (b) Schematic of the chamber and the location of the ports. Also illustrated is the location of the chiller coils. (c) Schematic of the inside of the chamber. The diagram shows the location of the hygrometers, thermocouples, sample, scale, and humidity buffer.
Download figure:
Standard image High-resolution image2.2. Experimental Protocol
A suite of 11 experiments were conducted (Table 1) in the Ares Mars simulation chamber. Six of the experiments were controls: two with an empty dish, two with 2 mm of JSC Mars-1, and two with a petri dish filled with 64.5 g of pure calcium perchlorate (CaClO4)2. The controls were conducted at a temperature of 1.5°C and 4°C. Each of the controls was run in duplicates. We conducted three deliquescence experiments at temperatures of approximately 4°C. An additional two deliquescence experiments were run for longer time frames than the previous experiments, one at 24 hr and the other at 48 hr. All deliquescence experiments were conducted with 2 cm of JSC Mars-1 and varying abundances of calcium perchlorate (1–5.5 wt%; Table 1). We considered the start of the experiment the point when the chamber reached 600 Pa.
Table 1. Detailed List of All Experiments, Including the Controls
| Experiment # | Wt% of Calcium Perchlorate | Temperature (°C) | Time (minutes) | Relative Humidity at Sample (%) | Sample Thickness | Deliquescence Expected during Experiment? | Deliquescence Visibly Seen/ Changes in Salt Properties | Mass Change (g) | Water Vapor Pressure Gradient |
|---|---|---|---|---|---|---|---|---|---|
| 1 | 0 | 1.5 | 420 | 7.4 | 0 cm | N/A | N/A, N/A | −0.03 ± 0.04 | N/A |
| 2 | 0 | 3.5 | 640 | 18.5 | 0 cm | N/A | N/A, N/A | −0.05 ± 0.06 | N/A |
| 3 | 0 | 1.5 | 407 | 7.1 | 2 cm | N/A | N/A, N/A | −0.45 ± 0.04 | N/A |
| 4 | 0 | 3.5 | 418 | 19.7 | 2 mm | N/A | N/A, N/A | 0.17 ± 0.04 | N/A |
| 5 | all salt | 1.5 | 428 | 7.4 | 2 mm | No | No, No | −0.12 ± 0.04 | Positive |
| 6 | all salt | 3.5 | 332 | 19.2 | 2 mm | Yes | Yes, Yes | −0.03 ± 0.03 | Negative |
| 7 | 1.0 | 4.0 | 306 | 10.0 | 2 cm | No | No, No | 0.33 ± 0.03 | Positive |
| 8 | 0.97 | 4.0 | 274 | 20.4 | 2 cm | Yes | No, No | 0.11 ± 0.03 | Negative |
| 9 | 5.5 | 4.0 | 384 | 21.5 | 2 cm | Yes | After Exp., Yes | 0.23 ± 0.04 | Negative |
| 10 | 5.2 | 4.5 | 1404 | 21.8 | 2 cm | Yes | After Exp., Yes | 1.08 ± 0.14 | Negative |
| 11 | 5.3 | 5.0 | 2926 | 20.5 | 2 cm | Yes | After Exp., Yes | 3.55 ± 0.29 | Negative |
Note. Lists the experiment number, weight percent of calcium perchlorate, temperature of the sample, experimental run time, relative humidity at the sample, and thickness of the sample. The table also indicates whether deliquescence was expected to occur during the experiment, whether there was evidence of deliquescence visibly during or after the experiment via regolith darkening, changes to the salt properties, mass change with errors, and positive or negative water vapor gradient.
Download table as: ASCIITypeset image
2.3. Protocol with Chiller
The chamber is initially chilled for at least 24 hr before an experiment starts. A lithium chloride humidity buffer was placed in the chamber, near the sample, and chilled with the chamber (Figure 2). The buffer creates stable humidity in the chamber, maintaining an average humidity of 11.2% ± 0.5% at 0°C in the atmosphere. Samples were prepared while the chamber was cooling. The regolith was baked for 24 hr above 100°C in a glass petri dish to eliminate as much water as possible from the sample. The regolith was quickly removed from the oven and placed in a desiccator, which was pulled to vacuum for 12 hr. At the 12 hr mark, the desiccator was closed and removed from the vacuum pump. The closed desiccator was moved to a freezer to cool to −25°C, so the sample can be at a similar temperature to the chamber. The calcium perchlorate was prepared in a similar way. The salt is placed in a desiccator and pulled to vacuum for 24 hr. The salt was not sieved or crushed. In order to approximate Mars-like conditions, the experiment was conducted agnostic of grain size since, as was seen by the Phoenix lander, salts in the Martian regolith vary in grain size. We note that the salt ranged in grain size from ∼1 to ∼20 mm based on measurements from a grain size chart. The desiccator was then closed, removed from the vacuum pump, and then moved to the freezer.
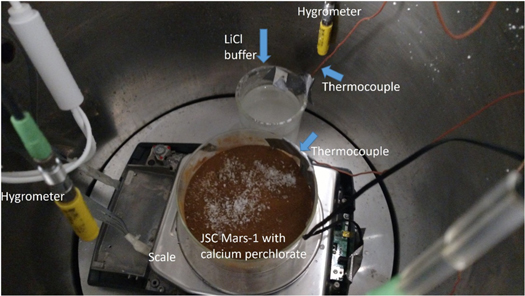
Figure 2. Picture showing the sample within the Ares Mars simulation chamber. The sample is in the middle of the chamber, sitting on top of the scale. The sample petri dish has the thermocouple secured in place directly above the sample's surface. The LiCl humidity buffer, seen directly next to the sample, also had a thermocouple secured directly above the saturated solution. The thermocouples that measured the upper and lower atmosphere of the chamber are not visible in this image. The three hygrometers are visible in this picture. As the lid closes on the chamber, the hygrometers move into place, with one directly above the sample, one directly above the humidity buffer, and one high in the chamber to measure the upper atmosphere humidity.
Download figure:
Standard image High-resolution imageOnce all samples were prepared and in the freezer cooling and the chamber was at the appropriate conditions, the chamber was pulled to vacuum and then filled with CO2. Once the pressure was back to 1 bar, the chamber lid was unbolted and the lid raised. The regolith was removed from the desiccator and weighed. The salt was also weighed to the correct wt% and then evenly mixed into the regolith. The sample was then placed in the chamber onto a scale, which measures mass with an accuracy of 0.01 g throughout the experiment. Additionally, thermocouples and hygrometers were placed in the sample before the lid was quickly closed. Although the sample was briefly exposed to the local atmosphere, exposure time was less than 120 s, and the chamber is filled with CO2 to help prevent further water contamination. Given the conditions in the desiccator, we expect the salt's hydration phase to be anhydrous. However, as soon as the sample was removed, the salt was exposed to the atmosphere. During this time, and given previous experimental results on the hydration state changes of calcium perchlorate (Gought et al. 2019), we expect the hydration state to likely be the tetrahydrate Ca(ClO4)2 · 4H2O. The chamber lid was lowered and bolted down. The chamber was then pulled to vacuum, and CO2 gas was fed into the chamber, maintaining a pressure of 6 mbar. These experiments run completely autonomously without any interference, from 6 to 48 hr.
The array of thermocouples and hygrometers measure temperature and relative humidity throughout the chamber: one thermocouple and one hygrometer each at the humidity buffer, the sample, and in the upper atmosphere. There is an additional thermocouple placed at the bottom of the chamber to measure the temperature of the lower atmosphere. Temperature and humidity readings were recorded every minute. Mass measurements were recorded every 2 minutes. Optical pictures were also taken before and after the experiment. The pictures helped with visual inspection of the sample to identity darkening induced by regolith wetting, such as in the experiments by Heinz et al. (2016).
3. Results
3.1. Control Experiments
Two sets of controls were conducted: one with a LiCl buffer, which controlled the RH in the chamber to around 20% near the sample, and one without, which reduced the RH in the chamber to <7% near the sample. Each control set consisted of an experiment with just an empty petri dish, one with just JSC Mars-1, and one with pure calcium perchlorate. Experiments 1, 3, and 5 were controls with no humidity buffer; Experiments 2, 4, and 6 were controls with the LiCl buffer (Table 1).
In the no humidity buffer control experiments we were able to determine that the scale had a slight decrease of mass over time (0.0001 g minute−1). In both the empty petri dish (Experiment 1) and pure calcium perchlorate (Experiment 5) experiments the read-out mass consistently decreased 0.0001 g minute−1. For the control with JSC Mars-1 (Experiment 3), the mass decreased by 0.001 g minute−1. The faster mass loss of the regolith-only control may be due to desorption of any remaining adsorbed water on the regolith grains. Given the measured mass loss over time of the scale, we consider the uncertainty in measured mass change as the sum in quadrature of the scale's accuracy (0.01 g) and the expected mass change of the scale over time (i.e., 0.0001 g minute−1 ∗ the run time of the experiment).
The regolith-only control experiment with the humidity buffer (Experiment 4) had a mass increase and stable humidity. The control at 4°C with the LiCl buffer had a relative humidity of 19.70% (i.e., 158.6 Pa of atmospheric water vapor). The mass increased by 0.17 ± 0.04 g. The mass change stabilized toward the end of the experiment (418 minutes). The regolith-only control without a humidity buffer (Experiment 3) lost mass the entire experiment. The control at 1.5°C without the buffer had a relative humidity of 7.1% (i.e., 158.6 Pa of atmospheric water vapor). The mass decreased by 0.45 ± 0.04 g. Both control sets were used to better interpret the deliquescence experiments.
For the experiment with the petri dish filled with 64.5 g of pure calcium perchlorate with the LiCl buffer (Experiment 6), the salt crystals had noticeable differences at the end of the experiment compared to when the experiment started. The salt crystals were transparent and appeared semidissolved (Figures 3(a)–(b)). We infer this as evidence in support of deliquescence occurring in the experiment at a temperature of 4°C and relative humidity with respect to liquid of 19% (i.e., 153 Pa of atmospheric water vapor). This implies that pure calcium perchlorate is capable of deliquescing in the chamber under the temperature and humidity conditions of our experiments. Indeed, these conditions are within those known to have led to deliquescence in prior experiments (e.g., Nuding et al. 2014). At the temperature of this experiment, the DRH of calcium perchlorate is predicted to be 10%. The control experiment without the buffer (Experiment 5) did not have any noticeable differences between the beginning and end of the experiment (Figures (c)–(d)), as expected.

Figure 3. (a) Picture of calcium perchlorate control with LiCl buffer (Experiment 6) before the experiment. (b) Picture of calcium perchlorate with LiCl buffer (Experiment 6) after the experiment. The blue and purple stars are references to the same salt crystals. The red circle is the main area of interest, where deliquescence can be seen in panel (b). This is evident from the change in color of the salt, with the salt becoming more transparent. The salt crystals also reduced in size. (c) Picture of calcium perchlorate control with no buffer (Experiment 5) before the experiment. (d) Picture of calcium perchlorate with no buffer (Experiment 5) after the experiment. The green and pink stars are references to the same salt crystals. There was no visible evidence that deliquescence occurred during this experiment. The salt crystals were the same color and size in the after picture as they were in the before picture.
Download figure:
Standard image High-resolution image3.2. Deliquescence Experiments
We conducted a total of five experiments with calcium perchlorate mixed with regolith to test for deliquescence by mass change and visual inspection, specifically by grain darkening due to wetting. These experiments were conducted at a temperature range of 3.5°C–5°C and humidity range of 10%–21.7%. At these temperatures, the predicted DRH would be between 8% and 10%. In Figure 4, we summarize the average temperature and relative humidity with respect to liquid throughout each experiment on the phase diagram of calcium perchlorate. The phase diagram shown is from Rivera-Valentín et al. (2018, 2020), which incorporates both the experimental results and modeling work of Nuding et al. (2014). In particular, the theoretical DRH line from Nuding et al. (2014) is adjusted to have the experimentally verified eutectic temperature of calcium perchlorate (∼198 K). The ERH line shown is a fit to the experimental ERH data from Nuding et al. (2014). As can be seen from the diagram, four out of the five experiments reached and maintained conditions that would have permitted deliquescence, and one experiment was close to the expected needed conditions to deliquesce.
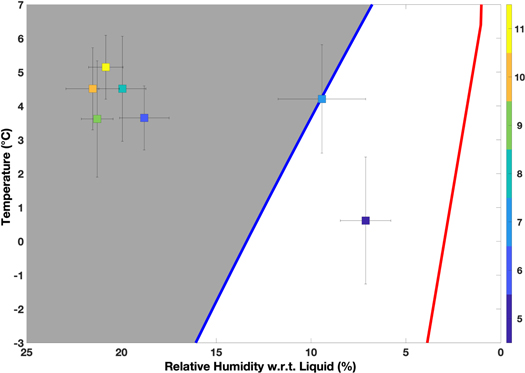
Figure 4. Deliquescence phase diagram of calcium perchlorate with the average (squares) and standard deviation (black horizontal and vertical bars) of the temperature and relative humidity of our experiments, color-coded following the color bar on the right side. The blue line is the DRH, and the red line is the ERH. The gray space indicates the conditions that would permit deliquescence to occur. Five of our experiments were in conditions that should have allowed deliquescence to occur. Four of those were Ca(ClO4)2 mixed with JSC Mars-1 experiments (Experiments 8–11), and one was the Ca(ClO4)2 only with the humidity buffer (Experiment 6). One experiment was not in conditions that would permit deliquescence to occur (Experiment 5, the Ca(ClO4)2 only without the humidity buffer), and one was on the DRH line (Experiment 7) but was considered not in conditions indicative of deliquescence.
Download figure:
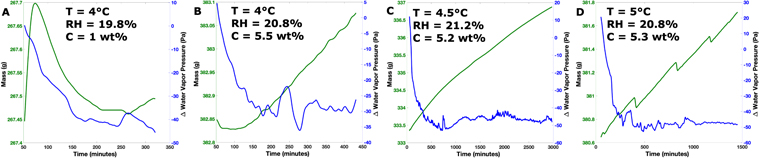
Standard image High-resolution imageThe experiment that was close to DRH conditions (Experiment 7), which had 1 wt% salt, increased in mass by 0.33 ± 0.03 g. This mass increase is comparable to the mass change of the regolith-only control experiment. The chamber temperature was 4°C, and the sample relative humidity increased from 6% up to 10% after 100 minutes and then held constantly at 10% throughout the experiment. At the same time, the water vapor pressure just above the sample increased from 41 to 76 Pa and then steadily increased to 86 Pa (Figure 5). On the other hand, the chamber water vapor pressure steadily increased throughout the experiment from 124 to 158 Pa. In this experiment, the water vapor pressure gradient, from the sample to the atmosphere, was positive (i.e., smaller at the sample than in the atmosphere) and nonzero throughout the experiment, and thus the water vapor flux is expected to be into the sample.
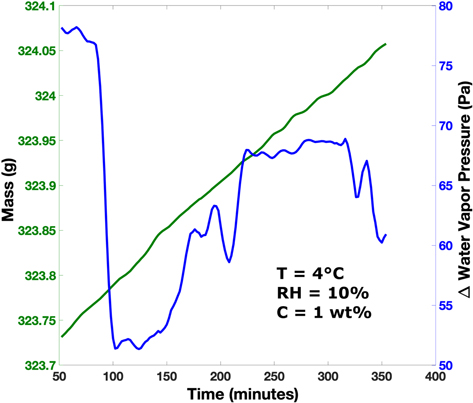
Figure 5. Mass vs. time (left and green) and water vapor pressure gradient (right and blue) for the experiment that was under conditions that would not permit deliquescence (Experiment 7). The experiment had a positive water vapor pressure gradient, meaning that there was more water vapor in the atmosphere than in the sample. This gradient would result in water vapor diffusion into the sample and should result in mass increase over time.
Download figure:
Standard image High-resolution imageTwo of the four experiments where the chamber conditions should have led to deliquescence (Experiments 8 and 9) were conducted for at most 7.5 hr. The experiment with 1 wt% salt and at a temperature of 4°C (Experiment 8) started at a relative humidity of 18% before increasing to 20.5% and experienced a mass increase of 0.11 ± 0.03 g. The water vapor pressure above the sample increased from 127 to 180 Pa, while the water vapor in the atmosphere increased from 129 to 140 Pa before decreasing back down to 133 Pa. Experiment 9, which had 5.5 wt% calcium perchlorate mixed with regolith, was at 4°C and had a mass increase of 0.23 ± 0.04 g (Figure 6(a)). The sample's humidity started at 19.5% and increased to 21.6% (Figure 6(b)). The water vapor pressure above the sample increased from 125 to 180 Pa, while the water vapor in the atmosphere increased from 131 to 155 Pa. In both experiments there was a negative water vapor pressure gradient between the sample and atmosphere (i.e., higher at the sample than the atmosphere), indicating that the flux of water vapor would be from the sample to the atmosphere; however, both experiments experienced a mass increase. Additionally, we note that in both experiments the sample started at a temperature between 0.9°C and 2.2°C and the temperature increased until it reached equilibrium with the upper atmosphere (∼4°C; Figure 6(c)).
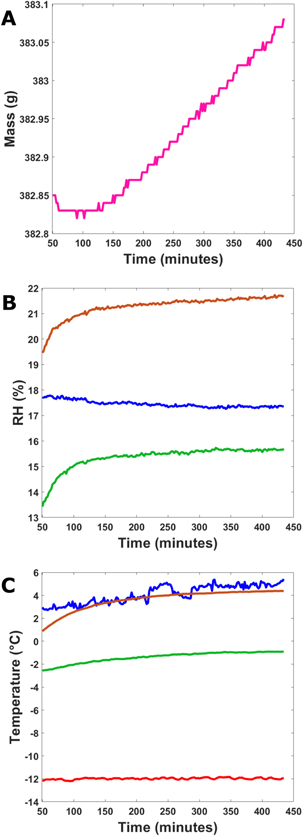
Figure 6. Measured (a) mass, (b) relative humidity with respect to liquid, and (c) temperature change over time for Experiment 9. This experiment was run for 7.5 hr at 4°C, with a sample of 2 cm of JSC Mars-1 mixed with 5.5 wt% calcium perchlorate. For panels (b) and (c), blue represents the upper atmosphere, red the lower atmosphere, green the humidity buffer, and orange the sample. The sample had the highest relative humidity in the chamber. However, all three locations followed the same trend with humidity. For most of the experiment the sample and upper atmosphere were at similar temperatures. The buffer was cooler, and the lower atmosphere had the lowest temperature remaining at almost a constant −12°C.
Download figure:
Standard image High-resolution imageAlthough deliquescence was expected during these experiments, and they both indeed experienced mass gain, there was no visible evidence of regolith darkening at the end of the experiments. However, at the end of Experiment 9 the exposed salts at the surface of the petri dish appeared more translucent, and some grains had visibly become smaller. After it was removed from the chamber, there was visible regolith darkening in Experiment 9 within 5 minutes of exposure to ambient conditions (∼65% RH, 23.9°C; Figures 7(a)–(c)). Additionally, we note that after 30 minutes of being out of the chamber, approximately half of the surface calcium perchlorate had deliquesced, while none of the salt below the surface (a few millimeters) showed any visible wetness on the sides of the petri dish. In contrast, Experiments 7 and 8 did not show regolith darkening when removed from the chamber and exposed to terrestrial conditions for at least the hour that they were monitored.
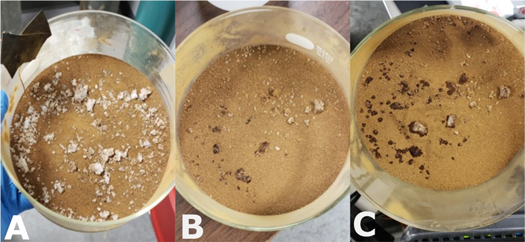
Figure 7. Evidence of deliquescence after Experiment 9 was removed from the chamber and exposed to ambient conditions. (a) Sample directly after the experiment ended and being removed from the Mars simulation chamber. (b) After 5 minutes, regolith darkening started to occur, as seen by the darker color around some salt crystals on the lower left quarter of the petri dish. Of note, regolith darkening around the salt was not apparently associated with crystal size. It occurred for both large and small exposed salt crystals. (c) Here ∼80% of the surface salt had deliquesced and had regolith darkening around the salt crystal after 30 minutes. Of note, there was an apparent preference for the location of deliquescence. Salts with associated regolith darkening are primarily located in the lower left corner of the petri dish. We did not observe an association between the preference in the petri dish and location/orientation in the chamber (e.g., proximity to the buffer).
Download figure:
Standard image High-resolution imageFischer et al. (2014) found that bulk deliquescence may not be rapid enough to occur on the timescales of a Martian sol under the low temperature and relative humidity conditions experienced at the Phoenix landing site. Given that there was no visible evidence for grain wetting in our short experiments, we also conducted two experiments for 24 and 50 hr (Experiments 10–11; Table 1). Both experiments were under conditions that should have permitted deliquescence of calcium perchlorate. The experiment with 5.3 wt% salt and at a temperature of 4°C (Experiment 10) started at a relative humidity of 17% and increased to 22% before slowly decreasing and leveling out at 21%. Experiment 10 experienced a mass increase of 1.08 ± 0.14 g. The water vapor pressure above the sample increased from 111 to 182 Pa, while the water vapor in the atmosphere increased from 134 to 145 Pa, with multiple oscillations, before decreasing back down to 132 Pa. Experiment 11, which had 5.2 wt% calcium perchlorate mixed with regolith, was conducted at 5°C and had a mass increase of 3.55 ± 0.29 g (Figure 8(a)). The sample's humidity started at 18.5% and increased to 21.5% before slowly decreasing and leveling out at 20.5% (Figure 8(b)). The water vapor pressure above the sample increased from 126 to 185 Pa, while the water vapor in the atmosphere increased from 138 to 145 Pa, with multiple oscillations, before decreasing back down to 136 Pa. There was a negative water vapor pressure gradient between the sample and atmosphere in both experiments, which would indicate that the expected flux of water vapor would be from the sample into the atmosphere. In both experiments the sample started at a temperature between 1.2°C and 1.6°C and the temperature increased until it reached equilibrium with the upper atmosphere (∼5°C; Figure 8(c)). Generally, the only difference between these two experiments was the 0.1 wt% of salt.

Figure 8. Measured (a) mass, (b) relative humidity with respect to liquid, and (c) temperature change over time for Experiment 11. This experiment was run for 50 hr at 5°C, with a sample of 2 cm of JSC Mars-1 mixed with 5.3 wt% of calcium perchlorate. For panels (b) and (c), blue represents the upper atmosphere, red the lower atmosphere, green the humidity buffer, and orange the sample. The sample had the highest relative humidity in the chamber. However, all three locations followed the same trend with humidity. For most of the experiment the sample and upper atmosphere were at similar temperatures. The buffer was cooler, and the lower atmosphere had the lowest temperature remaining at almost a constant −12°C.
Download figure:
Standard image High-resolution imageAlthough there was no visible evidence at the surface of the sample for deliquescence via regolith darkening at the end of each experiment, there were indications that liquid formation had occurred within the sample. The salts on the surface of the petri dish in both experiments were different before and after. At the end of the experiments, some of the salts were noticeably more transparent and some of the grains were also smaller. There were also some dark regolith grains on top of some of the salt grains. Experiment 10 had some liquid droplets on the side of the sample dish, as well as some wetting within the sample that was visibly pressed up against the side of the glass (Figures 9(a)–(b)). It is interesting to note that there was no regolith darkening on the surface of the sample, though. When the regolith was dumped out of the sample petri dish, there was some wet regolith stuck to the bottom of the glass (Figure 9(c)). Additionally, the sample was observed under room-temperature conditions (∼65% RH, 23.9°C) and showed surface wetting after 17 minutes of being removed from the chamber (Figure 9(d)). After 27 minutes, nearly half of the surface salt had visible wetting around the calcium perchlorate (Figure 9(e)). On the other hand, Experiment 11, which was the longest run experiment and had 0.1 wt% less salt, showed no evidence of liquid formation on or within the sample via regolith darkening. After the sample was removed from the chamber, it showed wetting at the surface after 6 minutes of exposure to room-temperature conditions (∼65% RH, 23.9°C; Figures 10(a)–(b)). Nearly all the surface salt had deliquesced after 45 minutes (Figure 10(c)).
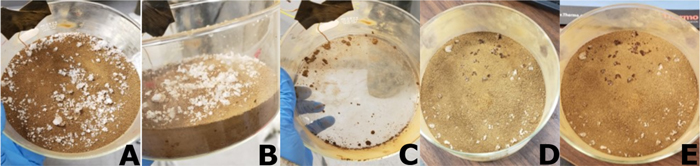
Figure 9. Evidence of deliquescence after Experiment 10 was removed from the chamber and exposed to ambient conditions. (a) Sample directly after the experiment ended and was removed from the Mars simulation chamber. There were no signs of regolith darkening on the surface. (b) Visible wetness on the edge of the petri dish and some regolith darkening buried in the regolith. This is the only location where regolith darkening was observed (c) Wet regolith was observed after the sample was moved to a different petri dish. (d) After 17 minutes, regolith darkening started to occur, as seen by the darker color around certain salt crystals in the upper half of the petri dish. (e) Here ∼40% of the surface salt had deliquesced and had regolith darkening around the salt crystal after 27 minutes. As with Experiment 9, the salts did not seem to deliquesce based on the grain size of the salt.
Download figure:
Standard image High-resolution image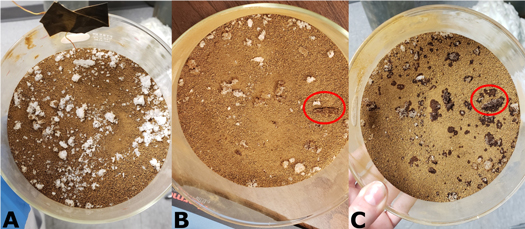
Figure 10. Evidence of deliquescence after Experiment 11 was removed from the chamber and exposed to ambient conditions. (a) Sample directly after the experiment ended and after being removed from the Mars simulation chamber. (b) Visible regolith darkening was observed within 6 minutes of being exposed to ambient condition. The large salt grain circled in red is wet and covered in a layer of wet regolith. There are a few smaller spots of darkening in the middle of the sample. (c) Here ∼90% of the salt on the surface had deliquesced and had regolith darkening around the salt crystal after 45 minutes. Almost all the salt that did not have regolith darkening surrounding it was near the edge of the petri dish in the upper left quadrant.
Download figure:
Standard image High-resolution image4. Discussion
Although the experiments that were under conditions that should have permitted the deliquescence of calcium perchlorate did not show evidence of grain wetting and darkening at the surface, they showed other lines of evidence that together suggested that deliquescence may have occurred. Mass increase is a great way to help identify water uptake by the salt and regolith system; however, it does not distinguish deliquescence from other processes, such as adsorption or solid-state salt hydration. Indeed, all five of the salty regolith experiments, including the experiment where no brine formation was expected, had a mass increase over the span of the experiments, ranging from 0.11 to 3.54 g. The rate of water uptake, though, was different between experiments. The regolith-only experiment (Experiment 4) on average increased in mass at a rate of 22 ± 5 mg hr−1. On the other hand, experiments with regolith and salt experienced on average a mass gain of 45 ± 18 mg hr−1, 2.05 ± 0.94 times higher than the regolith-only experiment. Furthermore, experiments where the conditions would have facilitated deliquescence and had more than 5 wt% salt experienced on average a mass gain of 52 ±16 mg hr−1. As such, the inclusion of salt in the regolith resulted on average in a measurable increase in the rate of mass gain, which we interpret as water vapor uptake through processes such as adsorption, solid-state salt hydration, and/or deliquescence.
The salt-only experiment in a humid chamber did not undergo an appreciable mass change (−0.03 ± 0.03 g over the experiment), yet we observed visible changes in the salt morphologies. The salt grains at the end of the experiment were transparent, less abundant, and semidissolved (Figures 3(a)–(b)). Similar changes were also observed for the experiments where deliquescence was expected given the conditions within the chamber. The little to no measured mass change, though, may indicate that water uptake was limited and occurred below our experimental uncertainty. Additionally, since a measurable mass change occurred with the regolith-only and salty regolith experiments, salt alone under low relative humidity conditions may not be an effective water vapor sink.
Together, the mass gain and salt morphology changes may suggest that deliquescence occurred during the experiments. However, the observed changes in salt morphology that did not lead to visible regolith darkening would suggest that liquid formation was limited. Under controlled conditions, brines should reach equilibrium with their local atmosphere such that the water activity (aw ) of the brine is associated with the local relative humidity with respect to liquid as aw = (RHl /100). This is because at this point the water vapor pressure just above the brine is equal to the local atmospheric water vapor (i.e., the water vapor gradient between the brine and atmosphere is zero, and evaporation is not active). The length of our experiments should have resulted in brines in near equilibrium with the local atmosphere. During the experiments where deliquescence should have occurred, the humidity conditions at the sample were in the range of 17% ≤ RHl ≤ 22%, which would suggest 0.17 ≤ aw ≤ 0.22. As such, the salt concentration within the potentially produced brines may have been 0.62 g g−1, assuming anhydrous calcium perchlorate. For example, if all the salt in the sample would have deliquesced, Experiment 10 should have resulted in 12 g of water in solution. However, only a 1 g increase in mass occurred throughout the experiment. This would imply that not all the salt in the sample had deliquesced. In fact, assuming that the mass change was attributed to only liquid formation, then about 8% of the salt, by mass, would have been in solution. This may have limited grain darkening, especially given that a significant part of the mass increase likely occurred owing to adsorption. Alternatively, the water activity of the resultant brines may have been lower than the equilibrium value. For the example of Experiment 10, this would lead to producing brines with a salt concentration of ∼0.95 g g−1, assuming that the 1 g mass increase was all due to water entering the liquid state. In light of the experimental work by Nikolakakos & Whiteway (2018), which did observe grain darkening but at higher humidity, our results imply that the required water activity to produce darkening is likely between 0.2 ≤ aw ≤ 0.5.
The limited water availability may also account for why some of the experiments that could have deliquesced in the chamber underwent visible grain darkening shortly after being exposed to ambient conditions while others did not. Experiments 9–11 experienced grain darkening on the surface after the experiment ended. In all three of these experiments the calcium perchlorate concentration was above 5 wt%. These experiments were also slightly warmer and had slightly higher relative humidity. These conditions allowed the salts to adsorb more water. Therefore, when the experiments were exposed to ambient conditions, the salts had less water to adsorb before deliquescing and causing the regolith to darken. Experiments 7 and 8 did not see regolith darkening within the hour after the experiments ended. Both experiments had only 1 wt% of calcium perchlorate. In addition, Experiment 7 had a relative humidity of ∼10%, limiting the water availability even more. The salts most likely did not have as much water adsorbed during the experiment and when exposed to ambient conditions had more water to adsorb before deliquescing and producing observable regolith darkening.
Of note, we found that in only the cases where deliquescence was possible within the chamber was the water vapor pressure gradient between the sample and the atmosphere negative (Figure 11), i.e., larger at the sample than the chamber's atmosphere. This should lead to mass loss, as the gradient would drive water vapor diffusion out of the sample, and yet there was appreciable mass gain for these experiments. Furthermore, the water vapor pressure gradient stabilized at the end of each experiment, with a difference between the sample and atmosphere of 30–50 Pa of water vapor pressure. For example, the longer experiments reached a gradient of 50 Pa within 10 hr and kept this gradient until the end of the experiment (>30 hr). Therefore, an active process at the sample that forces and maintains the chamber out of equilibrium is likely occurring. However, if water uptake was actively occurring throughout the experiment, then the water vapor pressure gradient should have been positive (i.e., larger in the atmosphere than above the sample) since a depletion process would have been active. We suggest that this observation, along with the above argument of the production of small amounts of liquid, may imply that water uptake by deliquescence did not occur throughout the experiment. Rather, it occurred near the beginning of the experiment when the gradient was positive and then ceased when the saturation vapor pressure of the resultant brine exceeded the ambient humidity. Indeed, in all experiments where deliquescence may have occurred, the initial water vapor pressure gradient was positive for the first hour. This may suggest that deliquescence happened for only a small fraction of the experiment run time and that most of the mass gain was due to adsorption by the regolith.
Figure 11. (a) Mass vs. time (left-hand side and green) and water vapor pressure gradient vs. time (right-hand side and blue) for the experiments that were under conditions that would have permitted deliquescence. At the beginning of all four experiments, the water vapor pressure gradient was positive. After the first hour, though, the gradient was negative. This was maintained for the rest of the experiment. This means that for most of the experiment run time there was more water vapor above the sample than in the atmosphere. The water vapor pressure gradient also increased and stabilized to between 30 and 50 Pa. If the chamber was in equilibrium, it should have stabilized out around 0 Pa. The change in the water vapor pressure was calculated using the RH hygrometer directly above the sample. Small fluctuations in mass (as seen in panel (d)) over time may have been caused by instrumentation, such as the vacuum pump turning on and off.
Download figure:
Standard image High-resolution image
5. Conclusion
We conducted experiments on the water uptake of a mixture of regolith, here specifically the JSC Mars-1 simulant, and calcium perchlorate under semi-Mars-like conditions to particularly test for the formation of brines at the macroscale. All samples were desiccated before use. Six controls were conducted, one set at low relative humidity (∼7%) and another at higher humidity (∼20%). Each set consisted of an experiment with an empty petri dish, a petri dish of JSC Mars-1, and a petri dish filled with calcium perchlorate. Five experiments were conducted mixing varying weight percent (1%–5.5%) of calcium perchlorate into 2 cm of JSC Mars-1 Martian regolith. Temperature, mass, and relative humidity were recorded throughout the experiments, and pictures of the sample were taken before and after the experiment for comparison.
We find that the rate of water uptake of a salty Mars regolith analog is nearly twice as high as that of our regolith-only experiments. This is likely due to additional active water vapor sinks in the salty regolith samples, such as solid-state salt hydration and/or deliquescence. Furthermore, our results imply that an adsorbing regolith does not outcompete salt-related water vapor sinks in a hyperarid environment. However, it is important to note that the chamber environment contained an order of magnitude more water vapor than what has been typically measured at the surface of Mars (∼100 Pa in the chamber compared to <10 Pa on Mars; Rivera-Valentín et al. 2020).
Out of five experiments conducted with a salty regolith sample, four occurred with chamber conditions that should have allowed deliquescence to occur. However, we did not identify regolith darkening on the surface of the sample in any of these experiments. Using our salt-only control experiment under humid conditions that should have led to the sample's deliquescence, we identified other diagnostic changes potentially indicative of a small amount of brine formation. Specifically, in this experiment some of the salts became translucent and appeared semidissolved. Such morphological changes of the salt grains also occurred in the salty regolith experiments that were expected to deliquesce given the chamber's temperature and humidity. Together, the measured mass change and observed morphological changes of the salt crystals suggest that deliquescence may have occurred but did not lead to regolith darkening. This contrasts the work by Nikolakakos & Whiteway (2018), which observed darkening but at higher relative humidity. Thus, together our work suggests that regolith darkening may only occur at high humidities, at least higher than 20% relative humidity with respect to liquid.
Furthermore, we noticed that only the experiments where deliquescence was expected had a negative water vapor pressure gradient (i.e., higher water vapor pressure at the sample than the atmosphere) for most of the experiment. Indeed, this gradient was retained for many hours (>24 hr) and stabilized at a difference of some 50 Pa. A negative water vapor gradient would suggest that mass loss from the sample should occur owing to diffusion; however, the samples had measurable increases in mass. We hypothesize that deliquescence occurred at the beginning of the experiment when the water vapor gradient was positive. It then ceased when the saturation vapor pressure above the resultant brines surpassed that of the ambient atmosphere. From this point forward, the active water vapor sink would have been adsorption by the regolith and potentially solid-state salt hydration. This process would also explain the small amounts of produced brines in the sample. Additional experiments under a broader set of conditions, and with the addition of measurements of sample wetness, such as through dielectric permittivity changes, are required to better understand this occurrence.
The kinetics of adsorption and deliquescence are experimentally not well constrained under Mars-relevant combinations of temperature and humidity. In our work, we found that the regolith-only experiments underwent much higher mass increases than the salt-only experiment. This may suggest that adsorption may act as a more effective water vapor sink than salt deliquescence in hyperarid conditions. However, more experiments are needed to understand the dependence of these processes over a broader range of environmental conditions (e.g., temperature and/or humidity). Additional experiments at cooler temperatures and lower water vapor are particularly needed to better characterize the potential of deliquescence under ideal Martian conditions. In particular, at colder temperatures, kinetics may reduce the possibility of deliquescence (e.g., Fischer et al. 2014); however, much like in our experiments, this may result in less of the salts in the Martian regolith deliquescing rather than no salt entering solution. Exposing complex subtleties in diffusion, adsorption/desorption cycles, and deliquescence processes on Mars, specifically the limits to which liquid formation is possible, has important implications for liquid stability and habitability near the surface, future missions to Mars, and the continuing search for liquid water.
This research was supported by NASA through the Habitable Worlds program under grant No. 80NSSC20K0227. Data behind the figures are available on FigShare at doi:10.6084/m9.figshare.19742437. The authors thank the two anonymous reviewers for their valuable feedback.