


Export citation and abstract BibTeX RIS
In the solar system, the segregation of terrestrial planets interior to the water condensation radius and giant planets beyond suggests the key role of this location (the "snow line") in planet formation, with consequences for the chemical composition of planets and the delivery of water to terrestrial bodies. The inferred location of the snow line is near 2.5 au in the solar nebula (Rivkin et al. 2002), and several theoretical predictions exist for the radius and evolution of the snow line in protoplanetary disks. However, there have been no direct measurements of its position.
One way to determine the snow line location is by measuring the radial extent of gaseous water interior to the condensation radius. While infrared water lines are commonly detected from classical T Tauri disks at radii less than a few au (e.g., Pontoppidan et al. 2010), they probe only the upper disk atmosphere, tracing the surface snow line (Blevins et al. 2016) but not the midplane snow line that is relevant for planet formation. In contrast, H2O transitions in the millimeter, where the dust opacity is far lower, can potentially measure water vapor closer to the midplane, especially if grains have settled toward the midplane.
Here we report a possible detection of mm-wave water emission toward a solar-mass pre-main-sequence star, which may represent a direct measurement of the water snow line. The classical T Tauri star AS 205N was observed with ALMA in Band 7 on 2017 May 6 in Cycle 4 program 2016.1.00549.S. The observations employed 47 antennas in the 12 m array with an on-source time of 31 minutes. The correlator configuration included three transitions: H2O (102,9 − 93,6) at 321.2257 GHz, H2 18O (51,5 − 42,2) at 322.4652 GHz, and HDO (33,1 − 42,2) at 335.3955 GHz, and a fourth 1.875 GHz wide window at 334.54 GHz for continuum imaging. The delivered pipeline-calibrated data were imaged with CASA v4.7.0. Phase-only self calibration on the combined continuum was applied to the whole data set. After continuum subtraction, the lines were imaged using Briggs weighting with robust = 0.5, giving a synthesized beam of 0 30 × 020.
The integrated intensity image of the 321 GHz H2O line toward AS 205N shows a weak spatially unresolved peak centered on the dust continuum emission (Figure 1). The spectrum shows a ∼3 mJy feature centered at the system velocity with a width of ∼25 km s−1. The peak signal-to-noise ratio is ∼3, and the integrated flux density has a signal-to-noise of ∼5. An outer emission radius can be estimated from the observed feature by assuming Keplerian rotation. For a stellar mass of 1 M☉, inclination i = 20°, and a radial temperature power law exponent between −0.5 and −1.0, a χ2 fit to the spectrum gives Rout = 1.8(±0.7) au.
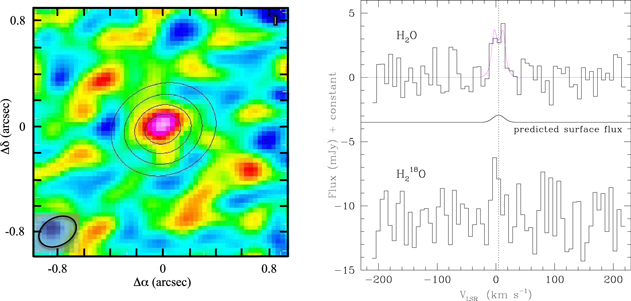
Figure 1. Left: Intensity image of the 321 GHz H2O line emission from AS 205N integrated from VLSR = −9 km s−1 to 18 km s−1. The peak is 79 mJy beam−1 km s−1 and the rms is 19 mJy beam−1 km s−1. Contours show the resolved disk continuum emission. Right: The 321 GHz H2O spectrum (top) binned to 6.8 km s−1. The vertical dotted line is the system velocity measured by its CO emission (Salyk et al. 2014). The magenta line is a Keplerian profile for Rout = 1.8 au. The predicted 321 GHz disk surface emission (black line), from a model fit to the mid-infrared water emission (Najita et al. 2018), is much weaker than the observed emission. The lower spectrum is at the position of the 322 GHz H2 18O line.
Download figure:
Standard image High-resolution image
The warm disk atmosphere that produces the mid-infrared water emission from AS 205N (Salyk et al. 2008, 2011) contributes negligible H2O emission at 321 GHz (Figure 1), suggesting that the mm-wave emission originates from water below the surface, deeper in the disk. If the 321 GHz H2O line is very optically thick, as seems likely, H2 18O would be a better probe of water closer to the disk midplane (see Notsu et al. 2018). The noiser H2 18O spectrum shows a hint of a line (Figure 1), but the integrated intensity map does not have a peak at the source position. The 2-σ integrated flux density limit is 60% of the H2O flux.
Interestingly, models of viscous disks predict a snow line location of 5–10 au (e.g., Garaud & Lin 2007; Min et al. 2011; Mulders et al. 2015) for the high accretion rate of AS 205N (3 × 10⁻⁷ M☉ yr−1, Najita et al. 2015). Our much smaller inferred radius of 1–2 au is instead consistent with a snow line for moderate accretion rates, as might be expected for a midplane "dead zone" experiencing low viscous heating.
To summarize, the properties of the tentative detection of H2O emission from AS 205N (line width, coincidence with the source position and velocity, and spatially unresolved) are consistent with water emission from within the snow line. This result requires confirmation, and with sufficient signal-to-noise to measure the line profile and attempt to detect H2 18O.