


Abstract
Black hole X-ray binaries exhibit different spectral and timing properties in different accretion states. The X-ray outburst of a recently discovered and extraordinarily bright source, Swift J1727.8–1613, has enabled the first investigation of how the X-ray polarization properties of a source evolve with spectral state. The 2–8 keV polarization degree was previously measured by the Imaging X-ray Polarimetry Explorer (IXPE) to be ≈4% in the hard and hard intermediate states. Here we present new IXPE results taken in the soft state, with the X-ray flux dominated by the thermal accretion disk emission. We find that the polarization degree has dropped dramatically to ≲1%. This result indicates that the measured X-ray polarization is largely sensitive to the accretion state and the polarization fraction is significantly higher in the hard state when the X-ray emission is dominated by upscattered radiation in the X-ray corona. The combined polarization measurements in the soft and hard states disfavor a very high or low inclination of the system.
Export citation and abstract BibTeX RIS

Original content from this work may be used under the terms of the Creative Commons Attribution 4.0 licence. Any further distribution of this work must maintain attribution to the author(s) and the title of the work, journal citation and DOI.
1. Introduction
Accreting stellar-mass black hole X-ray binaries (BHXRBs) represent ideal laboratories to study physics under extreme conditions of strong gravity. They are among the brightest X-ray sources in our Galaxy and have thus been very promising targets for the X-ray polarization mission Imaging X-ray Polarimetry Explorer (IXPE; Weisskopf et al. 2022). Most BHXRBs are transients, characterized by short (weeks to months) periods of activity during which they have been observed to show various spectral states, each characterized by distinct broadband spectral and timing properties (Zdziarski & Gierliński 2004; Done et al. 2007; Belloni 2010).
In the "hard" state, the spectrum displays a power-law shape arising from multiple Compton scatterings of low-energy photons within a hot medium, known as a hot accretion flow or a corona. Polarization in this state can be related to the scattering processes in the optically thin, flattened medium (Sunyaev & Titarchuk 1985; Poutanen & Svensson 1996) and is aligned with the minor axis of this medium. The polarization degree (PD) grows with the system inclination and energy and can achieve ∼15%–20% at high energies if the medium is viewed nearly edge-on. The first IXPE data on the hard-state systems revealed that the polarization signatures are largely consistent with these expectations (Krawczynski et al. 2022; Ingram et al. 2023; Veledina et al. 2023).
The "soft"-state spectrum resembles blackbody radiation and is attributed to a multitemperature blackbody component originating from an optically thick, geometrically thin accretion disk (Novikov & Thorne 1973; Shakura & Sunyaev 1973). Polarization in this case may arise from multiple scatterings in the optically thick medium—the disk atmosphere (Chandrasekhar 1960; Sobolev 1963; Rees 1975). In contrast to the optically thin case, the polarization is expected to be aligned with the disk plane in the case of pure electron scattering (complete ionization of the atmosphere), albeit in certain specific cases of nonzero absorption, polarization may become aligned with the disk axis (Loskutov & Sobolev 1979). In such cases, the PD is a growing function of inclination, reaching 11.7% for the edge-on pure electron-scattering atmosphere, but is generally expected to be smaller for the same viewing angle as compared to the optically thin, hard-state case.
The accretion disk is believed to extend down to the innermost stable circular orbit (ISCO), below which matter freely falls toward the black hole. The spectral shape is closely linked to the radius of the ISCO and, consequently, to the spin of the black hole. Additionally, the black hole spin affects the properties of X-ray polarization (Connors et al. 1980; Dovčiak et al. 2008; Schnittman & Krolik 2009; Loktev et al. 2024); thus, X-ray polarimetry serves as an independent tool for determining the black hole spin of BHXRBs in the soft state (Dovčiak et al. 2008; Taverna et al. 2020; Mikusincova et al. 2023), which has already been applied to the IXPE observations (Marra et al. 2024; Svoboda et al. 2024).
Previous IXPE observations of BHXRBs in the soft state include 4U 1630–47 (Kushwaha et al. 2023; Ratheesh et al. 2024), LMC X-1 (Podgorný et al. 2023), LMC X-3 (Svoboda et al. 2024), and 4U 1957+115 (Marra et al. 2024). LMC X-1 is a system with a low inclination angle (≈30°), and, as anticipated, it exhibited a low PD with an upper limit of around 1%. In contrast, LMC X-3 and 4U 1957+115 are systems with higher inclination (≈70°), and they displayed a higher PD of about 2%–4%. These sources showed an expected level of polarization consistent with the semi-infinite electron-scattering atmosphere of the standard geometrically thin optically thick accretion disk and thus allowed for the first time an estimation of the black hole spin via X-ray polarimetry. However, polarization measurements of 4U 1630–47 in the soft state revealed a surprisingly high level of polarization for the estimated inclination (i < 75°), exceeding 8%, and a significant increase of the PD with energy, posing challenges to this established scenario. The high X-ray polarization of this source was subsequently detected in the steep power-law state (Rodriguez Cavero et al. 2023).
The newly discovered BHXRB transient Swift J1727.8–1613 (R.A. 17:27:43.31, decl. −16:12:19.23) was initially detected on 2023 August 24 (Kennea & Swift Team 2023; Negoro et al. 2023), showing a remarkably intense outburst peaking at around 7 Crab in the 2–20 keV energy range. A comprehensive evaluation of the source characteristics strongly supports its classification as a BHXRB from its X-ray spectrum (Liu et al. 2023; Sunyaev et al. 2023; Peng et al. 2024), the identification of type C quasiperiodic oscillations (Bollemeijer et al. 2023; Draghis et al. 2023; Palmer & Parsotan 2023; Zhao et al. 2024), and the detection of flat-spectrum radio emission indicative of a compact jet (Bright et al. 2023; Miller-Jones et al. 2023). The presence of the black hole in this X-ray binary is also suggested from the optical spectroscopy (Mata Sánchez et al. 2024). They reported the detection of inflows and outflows during the outburst and also derived the distance of the source to be D = 2.7 ± 0.3 kpc, with the value and uncertainty estimated using various empirical scalings.
IXPE first observed this source on 2023 September 7, recording a PD of ≈4% (Veledina et al. 2023). The X-ray polarization was found to be roughly in the north–south direction with a polarization angle (PA) ≈ 2° east of north, which aligns with the submillimeter polarization (Vrtilek et al. 2023), as well as with the optical polarization (Kravtsov et al. 2023). Thus, the 2–8 keV polarization is aligned with the jet similarly to the case of Cyg X-1 (Krawczynski et al. 2022) and NGC 4151 (Gianolli et al. 2023). Subsequent IXPE observations (2023 September 7, September 16, September 27, and October 4), performed until the end of the source visibility window, have covered the transition toward the soft state (Ingram et al. 2023). The 2–8 keV PD decreased from ≈4% to ≈3% as the source transitioned through the hard intermediate state, but the PA remained the same within the measurement uncertainties of ≈2°.
This paper reports on the first X-ray polarization measurements of Swift J1727.8–1613 in the soft state. The data reduction is described in Section 2, and the obtained results are presented in Section 3 and discussed in Section 4.
2. Observations and Data Reduction
2.1. IXPE
The new IXPE observations of Swift J1727.8–1613 in the soft state were taken on 2024 February 11–12 (ObsID: 03005701; UTC time between 2024 February 11 09:59:05 and 2024 February 12 22:11:52) and February 20–23 (ObsID: 03006001; UTC time between 2024 February 20 02:11:04 and 2024 February 23 11:13:56). A 67 ks cleaned exposure from the first observation and 151 ks from the second one were acquired. The Level 2 data of the three IXPE detectors (Soffitta et al. 2021) were downloaded from the HEASARC archive and then filtered for source regions with the xpselect tool from the ixpeobssim software package version 31.0.1 (Baldini et al. 2022). The source extraction regions were selected as circles with a radius of 100''. No background subtraction was needed since the source was bright enough (Di Marco et al. 2023). We used xselect from heasoft version 6.33 to generate the weighted Stokes I, Q, and U spectra with the command extract "SPECT" stokes = SIMPLE. To use the most up-to-date IXPE responses (arf and mrf), we used the heasoft tool ixpecalcarf with the event and attitude files of each observation (with weight = 2, i.e., simple weighting). Finally, we used grppha to rebin the Stokes parameters to 30 bins in the 2–8 keV energy band. Eventually, however, we limited the IXPE energy range to 2–6 keV because of the spectral discrepancies above 6 keV with the other X-ray instruments.
The light curve of the two IXPE observations is shown in Figure 1, showing a continuous decrease of the count rate. Even while the X-ray flux dropped to about two-thirds of its initial value at the beginning of the observation, the hardness stayed roughly constant within the measurement uncertainties, with a slight decreasing trend during the first observation. The two IXPE observations, being very similar, were merged into one for the spectropolarimetric analysis so that we get stronger constraints on the polarimetric properties of the source. We performed merging with the addspec tool where the errors were propagated (properr = "yes" errmeth = "Gauss") and new responses for merged Stokes spectra were computed. For this purpose, the original rmf responses had to be multiplied with arf or mrf into one rsp response file for I, Q, and U Stokes spectra for each observation. We used the marfrmf tool for this task.

Figure 1. Light curve between 2 and 8 keV of the two IXPE observations, showing the decreasing count rate (upper panel) and roughly steady hardness (lower panel) within measurement uncertainties during the observations. The time bin in both panels is 1 ks; hardness is defined as the ratio of the counting rate in the 4–8 keV and 2–4 keV energy ranges.
Download figure:
Standard image High-resolution image2.2. MAXI
Swift J1727.8–1613 has been regularly monitored by the MAXI X-ray instrument (Matsuoka et al. 2009). Because of MAXI's wide field of view and the relative proximity (about 1 2) of another bright X-ray source, the low-mass neutron star X-ray binary GX 9+9 (Ursini et al. 2023), we used the MAXI "on-demand" service for more precise delineation of the source region and background. The region around GX 9+9 was subtracted from both the source and background regions.
The MAXI data allow us to constrain the X-ray flux and spectral hardness and were used to trigger new X-ray observations of Swift J1727.8–1613 by confirming its presence in the soft state. The MAXI monitoring of Swift J1727.8–1613 up to the new IXPE observation is summarized in Figure 2. The plot serves as an updated version of Figure 1 in Ingram et al. (2023) and Veledina et al. (2023) with slight variations due to the enhanced data selection, subtracting the region around GX 9+9.
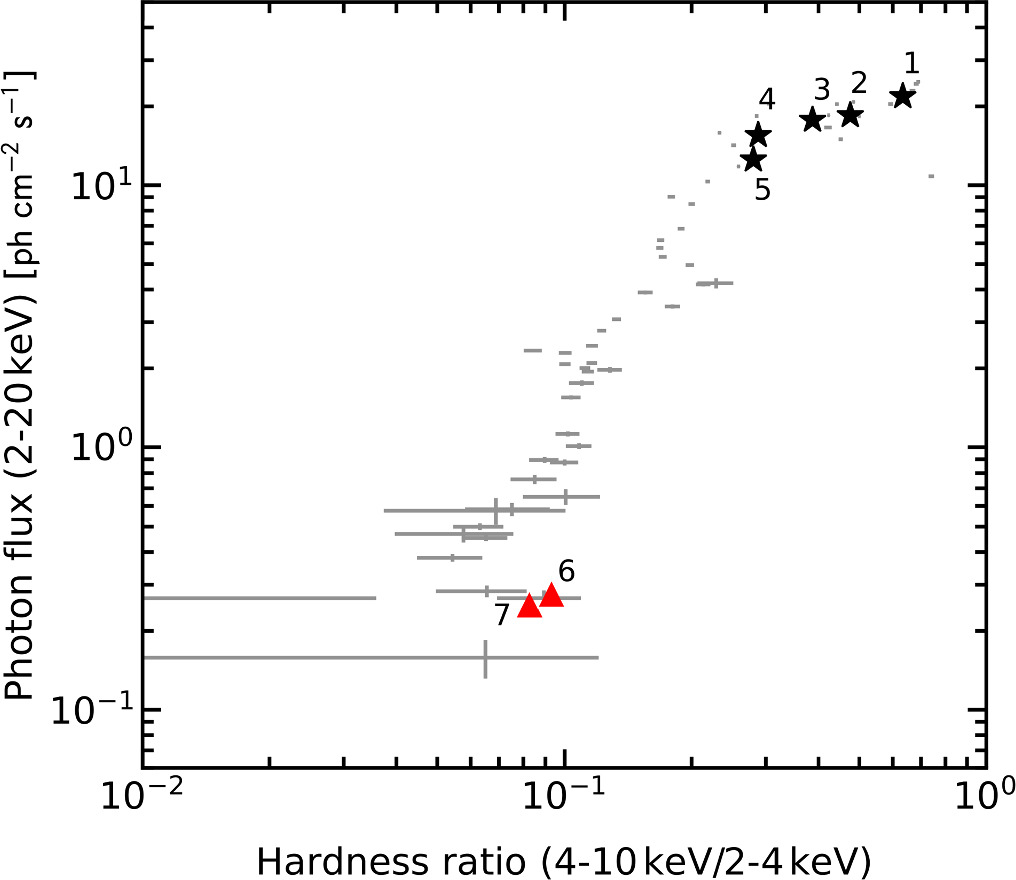
Figure 2. Evolution of Swift J1727.8–1613 on the hardness–intensity diagram spanning from 2023 August 24 to 2024 February 23. The plot shows the ratio of the photon flux between the 4–10 and 2–4 keV bands against the photon flux in the 2–20 keV range, as determined from the MAXI "on-demand" archive with a default 3 day time bin. The black stars, labeled 1–5, denote the initial five observations by IXPE that are described in Ingram et al. (2023) and Veledina et al. (2023). The red triangles (labeled 6 and 7) indicate the location in the diagram corresponding to the new IXPE observations examined in this study, showing Swift J1727.8–1613 still in the soft state.
Download figure:
Standard image High-resolution image2.3. NICER
The NICER data were obtained in 20 selected ≈500 s exposures obtained under dark conditions on 2024 February 11–13 (ObsIDs: 6750010503-504, 7708010101-103). The data were reduced using nicerdas software version 2023-08-22_V011a. All observations were obtained with 50 active focal-plane modules (FPMs) out of NICER's 52 working FPM array. Detectors 06 and 16 were manually excised out of precaution based on elevated noise profiles noticed in earlier observations of Swift J1727.8–1613 in daylight conditions (resulting in a ∼4% loss of effective area). The background was estimated for each exposure using the scorpeon model. Several exposures with elevated background (flagged by when both overshoot a rate of >0.5 s−1 FPM–1 and cutoff-rigidity measure COR_SAX<5) affecting high-energy sensitivity were excluded, as were any with short good time intervals of <60 s. Resultant spectral data were grouped to oversample the instrumental energy resolution by a factor of ∼2.5. A systematic error of 0.5% was added using the grppha tool.
2.4. NuSTAR
NuSTAR observed Swift J1727.8–1613 on 2024 February 12 (ObsID: 80902348005; 2024-02-12T07:26:09 2024-02-12T19:56:09), i.e., simultaneously with the IXPE observation. A 21.5 ks net exposure time was obtained. The NuSTAR data were reduced with the standard Data Analysis Software (NuSTARDAS). The NuSTAR calibration files from the CALDB database were used to calibrate the cleaned event files, produced by the nupipeline task. Circular regions with a radius of 60'' were centered on the source image for source extraction, and the background regions with radius 90'' were selected from the corner of the same quadrant in the source-free region. The source spectrum is rather soft, and the background dominates over the source above 30 keV. Therefore, we limit the NuSTAR data of Swift J1727.8–1613 at high energies to be below 20 keV in all spectral analyses to be sure the signal dominates over the background. Spectra from both the FPMA and FPMB detectors were used for the spectral analysis with a constant factor to account for cross-calibration uncertainties.
The data reduction is performed with NASA's Heasoft software version 6.32.1. xspec (Arnaud 1996) version 12.13.1 is used for the spectral analysis.
3. Results
The MAXI hardness ratio, defined as the ratio of the photon flux between 4–10 and 2–4 keV, H ≈ 0.1, depicts Swift J1727.8–1613 in the soft state (see Figure 2). This is confirmed both by the low hardness measured by IXPE and from low variability—using NICER, we constrained the 2–10 keV fractional rms in 0.1–10 Hz to be <2%, which is typical for the soft state (Muñoz-Darias et al. 2011).
For the spectral analysis, we employed the NICER, NuSTAR, and IXPE observations. The tbabs model (Wilms et al. 2000) was used to account for the line-of-sight absorption, with the column density as a free parameter. We included the relativistic model of the Novikov–Thorne accretion disk, kerrbb (Li et al. 2005), Comptonized by the thermal electrons modeled with thcomp (Zdziarski et al. 2020), and the relativistic reflection modeled with kynxillver as part of the ky code (Dovčiak et al. 2004). We tied all the physical parameters, such as spin and inclination, between the thermal and reflection models. Since there is a well-known degeneracy between the spin, inclination, mass, and distance in the X-ray continuum fitting method (Remillard & McClintock 2006), we fixed the distance to D = 2.7 kpc (Mata Sánchez et al. 2024) and the black hole mass to 10 M⊙.
The parameters were also tied between the NICER, NuSTAR, and IXPE observations except for the accretion rate and covering fraction of the Comptonization component. These were allowed to be free because the observations are not strictly simultaneous; thus, these parameters can vary between the observations. However, since the IXPE spectra were not sensitive enough to the Comptonization model component, we fixed it to be the same as for NuSTAR. Similarly, the reflection model parameters were linked between all observations. Details of spectral modeling are provided in the Appendix, and the best-fit values of the physical parameters are reported in Table 1.
Table 1. Spectral Fit Parameters with the Final Spectral Model
| Component | Parameter | Description | Value | ||
|---|---|---|---|---|---|
| (units) | NICER | NuSTAR | IXPE | ||
| tbabs | NH (1022 cm−2) | H column density | 0.24 ± 0.01 | ||
| kerrbb | Mbh (M⊙) | Black hole mass | 10 (frozen) | ||
| a/M | Black hole spin | 0.87 ± 0.03 | |||
 (1018 g s−1) (1018 g s−1) | Accretion rate | 0.10 ± 0.01 | 0.09 ± 0.01 | 0.09 ± 0.01 | |
| i (deg) | Inclination | 38 ± 3 | |||
| thcomp | Γ | Photon index | 4.9 ± 0.3 | ||
| CovFrac | covering fraction | 0.02 ± 0.01 | 0.06 ± 0.02 | ||
| kynxillver | L (10−7 LEdd) | Luminosity | 5 ± 1 | ||
| χ2/dof | 340/329 ≈ 1.03 | ||||
Notes. Quoted errors correspond to 90% confidence levels. Further details on the model assumptions and modeling instrumental features are provided in the Appendix.
Download table as: ASCIITypeset image
With our final spectral model, we obtained a perfectly acceptable fit with the reduced chi-squared value χ2/dof = 340/329 ≈ 1.03. The data and the data residuals from the best-fit model are shown in Figure 3. We obtained an absorption column density NH = (0.24 ± 0.01) × 1022 cm−2, in agreement with the measured column density in this direction, NHI4PI = 0.2 × 1022 cm−2 from the HI4PI survey (HI4PI Collaboration et al. 2016). The dominating component is the thermal emission with the accretion rate constrained as  g s−1, with the Comptonization contributing only by a few percent. A discrepancy in the values for the scattering fraction between NICER and NuSTAR can be attributed to a nonsimultaneity of both data sets in conjunction with small calibration differences.
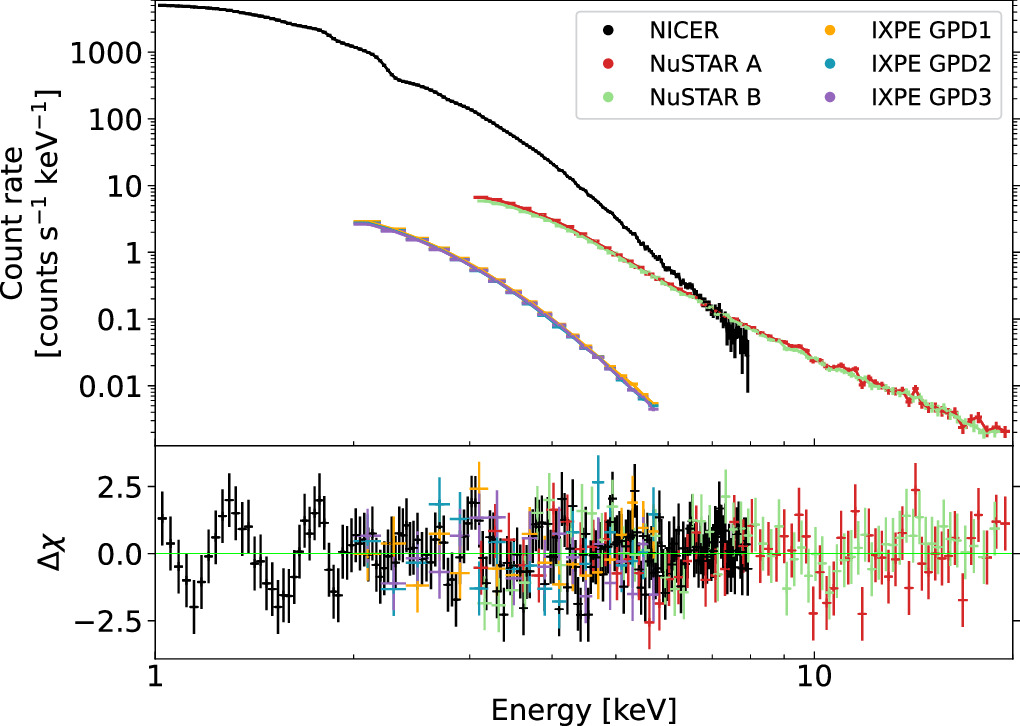
Figure 3. Spectral fit of NICER (black), NuSTAR (FPMA in red, FPMB in green), and IXPE (orange, blue, and violet) data. The upper panel shows the data counts, and the lower one shows data residuals from the best-fit model.
Download figure:
Standard image High-resolution imageThe constrained black hole spin is a ≈ 0.9, and the inclination i ≈ 40°. We note, however, that the spin and inclination angle are mutually degenerate, and the systematic uncertainty in the determination of these values is much larger than the statistical errors reported in Table 1. They are also dependent on the assumed mass and distance parameters. More precise constraints on the physical parameters will be possible after a more accurate determination of the mass, e.g., a dynamical mass from optical spectroscopy in quiescence. For the remainder of our analysis, the precise values of the degenerate quantities are of secondary consideration. Of central importance, we have shown a spectral model that describes the broadband X-ray spectrum very well and that unambiguously shows a dominant thermal multicolor disk component.
As a next step, we conducted the spectropolarimetric analysis for the IXPE I, Q, and U spectra in the 2–6 keV band using the polconst model applied to the best-fit spectral model with the parameters fixed to the values from the joint NICER, NuSTAR, and IXPE fit. The same gain factors as for the I spectra were applied to the Q and U spectra. The only free parameters were the PD and PA. We obtained PD =  and PA = −13° ± 28° with 90% confidence errors. With a 99% confidence level, only an upper limit is constrained, PD < 1.2%, and thus PA remains unconstrained. The fit is perfectly acceptable, with χ2/dof = 168/170 ≈ 1.0. The contours for different confidence levels in the PD–PA plane were computed with 50 steps for each parameter and are shown in Figure 4.
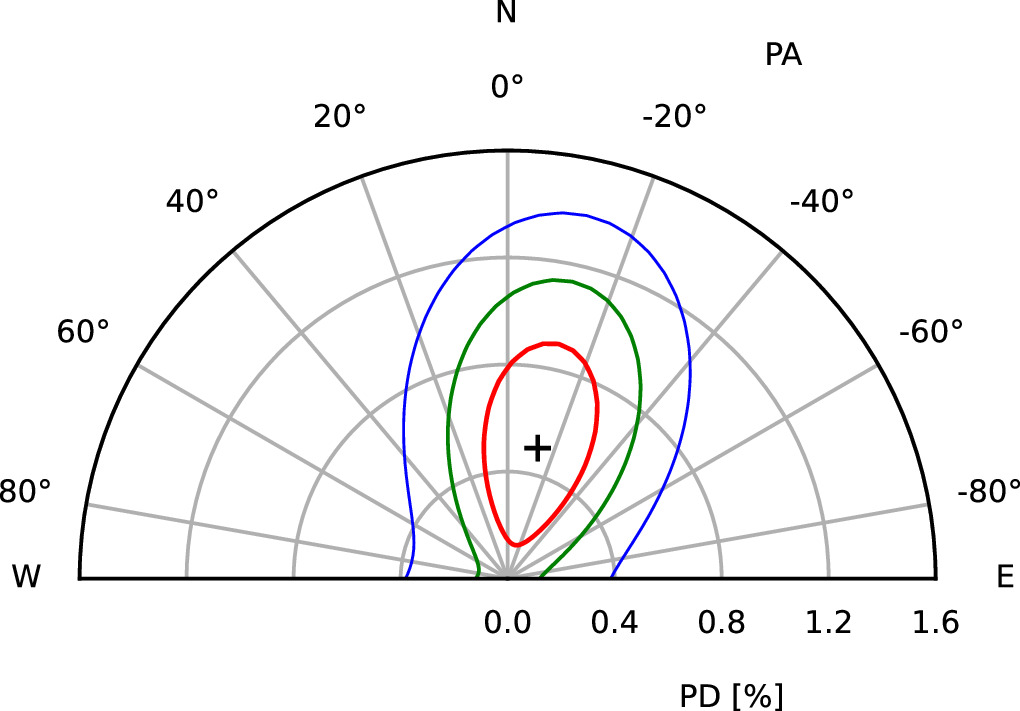
Figure 4. Contour plot of the PD vs. PA derived from the final spectral fit with applied polconst on the best-fit model to fit the Q and U spectra. The contours show 1σ (red), 2σ (green), and 3σ (blue) confidence levels. The best-fit values are marked with a black plus sign.
Download figure:
Standard image High-resolution image4. Discussion
In this Letter, we report the first results of the X-ray spectropolarimetric analysis of Swift J1727.8–1613 in the soft state about half a year after the beginning of the outburst. The MAXI hardness–intensity evolution of Swift J1727.8–1613 has exhibited a monotonically declining intensity since the peak in the hard state; in 2024 February, the intensity was about 2 orders of magnitude lower than the peak (see Figure 2). Our new observations showed that the X-ray polarization has substantially changed since the last observation in 2023 October in relation to the spectral state changes. Figure 5 shows the PD measurements in the different observations as a function of the spectral hardness measured by IXPE, defined as the ratio between the flux in the 4–8 and 2–4 keV energy bands. The first observations from the beginning of the hard-to-soft state transition provided high values of PD and spectral hardness. As the source evolved and got softer, the PD was decreasing (Ingram et al. 2023), which is fully confirmed by the new measurement, with the spectral hardness H ≈ 0.1 and PD < 1.2%.
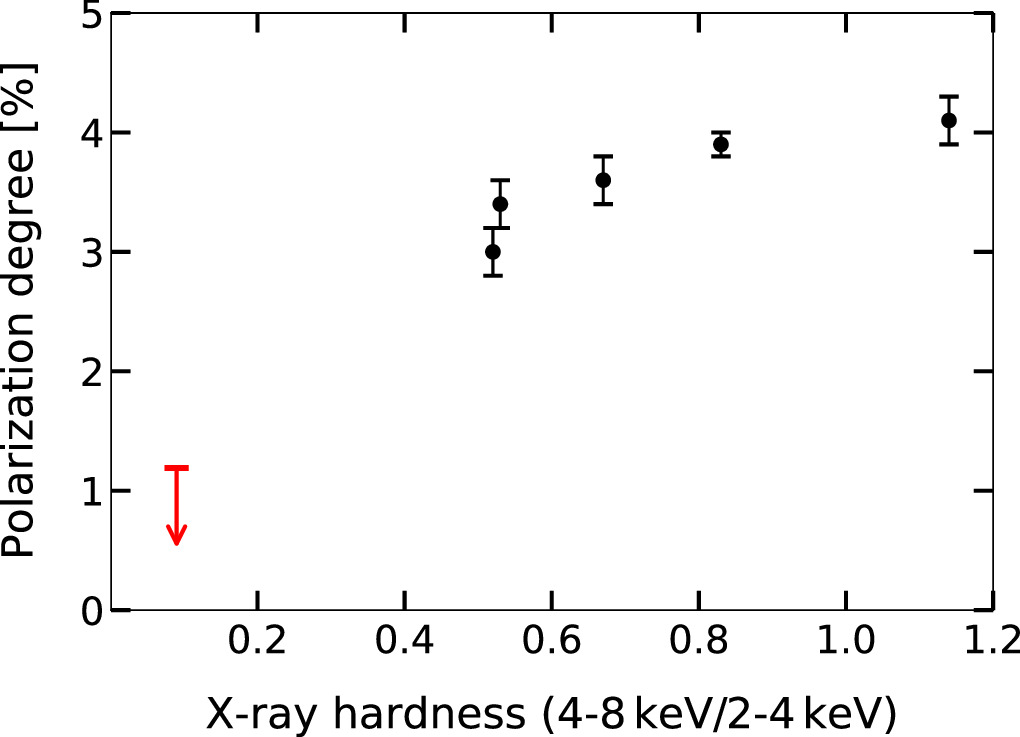
Figure 5. Measured 2–8 keV average PD in all IXPE observations vs. the spectral hardness defined as the flux ratio between the 4–8 and 2–4 keV energy bands measured by IXPE. The new observations 6 and 7 combined (marked in red) are plotted as an upper limit calculated at the 99% confidence level.
Download figure:
Standard image High-resolution imageThe accretion geometry associated with the various spectral states and its possible evolution between them remain the subject of intense discussions (see, e.g., Done et al. 2007). Optically thin plasma is thought to be the main component responsible for the X-ray production in the hard state, while the soft state is thought to be related to the optically thick, geometrically thin disk emission. The states are likewise expected to have different polarization properties.
The hard-state polarization can be produced by multiple Compton scatterings in an optically thin, flat plasma cloud located either on the top of the disk or within its truncation radius (Sunyaev & Titarchuk 1985; Esin et al. 1997; Poutanen et al. 1997). The PD in this case is an increasing function of energy in the range between the first scattering and, roughly, the cutoff energy of the Comptonization continuum (e.g., Poutanen & Svensson 1996). The PD generally increases with the inclination and also depends on the electron temperature and optical depth of the medium. We first assume the model of a static flat hot flow Comptonizing either internal synchrotron photons or those coming from the truncated disk and show the dependence of the resulting PD on inclination in the middle of the IXPE range (at 4 keV) in Figure 6 with red lines. These cases correspond to models B and C in Poutanen et al. (2023). The parameters, electron temperature kTe = 100 keV, seed blackbody photon temperature kTbb = 0.3 keV (for model C), and photon index of the Comptonization component Γ = 1.8 were chosen to match the hard-state data from Veledina et al. (2023).
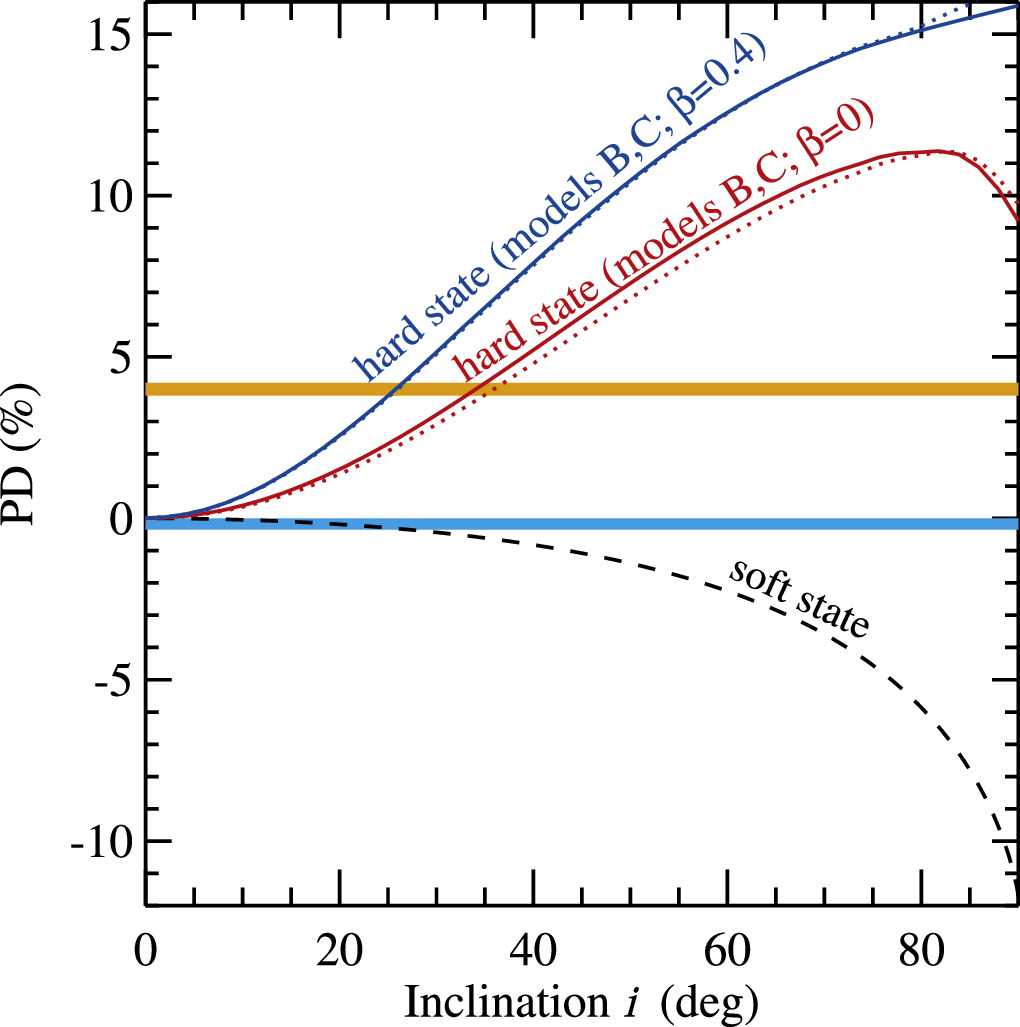
Figure 6. Dependence of the PD on inclination. The red lines correspond to the models of Comptonization in the flat static hot flow with the seed photons either being internal synchrotron (solid line) or from the outer truncated disk (dotted line), corresponding to the models B and C in Poutanen et al. (2023), respectively. The blue lines are for the same models but for the hot flow outflowing with velocity v = 0.4c. The horizontal orange strip marks the observed PD of 4% during the hard state. The inclinations in the range ∼25°–35° are consistent with this PD. The black dashed line is the classical result for the electron-scattering dominated semi-infinite atmosphere (Chandrasekhar 1960; Sobolev 1963) that could correspond to the soft state. The horizontal cyan strip marks the allowed range of the PD during the soft state for the PA perpendicular to that of the hard state (i.e., corresponding to the negative PD).
Download figure:
Standard image High-resolution imageThe hot flow may also be outflowing; therefore, we considered the case with a flow velocity of v = 0.4c, which well modeled the Cyg X-1 data (Krawczynski et al. 2022; Poutanen et al. 2023). The models B and C with the outflow are shown with blue lines in Figure 6. The hard-state PD of Swift J1727.8–1613 favors the inclination around ∼25°–35°, depending on the outflow velocity. However, a higher inclination is possible if the hot flow is not a perfect slab, which reduces the predicted PD. The slab-corona model (model A in Poutanen et al. 2023) with seed photons from the underlying cool disk predicts a strong energy dependence close to the energies of the seed photons, i.e., in the IXPE range, which was, however, not observed in the hard-state IXPE observations.
The soft-state polarization can be attributed to Thomson scattering in the atmosphere of the optically thick accretion disk. The observed upper limits on PD in Swift J1727.8–1613 can be compared to the classical Chandrasekhar (1960) and Sobolev (1963) results for the electron-scattering-dominated semi-infinite atmosphere (Figure 6, black dashed line). In this case, the PD also increases with increasing inclination; however, the levels of polarization are expected to be 2–10 times lower, as compared to the optically thin case. The PA is rotated by 90°; i.e., the predominant direction of oscillation of the electric vector is aligned with the disk plane (and therefore, PD is shown as negative in Figure 6). Assuming a PA perpendicular to that of the hard state, the upper limit on the PD is ∼0.4% (see Figure 4), which implies that in this model, the inclination is limited by i ≲ 30° (see the crossing of the cyan strip with the soft-state model in Figure 6).
The emission close to the black hole experiences additional depolarization resulting from relativistic effects (Connors & Stark 1977; Connors et al. 1980). However, at a high spin, the effects of returning radiation (i.e., thermal photons returning to the disk due to general-relativistic ray bending) become important (Schnittman & Krolik 2009). Since, to be collected at infinity, returning photons must be first reflected on the disk surface, their polarization is expected to be aligned with the disk axis. As a result, if the fraction of returning photons reflected toward the observer is high (i.e., at a high albedo), the total polarization may also become aligned with the disk axis, even if the emission comes from the disk only. For relatively high spins of the black hole (a ≈ 0.9), this effect on X-ray polarization may become important even without a relevant contribution of the reflected photons being clearly visible in the 1–20 keV spectrum (see, e.g., Figure 5 in Schnittman & Krolik 2009). This has been further studied in the standard Novikov–Thorne accretion disk scenario with additional self-irradiation for different combinations of inclination, black hole spin, and albedo parameters in the kynbbrr model (Dovčiak et al. 2008; Taverna et al. 2020; Mikusincova et al. 2023).
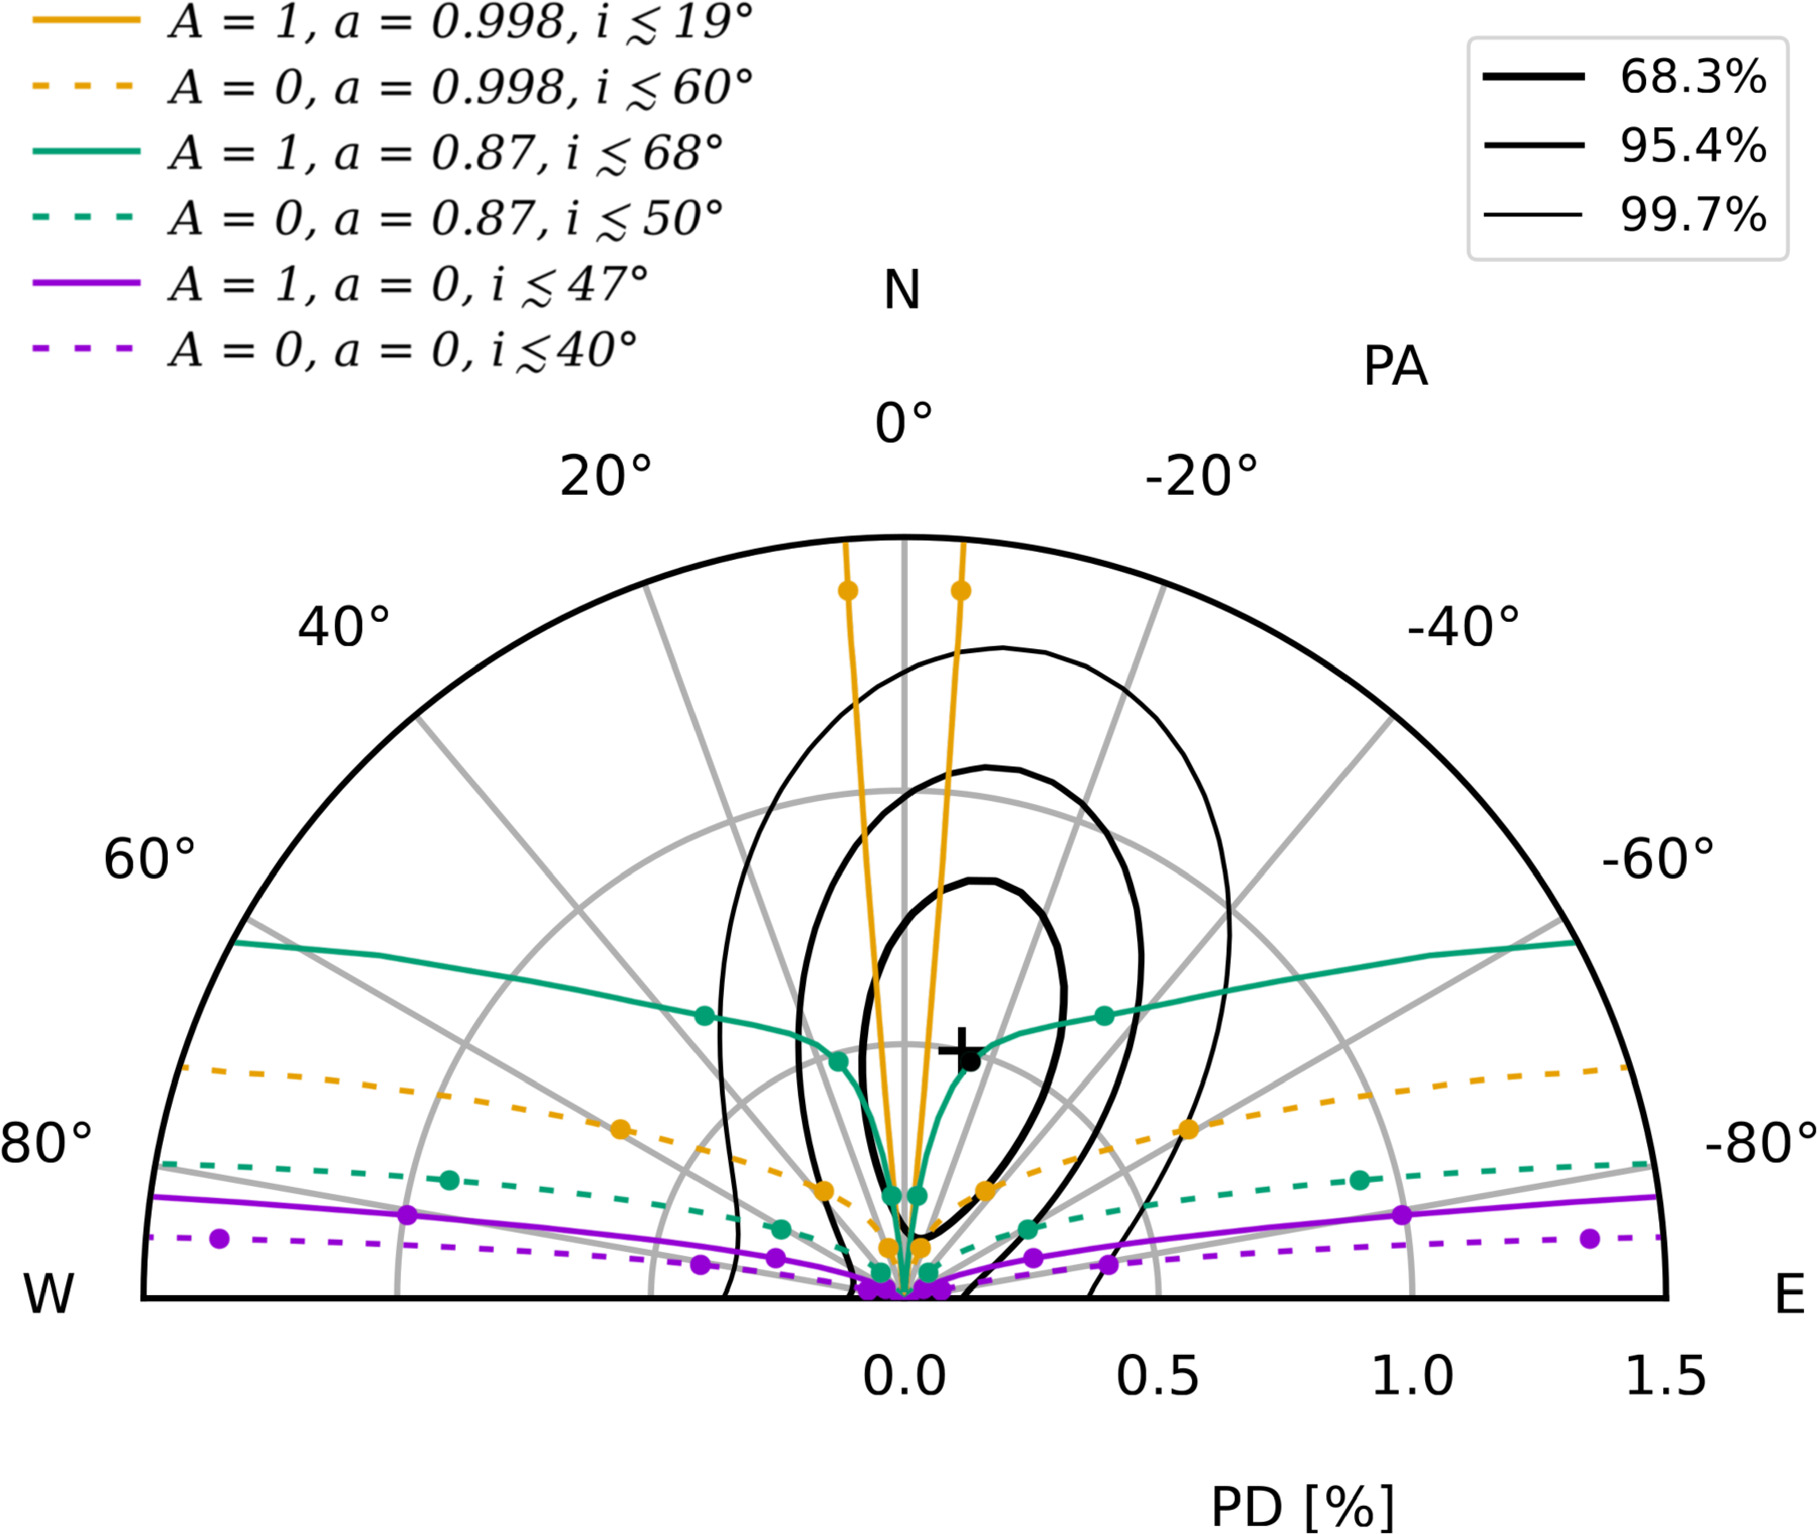
Figure 7 shows how the polarization properties (PD and PA) vary with the observer's inclination according to the kynbbrr model for different values of the black hole spin and the disk surface albedo. The models are plotted over the contours of PD and PA obtained from the spectropolarimetric analysis with the polconst model on the best-fit spectral model (Figure 4). The vertical north-direction axis is assumed to be the accretion disk axis, consistent with the hard-state polarization measurements. Since the orientation of the black hole spin and the direction of the accretion disk rotation cannot be determined a priori from the kynbbrr simulations, the models in Figure 7 are plotted on both sides of the vertical axis.
Figure 7. Modeling PD and PA with relativistic accretion disk model kynbbrr for different black hole spin values, a = 0 (violet), a = 0.87 (green), and a = 0.998 (orange), considering albedo A = 0 (dashed lines) and A = 1 (solid lines). Values for inclinations of 20°, 40°, and 60° are denoted by bullets. Corresponding upper limits for inclination are taken from the intersections with the 3σ contour line. The black bullet shows the case of a = 0.87 and inclination i = 40°, corresponding to the best-fit spectral results, and it is very close to the best-fit values of PD and PA from the IXPE data (denoted by a black plus sign).
Download figure:
Standard image High-resolution image
The points of the intersections between the model curves and 3σ contours represent limits for the inclination angle. The low-spin case (a = 0) is close to Chandrasekhar's approximation and predicts the perpendicular PA direction. The allowed inclination is up to 40° for albedo A = 0 and 47° for albedo A = 1. Oppositely, for the high spin (a = 0.998) and high albedo (A = 1), the PA is oriented in the same direction as in the hard state, and the allowed range for inclination is even tighter (i < 19°). The albedo plays a crucial role in the high-spin scenario. For high spin and zero albedo, the PA is closer to the perpendicular direction, and the inclination can be up to 60°. The case of the black hole spin a = 0.87 corresponds to the best-fit value of the spectral fit. The allowed inclination for the albedo A = 1 is up to 68°. Predicted PD and PA values assuming the inclination angle i = 40° from the spectral fit (indicated by a black circle) are very close to the best-fit values of PD and PA from the polarimetric measurements.
The perfect agreement between the independent spectral and polarimetric analysis indicates consistency between these methods, though it can still be just coincidental given the relatively large uncertainties in our polarization measurements and systematic uncertainties in the X-ray continuum fitting method. Nevertheless, it is clear from this analysis that accounting for the general-relativistic effects allows the inclination over 30° to still be consistent with the soft-state PD. A more complicated picture can be obtained if we consider a possible contribution of the Comptonization or reflection components. These are relatively weak in the spectrum but can contribute significantly more to the polarization. The data sensitivity, however, does not allow us to perform such a detailed analysis, and we limited our analysis by assuming that the polarization is from the dominating thermal component.
Although the main focus of this Letter is on the X-ray polarization results, our spectral fit provides measurements of the physical parameters of the black hole in Swift J1727.8–1613. The black hole spin derived from the joint X-ray continuum and reflection modeling provided a ≈ 0.9, slightly lower but within the uncertainties consistent with the value reported by Peng et al. (2024) from reflection modeling in the hard state. We note, however, that the accuracy of the spin measurements is, in general, affected by systematic uncertainty. The most limiting factor in our analysis is that the spin value is degenerate with other model parameters and, especially in the X-ray continuum fitting method, strongly correlates with values of the black hole mass, disk inclination, distance, spectral hardening factor, and disk structure (Zdziarski et al. 2024).
The distance D = 2.7 kpc constrained from the optical spectroscopy is larger than expected previously, simply estimated by a comparison of the peak luminosity with other black hole transients, such as GX 339–4 and MAXI J1820+070. Assuming the luminosity peak is sub-Eddington and at a similar level as in MAXI J1820+070, Veledina et al. (2023) estimated the distance D ≈ 1.5 kpc. Assuming the spectral-fit parameters from Table 1, we can estimate the current accretion rate in Eddington units as  , which gives for the accretion efficiency η ≈ 0.14 corresponding to the black hole spin a = 0.87, the accretion rate
  g s−1, and the black hole mass Mbh = 10 M⊙: L/LEdd ≈ 1%.
This is consistent with the soft-to-hard transition usually happening at (0.5%–4%)LEdd (Maccarone 2003; Dunn et al. 2010), while the luminosity at the hard-to-soft transition has a significantly larger scatter even for the same source (e.g., in GX 339–4; Dunn et al. 2008). We tested the models with the lower distance estimate, which gave us a spin estimate a ≈ 0.95, inclination i ≈ 48°, and accretion rate  g s−1, corresponding to ≈0.4%, just below the usual interval for the Eddington ratio at the transition. From these considerations, the larger distance with the accretion rate of ≈1% better matches the behavior of other black hole X-ray transients.
5. Conclusions
We report the detection of polarization changes correlated with the spectral transition in the low-mass BHXRB system Swift J1727.8–1613. Our new observations show that the PD substantially decreased from the previously measured 3%–4% to less than 1.2% at the 99% confidence level. Such a drop in the PD favors the scenario in which the X-ray polarization signal is driven by the configuration of the accretion flow in the innermost region and indicates that the changes in spectral states are closely followed by the changes in polarization properties in a predicted way. This substantial change of the PD was measured for the first time with IXPE in the same source, and it indicates that the X-ray polarization is sensitive to the innermost accretion geometry. The changes are in line with the early expectations that the radiation is produced in the optically thin medium in the hard state, switching to the optically thick medium in the soft state. The upper limit of 1.2% in the soft state, combined with the hard-state measurements, indicates that the inclination of the accretion disk is intermediate (30° ≲ i ≲ 50°).
Acknowledgments
IXPE is a joint US and Italian mission. The US contribution is supported by the National Aeronautics and Space Administration (NASA) and led and managed by its Marshall Space Flight Center (MSFC), with industry partner Ball Aerospace (contract NNM15AA18C). The Italian contribution is supported by the Italian Space Agency (Agenzia Spaziale Italiana, ASI) through contract ASI-OHBI-2022-13-I.0, agreements ASI-INAF-2022-19-HH.0 and ASI-INFN-2017.13-H0, and its Space Science Data Center (SSDC) with agreements ASI-INAF-2022-14-HH.0 and ASI-INFN 2021-43-HH.0, as well as by the Istituto Nazionale di Astrofisica (INAF) and the Istituto Nazionale di Fisica Nucleare (INFN) in Italy. This research used data products provided by the IXPE Team (MSFC, SSDC, INAF, and INFN) and distributed with additional software tools by the High-Energy Astrophysics Science Archive Research Center (HEASARC) at NASA Goddard Space Flight Center (GSFC). This research has used the MAXI data provided by RIKEN, JAXA, and the MAXI team.
J.S., M.D., J.Pod., and S.R.D. thank GACR project 21-06825X for the support and institutional support from RVO:67985815. A.V. thanks the Academy of Finland grant 355672 for support. Nordita is supported in part by NordForsk. The work of F.M., R.T., G.M., L.M., and P.S. is partially supported by the PRIN grant 2022LWPEXW of the Italian Ministry of University and Research (MUR). M.B. acknowledges the support from GAUK project No. 102323. A.I. acknowledges support from the Royal Society. T.M.-D. acknowledges support by the Spanish Agencia estatal de investigación via PID2021-124879NB-I00. The French contribution is supported by the French Space Agency (Centre National d'Etude Spatiale, CNES) and by the High Energy National Programme (PNHE) of the Centre National de la Recherche Scientifique (CNRS). Y.Z. acknowledges support from the Dutch Research Council (NWO) Rubicon Fellowship No. 019.231EN.021. F.C. acknowledges the support of the INAF grant 1.05.23.05.06: "Spin and Geometry in accreting X-ray binaries: The first multi frequency spectro-polarimetric campaign." Finally, we thank the anonymous referee for the insightful comments that helped to improve the paper.
Appendix: Details of Spectral Analysis
Table 1 lists only free physical parameters of the spectral fit. Besides the physical model components, we included a cross-calibration constant to account for calibration uncertainties between different instruments, an edge model to account for a NICER calibration feature around 2 keV, and the gain command to allow for the modification of response functions with the slope and offset parameters to be free among the IXPE three detector units. The final model in the xspec notation is const*edge*tbabs*(thcomp*kerrbb + mbknpo*kynxillver).
We limit the NICER data to be above 1 keV to avoid the need for further modeling of calibration uncertainties and more complex absorption features. The cross-normalization constants were fixed to 1 for NICER, and up to a 5% difference was allowed for NuSTAR and free for IXPE. We obtained 0.95 (pegged) for NuSTAR-FPMA, 0.93 (±0.01) for NuSTAR-FPMB, 0.92 (±0.06) for IXPE-GPD1, 0.91 (±0.06) for IXPE-GPD2, and 0.89 (±0.06) for IXPE-GPD3. For the NICER absorption edge, we got energy E = 1.82 ± 0.02 keV and absorption depth τ = 0.03 ± 0.01. The obtained gain parameters for IXPE responses were DET1: slope s = 0.97 (±0.01), offset o = 0.05 (±0.01); DET2: s = 0.96 (±0.01), o = 0.11 (±0.01); and DET3: s = 0.97 (±0.01), o = 0.09 (±0.01).
In the kerrbb model, we set the hardening factor to hd = 1.7 (Shimura & Takahara 1995). We employed limb darkening and self-irradiation and fixed the distance to the value of 2.7 kpc reported by Mata Sánchez et al. (2024) and the normalization to unity. The electron temperature was set to 150 keV in the thcomp model. The energies were extended to 0.01–100 keV to properly calculate the Comptonization spectral component. For the reflection model, we used the xillver tables (García & Kallman 2010) convolved with the relativistic model KY (Dovčiak et al. 2004). We employed the lamppost geometry model with the height set to 3 gravitational radii (GM/c2), which has a similar irradiation profile, like an extended corona with r−3 (Dovčiak et al. 2014). We used the standard low-density xillver tables with the density 1015 cm−3, but for the ionization calculations, we assumed the density to be 1018 cm−3. The gradient ionization over the disk radii dependent on illumination was assumed (Svoboda et al. 2012). The photon index of the reflection model was set to 3.4, which is the highest value of the precalculated xillver tables. The iron abundance was set to the solar one. The normalization was fixed to 1.37 × 10⁵ (corresponding to  as defined in the model).
Because the reflection models are calculated assuming that the power law extends down to very low energies and thus overpredict the contribution of the reflection at ≲1 keV, we applied a correction for the low-energy part by multiplying the reflection model with a mbknpo model. This applies a break to the power-law shape of the reflection below a reference energy corresponding to some multiple of the thermal disk peak. Below this energy, the photon spectrum turns over, which prevents the unphysical runaway. From application of this model to several customized xillver reflection computations, an empirical scaling was adopted, and here we force the low energies to follow the slope E−1.5 based on our empirical investigations of the shape of reflection models illuminated by the nthcomp model. In the xspec notation, we defined this function as mdef mbknpo
 +
+  : mul, where B is the break energy, I is the index used for the correction for energies E < B, and
  (set to 10−7) is just a small number to avoid divergences in the numerical calculation of the model at E = B. The index below the break energy was set to I = Γ − 1.5 = 1.9, where Γ is the photon index of the illuminating power law in the reflection model. The value of the break energy was fitted and found to be B = 2.7 ± 0.2 keV.