


Abstract
Extragalactic fast radio bursts (FRBs) have large dispersion measures (DMs) and are unique probes of intergalactic electron density fluctuations. By using the recently released First CHIME/FRB Catalog, we reexamined the structure function (SF) of DM fluctuations. It shows a large DM fluctuation similar to that previously reported in Xu & Zhang, but no clear correlation hinting toward large-scale turbulence is reproduced with this larger sample. To suppress the distortion effect from FRB distances and their host DMs, we focus on a subset of CHIME catalog with DM < 500 pc cm−3. A trend of nonconstant SF and nonzero correlation function (CF) at angular separations θ less than 10° is seen, but with large statistical uncertainties. The difference found between SF and that derived from CF at θ ≲ 10° can be ascribed to the large statistical uncertainties or the density inhomogeneities on scales on the order of 100 Mpc. The possible correlation of electron density fluctuations and inhomogeneities of density distribution should be tested when several thousands of FRBs are available.
Export citation and abstract BibTeX RIS

Original content from this work may be used under the terms of the Creative Commons Attribution 4.0 licence. Any further distribution of this work must maintain attribution to the author(s) and the title of the work, journal citation and DOI.
1. Introduction
Extragalactic fast radio bursts (FRBs; Lorimer et al. 2007; Thornton et al. 2013; Petroff et al. 2016) have their dispersion measures (DMs) greatly exceeding those of Galactic pulsars in the high Galactic latitude region (Cordes & Chatterjee 2019). Thus, they provide unique probes of the intergalactic electron density fluctuations (Macquart & Koay 2013; Xu & Zhang 2016a; Ravi et al. 2016; Zhu et al. 2018). The cosmological applications of FRBs on, e.g., constraining the baryon content of the universe (Keane et al. 2016; Macquart et al. 2020) and cosmological parameters (Deng & Zhang 2014; Gao et al. 2014; Zhou et al. 2014; Walters et al. 2018; Kumar & Linder 2019) via a DM–redshift relation, probing the reionization history of the universe (Deng & Zhang 2014; Zheng et al. 2014; Caleb et al. 2019; Beniamini et al. 2021) and tracing the large-scale structure of the universe (Masui & Sigurdson 2015; Shirasaki et al. 2017; Reischke et al. 2021; Rafiei-Ravandi et al. 2021) have been extensively studied in the literature.
It is not straightforward to extract the intergalactic electron density fluctuations from the DM fluctuations of FRBs due to the unknown distances and host DMs. First, DMs are projected electron densities. Their fluctuations are affected and can even be dominated by dispersion of distances, depending on the line-of-sight thickness of the sample (Lazarian & Pogosyan 2016; Xu & Zhang 2020a, 2020b; Einasto et al. 2021). Second, the host DMs have a large dispersion (Yang et al. 2017) and can be exceptionally large (up to ∼900 pc cm−3) for some FRBs (Niu et al. 2021; Rafiei-Ravandi et al. 2021). In addition, with a limited sample size, the statistical measurements of DM fluctuations especially at small angular separations (θ < 10°) have large uncertainties, which makes the interpretation of the results more challenging (Xu & Zhang 2020a, hereafter XZ20).
Theoretical models on DM fluctuations of FRBs based on cosmological hydrodynamic simulations (e.g., Takahashi et al. 2021) provide insight into their statistical properties. Direct statistical measurements with observational data are important for testing the theoretical predictions and the underlying cosmological models. XZ20 made the first attempt and found a power-law structure function (SF) of DM fluctuations up to 100 Mpc by using 112 FRBs from FRBCAT (Petroff et al. 2016), 5 but the statistical uncertainties are very large due to the small sample size. The recently released First CHIME/FRB Catalog (The CHIME/FRB Collaboration et al. 2021) 6 with 535 FRBs provides us an opportunity to reexamine the SF with a larger FRB sample.
The galaxy two-point correlation function (Limber 1953; Peebles 1980; Landy & Szalay 1993) is a powerful statistical tool for studying clustering of galaxies, clusters of galaxies, superclusters, and testing cosmological models (e.g., Klypin & Kopylov 1983; Bahcall & Burgett 1986; Saunders et al. 1991; Zehavi et al. 2002; Hawkins et al. 2003; Weinberg et al. 2004, 2013). Different from the galaxy correlation statistics that relates galaxies to the underlying mass distribution, the SF of DM fluctuations directly measures the statistical properties of the projected intergalactic electron density field.
The SF in general has a higher accuracy than the correlation function (CF) in the presence of noise and large-scale inhomogeneities (Monin & Yaglom 1965). For a similar degree of accuracy, the SF requires a much smaller data size than the CF (Schulz-Dubois & Rehberg 1981), which is an advantage for studying DMs of FRBs with a still limited sample size. The SF measurements have been applied to various observables related to velocities, densities, and magnetic fields in the multiphase astrophysical media (e.g., Xu & Zhang 2016b; Xu 2020; Li et al. 2020), as well as velocities of young stars (Ha et al. 2021). The applications of the SF to large-scale intergalactic density fluctuations and studies on its cosmological implications are rare. In this work, we will further explore the SF of DM fluctuations by using the CHIME/FRB Catalog. We will examine whether the nonflat SF found from FRBCAT, which is indicative of the correlation of electron density fluctuations, can be still seen with a larger FRB sample. We will further compare the SF with the CF measurement, to investigate whether they contain equivalent statistical information as expected for homogeneous large-scale intergalactic density distribution. In Section 2, we first compare the SF of DM fluctuations measured by XZ20 and that measured with the new CHIME Catalog. We then focus on the SF and CF analysis by using a subset of CHIME FRBs with relatively small DMs. The summary of our main results is given in Section 3.
2. SF and CF of DM Fluctuations of FRBs
2.1. Comparison between FRBCAT and CHIME Samples
Figure 1 shows the sky distribution of the FRBs from the CHIME Catalog and from FRBCAT. Some FRBs have their sky locations overlapped. The CHIME sample has a smaller sky coverage, but contains more FRB pairs with smaller angular separations.

Figure 1. 535 FRBs from the CHIME Catalog in Galactic coordinates (red) overlaid on the 112 FRBs from FRBCAT used in XZ20 (black).
Download figure:
Standard image High-resolution imageThe SF of FRB DMs is defined as

where X 1 and X 2 are the sky locations of a pair of FRBs with the angular separation θ, and 〈...〉 denotes the average over all pairs with the same θ. The CF of DM fluctuations is

where  is the DM fluctuation, and
  is the mean DM. We note that the SF of DMs and the SF of DM fluctuations are the same. For a stationary or a spatially homogeneous random process, the SF and CF contain equivalent information, and they are related by

In a more general case with low-frequency noise or large-scale fluctuations, the statistical characteristics of SF and CF are not mutually interchangeable. It was found in statistical mechanics that the SF is less distorted than the CF by large-scale inhomogeneities (Monin & Yaglom 1965). To reach a similar accuracy, the CF requires a much larger (by 1 to 2 orders of magnitude) data set than the SF (Schulz-Dubois & Rehberg 1981).
Figure 2(a) presents D(θ) measured by XZ20 with 112 FRBs from FRBCAT, in comparison with that measured with 491 FRBs (in this work) with distinct coordinates from CHIME. The uncertainty of the latter is much smaller due to the significantly larger sample size. We note that the error bars show 95% confidence intervals, which are calculated at each θ using the Student's t-distribution when there are < 30 FRB pairs and the normal distribution for more FRB pairs. The power-law trend indicated by the dashed line at small θ is not seen for the CHIME sample. We further combine the two catalogs, and the corresponding D(θ) of a total of 603 FRBs 7 is displayed in Figure 2(b). We see that D(θ) is dominated by CHIME sample, so the inclusion of FRBCAT FRBs does not significantly change the result, except for the very large θ end.

Figure 2. (a) D(θ) measured by XZ20 with 112 FRBs from FRBCAT (black) and that measured with 491 FRBs from CHIME (red). Error bars indicate 95% confidence intervals. The dashed line is the fit to the data points at small θ for the 112 FRBs (XZ20). (b) D(θ) measured with a total of 603 FRBs from combined FRBCAT and CHIME samples (blue).
Download figure:
Standard image High-resolution imageWe believe that the different D(θ) measured with the FRBCAT and CHIME catalogs at small θ is mainly caused by the different sample sizes. The latter measurements are within the uncertainty range of the former. The effect of sky coverage is unclear and thus cannot be completely excluded.
To further examine the effect of sample size on D(θ), we randomly select 112 FRBs, i.e., the same number of FRBs as in FRBCAT, from the total CHIME sample as a subsample. As an example, D(θ) measured from three subsamples is shown in Figure 3(a). We see that different subsamples can lead to different D(θ) at both small and large θ. As an alternative test, we randomly select the same number of FRB pairs from the total CHIME sample in each θ bin as that for FRBCAT sample. D(θ) corresponding to three realizations is shown in Figure 3(b) as an example. In both tests, we find large statistical uncertainties of D(θ) at small θ because of the small sample size. Occasionally, a power-law trend can be seen, e.g., blue circles in Figure 3(b). It suggests that the power-law trend of D(θ) seen at small θ with a small sample of FRBs from FRBCAT is likely a coincidence.

Figure 3. (a) D(θ) measured from a subsample of 112 randomly selected FRBs from CHIME. (b) D(θ) measured from CHIME, but with the same number of FRB pairs in each θ bin as that for D(θ) measured from FRBCAT (see Figure 2). Error bars indicate 95% confidence intervals. Three colors represent three different realizations. The dashed line corresponds to the fit to D(θ) at small θ measured with FRBCAT (see Figure 2).
Download figure:
Standard image High-resolution image2.2. Statistics with a Subset of the CHIME Sample
Both D(θ) and ξ(θ) of DM fluctuations are 2D projected statistical measurements of electron density fluctuations. The larger the dispersion of the distances to FRBs, the greater the difference between the 2D and 3D statistics is expected. Depending on the thickness of the 2D sample, the correlation information can be partly or completely lost (Einasto et al. 2021). In addition, the host DMs of FRBs can largely distort the measured D(θ) and ξ(θ). In particular, some FRBs can have very large host DMs (∼400 pc cm−3), as suggested by Rafiei-Ravandi et al. (2021). A repeating FRB with the host DM ≈ 902 pc cm−3 is recently found by Niu et al. (2021). As an attempt to constrain the thickness of the 2D sample and exclude FRBs with exceptionally large host DMs, we explore the possibility of using a subset of the FRB sample by applying a DM cut for the statistical analysis. Figure 4 shows different D(θ) corresponding to different DM cuts. Naturally, the DM fluctuation of a subset of FRBs becomes smaller at a smaller DM cut value.
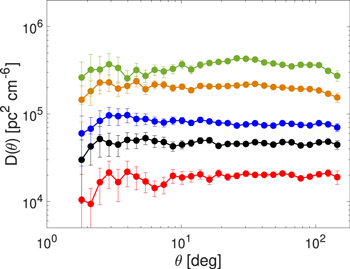
Figure 4. D(θ) measured using a subset of the CHIME catalog, with 210 FRBs with DM < 500 pc cm−3 (red), 322 FRBs with DM < 700 pc cm−3 (black), 385 FRBs with DM < 900 pc cm−3 (blue), 468 FRBs with DM < 1500 pc cm−3 (orange), and 491 FRBs without DM cut (green). Error bars indicate 95% confidence intervals.
Download figure:
Standard image High-resolution imageThere is a trade-off between the thickness of the 2D sample and the sample size. A higher cut value leads to a thicker 2D sample, and a lower one brings larger statistical uncertainties. We apply here a tentative DM cut at 500 pc cm−3 (see Figure 5 for the corresponding DM distribution). According to the DM–redshift relation (Deng & Zhang 2014; Zhang 2018),

where Ωm = 0.3089 ± 0.0062 and ΩΛ = 0.6911 ± 0.0062 are the matter density parameter and dark energy density parameter (Planck Collaboration et al. 2016). We approximately sample the nearby density structures within redshift z ≈ 0.57 (≈2 × 10³ Mpc as the line of sight (LOS) comoving distance) by assuming the DM is dominated by its intergalactic component. The optimized selection cut should be determined based on the accurate modeling of distances and host DMs of FRBs, as well as the sample size.

Figure 5. DM distribution for the entire CHIME Catalog (light gray) and for the subset with DM < 500 pc cm−3 (dark gray).
Download figure:
Standard image High-resolution imageFigure 6 presents the D(θ) of the subset of FRBs, with the total DM used in Figure 6(a), and the DM excess between DM determined by fitburst (The CHIME/FRB Collaboration et al. 2021) and Milky Way DM modeled by NE2001 (Cordes & Lazio 2002), i.e., DM (NE2001), in Figure 6(b) and YMW16 (Yao et al. 2017), i.e., DM (YMW16), in Figure 6(c). We see that D(θ) is not sensitive to the modeled Milky Way DMs. In all cases, it shows nonflat D(θ) at small θ. Nonflat SF indicates a possible correlation of electron density fluctuations within scales ≈2000 Mpc × 10° ≈350 Mpc. To evaluate the statistical uncertainty, we perform Monte Carlo simulations by randomizing DMs while holding the locations of FRBs fixed. As shown by D(θ) measured from 40 Monte Carlo realizations, the uncertainty becomes larger toward smaller θ with fewer pairs of FRBs available.

Figure 6. D(θ) vs. θ measured with 210 FRBs with total DM < 500 pc cm−3, corresponding to (a) total DM, (b) DM (NE2001), and (c) DM (YMW16). Both measurements with real data (red) and Monte Carlo realizations (black) are presented.
Download figure:
Standard image High-resolution imageThe measured ξ(θ) is shown in Figure 7. It is more sensitive to the modeled Milky Way DMs than D(θ). For comparison, we also present the analytically modeled ξ(θ; zs ) by Takahashi et al. (2021). In their model the free-electron abundance and the power spectrum of its spatial fluctuations are measured from hydrodynamic cosmological simulations, IllustrisTNG300 (Nelson et al. 2018). The cyan line shows its analytical approximation at θ ≳ 1°,

where zs is the source redshift. Takahashi et al. (2021) found that the above expression is insensitive to zs at zs ≳ 0.3 as a large-scale signal is dominated by nearby structures. This further justifies our use of a subset of FRBs with relatively small DMs. Our measured ξ(θ), with a large uncertainty, shows some trends of increasing ξ(θ) toward smaller θ at θ < 10°. Toward larger θ, ξ(θ) gradually approaches zero as theoretically expected. We see that as the theoretically modeled ξ(θ; zs ) is small, a more accurate comparison between the model and observational measurements requires a larger sample size and a higher angular resolution.

Figure 7. Same as Figure 6, but for ξ(θ). The cyan line shows the analytical approximation based on cosmological simulations given by Takahashi et al. (2021).
Download figure:
Standard image High-resolution imageTo examine whether D(θ) and ξ(θ) of FRBs provide similar information on the correlation of electron density fluctuations, in Figure 8, we compare the measured D(θ) with that derived from ξ(θ) by using the relation in Equation (3). The constant value in Equation (3) is determined by visually matching the two at large θ, which is 2.0 × 10⁴ pc2 cm−6 for the case with total DMs, and slightly larger for modeled extragalactic DMs, i.e., 2.1 × 10⁴ pc2 cm−6 for DM (NE2001) and 2.3 × 10⁴ pc2 cm−6 for DM (YMW16). We see that the measured D(θ) and that derived from ξ(θ) have a better agreement at θ ≳ 10°, indicative of the homogeneity of the large-scale density distribution. The discrepancy seen at smaller θ can be caused by the limited sample size, as smaller-θ measurements suffer larger statistical uncertainties. It can also be caused by intermediate-scale (on the order of 100 Mpc) inhomogeneities of intergalactic density distribution. Possible inhomogeneities in the universe on such length scales were suggested in, e.g., Kopylov et al. (1988), Sylos Labini et al. (2009), Sylos Labini (2011), and Perivolaropoulos (2014), based on the observed galaxy distribution and other effects, though these claims are controversial (e.g., Hogg et al. 2005; Ntelis et al. 2017). In the latter situation, we do not expect that D(θ) and ξ(θ) can be determined from each other at small θ even with a larger sample of FRBs. As the SF is less sensitive to large-scale fluctuations and has a higher accuracy using less data compared with the CF (Schulz-Dubois & Rehberg 1981), the statistical measurements of DM fluctuations at small θ with SF can be more reliable and informative.

Figure 8. Comparison between directly measured D(θ) (red) and D(θ) derived from measured ξ(θ) (dark blue). The cyan line corresponds to D(θ) derived from the analytical approximation of ξ(θ; zs ) given by Takahashi et al. (2021).
Download figure:
Standard image High-resolution imageObviously, the quantitative comparison between the simulated and observationally measured statistics of DM fluctuations requires a sufficiently large sample of FRBs. By using the rejection sampling method (Mackay 2003), we generate a large sample of mock FRBs from the target DM distribution of the CHIME FRBs with DM < 500 pc cm−3 (see Figure 9(a)). Under the consideration that future radio telescopes, such as the Square Kilometre Array, will enable full sky coverage, we have the mock FRBs randomly distributed across the entire sky. The measured D(θ) and that derived from ξ(θ) of the mock samples are presented in Figures 9(b) and (c). It shows that at least several thousands of FRBs are needed to have a clean comparison with the expectation from cosmological simulations. A larger angular resolution is achieved with the increase of sample size. We note that as the DM fluctuations of mock FRBs are uncorrelated and homogeneous, the flatness of D(θ) and the good match between D(θ) and that converted from ξ(θ) are expected for a sufficiently large sample (see Figure 9(c)).

Figure 9. (a) DM distributions of CHIME FRBs with DM < 500 pc cm−3 (dark gray) and mock samples of 855 (gray) and 6136 (light gray) FRBs. (b) and (c) Same as Figure 8, but for DMs of mock FRBs. Error bars indicate 95% confidence intervals.
Download figure:
Standard image High-resolution image
3. Summary
We compared the SF of DM fluctuations measured in XZ20 with FRBCAT and that measured with a larger sample of FRBs from the First CHIME/FRB Catalog. We found a consistent DM fluctuation level at θ ≳ 10° in both cases, but no clear power-law trend at smaller θ hinting toward large-scale turbulence can be recovered with the larger sample. The apparent signal in the earlier FRBCAT analysis is likely to be a statistical fluctuation caused by the scarcity of close FRB pairs in the FRBCAT sample, but the effect of different sky coverage of the two catalogs cannot be completely excluded.
To suppress the distortions by distances and host DMs on the statistical properties of intergalactic electron density fluctuations, we introduced a tentative DM cut and focused on a subset of CHIME FRBs with DM < 500 pc cm−3. Nonflat D(θ) is observed at θ < 10° for the subsample, but the statistical uncertainty is large due to the DM cut.
We also measured the CF, i.e., ξ(θ), of the subsample. Compared with D(θ), it is more sensitive to the Milky Way DM models, showing more obvious differences between the measurements with total DMs and modeled extragalactic DMs. A trend of increasing ξ(θ) with decreasing θ is seen, with a large statistical uncertainty. As the theoretically expected correlation signal is weak (Takahashi et al. 2021), a larger sample size with a higher angular resolution is necessary for a more accurate comparison between the modeled and observationally measured ξ(θ).
The discrepancy between D(θ) and that converted from ξ(θ) at θ ≲ 10° can arise from large statistical uncertainties or density inhomogeneities on scales on the order of 100 Mpc. In the latter situation, the discrepancy would persist when more FRBs are available. Its potentially important cosmological implications on, e.g., determination of the Hubble constant (Fanizza et al. 2021), deserve further study. The inhomogeneous distribution of matter on scales ≲ 100 Mpc can give rise to deviations from isotropic and homogeneous expansion due to gravitational induced peculiar velocities, and thus the value of the Hubble constant measured at distances ≲ 100 Mpc has a large scatter (e.g., Shi & Turner 1998; Freedman & Turner 2003). As demonstrated by our analysis with mock FRBs, a large sample of several thousands of FRBs is needed for a clean comparison with the expectation from cosmological simulations and determining the effect of statistical uncertainties on the apparent disagreement between D(θ) and that converted from ξ(θ) of the current FRB sample.
S.X. acknowledges the support for this work provided by NASA through the NASA Hubble Fellowship grant No. HST-HF2-51473.001-A awarded by the Space Telescope Science Institute, which is operated by the Association of Universities for Research in Astronomy, Incorporated, under NASA contract NAS5-26555.
Software: MATLAB (MATLAB 2021).
Footnotes
- 5
- 6
- 7
Some FRBs in the two catalogs have overlapping sky positions.