


Abstract
As the Sun rotates, a fast stream can overtake a preceding slow stream, leading to the formation of a stream interaction region (SIR). Two neighboring SIRs may eventually coalesce to produce a merged interaction region (MIR) en route to the outer heliosphere. However, instances of significant interaction and merging of two neighboring SIRs within 1 au are thought to be extremely rare. In this Letter, we present a case report of two interacting and merging SIRs observed near 1 au, which was associated with two adjacent low-latitude coronal holes. The two SIRs were filled with outward propagating Alfvénic fluctuations associated with magnetohydrodynamic turbulence. A reconnection exhaust associated with a current sheet was identified. We suggest that magnetic reconnection represented a potentially important mechanism for the merging of two neighboring SIRs. This observation may shed light on the understanding of the structure and formation of a MIR within 1 au.
Export citation and abstract BibTeX RIS
1. Introduction
The solar wind plasma, together with the frozen-in magnetic field, flows nearly radially outward from the Sun. Solar rotation can facilitate a fast stream catching up with a preceding slow stream. Generally, these do not interpenetrate each other because they originate from different sources on the Sun and are threaded by different magnetic field lines (Krieger et al. 1973; Burlaga et al. 1978; Gosling & Pizzo 1999). Instead, a stream interaction region (SIR) bounded by a pair of forward-reverse pressure waves is formed as a result of this collision (Richardson 2018). As the compression intensifies, the pressure waves can steepen into forward and reverse shocks, typically beyond ∼2 au (Hundhausen & Gosling 1976) (about 24% of shocks occurring with SIRs at 1 au; Jian et al. 2006). The propagation of the forward and reverse shocks widens the dimension of the SIR. The shocks belonging to two neighboring SIRs eventually collide, interpenetrate, and coalesce to form a merged interaction region (MIR) at a larger heliocentric distance, i.e., greater than 8 au (Burlaga 1995).
Significant interaction and merging of two neighboring SIRs could occur near the Sun, but this is difficult to discern at 1 au due to the loss of their individual identities; therefore, little is known about the merging processes within 1 au. Previous studies have shown that multi-spacecraft measurements well separated in longitude allow us to infer the spatial and temporal evolution of an SIR (Jian et al. 2009; Mason et al. 2009). This implies that it should be possible to discover evidence of the interaction and merging of two neighboring SIRs with multi-spacecraft observations near 1 au. Motivated by this implication, we analyzed the neighboring SIR events detected by STEREO A and B, ACE, and WIND between 2007–2016, with a focus on the evolutionary changes of individual SIRs. We successfully identified one event that included two interacting and merging SIRs, which are associated with two adjacent low-latitude coronal holes. This event occurred in Carrington Rotation (CR) 2112, when two individual SIRs were observed by WIND and ACE, whereas two interacting and merging SIRs were observed by STEREO A. This Letter provides a report of this event. Considering the fact that the SIRs are large-scale structures and the observations from WIND and ACE are rather similar, the observations of ACE will not be displayed.
2. Data
The WIND spacecraft is located around the Lagrangian point L1 upstream of the Earth. For WIND, we used the 1 minute resolution data from the Magnetic Fields Investigation (Lepping et al. 1995). The plasma and suprathermal electron data are from the 3D Plasma and Energetic Particles Experiment (Lin et al. 1995). The twin STEREO spacecraft (STEREO A and B) were launched on 2006 October 26, at 00:52 UT, and then escaped into orbits about the Sun near 1 au. In heliospheric orbit, one spacecraft trails the Earth while the other leads. As viewed from the Sun, the two spacecraft separate at approximately 44°–45° per year (Kaiser et al. 2008). For STEREO, we use the 1 minute time resolution data from the In situ Measurements of Particles and CME Transients (IMPACT; Luhmann et al. 2008) and the Plasma and Suprathermal Ion Composition (Galvin et al. 2008). The solar wind magnetic field data was collected by the IMPACT/Magnetometer (Acuña et al. 2008) instrument. The suprathermal electron pitch angle distribution with 30 s time resolution was obtained by the Solar Wind Electron Analyzer (Sauvaud et al. 2008). The low coronal synoptic observations at 195 Å were obtained by the Sun Earth Connection Coronal and Heliospheric Investigation/Extreme UltraViolet Imager (SECCHI/EUVI) on STEREO A and B (Howard et al. 2008) and the Extreme ultraviolet Imaging Telescope on SOHO.
3. Observations and Analysis
Figure 1 displays the positions of three widely separated spacecraft (WIND, STEREO A, and B) in heliocentric Earth-ecliptic (HEE) coordinates on 2011 July 6 (middle time point of CR 2112) for reference purposes. The HEE coordinates are fixed with respect to the Earth–Sun line, where the X-axis is from the Sun toward the Earth, and Z-axis is perpendicular to the plane of the Earth's orbit around the Sun, with the Y-axis completing the right-handed triad. The WIND spacecraft was located around the Lagrangian point L1 upstream of the Earth. STEREO A and B were 97 7 west and 925 east of the Earth with a distance of 0.96 au and 1.02 au from the Sun, respectively.
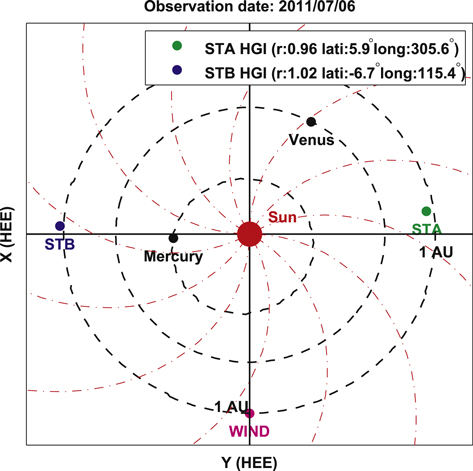
Figure 1. Positions of the spacecraft (WIND, STEREO A, and B) and planets in heliocentric Earth-ecliptic (HEE) coordinates on 2011 July 6. The red dotted–dashed curves approximately represent the tracks of solar wind. HGI stands for heliographic inertial coordinates.
Download figure:
Standard image High-resolution imageFigure 2 shows solar wind plasma and magnetic field data observed by WIND between 2011 July 8–12, encompassing two neighboring SIRs (SIR1_W, SIR2_W). The two SIRs were clearly identified by a significant compression of interplanetary magnetic field  , an increase of proton speed Vp, an increase and then a decrease of proton number density Np, an enhancement of proton temperature Tp, and a significant enhancement of total perpendicular pressure Pt (defined as the sum of the magnetic pressure and plasma thermal pressure perpendicular to the magnetic field). The stream interfaces (SI1_W, SI2_W), characterized by a decrease in solar wind density and an increase in temperature, can be discerned at about 08:00 UT on July 9 and at 19:00 UT on July 11 for SIR1_W and SIR2_W, respectively. At the leading and trailing edges of SIR1_W, no forward or reverse shocks were observed. At the two edges of SIR2_W, a strong forward shock was well developed, while the reverse shock had not formed. A heliospheric plasma sheet (HPS) characterized by enhanced Np and decreased magnetic field
  (Winterhalter et al. 1994), bordering a heliospheric current sheet (HCS), was embedded within SIR1_W. SIR1_W was formed by a fast stream (FS1) overtaking the preceding ambient solar wind with a speed of about 350 km s−1, and SIR2_W was formed from the interaction of a faster streamer (FS2) and the preceding fast stream (FS1). The duration between the two individual SIRs is only about 27 hr, implying that they might originate from two adjacent coronal holes. To confirm this, we examined coronal hole images during CR 2111–2112.

Figure 2. Solar wind parameters observed by WIND during 2011 July 8–12. From top to bottom: pitch angle distribution of suprathermal electron (∼300 eV), magnetic field strength, elevation, and azimuthal angles of field direction in RTN coordinates, proton velocity, proton density, proton temperature, and total perpendicular pressure. The two gray shaded regions mark two SIRs (SIR1_W and SIR2_W). The red shaded region indicates the heliospheric plasma sheet (HPS). The two green vertical dashed lines mark the stream interfaces (SI1_W and SI2_W). The magenta dashed vertical line indicates the HCS crossing.
Download figure:
Standard image High-resolution imageFigure 3(a) illustrates the synoptic coronal hole plots from the Global Oscillation Network Group (GONG), with open field footprints shown in red and green (representing positive and negative coronal holes, respectively), the closed field at the source surface shown in blue, and the HCS at the source surface shown in black for CR 2111–2112 with central Carrington longitude of 321°. The intersection of the dotted–dashed vertical yellow lines and the yellow curve near equator marks the position of WIND at 23:55:30 UT on July 5 (selected time). Figure 3(b) shows STEREO EUV Carrington map with the same longitude and latitude interval as represented in Figure 3(a). It is well known that fast streams originate from coronal holes. Assuming the coronal sources are relatively steady, the longitude positions of coronal holes can be derived from the observations of the corresponding fast streams near 1 au. In this way, we estimated that the coronal source of SIR1_W located at longitudes around 307°–364° corresponding with steam speeds of 350–500 km s−1, and the coronal source of SIR2_W located at longitudes around 265°–307° corresponding with steam speeds of 500–720 km s−1. Combining the estimated source longitudes with the GONG magnetogram synoptic map and STEREO EUV map, it is immediately clear that the fast streams FS1 and FS2 emanated from two isolated low-latitude coronal holes, one in the southern hemisphere and the other in the northern hemisphere, as marked by two red rectangles in Figures 3(a) and (b). We further examined the SDO/AIA 193 Å synoptic map for CR 2112 (not shown), and did find the two isolated low-latitude coronal holes (one located at longitude ∼290° and latitude ∼−20°, and the other located at longitude ∼330° and latitude ∼20°), which is well consistent with the observations by STEREO.
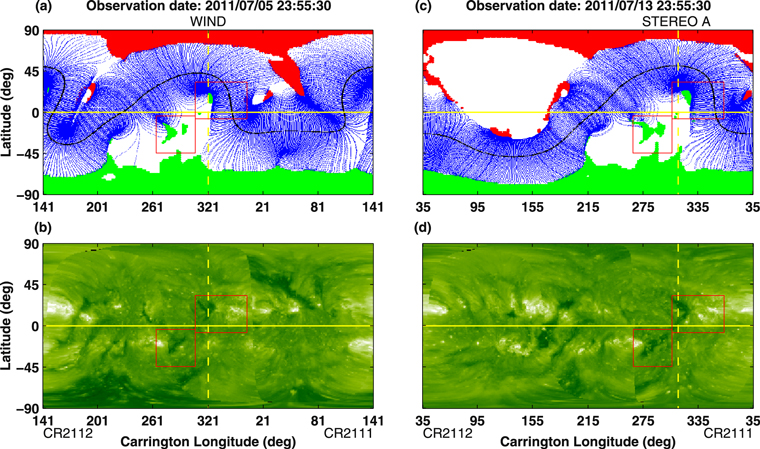
Figure 3. Trajectory of WIND (the yellow curve near the equator) overlaid on (a) GONG magnetogram synoptic map and (b) STEREO extreme ultraviolet (EUV) Carrington map for CR 2111–2112 with central Carrington longitude of 321°. The intersection of the dashed vertical yellow lines and the yellow curve above the equator marks the position of WIND at 23:55:30 UT on 2011 July 5. The open field footprints in GONG map are colored red and green, representing positive and negative coronal holes, respectively. The closed field at the source surface is colored blue. The HCS at the source surface is shown in black. The two red rectangles mark two coronal sources. (c) and (d) are the same as (a) and (b), but for STEREO A during CR 2111–2112 with central Carrington longitude of 215°. The intersection of the dashed vertical yellow lines and the yellow curve near the equator marks the position of STEREO A at 23:55:30 UT on 2011 July 13.
Download figure:
Standard image High-resolution imageFigures 3(c) and (d), respectively, show the GONG magnetogram synoptic map and STEREO EUV map for CR 2111–2112 with central Carrington longitude of 215°. The intersection of the dotted–dashed vertical yellow lines and the yellow curve near the equator marks the position of STEREO A at 23:55:30 UT on July 13. As we can see, the two isolated low-latitude coronal holes persisted and entered the field of view of EUVI imagers on STEREO A. Figure 4(a) shows the in situ observations by STEREO A for the period 2011 July 14–18. It is interesting to note the two interacting and merging SIRs (SIR1_STA, SIR2_STA), rather than the two individual SIRs encountered by STEREO A. It seems that the trailing SIR associated with the coronal hole in the southern hemisphere had coalesced with the trailing portion of the preceding fast stream emanating from the coronal hole in the northern hemisphere by the time they were observed near 1 au. That is, the observed SIR2_STA is essentially an MIR. The boundary between SIR1_STA and SIR2_STA was easily identified from the sharp drop in magnetic field strength at about 16:28 UT on July 16. SIR1_STA was characterized by increased proton speed, enhanced proton density, and magnetic field strength, together with compressional proton heating. The stream interface of SIR1_STA (SI1_STA), characterized by a sharp drop in proton density, a sharp rise in proton temperature, and a jump in proton speed, was detected at about 09:50 UT on July 16. Similar to the observations by WIND, an HPS bordering the HCS was embedded within SIR1_STA. SIR2_STA, with slightly higher total pressure than outside, was spreading and merging with SIR1_STA ahead of it. The trailing edge of SIR2_STA was identified by the rapid decreases in magnetic field strength and suprathermal electron fluxes at around 21:00 UT on July 17. The temporal profiles of proton density, temperature, and magnetic field strength within SIR2_STA were relatively flat, and thus the expected stream interface (SI2_STA), separating solar wind plasma of different origins, was difficult to identify. Rather than a gradual velocity increase as exhibited in most SIRs at 1 au, the proton speed decreased from about 550 to 500 km s−1 within SIR2_STA. Such a scenario typically could occur at larger heliocentric distances, i.e., at 5.3 au (see Jian et al. 2008). These irregular parameter profiles imply that SIR2_STA underwent significant evolution through the interaction and merging process.
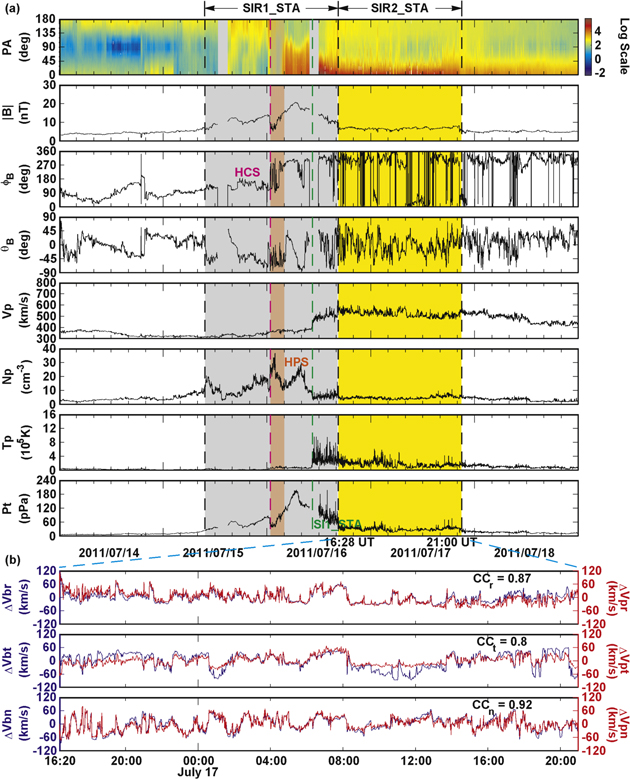
Figure 4. (a) Solar wind parameters observed by STEREO A during 2011 July 14–18. From top to bottom: pitch angle distribution of suprathermal electron (246.6 eV), magnetic field strength, azimuthal and elevation angles of field direction in RTN coordinates, proton velocity, proton density, proton temperature, and total perpendicular pressure. The gray and yellow shaded regions mark two interacting SIRs (SIR1_STA and SIR2_STA). The red shaded region indicates the heliospheric plasma sheet. The green vertical dashed line marks the stream interfaces (SI1_STA). The magenta dashed vertical line indicates the HCS crossing. (b) Fluctuations of the components of the proton velocity (δVpr, δVpt, δVpn) and the Alfvénic velocity (δVbr, δVbt, δVbn) derived from magnetic field fluctuations.
Download figure:
Standard image High-resolution imageHigh-speed streams and SIRs are usually filled with a population of Alfvén waves propagating away from the Sun in the solar wind frame. To examine whether Alfvén waves are present in the two interacting SIRs of interest in this Letter (i.e., SIR1_STA and SIR2_STA), we conducted a correlation analysis between the fluctuations in the components (in RTN coordinates) of the proton velocity (δVpr, δVpt, δVpn) and the Alfvénic velocity (δVbr, δVbt, δVbn) derived from magnetic field fluctuations (see Guo et al. 2016). The results suggest that high correlations (0.87, 0.80, 0.92) occur in the interval from 16:20 UT on July 16 to 21:00 UT on July 17, as shown in Figure 4(b). The high degree of positive correlation, together with the sunward-pointing mean magnetic field (Br > 0, not shown), indicates outward propagating Alfvén waves embedded in the trailing portion of SIR1_STA and in SIR2_STA. Alfvénic fluctuations are often interpreted in terms of magnetohydrodynamic (MHD) turbulence. To study the properties of the Alfvénic turbulence, we calculated the power spectral density of the magnetic field  fluctuations during the interval between 16:28 and 16:58 UT on 2011 July 16, when the high-resolution (0.125 s) data is available. The result shows that the spectrum index is −1.66 in the frequency range 0.01–0.2 Hz, which is close to the Kolmogorov value of −5/3. Then we calculated the probability density function of magnetic field fluctuations and identified non-Gaussian distribution at small timescales (e.g., 0.5 and 1 s), which is thought to be associated with the intermittent character of MHD turbulence (Osman et al. 2014). The intermittent character might be related to the thin current sheets that were presumably produced by the turbulent cascade (see Schwenn & Marsch 1991).
It has been suggested that intermittent structures associated with current sheets are candidate sites for magnetic reconnection (Gosling 2007; Osman et al. 2014; Lalescu et al. 2015). We performed a comprehensive search for reconnection exhausts associated with current sheets in Alfvénic turbulence, and identified an exhaust near the trailing edge of SIR1_STA. It is characterized by the depression in magnetic field strength and the enhancements in proton density and temperature near the trailing edge of SIR1_STA. The dropouts of suprathermal electron flux might also be a signature of magnetic reconnection (Pagel et al. 2005). STEREO A encountered the reconnection exhaust between 16:16:48 and 16:19:36 UT on 2011 July 16, as shown in Figure 5, where magnetic field and plasma velocity are projected in the LMN current sheet coordinate system, with L along the antiparallel magnetic field direction, M along the X-line direction, and N along the overall current sheet normal. As we can see, the normal magnetic field component, BN, and velocity component, VN, varied slightly during the interval. In contrast, the antiparallel magnetic field component, BL, changed from −10 to 10 nT, implying a bifurcated current sheet, and velocity component, VL, increased about ∼120 km s−1. Also, we calculated the power spectral density of the magnetic field  fluctuations during a 10 minutes interval encompassing the observed exhaust. The results show that the spectrum index is −1.65 in the frequency range 0.01–0.2 Hz. As expected, the magnetic field fluctuations exhibited non-Gaussian features due to current sheet. Despite only one exhaust encountered, many more reconnection events might have taken place through the interaction process and led to the ongoing coalescence.

Figure 5. Solar wind parameters observed by STEREO A during 16:00−16:40 UT on 2011 July 16. From top to bottom: pitch angle distribution of suprathermal electron (246.6 eV), magnetic field components in LMN coordinates, proton velocity, velocity components in LMN coordinates, magnetic field strength, azimuthal and elevation angles of field direction in RTN coordinates, proton density, and proton temperature. Vertical magenta dashed lines bracket a reconnection exhaust. Vertical black dashed line marks the boundary between SIR1_STA and SIR2_STA at 16:28 UT.
Download figure:
Standard image High-resolution image
4. Discussion
We have presented evidence for the interaction and merging of two neighboring SIRs within 1 au from multi-spacecraft observations. For both SIRs, the bounding pressure waves had not yet steepened into shocks at STEREO A. Thus, the coalescence process might involve the collision and merging of pressure waves, which should be quite different from the collision and merging of shocks typically at large heliocentric distances (Burlaga 1983; Whang & Burlaga 1985). It should be mentioned that the trailing SIR drove a strong forward shock at WIND, but no forward shock was present at STEREO A. This might be mainly due to the temporal variation of the plasma source region.
In the trailing portion of SIR1_STA and in SIR2_STA, the streams were filled with outward propagating Alfvénic fluctuations associated with MHD turbulence. Numerous thin current sheets presumably produced by the turbulent cascade were present in the interval of Alfvénic turbulence. A reconnection exhaust associated with a current sheet was identified. It is likely that many more reconnection events had occurred through the interaction process and led to the ongoing coalescence. We suggest that magnetic reconnection represents a potentially important mechanism for the merging of two neighboring SIRs. It should be stressed that there is no direct observational evidence for reconnection exhausts that were dynamically generated by Alfvénic turbulence for the present event. However, previous theoretical studies suggested that the turbulence can help to trigger or promote a fast magnetic reconnection (Lazarian & Vishniac 1999; Kowal et al. 2009, 2017; Eyink et al. 2011; Lalescu et al. 2015). Furthermore, the connection between intermittent plasma turbulence and magnetic reconnection is supported by numerical simulations. With three-dimensional magnetohydrodynamic simulations, Kowal et al. (2009) found that an enhanced reconnection rate is obtained in the presence of turbulence. In return, the interactions of reconnection outflows between stochastic reconnections can contribute to the generation of turbulence (see Kowal et al. 2017; He et al. 2018).
According to the statistical analysis of Gosling (2007), reconnection occurs relatively infrequently in the Alfvénic turbulence that permeates the high-speed streams. This might partly explain why instances of significant interaction and merging of two neighboring SIRs within 1 au are extremely rare. Meanwhile, this raises a challenging question as to whether or not magnetic reconnection occurs far more frequently at the leading or trailing edges of neighboring SIRs at larger heliocentric distances because of significant shock collision, and therefore facilitates the coalescence process. We believe a detailed investigation of events with reconnection embedded within Alfvénic fluctuations will improve our understanding of the interaction and merging of neighboring SIRs.
This research is supported by the National Natural Science Foundation of China (41674147, 41731067, 41531073, and 61872047), the Collaborating Research Program of CAS Key Laboratory of Solar Activity, National Astronomical Observatories (KLSA201802), and the Specialized Research Fund for State Key Laboratories. We acknowledge the use of data from STEREO, SOHO, WIND, ACE, and NSO/GONG magnetogram synoptic map. We are grateful to Jiansen He for his valuable comments that improved the manuscript.