


 t 19c, B-4000 Liège, Belgium

Abstract
SY Cha is a T Tauri star surrounded by a protoplanetary disk with a large cavity seen in the millimeter continuum but has the spectral energy distribution of a full disk. Here we report the first results from JWST/Mid-InfraRed Instrument (MIRI) Medium Resolution Spectrometer (MRS) observations taken as part of the MIRI mid-INfrared Disk Survey (MINDS) GTO Program. The much improved resolution and sensitivity of MIRI-MRS compared to Spitzer enables a robust analysis of the previously detected H2O, CO, HCN, and CO2 emission as well as a marginal detection of C2H2. We also report the first robust detection of mid-infrared OH and rovibrational CO emission in this source. The derived molecular column densities reveal the inner disk of SY Cha to be rich in both oxygen- and carbon-bearing molecules. This is in contrast to PDS 70, another protoplanetary disk with a large cavity observed with JWST, which displays much weaker line emission. In the SY Cha disk, the continuum, and potentially the line, flux varies substantially between the new JWST observations and archival Spitzer observations, indicative of a highly dynamic inner disk.
Export citation and abstract BibTeX RIS

Original content from this work may be used under the terms of the Creative Commons Attribution 4.0 licence. Any further distribution of this work must maintain attribution to the author(s) and the title of the work, journal citation and DOI.
1. Introduction
SY Cha is a 1–2 million year old protoplanetary disk in the Chamaeleon I star-forming region at a distance of 180.7 pc (Gaia Collaboration et al. 2021; Galli et al. 2021). Recent Atacama Large Millimeter/submillimeter Array (ALMA) observations revealed a large cavity with a radius 70 au in millimeter continuum emission (Orihara et al. 2023). Such cavities are a hallmark of transition disks. Transition disks were first identified as a subclass of protoplanetary disks based on the comparatively small excess of emission relative to a stellar blackbody in the near-infrared (Strom et al. 1989). This was interpreted as due to a deficiency of dust in the inner regions of the disk, which was later confirmed by imaging in the submillimeter (Calvet et al. 2002; Hughes et al. 2007). During the Spitzer era, the term pretransitional disks was coined to describe disks with a deficit of emission from 5 to 20 μm while still displaying excess emission in the 2–5 μm range, interpreted as arising from an optically thick inner disk (Brown et al. 2007; Espaillat et al. 2007).
Many transition disks have now been identified, both from spectral energy distributions (SEDs) and imaging (Andrews et al. 2011; Espaillat et al. 2014; Ercolano & Pascucci 2017; Francis & van der Marel 2020). While the term "transition disk" was first coined based on SEDs, here we use the more general definition of any protoplanetary disk with a large dust cavity, regardless of whether a system would be classified as transitional or pretransitional based on its SED alone (e.g., Espaillat et al. 2014; van der Marel 2023). The mismatch between SED and millimeter imaging can be due to, e.g., a misaligned inner disk or a millimeter-grain-poor cavity which still contains micron-sized grains (van der Marel et al. 2018; Villenave et al. 2019). The mechanisms through which the inner disk is cleared of millimeter grains remain unclear. Potential explanations include clearing by photoevaporative winds, inward drift of large grains, and gap clearing by a low-mass companion (Lin & Papaloizou 1979; Birnstiel et al. 2012; Alexander et al. 2014; Bae et al. 2023; Pascucci et al. 2023).
The median accretion rate for stars with transition disks is comparable to that of full protoplanetary disks, i.e., those without large inner dust cavities, indicating gas is still present at small radii (Sicilia-Aguilar et al. 2010). Photoevaporative winds are disfavored as the cavity-forming mechanism for disks with large accretion rates (van der Marel et al. 2018). Many transition disks have gas cavities which are smaller than the associated dust cavity, which is expected in the planet–disk scenario (e.g., Carmona et al. 2014, 2017). Two such disks, PDS 70 and HD 169142, have been conclusively shown to host planets in their dust cavities (Keppler et al. 2018; Müller et al. 2018; Gratton et al. 2019; Haffert et al. 2019; Hammond et al. 2023). Tentative evidence for planets within the inner cavity of transition disks exists for several additional systems (e.g., Currie et al. 2022; Long et al. 2022; Stadler et al. 2023). Whether all transition disks are formed by planet clearing or multiple mechanisms are at play remains unclear.
Observations of transition disks with the Spitzer InfraRed Spectrograph (IRS) reveal that mid-infrared variability on timescales of several years is common, with two general types of variability (Espaillat et al. 2011). The first is when emission at short and long wavelengths varies inversely in a "seesaw" behavior. Such variability could be caused by unseen planets warping the inner disk (Muzerolle et al. 2009). A more uniform intensity shift at all mid-infrared wavelengths has also been observed in transition disks, and is likely due to a change in incident flux from the central star (Espaillat et al. 2011).
Spectral indices, a measure of the ratio of the flux density for two wavelength ranges, denoted n, are used to characterize the SEDs of protoplanetary disks (e.g., Furlan et al. 2006; Kessler-Silacci 2006). Pontoppidan et al. (2010) found that the five systems classified as transition disks in their Spitzer sample, based on their IR spectral index, n13−30, did not exhibit molecular line emission other than H2 down to the 1% line-to-continuum level. Subsequent work by Banzatti et al. (2020) found an inverse correlation between the outer radius of the millimeter dust disk as observed by ALMA and the luminosity of H2O lines in the mid-infrared. They further speculated that disks with large inner cavities may have weaker H2O lines compared to other large disks, since icy pebbles are prevented from drifting inward. However, they note additional data are needed to confirm this hypothesis. It has also been suggested that even when pebbles are stopped from moving inward, micron-size particles well coupled to the gas can transport water inward (Potapov et al. 2018; Perotti et al. 2023).
Here we report our findings on the inner disk of SY Cha, based on JWST observations. SY Cha was observed as part of the as part of the Mid-InfraRed Instrument (MIRI) mid-INfrared Disk Survey (MINDS) GTO Program (PID: 1282, PI: T. Henning). Previous results from the MINDS program include the first detection of 13CO2 in a protoplanetary disk (Grant et al. 2023), rich hydrocarbon chemistry in a disk around a very low-mass star (Tabone et al. 2023), abundant water but a substellar C/O ratio in a full protoplanetary disk (Gasman et al. 2023), and water in the inner disk of a transition disk known to host planets in its cavity (Perotti et al. 2023). An overview of the full MINDS sample is given by Kamp et al. (2023) and T. K. Henning et al. (2024, in preparation).
SY Cha would not be classified as a transition disk based on its IR spectral index of n13−30 = −0.17 (Banzatti et al. 2020). However, recent ALMA observations reveal a ring of continuum emission centered at 0 559 (101 au) with an FWHM of 022 (40 au), an inner gap, and unresolved emission centered on the star with a radius no larger than 0025 (2.3 au; Orihara et al. 2023). This small-scale component could be due to an inner disk, free–free emission, or an ionized wind (Francis & van der Marel 2020). Other source properties are listed in Table 1. The 13CO and C18O J = 2 − 1 emission also appears to be ring like, though with an inner radius smaller than that of the dust ring. Additionally, near the central star the 12CO emission displays a deviation from Keplerian rotation, which Orihara et al. (2023) posit could be due to either a warped inner disk or a radial flow such as a wind. Interestingly, the CO rovibrational lines at 4.7 μm, which often include a disk wind component, were not detected toward SY Cha using the high-spectral-resolution CRIRES instrument on the Very Large Telescope (Brown et al. 2013). Either a highly inclined inner disk or the presence of gas (and thus also small dust grains coupled to the gas) inside the millimeter cavity would explain why SY Cha's SED does not include the classic signature of a transition disk. Orihara et al. (2023) found models with a highly inclined inner disk to be consistent with their ALMA observations, though more modeling work is needed to provide a definitive result. Spitzer detected mid-infrared emission originating from the inner disk for H2O, HCN, C2H2, and CO2, while only upper limits for OH were reported (Salyk et al. 2011b; Banzatti et al. 2020). The much improved sensitivity and spectral resolution of MIRI's Medium Resolution Spectrometer (MRS) compared to Spitzer/IRS enables a more detailed analysis of the mid-infrared line emission, particularly in the 5–10 μm range, which was not covered by Spitzer/IRS's high-resolution mode.
Table 1. Properties of SY Cha
| Parameter | Value |
|---|---|
| Stellar mass | 0.70 M⊙ |
| Stellar luminosity | 0.55 L⊙ |
| Effective temperature | 4030 K |
| Accretion luminosity | 7.39 × 10⁻³ L⊙ yr−1 |
| Mass accretion rate | 6.6 × 10⁻¹⁰ M⊙ yr−1 |
| Spectral type | K5Ve |
| Distance | 180.7 pc |
| Disk inclination | 51 1 1 |
Note. Spectral type classification from Frasca et al. (2015). Disk inclination from Orihara et al. (2023). All other values are from Manara et al. (2023), using updated data from Gaia Collaboration et al. (2021) and stellar models from Feiden (2016).
Download table as: ASCIITypeset image
2. Data Reduction and Analysis
2.1. Observations and Data Reduction
SY Cha was observed with MIRI 19 in MRS 20 mode on 2022 August 8 as part of the MINDS GTO Program (PID: 1282, PI: T. Henning). The total exposure time was 3696 s using a four-point dither pattern in the positive direction.
The data were processed using version 1.9.4 of the JWST pipeline (Bushouse et al. 2023). Bespoke routines based on the vip package were used for background subtraction, bad pixel correction after stage 2, and spectral extraction (Gomez Gonzalez et al. 2017; Christiaens et al. 2023). At the Spec2 stage the standard flat-fielding and fringe corrections from the JWST pipeline were used. The background was then created using the minimum values among the four dither positions and smoothed with a median filter. Spectra were extracted from the final cubes using apertures twice the FWHM in size centered on the source centroid, identified with a 2D Gaussian fit. After extraction, residual fringe correction was carried out for each wavelength band. The final spectrum is presented in Figure 1.

Figure 1. Top: JWST/MIRI-MRS spectrum of SY Cha. Coloring designates the short, medium, and long subbands in the four integral field units. Major atomic and H2 lines, as well as dust features, are labeled. Bottom: mid-infrared spectrum of SY Cha as observed by Spitzer/IRS in high-resolution and low-resolution mode compared to JWST/MIRI-MRS. The Spitzer observations were taken from CASSIS (Lebouteiller et al. 2011, 2015).
Download figure:
Standard image High-resolution imageVisual inspection of the data cubes reveals the H2 and [Ne ii] emission to be extended, while the rest of the line emission and the continuum is spatially unresolved. The above data reduction was not optimized for extended emission. Analysis of the extended H2 emission, likely indicating the molecular component of a wind, will be presented in a separate work and is not discussed further here.
2.2. Continuum Emission
The overall spectrum shows stronger emission than observed by Spitzer in either low-resolution or high-resolution mode, with the Spitzer high-resolution observations (2004 August 31 and 2008 May 1) sitting between the low-resolution (2009 April 9) and MIRI observations (2022 August 8, see Figure 1). The largest differences are seen between the new MIRI observations and the low-resolution Spitzer observations from 2009, with the MIRI spectrum roughly 10% stronger at 6 μm, 40% at 10 μm, and 30% at 20 μm. The spectrophotometric accuracy is 2%–10% for Spitzer/IRS and 5.6% ± 0.7% for JWST/MIRI-MRS (Furlan et al. 2006; Watson et al. 2009; Argyriou et al. 2023). The increased spatial resolution of JWST lessens the chance of contaminating emission from other objects. Such contamination in the Spitzer data would result in a higher flux relative to JWST, the opposite of what we observe. While the difference in flux at short wavelengths is within the calibration uncertainty, the difference beyond 10 μm is not.
Transition disks are known to be variable in the IR. The level of variability seen between the Spitzer and JWST observations of SY Cha is similar to the variability of transition and pretransition disks observed over multiple epochs with Spitzer by Espaillat et al. (2011). That the variability is greater at longer wavelengths points to changes in the inner disk geometry as the source of the variability in SY Cha. A more nuanced understanding of the cause of the mid-infrared variability in SY Cha requires detailed radiative transfer modeling, which will be presented in subsequent work.
2.3. Fitting Atomic Emission
The strongest atomic line features are shown in Figure 2. To determine the total flux from each transition, we fit a Gaussian line profile using the Markov Chain Monte Carlo package emcee (Foreman-Mackey et al. 2013). Because many of the atomic lines overlap with nearby transitions, a two-component Gaussian is used. Only the Gaussian fit to the atomic transition is used when integrating to get the total flux. Each Gaussian fit is integrated over the respective wavelength range shown in Figure 2. For subtraction purposes, the continuum is defined by selecting apparently line-free pixels (see Appendix A) and then interpolating with a spline fit. The spline fit to these points is then subtracted from the spectrum. The rms noise, σ, of the continuum-subtracted spectrum is calculated by taking the standard deviation in a line-free wavelength range. Values for σ are given in Table 2. Best-fit models are identified using a modified reduced χ2 fitting:

where N is the number of data points used in the fitting, Fobs and Fmod are the observed and model line flux, respectively, and σ is the rms noise calculated in a nearby line-free region.

Figure 2. Zoom-in view of continuum-subtracted spectra at the brightest atomic lines. Gray dots denote the wavelengths used for the continuum subtraction. Yellow line shows the best-fit Gaussian for the atomic line. When applicable, red and dark blue lines show the additional Gaussian fit to overlapping lines and the combined fit, respectively.
Download figure:
Standard image High-resolution imageTable 2. Integrated Flux of the Gaussian Fits to Atomic Lines
| Transition | Line Center | σ | Integrated Flux | Continuum | rms | χ2 |
|---|---|---|---|---|---|---|
| (μm) | 10−3 (μm) | 10−15 (erg s−1 cm−2) | (μm) | 10−27 (erg s−1 cm−2 Hz−1) | ||
| H i 10–6 | 5.129 | 1.2 | 1.98 | 5.096–5.102 | 1.52 | 25.5 |
| H i 12–7 | 6.772 | 1.3 | 1.62 | 6.777–6.782 | 0.46 | 26.9 |
| H i 6–5 | 7.460 | 4.3 | 8.17 | 7.49–7.4954 | 2.65 | 20.3 |
| H i 8–6 | 7.503 | 4.2 | 1.58 | 7.49–7.4954 | 2.65 | 1.24 |
| H i 11–7 | 7.508 | 1.1 | 0.48 | 7.49–7.4954 | 2.65 | 1.24 |
Note. σ is the full width half max of the best-fit Gaussian. χ2 is the reduced chi squared value for the best fit model.
Download table as: ASCIITypeset image
2.4. Fitting Molecular Emission
We characterize the observed molecular emission by fitting local thermodynamic equilibrium (LTE) 0D slab models, as presented by Tabone et al. (2023), to the individual subbands. Each model is a slab of gas with a uniform temperature and density and no implicit spatial information. The LTE assumption is valid when all energy levels of a given species are well characterized by a single excitation temperature. Continuum subtraction and noise estimation are carried out in the same way as for the atomic emission (Section 2.3). The points used for continuum subtraction are listed in Appendix A. The wavelength range used to calculate the noise and the resulting values are shown in Figures 3 and 4.

Figure 3. Top: continuum-subtracted observations (black) and cumulative model adding the contributions from each molecule (yellow) from 4.9 to 7.6 μm. Gray dots denote the wavelengths used for the continuum subtraction. Black horizontal lines indicate the line-free region used to calculate the rms noise. Other horizontal lines indicate the wavelength range considered when fitting each molecule. Bottom: individual LTE slab models for each molecule.
Download figure:
Standard image High-resolution image
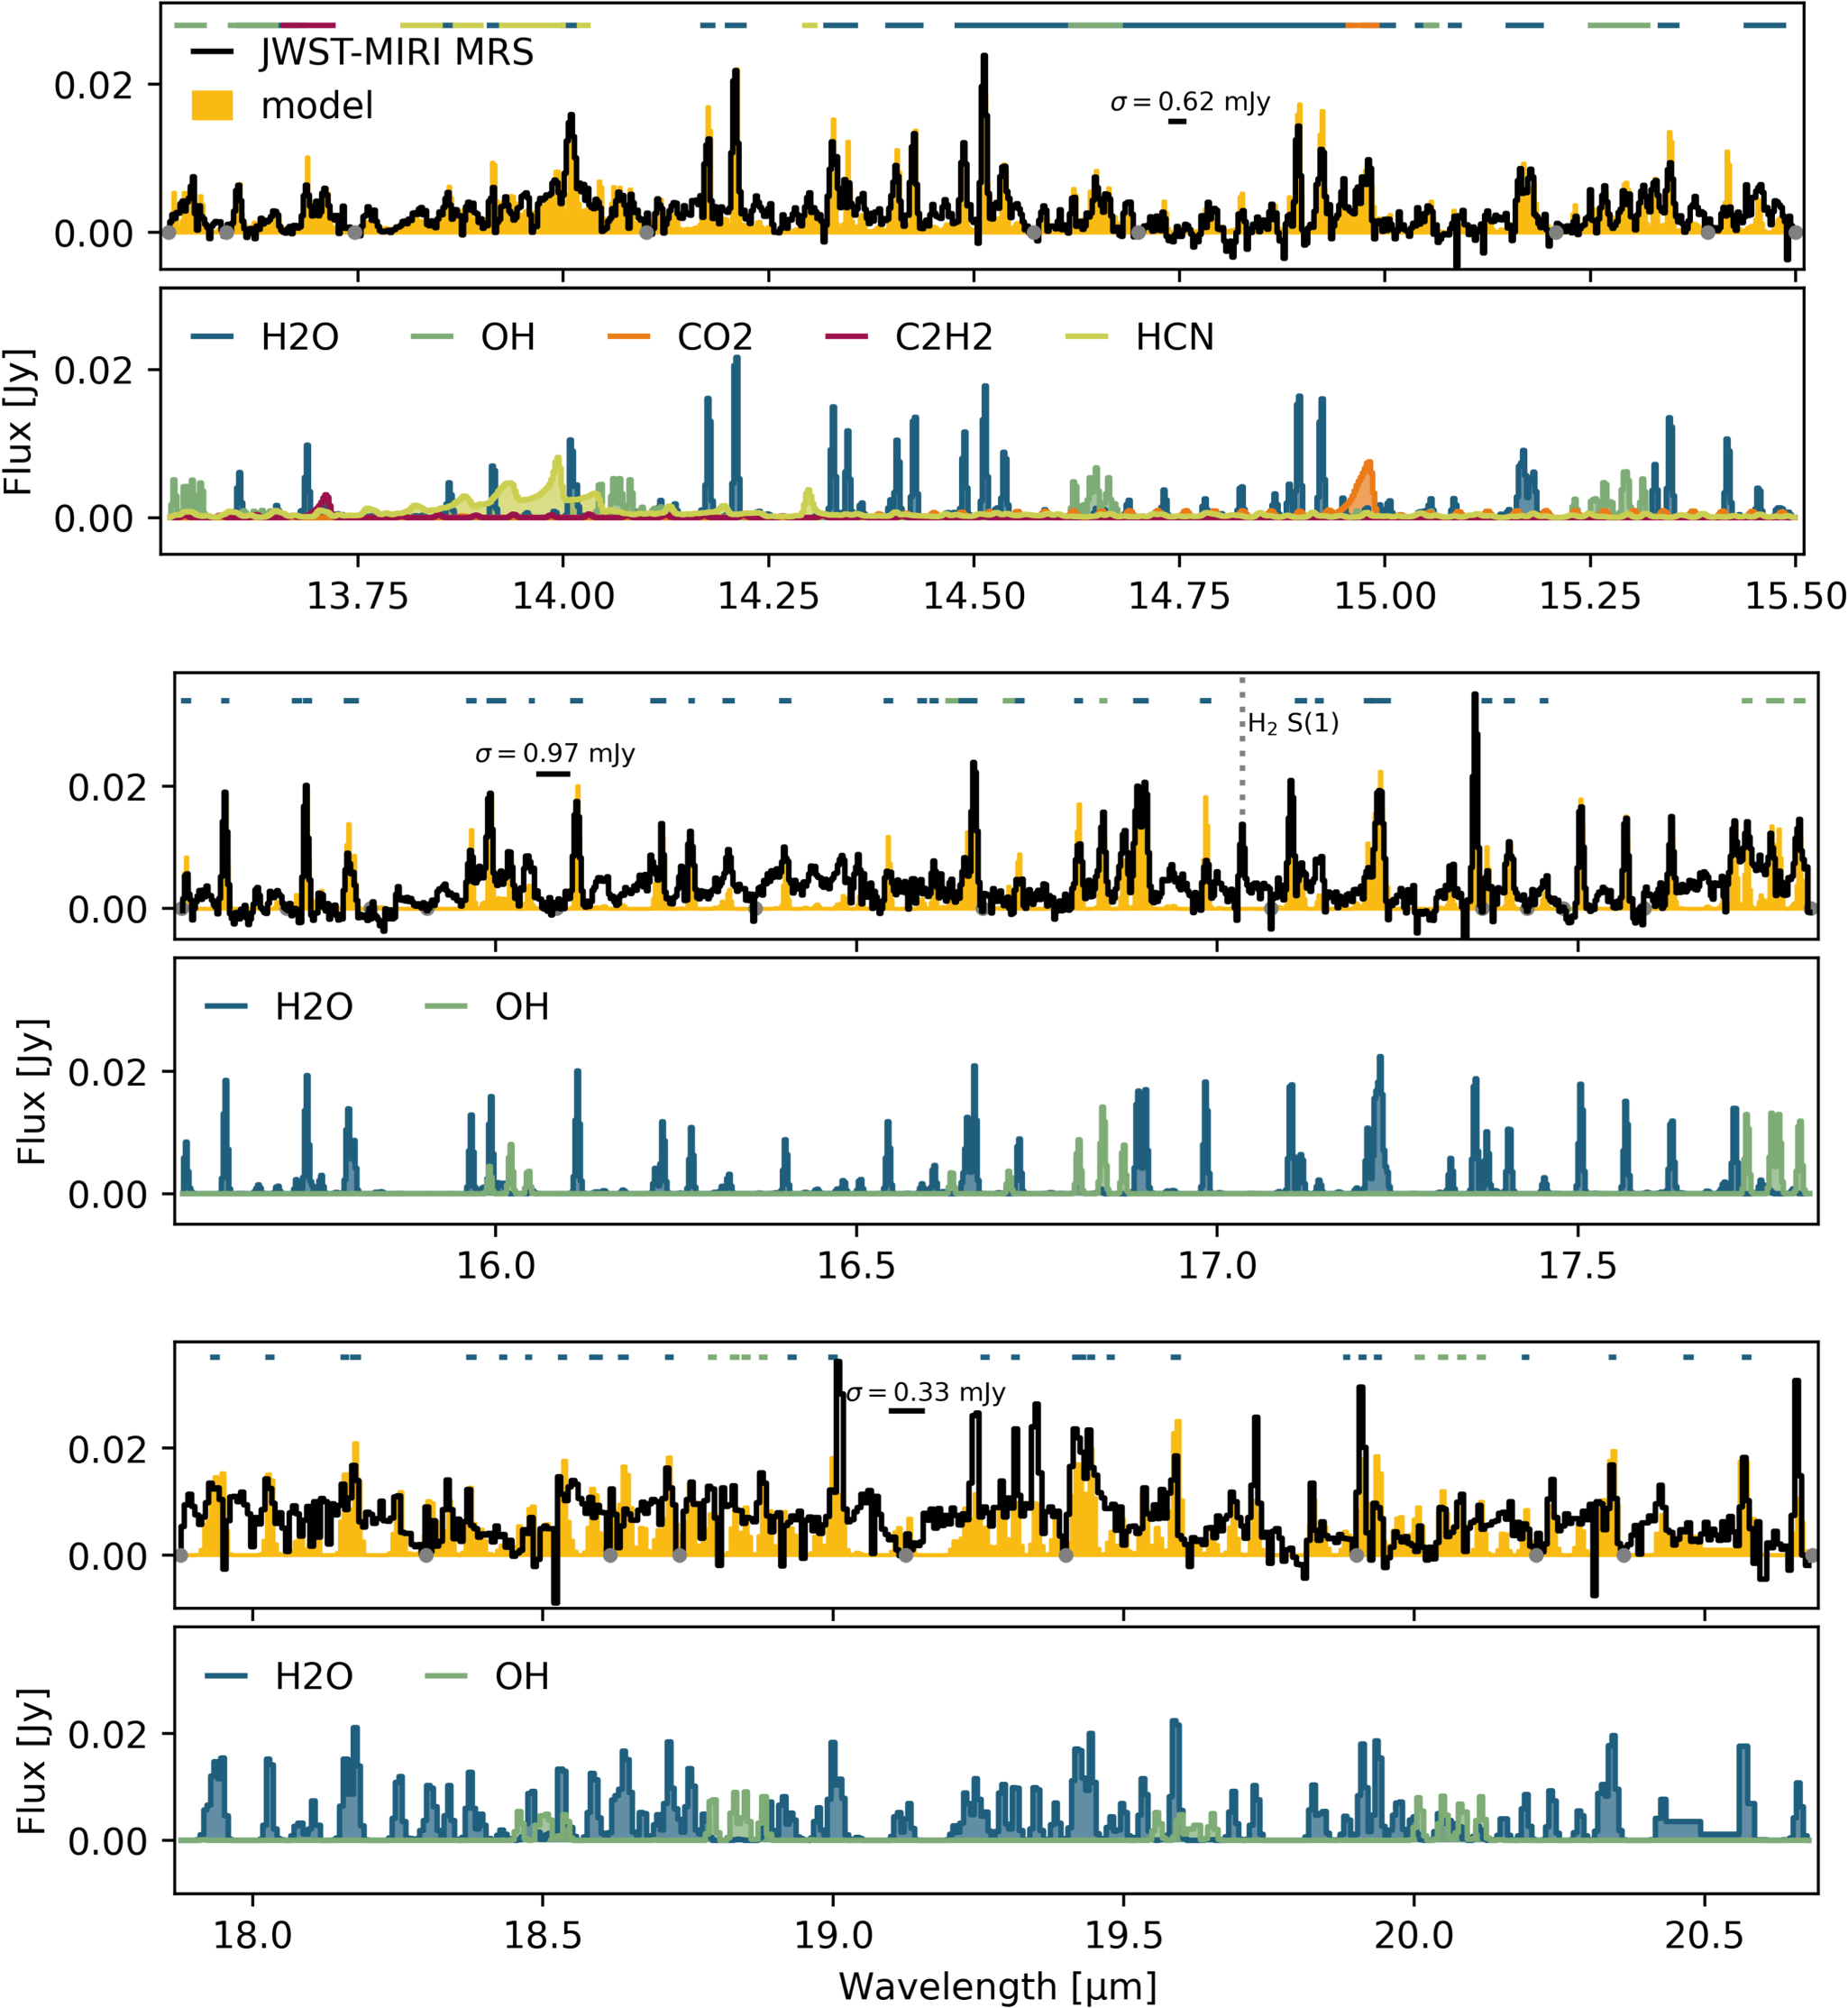
Figure 4. Top: continuum-subtracted observations (black) and cumulative model adding the contributions from each molecule (yellow) from 13.5 to 20.7 μm. Gray dots denote the wavelengths used for the continuum subtraction. Black horizontal lines indicate the line-free region used to calculate the rms noise. Other horizontal lines indicate the wavelength range considered when fitting each molecule. Bottom: individual LTE slab models for each molecule.
Download figure:
Standard image High-resolution imageWhen generating the slab models, the intrinsic line profile is assumed to be a Gaussian. We include mutual shielding from closely spaced transitions of the same molecule following the method described by Tabone et al. (2023):

where λ0,i is the rest wavelength of given line i, σλ is the intrinsic broadening of the line in microns, assumed to be equivalent to σλ = 2 km s−1 (Salyk et al. 2011a) and ΔV = 4.7 km s−1, and τ0,i is the optical depth at the line center:

Here, xu and xl are the level population of the upper and lower states, respectively, gu and gl are their respective statistical weights, Aul is the Einstein A coefficient, giving the rate of spontaneous emission, and N is the total column density of the molecule.
To find the best fit for each molecule a grid of models is generated with three free parameters: column density N (grid spacing  dex), excitation temperature T (ΔT = 50 K), and emitting area π
R2 (
dex), excitation temperature T (ΔT = 50 K), and emitting area π
R2 ( dex):
dex):

where d is the assumed distance to SY Cha of 180.7 pc. Note that R does not correspond to a physical radius in the disk, but rather is the radius of a circle with the same area as the derived emitting area. As such, it R can be considered a lower limit on the physical radius of the emission, though one that is not motivated by any physical model. The resulting model spectra are convolved to the resolution of the corresponding MRS band, using the average values reported by Jones et al. (2023) for each band, then resampled to the same wavelength grid as the observations using the SpectRes package (Carnall 2017).
For a given subband, the spectral lines are fit for one molecule at a time, following the method of Grant et al. (2023). The goodness of fit for a given model is determined by comparing to the observations at each wavelength using a χ2 routine. The χ2 fitting is restricted to regions where emission from the given molecule is expected and there is no expected strong emission from other species based on initial slab models using typical emitting temperatures for each species. Additionally, pixels where the continuum-subtracted flux is less than –5 mJy are excluded. This excludes both potential absorption features and single pixels with anomalously low values.
After a best-fit model for a given molecule has been identified, this model is subtracted from the spectrum before fitting the next species. Molecules are fit in the following order: H2O, OH, CO, CO2, HCN, then C2H2. After obtaining an initial fit for all species, we rerun the fit for H2O with the best-fit models from all other species subtracted in order to account for any small contributions from other species overlapping with the water emission. This second round of fitting results in only small variations, within the reported uncertainties, compared to the first round, demonstrating that the emission from other species has only a minor impact on our fitting routine, at least for species with strong lines. For weaker lines, it is possible that this method leads to an underestimation of the line flux. Molecular fits are only run when the molecule is expected to emit within the subband. The continuum-subtracted spectra and best-fit models for the fitted regions are shown in Figures 3 and 4 and the χ2 maps for the model grid are shown in Figures 8–10.
3. Results
The overall MIRI-MRS spectrum of SY Cha is characterized by a strong 10 μm amorphous silicate feature in emission as well as evidence of forsterite. Following the method of van Boekel et al. (2005) we measure the ratio of the flux at 11.3 and 9.8 μm, which is correlated with the strength of the silicate feature. We find a low 11.3/9.8 μm ratio of ∼0.7. This is indicative of the presence of warm silicate grains which have not undergone a large amount of processing. This emission originates in the inner disk and demonstrates the presence of a dusty disk at small radii.
3.1. Atomic Hydrogen Emission
Atomic hydrogen emission at mid-infrared wavelengths arises primarily from the hot disk atmosphere, though jets and outflows can also contribute. We detect four hydrogen recombination lines shortward of 10 μm, with the strongest being the H i (6–5) line at ∼7.5 μm. We do not detect the H i (7–6) line, which is often used as an accretion tracer, (e.g., Rigliaco et al. 2015; Beuther et al. 2023), though it may be masked by the presence of multiple strong H2O lines in the vicinity.
3.2. Molecular Emission
Figures 3 and 4 show the continuum-subtracted spectra as well as the best-fit slab models. The best-fit model parameters are given in Table 3. After continuum subtraction, the MIRI-MRS spectrum of SY Cha is dominated by rovibrational and pure rotational H2O vapor emission, which is seen in all subbands (Figures 3 and 4). As with observations of other disks observed with MIRI-MRS, e.g., Kóspál et al. (2023), Banzatti et al. (2023a), Gasman et al. (2023), the lines at longer wavelengths preferentially trace cooler gas (Table 3). In addition to H2O, we detect CO, C2H2, HCN, CO2, and OH. The best-fit column densities for H2O are high compared to most other disks observed with MIRI, where typical column densities are of order 1018 cm−2, while the column densities for the carbon-bearing species are on the low end (Banzatti et al. 2023a; Gasman et al. 2023; Grant et al. 2023; Perotti et al. 2023; Tabone et al. 2023). Our slab model fits do not provide tight constraints on the temperature of the emitting gas. This is likely due to the limits of fitting multiple transitions with a single slab model. As demonstrated by Banzatti et al. (2023a, 2023b), H2O lines close together in frequency space can originate from physically distinct locations, with distinct densities and temperatures. In the future more sophisticated modeling, e.g., using nested slab models or full radiative transfer of a model disks, will be needed to provide tighter constraints.
Table 3. Best-fit Model Parameters per Spectral Channel
| Molecule | N | T | R |
|---|---|---|---|
| (cm−2) | (K) | (au) | |
| 4.9–5.7 μm | σ5.44−5.452 = 0.59 mJy | ||
| H2O | 2.0 × 10¹⁹ | 1020 | 0.026 |
| CO | 3.0 × 10¹⁶ | 1570 | 0.13 |
| 5.7–6.6 μm | σ5.998−6.004 = 0.22 mJy | ||
| H2O | 1.2 × 10²⁰

|

|

|
| 6.6–7.6 μm | σ6.89−6.90 = 0.40 mJy | ||
| H2O | 2.0 × 10¹⁹

|

|

|
| 13.5–15.5 μm | σ14.74−14.755 = 0.62 mJy | ||
| H2O | 8.4 × 10¹⁸

|

|

|
| OH | 3.3 × 10¹⁸ | 1750 b | 0.038 |
| CO2 | 4.9 × 10¹⁷ | 210 | 0.27 |
| HCN | 2.7 × 10¹³

|

|

|
| C2H2 a | 2.3 × 10¹⁷ | 100 | 2.7 |
| 15.5–17.5 μm | σ16.06−16.1 = 0.97 mJy | ||
| H2O | 7.0 × 10¹⁸

|

|

|
| OH | 1.2 × 10¹⁸ | 810 b | 0.15 |
| 17.9–20.7 μm | σ19.1−19.153 = 0.33 mJy | ||
| H2O | 3.1 × 10²¹ | 360 | 0.27 |
| OH | 1.1 × 10¹⁷ | 3500 b | 0.060 |
Notes. The quoted uncertainties are the confidence intervals per fit parameter, given based on the χ2 maps, and are included only for maps with a closed 1σ contour (see Figures 8–10). For N the confidence intervals are given in log-space.
a Tentative detection. b Temperatures for OH reflect collisional or chemical pumping, not a physical gas temperature.Download table as: ASCIITypeset image
As previously mentioned, CO rovibrational emission at 4.7 μm was not detected in ground-based observations of SY Cha (Brown et al. 2013). However, rovibrational CO emission is clearly seen in our MIRI-MRS Band 1 data, which begin at 4.9 μm. Given the presence of extended emission seen in H2, it is possible that the lower-J CO lines are obscured by an absorbing disk wind between the disk and the viewer. Previous high-spectral-resolution ground-based studies have shown that lower-J CO lines are more likely to be seen in absorption than higher-J lines, particularly for disks such as SY Cha's with inclinations greater than 40° (Banzatti et al. 2022). This is interpreted as due to a disk wind component. Alternatively the 4.7 μm emission could be hidden by telluric features in the ground-based observations, as suggested by Brown et al. (2013). Our best-fit slab model for CO gives an excitation temperature of 1570 K and an equivalent emission radius (emitting area) of 0.13 au (0.053 au2). This is consistent with the temperatures and emitting area derived from LTE slab model fits to Keck/NIRSPEC data for full T Tauri disks by Salyk et al. (2011a). However, they found transition disks tended to be best fit by a lower temperature model and smaller emitting area. That the CO emission in SY Cha is consistent with emission from full protoplanetary disks suggests that the inner disk in SY Cha remains gas rich.
13CO2 is not detected. Based on the best-fit temperature and column density for CO2, the 13CO2 feature at 15.42 μm is expected to be extremely weak, peaking at less than 1 mJy. This feature also overlaps with a bright H2O line, preventing constraints on the 13CO2/CO2 ratio.
Most mid-infrared disk spectra show either strong H2O emission, with H2O emission stronger than emission from other molecular species, or hydrocarbon emission (Pascucci et al. 2013; Banzatti et al. 2020, 2023a; Gasman et al. 2023; Grant et al. 2023; Tabone et al. 2023). The SY Cha spectrum contains both strong H2O lines as well as, potentially, a weak C2H2 line. Figure 5 shows the best-fit C2H2 slab model as well as the residual observed spectrum after subtracting the best-fit H2O, OH, CO2, and HCN models. Emission from C2H2 explains residual emission that is not well fit by the fundamental bending mode of HCN. This potential C2H2 emission feature at 13.69 μm peaks 5σ above the rms noise of 0.6 mJy. However, this is of the same order as the residuals in other regions of the spectrum where we do not expect molecular emission. The column density and temperature of C2H2 are also not well constrained by the slab model fits (Figure 10). We therefore classify the C2H2 detection as tentative. Previously reported values for C2H2 in SY Cha could have been contaminated by emission from other species due to the lower spectral resolution of Spitzer (Salyk et al. 2011b; Banzatti et al. 2020). Alternatively, the C2H2 column density in the inner disk has changed in the 12 yr between observations.

Figure 5. Residual observed emission after subtracting the continuum, H2O, OH, CO2, and HCN best-fit models (black). The best-fit model for C2H2 is overplotted in magenta. Gray shading indicates the 1σ rms noise level calculated for the continuum-subtracted spectrum for 14.74–14.755 μm. The emission attributed to C2H2 is of the same order as nearby residual emission.
Download figure:
Standard image High-resolution image4. Discussion
The strong H2O flux relative to carbon-bearing species suggests the inner disk of SY Cha is H2O rich, with a subsolar carbon to oxygen ratio (C/O < 0.5). The H2O column density from our slab models ranges from 7 × 10¹⁸ to 3.1 × 1021 cm−2 for the different wavelength ranges fitted. This is sufficient for H2O to be self-shielded from dissociating UV emission (Bethell & Bergin 2009). It is possible that the high H2O column also shields other species from UV photons (e.g., Bosman et al. 2022), resulting in emission from both H2O and carbon-bearing species. The best-fit temperatures for H2O emission in our models also vary from several hundred kelvin to over a thousand kelvin, with the best-fit temperature generally decreasing with increasing wavelength. This can be explained by the H2O transitions at shorter wavelengths having preferentially higher excitation temperatures (Banzatti et al. 2023b), and has been observed in several other protoplanetary disks (Banzatti et al. 2023a; Gasman et al. 2023). The emission at different excitation temperatures likely also probes different radial regions in the disk: a much smaller area of the disk is able to reach temperatures warmer than 1000 K compared to a few hundred kelvin. Thus, the best-fit emitting area decreases as the best-fit temperature increases.
Prompt emission from OH is the result of H2O photodissociation by UV photons forming OH in a rotationally excited state (Harich et al. 2000; van Harrevelt & van Hemert 2000). In this circumstance, OH emission should be seen throughout the wavelength range covered by MIRI-MRS, with OH lines shortward of 10 μm brighter than those at longer wavelengths (Tabone et al. 2021). We do not detect OH emission at wavelengths shorter than 13 μm, nor do the detected OH quadruplets display the asymmetry expected from prompt emission. While weak OH emission at short wavelengths could be hidden in the forest of water lines, the lack of asymmetry in the observed quadruplets leads us to conclude that the observed OH emission is not primarily the result of UV dissociation of H2O. Instead, OH is likely excited via collisions or chemical pumping. Similar results were found for the disk around Sz 98 by Gasman et al. (2023).
The large cavity observed in the millimeter continuum has not resulted in an H2O-poor inner disk. This is not surprising given that the spatially resolved millimeter 12CO emission observed with ALMA does not show an inner cavity, suggesting that there are no large gaps in the radial gas distribution. SY Cha's IR spectral index, as well as the presence of silicate emission, is also indicative of disk material at small radii (e.g., Banzatti et al. 2020).
Most mechanisms proposed to form substructures such as dust rings in protoplanetary disks do so by creating a pressure trap (Bae et al. 2023). Pressure traps are able to stop the inward drift of large, millimeter-sized, dust particles, which can lead to gaps seen in millimeter continuum emission. Pressure traps do not inhibit the movement of gas or the small, micron-sized, particles which are more coupled to the gas. Gas and small grains can instead be cleared by photoevaporation or interaction with a perturber, such as a planet or an infall stream (Lin & Papaloizou 1979; Lubow et al. 1994; Suriano et al. 2019; Kuznetsova et al. 2022). Based on the high column density of molecules in the inner disk, particularly H2O as well as the high IR spectral index and resolved CO emission, we conclude that the mechanism which created the millimeter dust ring at 100 au has not prevented the inward motion of gas and submicron dust in SY Cha. If the millimeter cavity in SY Cha has been created by a planet, such a planet would need to be massive enough to create a pressure trap but below the mass needed to clear a gap in the gas (Kley & Nelson 2012; Zhu et al. 2012).
4.1. Comparison to PDS 70
MIRI-MRS spectra of another transition disk, PDS 70, were recently studied by Perotti et al. (2023). The SY Cha and PDS 70 disks are superficially similar in the millimeter continuum, with a small inner disk, a wide (>40 au) dust cavity, an outer ring of millimeter grains, at roughly 70 au and 45 au, respectively, and moderate inclinations of 511 and 517, respectively (Benisty et al. 2021; Orihara et al. 2023). Both disks have been observed with ALMA at ∼20 mas resolution, though the rms noise in the PDS 70 observations is significantly lower. The inner disk of PDS 70 is marginally resolved by ALMA, extending out to 18 au, while the inner disk in SY Cha is unresolved but constrained to be smaller than 3.5 au. As previously mentioned, PDS 70 is one of the only transition disks known to host young massive planets within its dust cavity. However, the MIRI-MRS spectra of these two systems are vastly different, with the SY Cha continuum a factor of 3–6 stronger and much stronger molecular and atomic emission when PDS 70 is scaled to the distance of SY Cha (Figure 6). The shapes of the continua are also different. The slope of the continuum at short wavelengths is extremely steep in PDS 70 when compared to most T Tauri disks. The crystalline forsterite feature at 11 μm, indicative of a past heating event, is more pronounced in PDS 70, while the slope of the continuum beyond 15 μm is steeper for SY Cha.

Figure 6. Comparison between the JWST/MIRI-MRS spectrum of SY Cha (black) and that of PDS 70 scaled to the distance of SY Cha (gray). SY Cha exhibits stronger flux in both line and continuum emission.
Download figure:
Standard image High-resolution imageThe best-fit slab models for H2O from 6.7 to 7.3 μm give similar temperatures and emitting areas for both sources, roughly 600 K and 0.04 au. However, the column density for SY Cha is several orders of magnitude greater, at 5.2 × 1021 cm−2 compared to 1.4 × 1018 cm−2 in PDS 70. Emission lines from other atomic and molecular species are likewise much stronger for SY Cha.
There are several potential explanations for the different chemical compositions in the inner disks of these two systems. With a bolometric luminosity of 0.35 L⊙, PDS 70 is less luminous than SY Cha (Pecaut & Mamajek 2016). Thus, the incident ionizing flux from the central star, a driver of disk evolution, is different. The inner disk in SY Cha could be less evolved, with less gas depletion, than the PDS 70 disk. Although the ages of these systems are highly uncertain, the best estimates suggest SY Cha is roughly 2 Myr younger than PDS 70 (Müller et al. 2018; Galli et al. 2021).
Alternatively, it is possible that the dust cavity in SY Cha was not carved by massive planets, instead being formed by other methods (e.g., Flock et al. 2015) or smaller planets, which are less efficient at preventing the inward motion of gas and small dust grains. In the case of planets, the strength of the pressure trap increases with increasing planet mass, as well as depending on disk temperature and viscosity (e.g., Fung et al. 2014; Kanagawa et al. 2015; Asensio-Torres et al. 2021). There are no published data on SY Cha from optical/near-infrared surveys searching for planets in transition disks. Likewise, the published observations of SY Cha with ALMA are not sensitive enough to detect emission from protoplanets of similar brightness to the ones detected in PDS 70. The 12CO gas observed by ALMA does not display a central cavity, while the less abundant 13CO and C18O isotopologues exhibit a ring-like morphology. In PDS 70 all molecular species, apart from the optically thick 12CO, observed with ALMA appear depleted inside of 02 and modeling of the disk finds a gas surface density minimum at 20 au (Keppler et al. 2019; Facchini et al. 2021; Portilla-Revelo et al. 2023). The cavity in PDS 70 is clearly far more depleted than that in SY Cha. This is likely the cause of the different chemical compositions in the inner disk.
If the cavity in SY Cha is carved by less massive planets this would point to the composition of the inner disk being strongly linked to the mass of, not just the presence of, planets at larger radii. Confirmation of this idea will require additional JWST observations of transition disks to constrain the inner disk composition as well as deep searches for substellar companions. Overall, the molecular column densities in the inner disk of SY Cha are more similar to those derived for the full protoplanetary disk of Sz 98 despite its different millimeter dust morphology (Gasman et al. 2023). The Sz 98 disk is a full protoplanetary disk with several narrow gaps observed in the submillimeter continuum. Its dust disk extends to R = 278 au, compared to ∼140 au for the SY Cha disk (Tazzari et al. 2017; Orihara et al. 2023).
It is also possible that the strong molecular emission lines in SY Cha are indicative of some level of dust grain growth in the inner disk. As dust grains grow, the dust opacity is reduced, exposing a larger gas column and resulting in stronger molecular line emission without a large change in the SED at IR wavelengths (Antonellini et al. 2023). In this case the unresolved inner disk emission seen with ALMA should be from dust emission, rather than free–free emission or an ionized wind. Additional observations at longer wavelengths would help clarify the origin of the submillimeter emission. It should be noted that the JWST data presented in the current work demonstrate the presence of small dust grains in the inner disk but do not rule out the presence of larger grains.
4.2. Temporal Variability
As discussed in Section 2.2, there is substantial variability observed in the continuum flux between the JWST observations and the three Spitzer epochs. To determine whether the molecular line flux is likewise variable we degrade the MIRI-MRS spectrum to the resolution of the Spitzer high-resolution observations from 2004 and 2008. Continuum subtraction is then carried out as described in Section 2, with the same points used for all epochs. We then integrate over the same wavelength range to get the total line flux. The wavelength ranges used for C2H2, HCN, and CO2 are the same as those used by Banzatti et al. (2020) while the wavelength range for H2O is taken from Najita et al. (2013). The results are given in Figure 7 and Table 4.

Figure 7. Continuum-subtracted spectra from Spitzer high-resolution and MIRI-MRS observations, with the MIRI spectra degraded to the same resolution as Spitzer before continuum subtraction. Epochs are offset by 0.02 Jy for readability. The gray shaded regions indicate the wavelength range used when integrating the line fluxes. The line flux shows noticeable variation between epochs, though the changes are within the flux calibration uncertainty.
Download figure:
Standard image High-resolution imageTable 4. Comparison of the Integrated Line Fluxes in the Spitzer and JWST Observations
| Molecule | Wavelength | Spitzer 2004 | Err | Spitzer 2008 | Err | JWST 2022 | Err |
|---|---|---|---|---|---|---|---|
| (μm) | (10−14 erg s−1 cm−2) | (10−14 erg s−1 cm−2) | (10−14 erg s−1 cm−2) | ||||
| C2H2 | 13.648–13.729 | 0.28 | 0.18 | 0.66 | 0.25 | 0.22 | 0.14 |
| HCN | 13.914–14.055 | 0.29 | 0.34 | 1.12 | 0.47 | 0.96 | 0.27 |
| CO2 | 14.93–15.04 | 0.51 | 0.21 | 0.51 | 0.29 | 0.28 | 0.17 |
| H2O | 17.077–17.1555 | 0.45 | 0.15 | 0.18 | 0.25 | 0.156 | 0.094 |
| H2O | 17.183–17.261 | 0.32 | 0.11 | 0.22 | 0.19 | 0.258 | 0.073 |
| H2O | 17.2998–17.4200 | 0.59 | 0.23 | 0.37 | 0.38 | 0.13 | 0.15 |
Note. Err is the rms noise error.
Download table as: ASCIITypeset image
The total line flux appears to vary not just between the JWST and Spitzer observations, but also between the two Spitzer epochs. This apparent change in brightness is of the same order as that reported by Banzatti et al. (2012) for EX Lupi for similar wavelength ranges. EX Lupi is a prototype of the highly variable T Tauri sources know as EXors, where changes are seen when comparing observations during quiescent and outbursting epochs. However, the luminosity of the line emission in SY Cha is weaker than that in EX Lupi.
To determine if the variability seen in the molecular line emission for SY Cha is significant, we calculate the uncertainty in the flux ratio between two epochs, where the uncertainty for a single observation is the calculated rms noise added in quadrature to the spectrophotometric accuracy of the instrument. Given the spectrophotometric accuracy of both Spitzer/IRS and JWST/MIRI, the variability in line flux in SY Cha is not statistically significant. The potential variability in line emission seen in SY Cha, which has not undergone any known recent outbursts, suggests that the physical conditions in the inner regions of even quiescent protoplanetary disks could change on observable timescales. Careful study of line emission in a single source at high signal-to-noise ratios over multiple epochs is needed to confirm this idea.
5. Conclusions
We report the first results from JWST/MIRI-MRS observations of the SY Cha protoplanetary disk, observed as part of the MINDS GTO program. We detect emission from H i, [Ne ii], H2, H2O, OH, CO, CO2, and HCN as well as a marginal detection of C2H2. The line fluxes for all species are relatively high compared to the other T Tauri disks observed thus far with MIRI-MRS, with the emission from H2O particularly strong (Banzatti et al. 2023a; Gasman et al. 2023; Grant et al. 2023; Perotti et al. 2023). Based on these results we conclude that the high molecular column densities in the inner disk are likely due to the inward drift of gas and small grains while large grains are caught by a weak pressure trap. The superior spectral resolution of MIRI-MRS allows us to isolate the mid-infrared OH lines in the source for the first time. Based on the lack of OH emission observed shortward of 13 μm and the lack of asymmetry in the observed quadruplets, we conclude OH is not excited when H2O is dissociated by UV photons. We also find that SY Cha is highly variable in the mid-infrared continuum. This is consistent with previous studies of protoplanetary disks, particularly those with large millimeter dust cavities. We further find hints of molecular line variability. Higher signal-to-noise ratio observations will be needed to confirm this.
Determining how common gas-rich inner disks coexisting with large millimeter cavities are will require a large JWST survey of protoplanetary disks with a range of dust morphologies. Further, multiple epochs of high-spectral-resolution observations with MIRI-MRS will be required to determine if variability of both line and continuum flux is common, while modeling will be needed to determine if this is due to changes in chemical abundance, temperature, or disk morphology.
Acknowledgments
This work is based on observations made with the NASA/ESA/CSA James Webb Space Telescope. The data were obtained from the Mikulski Archive for Space Telescopes at the Space Telescope Science Institute, which is operated by the Association of Universities for Research in Astronomy, Inc., under NASA contract NAS 5-03127 for JWST. These observations are associated with program 1282. The following National and International Funding Agencies funded and supported the MIRI development: NASA; ESA; Belgian Science Policy Office (BELSPO); Centre Nationale d'Etudes Spatiales (CNES); Danish National Space Centre; Deutsches Zentrum fur Luft und Raumfahrt (DLR); Enterprise Ireland; Ministerio De Economía y Competividad; Netherlands Research School for Astronomy (NOVA); Netherlands Organisation for Scientific Research (NWO); Science and Technology Facilities Council; Swiss Space Office; Swedish National Space Agency; and the UK Space Agency.
The data presented in this article were obtained from the Mikulski Archive for Space Telescopes (MAST) at the Space Telescope Science Institute. The specific observations analyzed can be accessed via DOI:10.17909/8ref-ye65.
K.S. and T.H. acknowledge support from the European Research Council under the Horizon 2020 Framework Program via the ERC Advanced Grant Origins 83 24 28. G.P. gratefully acknowledges support from the Max Planck Society. D.B. and M.M.C. have been funded by Spanish MCIN/AEI/10.13039/501100011033 grants PID2019-107061GB-C61 and No. MDM-2017-0737. I.K., A.M.A., and E.v.D. acknowledge support from grant TOP-1 614.001.751 from the Dutch Research Council (NWO). I.K. and J.K. acknowledge funding from H2020-MSCA-ITN-2019, grant No. 860470 (CHAMELEON). E.v.D. acknowledges support from the ERC grant 101019751 MOLDISK and the Danish National Research Foundation through the Center of Excellence "InterCat" (DNRF150). A.C.G. acknowledges from PRIN-MUR 2022 20228JPA3A "The path to star and planet formation in the JWST era (PATH)," by INAF-GoG 2022 "NIR-dark Accretion Outbursts in Massive Young stellar objects (NAOMY)," and by Large Grant INAF 2022 "YSOs Outflows, Disks and Accretion: toward a global framework for the evolution of planet forming systems (YODA)." V.C. acknowledges funding from the Belgian F.R.S.-FNRS. D.G. thanks the Belgian Federal Science Policy Office (BELSPO) for the provision of financial support in the framework of the PRODEX Programme of the European Space Agency (ESA). T.P.R. acknowledges support from ERC grant 743029 EASY. D.R.L. acknowledges support from Science Foundation Ireland (grant No. 21/PATH-S/9339). M.T. acknowledges support from the ERC grant 101019751 MOLDISK.
Facilities: JWST - James Webb Space Telescope and Spitzer - Spitzer Space Telescope satellite.
Software: emcee (Foreman-Mackey et al. 2013), matplotlib (Hunter 2007), numpy (van der Walt et al. 2011), spectres (Carnall 2017), and VIP (Gomez Gonzalez et al. 2017; Christiaens et al. 2023).
Appendix A: Continuum Subtraction
In Table 5 we list the points used to define the spline fit used to subtract continuum.
Table 5. Points Used in the Continuum Subtraction
| Covered Transitions | Value |
|---|---|
| CO, H2O | 4.926, 4.947, 4.987, 5.1, 5.168, 5.338, 5.439, 5.575, 5.702, 5.73 |
| H i 10–6 | 5.073, 5.1, 5.168, 5.1925, 5.225 |
| H2O | 5.728,5.893,6.0,6.084,6.164,6.18,6.192,6.21,6.429,6.463,6.607 |
| H2O | 6.608,6.761,6.895,7.159,7.267,7.444,7.56,7.626 |
| H i 12–7 | 6.749, 6.782, 6.7896, 6.801 |
| H i 6–5 | 7.4, 7.4250, 7.4950, 7.528 |
| H i 8–6, H i 11–7 | 7.425, 7.4775, 7.492, 7.528 |
[Ne ii] 2P1/2–2
| 12.77,12.802,12.860,12.88 |
| H2O, OH, CO2 C2H2, HCN | 13.52,13.59,13.746,14.101,14.573,14.7,15.208,15.393,15.5 |
| H2O, OH | 15.565,15.71,15.826,15.905,16.084,16.36,16.675,17.075,17.367,17.43,17.48,17.592,17.823 |
| H2O, OH | 17.876,18.299,18.615,18.735,19.125,19.40,19.9,20.21,20.36,20.685 |
Download table as: ASCIITypeset image
Appendix B: χ2 Maps of Fits
The χ2 per molecule and per fitted region are presented here (Figures 8–10).

Figure 8.
χ2 maps for the slab model fits to H2O. The color map shows  such that the best fit is given a value of one. The red, orange, and yellow contours give the 1σ, 2σ, and 3σ uncertainty levels, respectively, for two degrees of freedom. The white contours show the best-fit emitting radius, with labels in units of au.
Download figure:
Standard image High-resolution image
Figure 9.
χ2 maps for the slab model fits to OH. The color map shows  such that the best fit is given a value of one. The red, orange, and yellow contours give the 1σ, 2σ, and 3σ uncertainty levels, respectively, for two degrees of freedom. The white contours show the best-fit emitting radius, with labels in units of au. The OH lines are poorly constrained by the slab models.
Download figure:
Standard image High-resolution image
Figure 10.
χ2 maps for the slab model fits to CO, C2H2, HCN, and CO2. The color map shows  such that the best fit is given a value of one. The red, orange, and yellow contours give the 1σ, 2σ, and 3σ uncertainty levels, respectively, for two degrees of freedom. The white contours show the best-fit emitting radius, with labels in units of au.
Download figure:
Standard image High-resolution image