


Abstract
Compact symmetric objects (CSOs) are jetted active galactic nuclei (AGN) with overall projected size <1 kpc. The classification was introduced to distinguish these objects from the majority of compact jetted AGN in centimeter-wavelength very long baseline interferometry observations, where the observed emission is relativistically boosted toward the observer. The original classification criteria for CSOs were (i) evidence of emission on both sides of the center of activity and (ii) overall size <1 kpc. However, some relativistically boosted objects with jet axes close to the line of sight appear symmetric and have been misclassified as CSOs, thereby undermining the CSO classification. This is because two essential CSO properties, pointed out in the original papers, have been neglected: (iii) low variability and (iv) low apparent speeds along the jets. As a first step toward creating a comprehensive catalog of "bona fide" CSOs, we identify 79 bona fide CSOs, including 15 objects claimed as confirmed CSOs here for the first time, that match the CSO selection criteria. This sample of bona fide CSOs can be used for astrophysical studies of CSOs without contamination by misclassified CSOs. We show that the fraction of CSOs in complete flux density limited AGN samples with S5GHz > 700 mJy is between (6.8 ± 1.6)% and (8.5 ± 1.8)%.
Export citation and abstract BibTeX RIS

Original content from this work may be used under the terms of the Creative Commons Attribution 4.0 licence. Any further distribution of this work must maintain attribution to the author(s) and the title of the work, journal citation and DOI.
1. Introduction
The discovery that most compact (<1 kpc) radio sources in centimeter-wavelength surveys have asymmetric, one-sided jet morphology, with a bright compact core at one end of a steep-spectrum jet (Wilkinson et al. 1977; Readhead et al. 1978; Readhead 1980), provided powerful support for the hypothesis that the observed radio emission regions, especially in flat spectrum radio sources, are strongly boosted by relativistic beaming (Rees 1966, 1967). This quickly became a crucial pillar of our understanding of jetted active galactic nuclei (AGN; Begelman et al. 1984; Blandford et al. 2019; Lister et al. 2019).
Therefore, it was a surprise when, in 1980, Phillips and Mutel discovered a class of compact extragalactic radio sources that, unlike the majority of jetted AGN, do not have an apparent asymmetric, one-sided jet morphology (Mutel & Phillips 1980; Phillips & Mutel 1980), but instead are compact doubles (CDs). Phillips and Mutel suggested that CDs are young radio sources associated with AGN.
The AGN B3 0710+439 provided the first clear evidence of symmetry in these objects (Readhead et al. 1984), because there are clearly two components on opposite sides of the nucleus. The first very long baseline interferometry (VLBI) survey of a complete sample 9 of extragalactic radio sources was that of the 65 AGN studied by Pearson & Readhead (1988, hereafter PR88) who found three CDs with steep spectra and concluded that they "seem to be a completely different kind of object. The evidence suggests that the radio structures that we see are not parts of cores or jets." It was clear from early on, therefore, that there was something very different about these compact symmetric objects (CSOs). The fraction of CSOs, ∼10% in the Pearson–Readhead (PR) complete sample, and the sizes, ∼100 pc, imply that they are either very slowly expanding old objects or very short-lived objects.
The original motivation for the CSO classification is given by Wilkinson et al. (1994, hereafter W94); their properties are summarized succinctly by Readhead et al. (1993, hereafter R93); and their relationship to other larger radio sources is discussed in Readhead et al. (1994, hereafter R94), while a detailed discussion of CSOs as a class is given in Readhead et al. (1996, hereafter R96). In defining CSOs, W94 and R96 were aiming to avoid contamination by objects in which the observed emission is strongly beamed toward the observer—see the third property, after morphology and size, listed by R93—by imposing a requirement of symmetry about the center of activity. However, understandable but unfortunate misidentifications of AGN as CSOs have eroded the CSO class to the point where the phenomenology of the CSO class has been obscured. Before undertaking this review, we considered carefully whether it is worth resurrecting the CSO class, or whether its value has diminished with time since it was first proposed, and we concluded that if the original intent of the CSO classification could be recaptured, then it would be well worth doing. As pointed out by Tremblay et al. (2016), the CSO category is a much more physically motivated classification than the peaked spectrum (PS) 10 and compact steep spectrum (CSS) classifications, the former of which are highly contaminated with objects in which the observed radiation is strongly affected by relativistic beaming (Tornikoski et al. 2009), and the latter of which include a diverse variety of AGN morphological types.
We began this program with the sole intention of redefining the CSO classification criteria and beginning the task of identifying the "bona fide" CSOs in the literature. However, as we progressed, we found compelling evidence that most CSOs form a distinct class of jetted AGN that are different in their nature and origin from all other classes of jetted AGN. This fact had already been pointed out by PR88, R94, and R96, but it has never taken root. We trust that the new evidence we present in this study will remedy that situation. We also found that, while most of the CSOs observed thus far are short-lived compared to the AGN of larger radio sources, they are certainly not all young, and that CSOs can reliably be classified into four distinct morphological classes, of which three most likely represent the "early life," "midlife" and "late life" phases of an evolutionary trajectory. The evidence suggests that most high-luminosity CSOs might originate in a single fueling event through the capture of a single star by an SMBH, as first suggested by R94 and again more recently by An & Baan (2012).
All of these findings amount to a significant change in our understanding of jetted AGN, and they provide a new avenue of attack on relativistic jets—one that has the potential to probe the physics of the generation of the jets and their relationship to the accretion disk and the surrounding medium in the centers of activity in AGN in an entirely new way.
Our findings are reported in a set of three papers. In this, the first paper, hereafter Paper I in this series, we describe a large and intensive CSO literature search that we have carried out, and the selection of 79 "bona fide" CSOs. In the second paper (Kiehlmann et al. 2024), hereafter Paper II in this series, we present what we consider to be compelling evidence that CSOs form a distinct class of jetted AGN. In the third paper (Readhead et al. 2024) hereafter Paper III in this series, we introduce a four-way subclassification of CSOs and discuss the origin and evolution of the majority of CSOs, and we show that most CSOs might well be fueled by the capture of single stars by dormant spinning supermassive black holes in the nuclei of elliptical galaxies.
Tremblay et al. (2016) carried out the most extensive survey of CSOs to date. They found two classes of CSOs that are analogous to the Fanaroff–Riley (FR) classes (Fanaroff & Riley 1974) of the large double radio sources: in one class of CSO the leading (or outermost) edges of the sources are fainter than the central parts of the source, i.e., they have "edge-dimmed" morphology, and this class also has low luminosity. We designate these as CSO 1 objects. The other class has edge-brightened morphology, and we designate these as CSO 2 objects. We find strong confirming evidence of these two distinct classes of CSOs, so we have classified our sample accordingly. In Figure 1, we show three typical examples of the morphologies of these CSO 1 and CSO 2 classes. In Paper III, we show that the vast majority of CSO 2 s can be subdivided into three subclasses that very likely follow an evolutionary path. We base our classification of CSOs into four subclasses on morphology alone.

Figure 1. Three examples of bona fide CSOs that pass our selection criteria. (a) VLBA map of J1220+2916 (NGC 4278) at 4.845 GHz (Helmboldt et al. 2007)—a CSO 1 object showing edge-dimmed morphology. The peak flux density is 0.1208 Jy beam−1. (b) VLBA map of J1159+5820 at 5 GHz (Tremblay et al. 2016)—a CSO 2 object, in which the emission is edge-brightened and dominated by the hot spots and narrow jets. The contour levels begin at 1 mJy beam−1 and increase by powers of 2. (c) VLBA map of J0119+3210 (B2 0116+31) at 5 GHz (Giroletti et al. 2003), a CSO 2 object showing highly resolved edge-brightened morphology with faint hot spots close to the extremity of the source. The contours are −0.4, 0.4, 0.57, 0.8, ..., 36.2 mJy beam−1. Negative contours are dashed. The peak flux density is 40.2 mJy beam−1.
Download figure:
Standard image High-resolution imageIt is important at the outset to mention the limitations of the present study. Clearly, the most powerful and efficient way to study CSOs is to carry out a large, unbiased VLBI survey covering many thousands of jetted AGN that will produce a complete sample of CSOs significantly larger than that available at present. We are engaged in just such a study, but it will take several years to complete.
There is, however, no need to wait for the outcome of this survey to make progress on the study of CSOs, because many thousands of hours of VLBI observing time have been devoted to the study of CSOs, and much can be gained from using the invaluable results in the existing literature. However, it should be borne in mind that a large fraction of the CSO candidates in the literature come from a wide variety of observing programs, many of which have significant selection effects. For these reasons, it is not possible to use all of the bona fide CSOs identified in this study for all of the purposes that we address in these three papers. The lack of spectroscopic redshifts for ∼30% of CSOs is one obvious example. Other obvious examples are the different observing frequencies that have been used, the different flux density limits of different studies, and the incompleteness of variability surveys.
It should be clear that it is possible to make significant progress in the study of CSOs only due to the enormous effort that has been put into the study of these objects by various groups. Because this is not a review, we do not attempt a description of this earlier work, but our extensive bibliography attests to it. Other important factors, which this work builds upon, are the existence of three complete, well-defined samples of CSOs, and the fact that in some cases it is possible to assess the possible effects of selection biases on the topics under study. This is what we have attempted in these three papers.
This paper is structured as follows: Section 2 introduces and discusses the CSO classification criteria. In Section 3, we describe our candidate selection and classification process and present the results of the classification. In Section 4, we discuss the biases in our sample selection process. Section 5 presents the fraction of CSOs in complete statistical samples. Section 6 focuses on the angular sizes and spectra of CSOs, and Section 7 on the physical sizes. Our conclusions are presented in Section 8. We discuss other important aspects of CSOs in Appendix A, and the table of 79 bona fide CSOs with references to the origins of the quoted numbers is given in Appendix B.
Throughout this paper, we adopt the convention Sν ∝ να for spectral index α, and use the cosmological parameters Ωm = 0.27, ΩΛ = 0.73, and H0 = 71 km s−1 Mpc−1 (Komatsu et al. 2009).
2. Revised CSO Classification Criteria
The CSO class was originally defined by W94 as "(1) two or more components, separated by 10–1000 pc, either straddling a central core or with other compelling morphological evidence for symmetry such as outer hot spots, and (2) no emission on scales greater than 1000 pc or only very faint emission." In addition, R93 stated as the third property of CSOs, following the morphology and size, that "the radio emission is not strongly beamed," and W94 emphasized that "relativistic beaming plays at most a minor role in CSOs," and in their summary they stated that "relativistic beaming does not play a major role in determining the properties of CSOs." It should be clear, therefore, that blazars should never be classified as CSOs, because blazars are heavily affected by relativistic beaming toward the observer.
Because their jets are closely aligned with the line of sight, BL Lac objects and flat-spectrum radio quasars (FSRQs) can contaminate the CSO class in one of two ways: (i) in some cases, a relativistically boosted nucleus and a relativistically boosted jet component present the appearance of a CD; and (ii) in the case of some slightly curved jets, different parts of the approaching jet are projected on opposite sides of the nucleus.
R96 listed a dozen properties of CSOs, based on five CSOs they had observed in the Pearson–Readhead complete sample (Pearson & Readhead 1981). Unfortunately, these properties have often been ignored in the subsequent literature, and this has contributed substantially to the misclassification of CSOs. Of particular relevance here is property #8 listed by R96: "CSOs exhibit only weak radio variability, up to about 10% of the total flux density over periods of a few years."
Thus, misclassified CSOs can frequently be identified through observations of variability, and in some cases, component speed. This demonstrates the need for long-term radio monitoring of AGN, such as the Owens Valley Radio Observatory 40 m Telescope program (Richards et al. 2011). With the addition of these requirements to those of Wilkinson et al. (1994), we define four criteria, which establish the basis for compiling a comprehensive and definitive catalog of CSOs free from sources that are significantly affected by relativistic beaming:
- 1.No projected radio structure larger than 1 kpc, with exceptions only in the case of episodic activity, as discussed below.
- 2.Evidence of emission on both sides of the center of activity. The latter may or may not be identified, but its location should be well established through clear evidence of jets, hot spots, and/or lobes.
- 3.The source should not be known to have a fractional variability of greater than 20% yr−1.
- 4.No known superluminal motion in any jet component in excess of vapp = 2.5c
Because it takes many years to characterize the variability of an AGN, and likewise to measure the speed of any moving components, not all clear-cut CSO candidates can currently be tested against all four criteria. Nevertheless, given the intense scrutiny to which candidates have been subjected (see Section 3), we assume that any of the 79 bona fide CSOs for which the evidence on variability and speed is currently lacking will be proven to satisfy criteria 3 and 4.
Since 2008, we have been monitoring the 15 GHz flux densities of ∼1800 jetted AGN ∼twice a week (Richards et al. 2011) on the 40 m Telescope of the Owens Valley Radio Observatory (OVRO). We therefore use 15 GHz as the fiducial frequency at which we estimate the variability of CSOs. We have 15 GHz light curves of 10 of the 79 bona fide CSOs in our sample, on which we have carried out a detailed study and measured the maximum fractional variability per year. We examined each light curve by eye and selected the feature with the steepest slope. We measured the time interval, Δ-t, between the time at the highest flux density, thi, and the time at the lowest flux density, tlo, and the change in flux density, ΔS = Shi − Slo, between these, where Shi and Slo are the flux densities at thi and tlo, respectively. We define the maximum fractional variability per year, allowing for cosmic time dilation, by  , where z is the redshift of the object. The duration of the fastest varying features in blazars in the 40 m monitoring sample ranges from a week, or less, up to 1.5 yr, while in the 10 CSOs for which we have light curves, the duration ranges from ∼1 yr to >15 yr.
The OVRO light curve of the CSO OQ 208 (Figure 2), which is one of the nearest and most strongly and rapidly varying CSOs, shows a steady decline in flux density, giving a maximum fractional variation rate of  yr−1. The strongest maximum fractional variation rate in the ten CSOs monitored at the OVRO is seen in J1735+5049, with
  yr−1. For our purposes, we adopt a maximum fractional variability rate of
  yr−1 as an upper limit for CSO variability. We have now undertaken a study in which we will quantify more comprehensively the variability of all of the currently known bona fide CSOs at 15 GHz over the next decade.

Figure 2. OVRO 15 GHz light curves of a typical blazar and a typical CSO. PKS 1413+135 (black points) is a prime example of a blazar that should not have been classified as a CSO but is nevertheless much discussed in the literature as a CSO. The misclassification is obvious in this comparison of the PKS 1413+135 light curve with the light curve of OQ 208 (blue points), which is one of the most rapidly varying CSOs. The maximum fractional variation in OQ 208 is  yr−1, whereas the maximum fractional variation in PKS 1413+135 is
  yr−1 (see text).
Download figure:
Standard image High-resolution imageFor comparison with the above numbers for CSOs, it is interesting to note that the maximum fractional variation rate of PKS 1413+135 (Figure 2) is 808.9% yr−1, and that the fractional variation of the least variable object that we rejected in our filtering step was 24% per year, i.e., more than a factor of 1.6 greater than the largest fractional variation rate we have seen in a CSO thus far.
We adopt an upper apparent velocity cutoff of vapp < 2.5c for bona fide CSOs. Higher apparent speeds would imply a jet viewing angle smaller than 45° and a Lorentz factor greater than 3, as well as non-negligible relativistic beaming effects of order unity or higher. For this reason, we reject any AGN as a CSO candidate if the apparent speed of any jet feature in the source exceeds the 2.5c speed limit. At this stage, these values are chosen based on experience. However, clearly what is needed here is a study of a large number of CSOs (we suggest about 50) in a complete flux density limited sample. These objects must be identified and observed at multiple wavelengths for at least a decade in order to determine the relationship between the jets, the lobes, and the envelopes. Only at that point will it become possible to be more precise about the beaming factors and the speeds that obtain in CSOs.
We discuss these criteria further in Sections 2.1–2.4. Three examples of CSOs 1 s and CSOs 2 s that pass our vetting criteria are shown in Figure 1.
2.1. The Largest Projected Linear Size of CSOs
Fanti et al. (1995) and R96 divided jetted AGN into three classes: CSOs with projected sizes less than 1 kpc, medium symmetric objects (MSOs) with sizes between 1 kpc and 20 kpc, and large symmetric objects (LSOs) with sizes greater than 20 kpc. These limits correspond roughly to the boundary between the region dominated by the supermassive black hole and that dominated by the galaxy, and the boundary between the region dominated by the galaxy and that dominated by the extragalactic environment.
Some CSOs show clear evidence of a previous epoch of activity (Baum et al. 1990), in which a new epoch of activity has begun to form a CSO while vestiges of a previous epoch of activity are still visible. In these AGN, the radio surface brightness either drops off significantly or is completely absent in the region between the (<1 kpc scale) CSO and the outer structures. In such cases, the symmetric structure on the sub-kiloparsec scale is used to define the size required for inclusion in the CSO class.
2.2. The Radio Morphology of CSOs
The symmetry CSO criterion includes objects that show any emission on both sides of the center of activity, or nucleus. The center of activity is identified either by a compact flat spectrum component or clear symmetry of the lobes. It is not necessary that flux densities of the components straddling the nucleus be comparable. For example, an AGN in which the lobes straddling the nucleus have a flux density ratio of 10:1, which passes the other CSO criteria, should be classified as a bona fide CSO according to our definition of a CSO.
Sometimes, the center of activity cannot be clearly identified, so we do not require identification of the nucleus for inclusion in the CSO class provided that other morphological evidence makes it clear that the nucleus lies between the two outer structures.
Examples of other morphological evidence might include, but are not limited to, cases where
(i) there are two clear, oppositely directed, steep spectrum jets with flat spectrum hot spots at one, or both of, the outer leading edges of the jets;
(ii) there are two clear, steep spectrum lobes, with flat spectrum hot spots at one or both of the outer edges of the lobes; and
(iii) there are two clear, steep spectrum lobes without any discernable hot spots.
2.3. Radio Variability in CSOs
Because we do not have OVRO light curves for all CSO candidates, the <20% yr−1 variability limit discussed above cannot be applied to all CSO candidates. We therefore applied different approaches based on the available data, as follows: We rejected AGN from the CSO class whose radio light curves exhibit rapid, blazar-like flares, or whose multi-epoch radio spectra indicate variability over a wide range of frequencies in less than the light travel time across the source. Additionally, we considered variability index values from the literature (e.g., Bolton et al. 2006; Orienti et al. 2010).
As should be clear from the opening paragraph of Section 2, the absence of relativistic beaming, and hence of strong variability, should always have been applied when classifying objects as CSOs. Unfortunately, this has not been the case. Two examples of AGN that have been classified as CSOs in the literature that we reject as CSOs on the basis of their variability are discussed in detail in the following two subsections. These are the unusual AGN PKS 1413+135 (Readhead et al. 2021), and PKS 1543+005, another strongly variable radio source (Dennison et al. 1981). PKS 1543+005 provides a prime example of projection of an approaching jet onto both sides of the nucleus, thereby masquerading as a CSO morphologically because the emission does not come from two oppositely directed jets.
2.3.1. PKS 1413+135
PKS 1413+135 has been discussed as a CSO, or CSO candidate, in many studies (e.g., Perlman et al. 1994, 1996, 2002; Gugliucci et al. 2005; Willett et al. 2010; Principe et al. 2021). In Figure 2, we show its 15 GHz light curve. This object clearly violates the fundamental requirement for classification as a CSO: that the observed radiation should not be strongly beamed toward the observer (R93, R94, W94, R96). The variability of PKS 1413+135 as revealed by the light curve from the OVRO monitoring program, makes it obvious that this object is a blazar. PKS 1413+135 is one of the most strongly varying jetted AGN in the OVRO monitoring program. Early evidence of very strong variability at infrared wavelengths was reported by Bregman et al. (1981), who reported that PKS 1413+135 is "among the most highly variable extragalactic sources known" and that at 2.2 μm it exhibited changes of >10% on timescales of 1 day, and on three occasions the intensity changed by over a factor of 2 in less than 1 month.
All of this demonstrates clearly that this object is a blazar—and therefore not a CSO. In Figure 3, we show its morphology and its spectrum, including variability. Morphologically, PKS 1413+135 meets the criteria for a CSO because there is no doubt that it shows both a jet and a counter-jet on these small scales, and it is less than a kiloparsec in total extent. However, it is a blazar and a BL Lac object, and its high variability, at both radio and infrared wavelengths, as discussed in detail by Readhead et al. (2021), leaves no doubt that its axis is closely aligned with the line of sight and that its nuclear emission, as well as that in the approaching jet on the southwest side of the nucleus, is relativistically boosted toward us. It is clear from the case of PKS 1413+135 that the fact that the CSO classification was defined specifically to exclude objects in which the observed emission is strongly relativistically boosted toward the observer (R93, R94, W94, R96) has not been widely recognized.
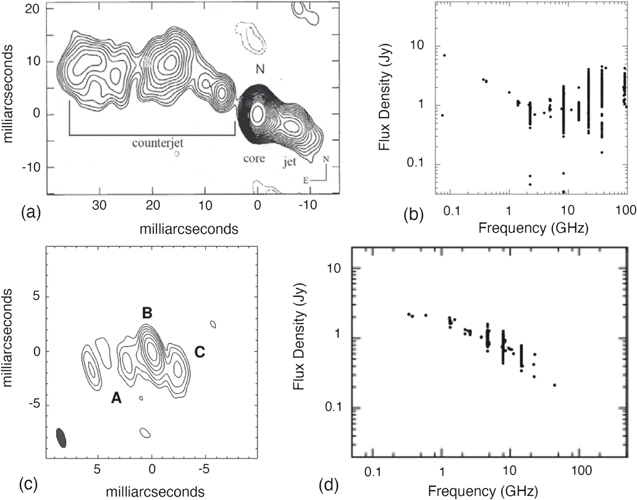
Figure 3. Two examples of jetted AGN that have been misclassified as CSOs in the literature. These have now been rejected because their variability is >20% yr−1 (see text). (a) and (b) PKS 1413+135. (c) and (d) PKS 1543+005. (a) VLBA map of PKS 1413+135 at 5 GHz (Perlman et al. 1996) showing clear emission in a jet and counter-jet that straddle the flat-spectrum radio nucleus at "N." The contour intervals are at 6 × 10⁻⁴ Jy beam−1. (b) The variability of PKS 1413+135 at different frequencies is shown here in this plot of flux densities taken from the MOJAVE website (Lister et al. 2019). The points at each frequency represent the range of total flux densities for this source observed at each frequency. (c) The morphology of PKS 1543+005 in this 15 GHz image from Peck & Taylor (2000) apparently shows structure from a jet and a counter-jet straddling the flat-spectrum nuclear component at "B." However, the distance between "C" and "B" is decreasing over time. The peak flux density is 289.4 mJy beam−1. As seen in (d) (from Torniainen et al. 2008), this is a highly variable AGN, making this an example of a slightly bending jet moving toward us almost along the line of sight that is being projected onto both sides of the nucleus (see text).
Download figure:
Standard image High-resolution image2.3.2. PKS 1543+005
PKS 1543+005 was classified as a CSO by Peck & Taylor (2000). In Figure 3, we show its morphology and its spectrum including variability. Like PKS 1413+135, morphologically PKS 1543+005 resembles a CSO because there is no doubt that as projected on the sky it shows emission on both sides of the nucleus (component "B") on these small scales, and it is less than a kiloparsec in total extent. Like PKS 1413+135, it is a highly variable blazar, as shown by Dennison et al. (1981). PKS 1543+005 also has a spectral peak luminosity over three times greater than any of the 79 AGN we identify as bona fide CSOs in this paper. Component "C" is apparently moving toward component "B" with apparent speed (1.10 ± 0.17)c (Gugliucci et al. 2005). These authors point out that this could indicate that component "C" is stationary, while component "B" is apparently moving toward component "C," due to the ejection of a new nuclear component. However, the variability shown in Figure 3(d) is a factor of 4 at 10 GHz. Furthermore, in a study of 90 AGN at 318 MHz, Dennison et al. (1981) found PKS 1543+005 to be by far the most variable of the AGN in their sample. Their conclusion about their most variable objects was that "these properties are consistent with models invoking relativistic beaming." On account of its high variability and high luminosity, there can be no doubt that the radio emission from PKS 1543+005 is highly boosted by relativistic beaming, and thus this object should not be classified as a CSO.
Thus, PKS 1543+005 likely falls into one of the two cases of misidentified CSOs that we are trying to avoid in the CSO class: those closely aligned with the line of sight whose apparent symmetry is due to approaching structure being projected onto both sides of the nucleus.
Summary of CSO variability filter. Any misconception regarding the rate of variability in CSO spectra and structure can be resolved using the variability data of the CSOs in the OVRO 15 GHz monitoring program. Typical examples of the spectra and variability of CSOs are shown in the lower three panels of Figure 4, where they are compared to those of three blazars, shown in the upper three panels. Although the fractional variations in these CSOs are large, as shown in Figure 4, they occur over a long time period. A prime example is that of OQ 208, shown in Figure 2.
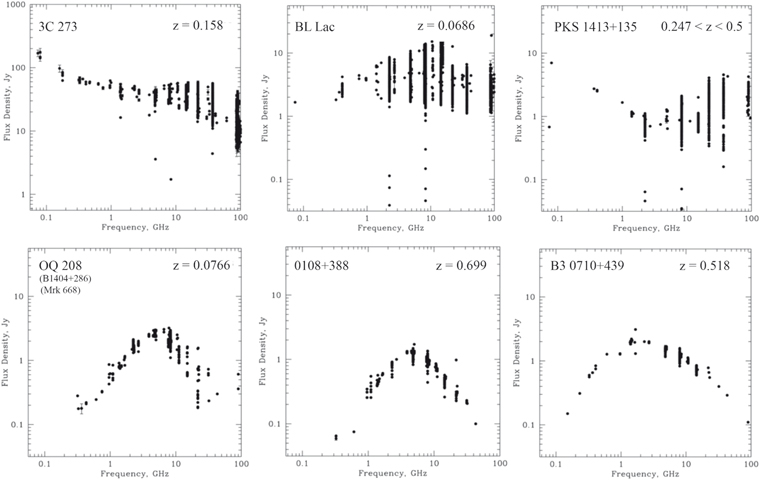
Figure 4. The spectra and variability of blazars vs. CSOs taken from the MOJAVE website. The top three panels show the spectra and the variability of three blazars: 3C 273, a flat spectrum radio quasar (FSRQ); Bl Lac, the archetypal BL Lac object; and PKS 1413+135, an object that has frequently been misclassified as a CSO, whose 15 GHz light curve is shown in Figure 2. The bottom three panels show the spectra and variability of three typical CSOs. These peaked spectrum sources are typical of CSOs, although ∼10% of the CSOs in our bona fide sample have monotonically rising spectra toward low frequencies. CSOs show only slow variations in both flux density and structure (see text).
Download figure:
Standard image High-resolution image2.4. Apparent Velocities of Components in CSO Jets
In general, the measured apparent speeds of components in the jets of CSOs are found to be vapp ≲ c (Lister et al. 2016; Tremblay et al. 2016). The mean separation speeds of the hot spots are found on average to be ∼0.36c (see Taylor et al. 2000; Polatidis et al. 2002; An & Baan 2012; and Paper II), but some jet components in CSOs have speeds close to, or exceeding, c. For example, the following are the maximum apparent speeds of components in the jets of three typical CSOs: for J0111+3906 (0108+388),  for J0713+4349 (B3 0710+439),
  (Lister et al. 2019); and for J1945+7055,
  (Taylor et al. 2009).
3. The Search for CSO Candidates and the Selection of 79 Bona Fide CSOs
The principal objective of this paper is to define and apply the above revised CSO selection criteria in order to filter out AGN incorrectly identified as CSOs in the literature, and hence to lay a firm foundation for studies of the phenomenology of CSOs.
We therefore undertook an extensive literature search for sources that had been identified as CSOs or potential CSO candidates. We augmented our initial list of candidates with other AGN that we thought might well be CSOs, as well as all AGN from three complete flux density-limited samples. We then examined all of these sources in the light of our four CSO selection criteria.
It is not our intention in this paper to present a large complete catalog of CSOs. We hope that the sample of bona fide CSOs we present will be added to and developed by the community into a catalog of bona fide CSOs.
In Sections 3.1 and 3.2, we describe our literature search and the vetting process.
3.1. CSO Candidate Search
We embarked on a literature search for CSO candidates using the astroquery 11 (Ginsburg et al. 2019) interface to the Astrophysics Data System (ADS). 12 We searched for refereed publications that contained the term "compact symmetric object" in the title or abstract with the query abs:(compact symmetric object) property:refereed database:astronomy. From the query results, we filtered 125 publications that explicitly mentioned "compact symmetric object" in the abstract. Similarly, we found 490 publications using the search terms "compact steep spectrum" and "gigahertz peaked spectrum," out of which we identified 17 containing VLBI images of CSO-like AGN. Several dozen other publications were subsequently added during the literature review, leading to a final list of approximately 200 publications.
In the ∼30 yr since the original definition paper for the CSO class by W94, there have been numerous papers that have presented lists of CSOs, peaked radio sources, and young radio jets. Augusto et al. (2006) adopted a systematic approach and literature search similar to ours. They compiled a sample of 37 CSOs, and 4 candidate CSOs with unknown redshift. Augusto et al. (2006) also constructed a list of 157 candidate sub-kiloparsec-sized flat-spectrum CSOs, of which they ruled out 61 as CSOs. Labiano et al. (2007) expanded the original list of PS sources by O'Dea et al. (1991) to create a new master list of 74 PS radio sources. Torniainen et al. (2008) collected data on a much larger sample of 206 PSs and high-frequency peakers (HFPs) from the literature. Their analysis confirmed a strong contamination of the HFP class by blazars that have temporarily peaked spectra during periods of radio flaring. An & Baan (2012) presented a compilation of known CSOs and CSO candidates, which included six sources that An et al. (2012) classified as new CSOs. Orienti & Dallacasa (2014) constructed a list of 51 young radio sources that had unambiguous core region detections, of which 19 are smaller than 1 kpc. Tremblay et al. (2016) performed multifrequency Very Long Baseline Array (VLBA) follow-up observations of 109 CSO candidates in the VLBA Imaging and Polarimetry Survey (VIPS) and identified nine previously confirmed and 15 new CSOs. There is considerable overlap in the CSO source lists from these compilations. All of these source compilations have been considered in our source sample.
We augmented the CSO candidate source list with all sources from the following complete radio AGN samples: the PR sample (Pearson & Readhead 1988), the First Caltech Jodrell Bank (CJ1) sample (Polatidis et al. 1995), and the 171 sources from the Peacock Wall (PW) sample (Peacock & Wall 1981; Wall & Peacock 1985) with flux density S2.7 GHz ≥ 1.5 Jy. In addition, we used the incomplete Caltech Jodrell Bank flat-spectrum (CJF) sample (Taylor et al. 1996b) and the VIPS sample (Helmboldt et al. 2007). It should be noted that the original PW sample (Peacock & Wall 1981) consisted of 168 objects, to which three more (DA 240, 0945+73 = 4C 73.08, and NGC 6251) were added by Wall & Peacock (1985). This process yielded a list of 3175 AGN that were potential CSO candidates. We assigned a unique ID number to each of these candidates. We compiled a database of these sources, which includes (where available): angular sizes, radio spectra, jet component speeds, radio light curves, variability indices, and polarization. We used only spectroscopic redshifts, both from the literature and from the NASA/IPAC Extragalactic Database (NED). 13
VLBI images obtained from the literature were complemented by images and multi-epoch radio spectra from the online Radio Fundamental Catalog (RFC) 14 and also VLBI images from the MOJAVE program archive 15 (e.g., Lister et al. 2019).
For 1657 of the sources in our list, 15 GHz light curves were available from the OVRO 40 m monitoring program 16 (Richards et al. 2011). We used these to check whether the light curves showed flares typical of blazars.
3.2. CSO Vetting Process
We classified all 3175 sources as follows (see Table 1), which gives the relevant numbers:
- Bona fide CSOs. Sources that were not rejected on the basis of any of our CSO criteria.
- A-class candidates. Sources that were not rejected by the CSO criteria, but for which the available VLBI images do not definitively confirm or rule out their CSO nature. We are obtaining new Very Large Array (VLA) and/or VLBA observations of these AGN, which we consider to be promising CSO candidates (in preparation).
- B-class candidates. These sources were not rejected on the basis of size, speed, or variability measurements, but lacked sufficient VLBI data to confidently classify their morphology as CSOs. Roughly 40% of these sources have no available VLBI images, and another ∼30% are unresolved in existing VLBI images. We cannot rule out these "B-class" sources as potential CSOs, but consider them to be less promising CSO candidates for follow-up VLBA studies, due to low flux density, unresolved structure, and/or location in the southern sky. The large number of possible CSOs in this class (Table 1) strongly suggests that any compilation of CSOs at this stage that is not very carefully constrained by the selection criteria is likely to be seriously incomplete.
- Rejected candidates. These sources were rejected on the basis of at least one of the CSO classification criteria described in Section 2.
Table 1. Number of Sources in Each Group
| Group | Count | Comments |
|---|---|---|
| CSO | 79 | 15 newly confirmed bona fide CSOs (this paper). These new confirmed CSOs are indicated in Table 3. |
| A-candidate | 167 | These CSO candidates are highly likely to be CSOs, which have been observed with new VLBA observations. |
| B-candidate | 1164 | This large number of CSO candidates will require a large follow-up program. |
| Rejected a | 1765 | Grounds for rejection: morphology (1221), size (362), variability (194), and speed (144) |
| Total | 3175 | Claimed CSOs and CSO candidates |
Note.
a The numbers of CSO candidates rejected in this study for the reason(s) indicated in the third column. Some objects were rejected for more than one reason, but we did not determine all the reasons for rejecting a CSO candidate, usually stopping once a candidate had failed one criterion, because this is all that is needed to disqualify an object from the CSO class.Download table as: ASCIITypeset image
We applied an initial filter by rejecting all AGN in our source list with projected largest size exceeding 1 kpc, except for five AGN (which are discussed below) that showed evidence of more than one epoch of activity. All five of these AGN showed an emission gap or a strong decrease in surface brightness between the inner (<1 kpc) and outer (kiloparsec-scale) radio structures. Most of the CSS sources in our list were filtered out in this step. For AGN without redshifts, we rejected all those with angular size greater than 1''. We note that this may have potentially excluded some low-redshift CSOs (z < 0.06).
Of our candidates, 228 were monitored in the MOJAVE program (e.g., Lister et al. 2019), which provides measurements of the radio component speeds. We rejected 144 sources from our list that had measured speeds exceeding 2.5c.
The remaining candidates were examined independently by at least two of our coauthors, at least one of whom had significant experience in VLBI and the study of relativistic jets. Most of the rejected sources were obvious asymmetric, one-sided "core-jet" sources that could therefore be rejected immediately on the basis of their morphology. A few could be classified immediately as "bona fide" CSOs. Any candidate deemed a possible CSO, but not definite, by one of the examiners, was discussed by the whole group. Finally, we assigned all the A- and B-class sources to one author each, to gather more data from the literature, if available, and to confirm the prior classification or suggest another round of group discussion, where a final classification was determined by consensus. Inevitably, there were marginal classification choices, and we accept that there will be sources that turn out to be CSOs among the B-candidates that we decided not to follow up.
The sample of VIPS sources was added at a later stage. A fraction of the sample had already been classified by us. For the newly added VIPS sources, we (i) automatically rejected those that had been classified as core jets by Tremblay et al. (2016), (ii) automatically classified those as B-class candidates that were identified as point sources by Tremblay et al. (2016), and (iii) examined those sources identified by Tremblay et al. (2016) as CSOs or complex, in the same manner as described above.
3.3. Classification
Table 1 lists the total number of sources and the number of sources in each of the groups the sources were assigned to. The table also lists the number of sources that were rejected based on each criterion. A list of the 79 bona fide CSOs is given in Table 3 in Appendix B. In this section, we explain some specific classification decisions made in the context of the criteria defined above.
3.3.1. CSOs Lacking an Identified Center of Activity
As discussed in Section 2.2, it is not always possible to identify the center of activity from the available VLBI images. We classified as bona fide CSOs 22 sources for which no center of activity has been detected, and 10 for which the core is not clearly identifiable. These sources show compact double lobe-like features with steep spectra, sometimes with jet emission between them.
3.3.2. CSOs with Spectroscopic Redshifts
Of the 79 bona fide CSOs we have identified, only 54 bona fide CSOs have published spectroscopic redshifts. These are shown in Figure 5. The peak at low redshift is due to (edge-dimmed) CSO 1 s, which are predominantly nearby, low-luminosity AGN. The redshift distribution can be affected by several selection biases that are discussed in Section 4.2.

Figure 5. Redshift distribution of the 54 bona fide CSOs with spectroscopic redshifts.
Download figure:
Standard image High-resolution image3.3.3. Long-term Variability
Of the 10 OVRO 40 m CSO light curves, eight show long-term trends in their 15 GHz flux densities, with fractional variability from 10% to 60% on timescales from 5–15 yr, but for all of them the maximum fractional variability rates are  yr−1. As discussed in Section 2.3, slow variability is not in violation of criterion 3; we accept these sources into the class of CSOs. The variability of CSOs is an area of great interest. The CSOs in our bona fide list for which we do not have OVRO light curves are not core-dominated and they have very clear two-sided structure, so it is clear that they cannot be varying strongly on timescales of a few years.
4. Sample Biases
Because the parent sample, from which we identified 79 sources as bona fide CSOs, was accumulated from a large literature search, it is subject to a host of selection biases, the most severe of which we discuss below.
4.1. Random Selection Bias
Some of our CSO candidates were selected from statistically ill-defined studies. In many cases, high-sensitivity, multifrequency VLBI observations revealed CSO morphology that might not be so readily apparent in a general, broad VLBI survey. For these CSOs, there is no way of estimating the selection biases. It is important to keep this in mind, unless working with a particular well-defined and carefully selected subsample of the 79 bona fide CSOs for which the selection effects either can be eliminated or do not affect the particular investigation being undertaken.
Because many of our CSOs were discovered in surveys with well-defined selection criteria, one can investigate potential selection biases, if any, in these cases. We discuss these below.
4.2. Angular Size and Redshift Bias
There are two angular size selection effects in VLBI surveys caused by the finite range of baseline lengths in the observing arrays. The shortest baselines limit the lowest spatial frequencies, i.e., the largest extent of the observable field of view. Long baseline interferometers, such as the VLBA, typically lack short baselines and are insensitive to components larger than ∼100 mas at 5 GHz.
On the other hand, the longest baselines determine the resolving power, and the finite resolution of cm-wave VLBI means that CSOs can only be identified down to lobe or hot spot separations of a few milliarcseconds.
The most significant selection bias relevant to this study is that the field-of-view limitation makes it easy to miss widely separated components at centimeter wavelengths unless one also has VLBI observations at a lower frequency.
It should be clear that the above angular size selection effects also impact the redshift distribution of our sample of bona fide CSOs, because of the dependence of the apparent angular size on redshift.
4.3. Flux Density Limit Bias
The flux density limits of parent samples could bias against CSOs having components with large angular size and low surface brightness.
4.4. Spectral Index Limit Bias
Spectral index limits can bias the selection of CSOs because many CSOs have peaked spectra. Thus, spectral index limits can exclude some CSOs. In the CJF and VIPS samples, based on the results from our three complete samples, we estimate that ≈50% of the CSOs above the flux density limit have been missed due to the spectral index limit α ≥ −0.5.
5. Complete Samples
We searched for bona fide CSOs in our three complete radio samples, as well as in our two incomplete samples, which excluded steep spectrum objects, i.e., those with α < −0.5. The results are listed in Table 2. The bona fide CSO detection fractions for these samples range from 2.9% to 9.4%. However, both the CJF and VIPS samples are flat-spectrum α ≥ −0.5 samples; consequently, they are seriously incomplete, as explained in Section 4.4.
Table 2. CSOs and CSO Candidates in Three Complete and Two Incomplete Radio Samples
| (1) | PR | PR+CJ1 | PW 1.5 Jy | CJF | VIPS | |
|---|---|---|---|---|---|---|
| (Complete) | (Complete) | (Complete) | (Incomplete) | (Incomplete) | ||
| (2) | Decl. | δ ≥ 35° a | δ ≥ 35° a | δ ≥ 10° a | δ ≥ 35° a | 65° ≥ δ ≥ 15° b |
| (3) | Galactic latitude | ∣b∣ > 10° | ∣b∣ > 10° | ∣b∣ > 10° | ∣b∣ > 10° | ⋯ |
| (4) | Selection frequency | 5 GHz | 5 GHz | 2.7 GHz | 4.85 GHz | 8.5 GHz |
| (5) | Flux density | S > 1.3 Jy | S > 0.7 Jy | S > 1.5 Jy | S > 350 mJy | S > 85 mJy |
| (6) | Spectral index | ⋯ | ⋯ | ⋯ |

|

|
| (7) | Other constraints | ⋯ | ⋯ | ⋯ | ⋯ | Area of SDSS DR5 |
| (8) | Reference | 1 | 2 | 3 | 4 | 5 |
| (9) | Total | c 64 | c 199 | c 170 | 293 | 1127 |
| (10) | CSO | 6 | 12 | 13 | 11 | 33 |
| (11) | Class A | 0 | 5 | 0 | 11 | 48 |
| (12) | Class B | 1 | 4 | 4 | 29 | 268 |
| (13) | Rejected | 57 | 178 | 153 | 242 | 778 |
| (14) | CSO fraction [%] | 9.4 | 6.0 | 7.6 | 3.8 | 2.9 |
Notes. Rows (2)–(8): the sample selection criteria. The corresponding references are listed in the table notes. Row (9): the total number of sources in the samples. Rows (10)–(13): the number of sources in each CSO category as defined in Section 3.2. Row (14): the fraction of CSOs in each sample.
a For source coordinates in B1950.0 equinox. b For source coordinates in J2000.0 equinox. c We removed the starburst galaxy M82 from the sample. References: (1) Pearson & Readhead 1988; (2) Polatidis et al. 1995; (3) Peacock & Wall 1981, 1982; Wall & Peacock 1985; (4) Taylor et al. 1996b; (5) Helmboldt et al. 2007.Download table as: ASCIITypeset image
In Table 2, we see that in the PR complete sample there are 6 bona fide CSOs, 0 Class A candidates, and 1 Class B candidate. For the CJ1 sample these numbers are 12, 5, and 4, respectively, while for the PW sample they are 13, 0, and 4, respectively. If none of the Class A and Class B candidates in these complete samples turn out to be bona fide CSOs, the fraction of CSOs with S5 GHz > 700 mJy is (6.8 ± 1.6)%. On the other hand, if all of the Class A candidates and none of the Class B candidates turn out to be bona fide CSOs, the fraction of CSOs with S5 GHz > 700 mJy is (8.5 ± 1.8)%.
Thus, the fraction of CSOs with S5GHz > 700 mJy lies between (6.8 ± 1.6)% and (8.5 ± 1.8)%.
6. The Angular Sizes and Spectra of CSOs
In addition to the selection effects described above, our angular sizes were estimated using images at different frequencies, and for sources located at very different redshifts. We therefore caution the reader not to overinterpret Figures 5–9.
6.1. The Largest Angular Size of CSOs
In order to have as consistent a set as possible of measurements of the largest angular size, we measured these on the radio maps of the bona fide CSOs, using the largest separation of the second lowest contour on the map, because the lowest contour can often be noisy. In cases where the component at the extremity of the map was unresolved, we used the position of the peak rather than the second contour. In all cases we used the lowest-frequency VLBI images available, as these are more sensitive to steep-spectrum low surface brightness emission. In some cases, our size measurements are up to ∼15% smaller than some published values that use different assumptions about the beam size and image noise level. We point out two large discrepancies: (i) B3 0703+468 (J0706+4647), which Dallacasa et al. (2002) measured as 75 mas, but for which we adopt a size of 63 mas based on a more recent VLBI map by Orienti et al. (2004); and (ii) B3 1133+432 (J1135+4258), which Dallacasa et al. (2002) measure as 45 mas, but for which we adopt a size of 29 mas based on a more recent map by Helmboldt et al. (2007).
We classified five sources as bona fide CSOs that show both small- and large-scale structures, which we interpret as a signature of different epochs of activity: 0108+388 (J0111+3906; Baum et al. 1990; Stanghellini 2003), B2 0402+379 (J0405+3803; Maness et al. 2004), NGC 3894 (J1148+5924; Taylor et al. 1998), J1247+6723 (Marecki et al. 2003), and PKS B1345+125 (J1347+1217; Stanghellini et al. 2005). In these five cases, the classification as a CSO is based on the small-scale structure with size <1 kpc, whereas the larger structure exceeds the size threshold by a factor of order 10–1000. In all five cases, there was a large drop in surface brightness, or an actual gap in the brightness distribution, between the small- and large-scale structures.
Our angular size measurements are listed in Table 3 in Appendix B, and the angular size distribution of the 79 CSOs in our sample is shown in Figure 6. The two outlier CSOs at 250 mas and 280 mas are J1602+5243 and JJ1508+3423, respectively. The distribution shows a dip below ∼10 mas, a peak from 10–50 mas, and a steady decline in numbers at larger sizes. Both the strong cutoffs at small angular size and at large angular sizes are certain to be strongly affected by the selection effects described in Section 4.2 and hence cannot be used for statistical tests.

Figure 6. Angular size distribution of the bona fide CSOs.
Download figure:
Standard image High-resolution imageTable 3. Bona Fide CSOs
| J2000 Name | Common Name | R.A. | Decl. | Redshift | Ang. Size | Lin. Size | Turnover Freq. | Turnover | X- or | CSO Reference |
|---|---|---|---|---|---|---|---|---|---|---|
| Flux Dens. | γ-Ray | |||||||||
| (mas) | (kpc) | (GHz) | (Jy) | |||||||
| J0000+4054 | B3 2358+406 | 00:00:53.08 | +40:54:01.81 | 124.01, a | c | 0.3233 | 2.063 | 1, 2, 3, 4, 5, 6 | ||
| J0003+4807 | JVAS J0003+4807 | 00:03:46.04 | +48:07:04.14 | 16.22, a | 0.139 a | 2.1233 | 0.3483 | 1, 3, 4 | ||
| J0029+3456 | B2 0026+34 | 00:29:14.24 | +34:56:32.25 | 0.5171 | 29.13, a | 0.180 a | 0.84 | 2.04 | X1,2 | 4, 7 |
| J0111+3906 | 0108+388 | 01:11:37.32 | +39:06:28.10 | 0.668472 | 8.04,a ,d | 0.056 a | 4.03 | 1.333 | X2,3,4,5 | 4, 8, 9 |
| J0119+3210 | B2 0116+31 | 01:19:35.00 | +32:10:50.06 | 0.06023 | 100.05, a | 0.115 a | 0.45 | 4.05 | X5 | 10, 11, 12, 13, 14, 15, 4 |
| J0131+5545 | TXS 0128+554 | 01:31:13.82 | +55:45:12.98 | 0.036494 | 23.06, a | 0.016 a | 0.6576 | 0.316 | γ1,2,3 | 16 |
| J0132+5620 | JVAS J0132+5620 | 01:32:20.45 | +56:20:40.37 | 12.27, a | 0.104 a | 3.427 | 0.67 | 1, 17, 3 | ||
| J0150+4017 | B3 0147+400 | 01:50:19.61 | +40:17:30.02 | 103.08, a | 0.882 a | 0.41 a | 2.01 a | 18, 4 | ||
| J0204+0903 | JVAS J0204+0903 | 02:04:34.76 | +09:03:49.26 | 33.09, a | 0.282 a | 1.34 | 2.04 | 1, 3, 4 | ||
| J0237+4342 | B3 0233+434 | 02:37:01.21 | +43:42:04.18 | 120.010, a | c | 0.31 a | 0.8681 a | 10, 12, 4 | ||
| J0402+8241 | JVAS J0402+8241 | 04:02:12.68 | +82:41:35.13 | 72.011, a | 0.616 a | 0.42 a | 0.42 a | 12, 4 | ||
| J0405+3803 | B3 0402+379 | 04:05:49.26 | +38:03:32.24 | 0.055055 | 42.012,a ,d | 0.044 a | <0.071 a | >5.51 a | X8 | 15, 19 |
| J0425-1612 | PKS 0423-163 | 04:25:53.57 | −16:12:40.23 | 99.813, a | 0.854 a | 0.3638 | 1.4498 | 20, 4 | ||
| J0427+4133 | B3 0424+414 | 04:27:46.05 | +41:33:01.10 | 7.014, | 0.060 a | 3.34 | 0.744 | 1, 3, 4 | ||
| J0440+6157 | GB6 J0440+6158 | 04:40:46.90 | +61:57:58.57 | 30.015, a | 0.257 a | 1.74 | 0.244 | 21 | ||
| J0706+4647 | B3 0703+468 | 07:06:48.07 | +46:47:56.45 | 63.016, a | 0.539 a | 0.7773 | 1.813 | 2, 4 | ||
| J0713+4349 | B3 0710+439 | 07:13:38.16 | +43:49:17.21 | 0.5186 | 35.017, a | 0.217 a | 1.93 | 2.093 | X2,3,5 | 4, 8, 9 |
| J0735-1735 | PKS 0733-17 | 07:35:45.81 | -17:35:48.50 | 28.818, a | 0.246 a | 1.44 | 3.04 | 20 | ||
| J0741+2706 | B2 0738+27 | 07:41:25.73 | +27:06:45.42 | 0.7721397 | 26.019, a | 0.193 a | 1.01 a | 1.051 a | 22 | |
| J0754+5324 | JVAS J0754+5324 | 07:54:15.22 | +53:24:56.45 | 26.020, a | 0.223 a | 1.243 | 0.6343 | 1, 22, 23, 3, 4 | ||
| J0825+3919 | B3 0822+394 | 08:25:23.68 | +39:19:45.76 | 1.218 | 70.721, a | 0.591 a | 0.5173 | 1.773 | γ4 | 2 |
| J0832+1832 b | PKS 0829+18 | 08:32:16.04 | +18:32:12.12 | 0.1549 | 30.722, a | 0.081 a | 1.51 a | 1.21 a | 22, 23 | |
| J0855+5751 | JVAS J0855+5751 | 08:55:21.36 | +57:51:44.09 | 0.02599810 | 75.023, a | 0.039 a | 0.31 a | 1.51 a | 22, 23, 24, 25 | |
| J0906+4124 b | GB6 J0906+4124 | 09:06:52.80 | +41:24:30.00 | 0.027357711 | 11.124, a | 0.006 a | <1.52 a | 0.062 a | ||
| J0909+1928 b | MRK 1226 | 09:09:37.44 | +19:28:08.30 | 0.02784311 | 14.725, a | 0.008 a | 6.02 a | 0.122 a | ||
| J0943+1702 | JVAS J0943+1702 | 09:43:17.23 | +17:02:18.97 | 1.60111511 | 20.426, a | 0.175 a | 4.01 a | 0.41 a | 22, 23 | |
| J1011+4204 | B3 1008+423 | 10:11:54.18 | +42:04:33.38 | 115.027, a | 0.984 a | 0.4243 | 1.163 | 2 | ||
| J1025+1022 b | NVSS J102544+102231 | 10:25:44.20 | +10:22:30.00 | 0.0458054 | 19.828, a | 0.018 a | <1.02 a | >0.092 a | ||
| J1035+5628 | JVAS J1035+5628 | 10:35:07.04 | +56:28:46.79 | 0.4612 | 38.029, a | 0.221 a | 1.33 | 1.873 | X2,3,5 | 22, 23, 4, 6, 8, 9 |
| J1042+2949 | B2 1039+30B | 10:42:36.51 | +29:49:45.15 | 45.030, a | 0.385 a | 0.71 a | 1.01 a | 22, 23 | ||
| J1111+1955 | PKS 1108+201 | 11:11:20.07 | +19:55:36.01 | 0.29913 | 15.531, a | 0.068 a | 1.3053 | 1.13 | 1, 22, 23, 26, 3, 4, 6 | |
| J1120+1420 | PKS 1117+146 | 11:20:27.81 | +14:20:54.97 | 0.36214 | 101.032, a | 0.507 a | 0.53 | 3.893 | X4 | 26, 27, 4 |
| J1135+4258 | B3 1133+432 | 11:35:55.99 | +42:58:44.65 | 29.033, a | 0.248 a | 1.09 | 1.459 | 2, 22, 23, 28, 29 | ||
| J1148+5924 | NGC 3894 | 11:48:50.36 | +59:24:56.36 | 0.0107515 | 54.834,a ,d | 0.012 a | 6.1493 | 0.5733 | γ2,3,5 | 15, 22, 23, 30 |
| J1158+2450 | PKS 1155+251 | 11:58:25.79 | +24:50:18.00 | 0.20316 | 46.035, a | 0.152 a | 2.01 a | 1.251 a | 22 | |
| J1159+5820 | VERA J1159+5820 | 11:59:48.77 | +58:20:20.31 | 1.2799711 | 70.236, a | 0.591 a | 0.61 a | 1.91 a | 22, 23 | |
| J1204+5202 | GB6 J1204+5202 | 12:04:18.61 | +52:02:17.62 | 54.037, a | 0.462 a | 0.71 a | 1.41 a | 22, 23 | ||
| J1205+2031 b | NGC 4093 | 12:05:51.50 | +20:31:19.00 | 0.0237885711 | 22.038, a | 0.010 a | <1.02 a | >0.142 a | ||
| J1220+2916 | NGC 4278 | 12:20:06.82 | +29:16:50.72 | 0.00217 | 46.839, a | 0.002 a | <0.0741 a | 0.651 a | X10,2 | 22, 23 |
| J1227+3635 | B21225+36 | 12:27:58.72 | +36:35:11.82 | 1.97518 | 58.840, a | 0.499 a | 1.29 | 2.149 | 22, 23, 26 | |
| J1234+4753 | JVAS J1234+4753 | 12:34:13.33 | +47:53:51.24 | 0.37308211 | 27.441, a | 0.140 a | 1.41 a | 0.361 a | X2,4 | 22, 23 |
| J1244+4048 | B3 1242+410 | 12:44:49.19 | +40:48:06.15 | 0.81358611 | 70.042, a | 0.529 a | 0.4053 | 2.033 | 2, 22, 23, 26 | |
| J1247+6723 b | JVAS J1247+6723 | 12:47:33.33 | +67:23:16.45 | 0.10721911 | 5.043,a ,d | 0.010 a | 1.167 | 0.367 | X5 | |
| J1254+1856 | CRATES J1254+1856 | 12:54:33.27 | +18:56:01.93 | 0.114519 | 4.1444, a | 0.008 a | 6.02 a | 0.132 a | 22, 23 | |
| J1311+1658 | JVAS J1311+1658 | 13:11:23.82 | +16:58:44.22 | 0.08140810 | 27.045, a | 0.041 a | 0.4478 | 0.8248 | 1, 22, 23, 3 | |
| J1313+5458 b | JVAS J1313+5458 | 13:13:37.85 | +54:58:23.91 | 0.61320 | 57.046,a | 0.384 a | 0.5557 | 1.657 | 22, 23 | |
| J1326+3154 | DA 344 | 13:26:16.51 | +31:54:09.52 | 0.3680121 | 68.047, a | 0.345 a | 0.53 | 7.033 | X11,2,4 | 22, 23, 26, 4 |
| J1335+5844 | JVAS J1335+5844 | 13:35:25.93 | +58:44:00.29 | 12.948, a | 0.110 a | 4.99 | 0.99 | 17, 22, 23, 29, 31 | ||
| J1347+1217 | PKS B1345+125 | 13:47:33.36 | +12:17:24.24 | 0.12122 | 100.049,a ,d | 0.215 a | 0.43 | 8.863 | X12,13 | 15, 32, 33, 34 |
| J1400+6210 | 1358+625 | 14:00:28.65 | +62:10:38.59 | 0.4316 | 67.650 ,a | 0.378 a | 0.53 | 6.563 | X14,2,3,4 | 26, 4, 6, 8, 9 |
| J1407+2827 | OQ +208 | 14:07:00.40 | +28:27:14.69 | 0.07723 | 11.051, a | 0.016 a | 4.910 | 3.010 | X15,16,2,5 | 15, 26, 29, 32, 35, 4 |
| J1413+1509 | JVAS J1413+1509 | 14:13:41.66 | +15:09:39.51 | 15.052, a | 0.128 a | 2.52 a | 0.472 a | 22, 23, 34 | ||
| J1414+4554 | B3 1412+461 | 14:14:14.85 | +45:54:48.73 | 0.18624 | 30.553, a | 0.094 a | 0.6933 | 0.3963 | 1, 22, 23, 24, 3, 34 | |
| J1416+3444 b | B2 1413+34 | 14:16:04.18 | +34:44:36.39 | 81.054,a | 0.693 a | 0.73 | 2.13 | |||
| J1434+4236 | B3 1432+428B | 14:34:27.86 | +42:36:20.06 | 0.45225 | 68.355, a | 0.393 a | <0.0742 a | >1.672 a | 2, 22 | |
| J1440+6108 b | VIPS J14402+6108 | 14:40:17.87 | +61:08:42.88 | 0.44536511 | 30.056, a | 0.171 a | 0.41 a | 0.481 a | 22, 23 | |
| J1443+4044 | B3 1441+409 | 14:42:59.32 | +40:44:28.94 | 123.457, a | c | 0.2923 | 1.553 | 2 | ||
| J1508+3423 b | VV 059a | 15:08:05.70 | +34:23:23.00 | 0.04556526 | 280.058, a | 0.247 a | <0.2311 | >0.2511 | ||
| J1511+0518 | JVAS J1511+0518 | 15:11:41.27 | +05:18:09.26 | 0.08427 | 10.659, a | 0.017 a | 11.13 | 0.7783 | X2,5 | 17, 26 |
| J1559+5924 b | JVAS J1559+5924 | 15:59:01.70 | +59:24:21.84 | 0.060224 | 11.060, a | 0.013 a | <0.151 a | 0.231 a | 22, 23 | |
| J1602+5243 b | 4C +52.37 | 16:02:46.38 | +52:43:58.40 | 0.10568911 | 250.061, a | 0.478 a | 0.1511 | 1.4811 | X17 | |
| J1609+2641 | CTD 93 | 16:09:13.32 | +26:41:29.04 | 0.47328 | 61.362, a | 0.362 a | 1.13 | 5.443 | X2,5 | 22, 23, 26, 36 |
| J1645+2536 | PKS 1642+25 | 16:44:59.07 | +25:36:30.64 | 0.58825 | 39.063, a | 0.258 a | 1.01 a | 1.11 a | 22, 23 | |
| J1723-6500 | NGC 6328 | 17:23:41.03 | -65:00:36.61 | 0.0144329 | 7.064, a | 0.002 a | 2.73 | 4.483 | γ2,3,6,7 | 15, 37 |
| J1734+0926 | PKS 1732+094 | 17:34:58.38 | +09:26:58.26 | 0.73530 | 12.865, a | 0.093 a | 2.35 | 1.225 | 1, 17, 3, 38, 4 | |
| J1735+5049 | CGRaBS J1735+5049 | 17:35:49.01 | +50:49:11.57 | 0.83531 | 8.066, a | 0.061 a | 6.43 | 0.9723 | 31, 39 | |
| J1816+3457 | B2 1814+34 | 18:16:23.90 | +34:57:45.75 | 0.24513 | 45.567, a | 0.174 a | 0.443 | 0.9833 | 1, 3 | |
| J1826+1831 | JVAS J1826+1831 | 18:26:17.71 | +18:31:52.89 | 74.068, a | 0.633 a | 0.3088 | 1.088 | 1, 3, 4, 5, 6 | ||
| J1826+2708 | B2 1824+27 | 18:26:32.11 | +27:08:07.95 | 41.069, a | 0.351 a | 1.010 | 0.3410 | 28, 29 | ||
| J1915+6548 b | JVAS J1915+6548 | 19:15:23.82 | +65:48:46.39 | 0.48632 | 36.070, a | 0.216 a | 0.512 | 0.8312 | 5 | |
| J1928+6815 | JVAS J1928+6814 | 19:28:20.55 | +68:14:59.27 | 128.171, a | c | <0.0741 a | 1.041 a | 12, 4 | ||
| J1939-6342 | PKS 1934-63 | 19:39:25.02 | -63:42:45.62 | 0.18333 | 42.672, a | 0.130 a | 1.43 | 15.03 | X2,5 | 4 |
| J1944+5448 b | S4 1943+54 | 19:44:31.51 | +54:48:07.06 | 0.26334 | 48.873, a | 0.196 a | 0.7783 | 1.773 | X2,5 | |
| J1945+7055 | S5 1946+70 | 19:45:53.52 | +70:55:48.73 | 0.10132 | 40.674 a | 0.075 a | 1.83 | 0.9293 | X2,5 | 15,4,40,41,42 |
| J2022+6136 | S4 2021+61 | 20:22:06.68 | +61:36:58.80 | 0.226635 | 29.075, a | 0.104 a | 4.0863 | 2.643 | X2,5 | 4,43,44 |
| J2203+1007 | JVAS J2203+1007 | 22:03:30.95 | +10:07:42.59 | 1.00536 | 11.076, a | 0.089 a | 4.4273 | 0.3063 | 1,17,3,39 | |
| J2327+0846 b | NGC 7674 | 23:27:56.70 | +08:46:44.30 | 0.0289237 | 1300.077, a | 0.744 a | <0.092 a | >1.02 a | X17 | |
| J2347-1856 | PKS 2344-192 | 23:47:08.63 | -18:56:18.86 | 33.478, a | 0.286 a | 1.84 | 0.664 | 20 | ||
| J2355+4950 | TXS 2352+495 | 23:55:09.46 | +49:50:08.34 | 0.2383112 | 90.079, a | 0.337 a | 0.73 | 2.933 | X2,3,4,5 | 4, 45, 8, 9 |
Notes. Columns show (1) the J2000 Name, (2) a common name, (3, 4) J2000 R.A. and decl., (5) redshift, (6, 7) angular and linear size, (8, 9) turnover frequency and flux density, (10) whether the source is X-ray and/or γ-ray detected, and (11) references that discussed the source as CSO or CSO candidate. All values are indexed with reference numbers. All references corresponding to the index numbers are listed in Appendix B. Redshifts are taken from the literature; the references are provided in Appendix B. Angular sizes were newly estimated in this work. The frequencies and origins of the maps used for size measurements are listed in Appendix B. Linear sizes are derived from these angular size measurements. Turnover frequencies and flux densities were partially taken from the literature and partially derived from RFC and NED spectra; the references are provided in Appendix B. References for the X-ray and γ-ray detections are listed in Appendix B. References that discussed some of these sources as CSOs of CSO candidates are listed in Appendix B.
a New measurements (this paper). b Newly confirmed CSO (this paper). c Source may exceed 1 kpc linear size if in a certain redshift range; see Section 3.3.2. d Source with multiple phases of activity; see Section 6.1.NGC 7674 (J2327+0846) is an outlier with a measured angular size of 1 3. It is a nearby Seyfert 2 galaxy with a redshift of 0.02892 (Nishiura et al. 2000). If it were located at the median bona fide CSO redshift (z = 0.24), it would have been detected as a CSO of ∼200 mas angular size, but probably would be too faint to image with VLBI.
6.2. The Radio Spectra of CSOs
The spectra of CSOs are often characterized by a single peak in the ∼100 MHz to ∼10 GHz range. Some show monotonically decreasing spectra down to the lowest frequency at which they have been observed (∼100 MHz).
The emission from CSOs is optically thin at frequencies above the peak and optically thick below the peak, due either to free–free absorption (FFA) or synchrotron self-absorption (SSA). These must be due to the compactness of CSOs. In the case of free–free absorption, this would be a result of the CSO emission regions being located in the dense central regions of their host galaxies. In the case of synchrotron self-absorption, it would arise because of the high surface brightness of the compact CSO emission regions (Scheuer & Williams 1968). In either case, the implied sizes of the emission regions would range from a few tenths of a milliarcsecond for CSOs with spectral peaks at a few GHz up to ∼10 mas for CSOs with spectral peaks around 100 MHz. Because both FFA and SSA are expected to be stronger in more compact sources, it is to be expected that there is a relationship between the structure and spectra of CSOs. This is an important part of the CSO story, not only because of the differences expected in CSO structures and spectra within a sample, but also because we would expect individual CSO spectra to change as CSOs evolve and expand. We are engaged in a study of connections between the structure of CSOs in a complete sample and their spectra. While this is a very interesting subject, it is beyond the scope of this paper.
The flux densities at the spectral peak and the angular sizes of our bona fide CSOs are shown in Figure 7, and in Figure 8 we plot the turnover frequency (νm ) versus largest angular size. The values are listed in Table 3 in Appendix B. The νm values were taken from the literature, or estimated by us based on multi-epoch radio spectra compiled on the RFC website. The arrows indicate upper limits on νm due to a lack of low-frequency flux density measurements.

Figure 7. Flux density at radio spectral peak vs. largest angular size for the bona fide CSOs. The CSOs plotted in blue have measured redshifts.
Download figure:
Standard image High-resolution image
Figure 8. Observed turnover frequency vs. largest angular size for the bona fide CSOs.
Download figure:
Standard image High-resolution imageFigure 7 shows a lower envelope on the spectral peak flux density that increases with angular size. This is likely affected by the flux density limit bias described in Section 4.3, as well as the angular size biases described in Section 4.2. It could also be the case that the peak flux density–size relationship seen here is influenced by evolution of the CSO. We return to this point in Paper III.
Similarly, Figure 8 shows a clear decrease in turnover frequency with increasing angular size. This is likely caused by SSA, FFA, and/or CSO evolution (O'Dea et al. 1991; Readhead et al. 1996; O'Dea & Saikia 2021), and it is also likely affected by the spectral index bias described in Section 4.4
Figure 8 also illustrates another possible source of bias in the bona fide CSO size distribution, namely that many CSO surveys and compilations have targeted PS sources, whereas CSOs with sizes greater than 100 mas have νm below 500 MHz, as illustrated in the trend in Figure 8.
Therefore, it is clear that, unless it can be shown that the effect under investigation will not be affected by these selection biases, in order to carry out any statistical tests on our sample of bona fide CSOs, it is important to consider complete flux density limited samples in which no spectral index filtering has been applied.
7. The Physical Sizes of CSOs
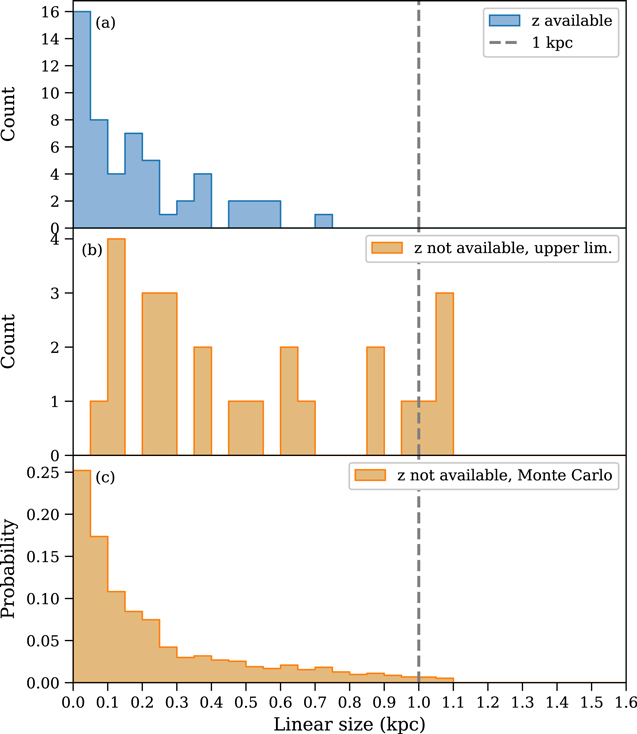
We give the projected physical sizes for the 54 CSOs for which we have spectroscopic redshifts in Table 3 in Appendix B, and show the linear size distribution in Figure 9(a).
Figure 9. Linear size distribution of the bona fide CSOs. Panel (a): histogram of the linear sizes of the 54 of 79 sources for which spectroscopic redshift estimates are available. Panel (b): histogram of the linear size upper limits for the 25 of 79 sources for which spectroscopic redshift estimates are not available. Panel (c): histogram of the Monte Carlo simulated distribution of linear sizes for the 25 of 79 sources without spectroscopic redshift estimates, assuming these sources follow the same redshift distribution as the other CSOs.
Download figure:
Standard image High-resolution image
For the remaining 25 bona fide CSOs, spectroscopic redshifts are not available and their location in the linear size distribution is unclear. Given the cosmology assumed throughout this paper, redshift 1.64 corresponds to the largest angular diameter distance. Assuming all CSOs without redshift estimates are located at this redshift, we calculate the upper limits on the linear sizes, shown in Figure 9(b). Of these sources, 21 have angular sizes small enough that they will not exceed 1 kpc in linear size regardless of their redshift. The remaining four have angular sizes large enough that they would exceed 1 kpc if they happen to lie in a specific redshift range: B3 1441+409 (J1443+4044, 1.1 < z < 2.6), B3 2358+406 (J0000+4054, 1 < z < 2.8), B3 0233+434 (J0237+4342, 0.7 < z < 3.6), and J1928+6815 (0.45 < z < 6.4).
If we assume that the 25 CSOs without spectroscopic redshifts follow the same redshift distribution as the 54 CSOs for which redshift measurements are available, and randomly draw 10,000 redshifts from the distribution shown in Figure 5 for each of the 25 sources, and take the mean of these, we get the distribution shown in Figure 9(c). There is a low probability that some or all of the four sources discussed above exceed 1 kpc. The distribution drops gradually toward a linear size of 1 kpc; this suggests that the linear size distribution of all 79 CSOs would not differ significantly from the one shown in Figure 9(a).
8. Conclusions
The class of CSOs was originally defined in order to enable detailed physical studies of the phenomenology of jetted AGN without the confusion that arises in observing strongly relativistically boosted emission regions. By adding two more selection criteria, based on variability and speed, we have laid the foundation for compiling a comprehensive catalog of CSOs that are uncontaminated by AGN misidentified as CSOs, thereby opening the way to the study of the phenomenology of CSOs.
Through an extensive literature search, we compiled a list of 3175 candidate CSOs and identified a sample of 79 bona fide CSOs, including 15 newly identified CSOs. In addition, we identified 167 CSO A-class candidates that we are currently observing with the VLBA, in order to make a definitive decision on whether or not they are bona fide CSOs. The follow-up of the 1166 CSO B-class candidates will take much longer because there are so many of them.
Our sample of 79 bona fide CSOs includes CSOs from three complete samples in which we have identified all of the CSOs. If we include the two incomplete flat-spectrum limited samples, the fraction of CSOs ranges from 2.9% to 9.4% The lower fractions occur in the incomplete flat-spectrum CJF and VIPS samples. These are missing many steep-spectrum CSOs, due to their spectral selection filter. Based on the complete PR, CJ1, and PW samples, which have no spectral index limits, the CSO fraction is (6.8 ± 1.6)% → (8.5 ± 1.8)%. These 79 bona fide CSOs are suitable for some, but certainly not all, statistical studies. Any statistical studies should consider the selection effects we have described. We have initiated a program to expand the numbers of CSOs in complete samples by at least a factor of 3.
In Appendix B, we present a catalog of CSOs, which we anticipate will grow over time as new CSOs are discovered. We hope that this effort, including our new criteria to eliminate highly beamed sources, will help to promote the study of the phenomenology of this distinctive class of jetted AGN.
In two further papers, Paper II and Paper III, we present compelling evidence that CSOs comprise a distinct and separate class of jetted AGN, and that most CSOs go through their whole ≲5000 yr lifespan, including their early, late, and midlife periods, as CSOs, and we discuss the origin of CSOs.
CSOs provide a unique window on relativistic jets and the central engines that drive them. With the uncontaminated elucidation of their multiwavelength phenomenology, CSOs are poised to address, in completely new ways, the origins of relativistic jets and the basic properties of their central engines.
Acknowledgments
We thank the reviewer of this paper for many helpful suggestions that have clarified several important aspects of this work. This research has made use of NASA's Astrophysics Data System Bibliographic Services. This research has made use of the NASA/IPAC Extragalactic Database (NED), which is operated by the Jet Propulsion Laboratory, California Institute of Technology, under contract with the National Aeronautics and Space Administration. The authors are grateful for the use of the CATS database of Verkhodanov et al. (2005), of the Special Astrophysical Observatory. This research has made use of data from the OVRO 40 m monitoring program (Richards et al. 2011), supported by private funding from the California Institute of Technology and the Max Planck Institute for Radio Astronomy, and by NASA grants NNX08AW31G, NNX11A043G, and NNX14AQ89G and NSF grants AST-0808050, AST-1109911, and AST-1835400. This research has made use of data from the MOJAVE database that is maintained by the MOJAVE team (Lister et al. 2018). The MOJAVE program was supported by NASA-Fermi grant 80NSSC19K1579. S.K. and K.T. acknowledge support from the European Research Council (ERC) under the European Union's Horizon 2020 research and innovation program under grant agreement No. 771282. K.T. acknowledges support from the Foundation of Research and Technology—Hellas Synergy Grants Program through project POLAR, jointly implemented by the Institute of Astrophysics and the Institute of Computer Science. A.S. acknowledges support from the NASA contract NAS8-03060 (Chandra X-ray Center). This paper depended on a very large amount of VLBI data, almost all of which were taken with the Very Long Baseline Array. The National Radio Astronomy Observatory is a facility of the National Science Foundation operated under cooperative agreement by Associated Universities, Inc.
Software: Astropy (Astropy Collaboration et al. 2013, 2018, 2022), Astroquery (Ginsburg et al. 2019), Matplotlib (Hunter 2007), NumPy (Harris et al. 2020), pandas (McKinney 2010), SciPy (Virtanen et al. 2020), seaborn (Waskom 2021).
Appendix A: Other Important Aspects of CSOs
Other important phenomenological aspects of CSOs include the properties of CSOs in the optical, infrared, X-ray, and γ-ray bands; the relationship of CSOs to CSSs and PSs sources; and the cosmological evolution of CSOs. Many of these are beyond the scope of this study, but we include below brief summaries of the situation in other wave bands.
A.1. Optical Properties of CSOs
The complete sample of PR has been observed at Palomar with the 200 inch telescope, and very high-quality spectra have been produced and reduced, including identification of all the emission lines, measurements of the equivalent widths, etc. (Lawrence et al. 1996). The properties of some of the PR CSOs have also been discussed in detail by R96. We clearly need to carry out a study of all the CSOs in the PR sample and to obtain similar-quality spectra for the CSOs in the CJ1 and PW samples. A detailed discussion of the optical spectrum of 2352+495 (J2355+4950) is given in R96, and three other CSOs are discussed in that paper. We have undertaken a program to obtain similar-quality optical spectra of all the CSOs in the PR, CJ1, and PW samples.
A.2. Infrared Properties of CSOs
Heckman et al. (1994) compiled a large sample of radio galaxies and quasars from the IRAS database, which included compact PS/CSS sources. The Fanti et al. (2000) ISO sample of PS/CSS sources included seven bona fide CSOs and two CSO candidates. These observations show no significant differences between the compact radio sources and large-scale radio galaxies. However, CSO sources are definitely a distinct class and not a subset of PS/CSS sources, as we show in Paper II.
High-quality Spitzer IRS spectra for eight bona fide CSOs (z < 0.1) have been presented by Willett et al. (2010). They show that the Polycyclic Aromatic Hydrocarbon (PAH) emission lines are consistent with the presence of a dusty torus and a weak quasar-like nucleus. Additionally, a comparison with the AGN-dominated and starburst-dominated sample of galaxies indicates a mixture of both components present in these CSOs.
The Kosmaczewski et al. (2020) sample of 29 radio sources includes 22 bona fide CSOs and 4 CSO candidates. These authors studied the mid-infrared properties of the host galaxy and AGN component using WISE colors supplemented by the IRAS and Spitzer data. Their main conclusion was that the CSO host galaxies are mainly red ellipticals, some with distorted morphology. In the analysis of the WISE colors, the CSOs seem to be different from the evolved FR II galaxies.
A.3. X-Ray and Gamma-Ray Emitting CSOs
There are only 26 bona fide CSOs that have been studied in X-rays to date. The CSOs are X-ray faint and are not detected in the all-sky X-ray surveys. The studies of their X-ray properties became possible with the Chandra X-ray Observatory (Chandra) and the XMM-Newton mission (Siemiginowska 2009; Migliori 2016) The first high-quality X-ray spectrum of a CSO, OQ 208 (J1407+2827), obtained by XMM-Newton (Guainazzi et al. 2004), indicated that multiple emission and absorption components are present in the unresolved ∼3 kpc central region of the host galaxy. A recent NuSTAR observation of this source gives the first broad energy coverage into the hard X-rays (>10 keV), allowing for good constraints of the primary and scattered emission and the absorption by a high-density porous structure (Sobolewska et al. 2019a).
Small samples of CSOs were observed with XMM-Newton and Chandra (Guainazzi et al. 2006; Vink et al. 2006; Siemiginowska et al. 2008; Tengstrand et al. 2009; Siemiginowska et al. 2016), giving simple detections and the X-ray flux measurements required for longer follow-up observations. Chandra observations provide the highest angular resolution X-ray images, but they cannot resolve the X-ray emission on the scales of the double radio structures contained within <1 kpc. However, X-rays detected on larger scales can probe the host galaxy environment or the presence of the structures potentially linked to the past activity. Chandra observations of PKS 1718−649 (J1723-6500) show the X-rays' diffuse emission extending out to about 2.5 kpc distance from the nucleus and linked to a starburst activity in the central regions of the host galaxy. The X-ray emission originating in the central region of <0.4 kpc could be associated with the accretion flow or compact radio lobes.
Three bona fide CSOs have been detected in γ-rays with Fermi-LAT: PKS 1718−649 (Migliori et al. 2016), TXS 0128+554 (J0131+5545) (Lister et al. 2020) and NGC 3894 (J1148+5924) (Principe et al. 2020). Given the radio morphology of CSOs, γ-rays are predicted to originate in the radio lobes (Stawarz et al. 2008; Principe et al. 2021), and this process was successful in explaining the γ-rays detected in PKS 1718−649 (Sobolewska et al. 2022). However, one interpretation of the radio structure of TXS 0128+554 is that the brightest component, which has a flat spectrum, is the core—and thus more typical of the radio-loud quasars, in which case the core could be the main source of the gamma-rays (Lister et al. 2020). In Paper III, we present an alternative interpretation of the radio structure of TXS 0128+554, in which the brightest component is not the core, and so the core in this alternative interpretation is less likely to be the origin of the gamma-rays. During their recent modeling of the PKS 1718−649 spectral energy distribution, Principe et al. (2021) performed analysis of the Fermi-LAT data for a large sample of PS, CSS, and CSO galaxies and quasars. They concluded that the γ-ray radiation from galaxies is quite faint, and only low-redshift sources could be detected if the radiation is non-beamed.
Appendix B: Table of Bona Fide CSOs
Table 3 lists the 79 bona fide CSOs and their properties. In the following, we list the references corresponding to all index numbers used in Table 3. The references are grouped by the type of value they refer to.
Redshift references: 1 Zensus et al. 2002; 2 Carilli et al. 1998; 3 García-Burillo et al. 2007; 4 Huchra et al. 2012; 5 Morganti et al. 2009; 6 Lawrence et al. 1986; 7 Albareti et al. 2015; 8 Roche et al. 1998; 9 Adelman-McCarthy et al. 2008; 10 Albareti et al. 2017; 11 Ahumada et al. 2020; 12 Lawrence et al. 1996; 13 Peck et al. 2000; 14 de Vries et al. 1995; 15 Caccianiga et al. 2002; 16 Aihara et al. 2011; 17 Ho et al. 1997; 18 Herbig & Readhead 1992; 19 Owen et al. 1995; 20 Vermeulen et al. 1996; 21 Holt et al. 2008; 22 Adelman-McCarthy et al. 2006; 23 Schneider et al. 2010; 24 Falco et al. 1998; 25 Tremblay et al. 2016; 26 Mazzarella et al. 1993; 27 Chavushyan et al. 2001; 28 Labiano et al. 2007; 29 Allison et al. 2014; 30 de Vries et al. 2007; 31 Britzen et al. 2008; 32 Henstock et al. 1997; 33 Fosbury et al. 1987; 34 Stickel & Kuehr 1993; 35 Bartel et al. 1984; 36 Healey et al. 2008; and 37 Nishiura et al. 2000.
All angular sizes have newly been measured in this work for the CSOs listed in Table 1 and 3. The following notes give each reference from which the map for the size measurement was selected and highlights the selected map frequency: 1 1.67 GHz, Dallacasa et al. 2002; 2 4.975 GHz, Peck & Taylor 2000; 3 2.3 GHz, Sokolovsky et al. 2011; 4 15 GHz, MOJAVE—the MOJAVE stacked 15 GHz image shows the largest angular size compared to lower-frequency maps; 5 1.3 GHz, Giroletti et al. 2003; 6 15 GHz, Lister et al. 2020; 7 8.4 GHz, An et al. 2012; 8 1.6 GHz, Dallacasa et al. 2002; 9 8.4 GHz, Gugliucci et al. 2005; 10 5 GHz, Augusto et al. 1998; 11 5 GHz, Augusto et al. 1998; 12 5 GHz, Maness et al. 2004; 13 5 GHz, Taylor & Peck 2003; 14 8.5 GHz, Gugliucci et al. 2005; 15 1.4 GHz, Snellen et al. 2000; 16 5 GHz, Orienti et al. 2004; 17 15 GHz, MOJAVE, 18 5 GHz, Taylor & Peck 2003; 19 5 GHz, Tremblay et al. 2016; 20 5 GHz, Tremblay et al. 2016; 21 1.6 GHz, Dallacasa et al. 2002; 22 5 GHz, Helmboldt et al. 2007; 23 1.4 GHz, Biggs et al. 2016; 24 5 GHz, Cheng et al. 2021; 25 5 GHz, Cheng et al. 2021; 26 5 GHz, Helmboldt et al. 2007; 27 1.6 GHz, Dallacasa et al. 2002; 28 5 GHz, Cheng et al. 2021; 29 GHz, Augusto et al. 2006; 30 5 GHz, Tremblay et al. 2016; 31 2.3 GHz, RFC 2018-03-26; 32 2.3 GHz, RFC 2017-01-16, 33 5 GHz, Helmboldt et al. 2007; 34 2.3 GHz, RFC 2017-08-05, 35 5 GHz, Tremblay et al. 2016; 36 5 GHz, Tremblay et al. 2016; 37 5 GHz, Tremblay et al. 2016; 38 4.99 GHz, Cheng et al. 2021; 39 2.3 GHz, RFC 2014-5-31, 40 5 GHz, Tremblay et al. 2016; 41 2.3 GHz, RFC 2017-06-10, 42 1.4 GHz, Dallacasa et al. 2002; 43 2.3 GHz, Sokolovsky et al. 2011; 44 5 GHz, Tremblay et al. 2016; 45 5 GHz, Tremblay et al. 2016; 46 5 GHz, Tremblay et al. 2016; 475 GHz, Tremblay et al. 2016; 48 1.6 GHz, Orienti & Dallacasa 2014; 49 1.66 GHz, Xiang et al. 2002; 50 2 GHz, RFC 2017-06-15, 51 8.4 GHz, Wang et al. 2003; 52 5 GHz, Yan et al. 2016; 53 5 GHz, Helmboldt et al. 2007; 54 1.6 GHz, Dallacasa et al. 1995; 55 1.6 GHz, Dallacasa et al. 2002; 56 5 GHz, Tremblay et al. 2016; 57 1.6 GHz, Dallacasa et al. 2002; 58 5 GHz, Kunert-Bajraszewska et al. 2010; 59 5 GHz, Xiang et al. 2006; 60 5 GHz, Tremblay et al. 2016; 61 1.6 GHz, de Vries et al. 2009; 62 2.2 GHz, Nagai et al. 2006; 63 5 GHz, Tremblay et al. 2016; 64 4.9 GHz, Tingay et al. 2002; 65 2.3 GHz, Sokolovsky et al. 2011; 66 8.4 GHz, Xiang et al. 2002; 67 8.5 GHz, Gugliucci et al. 2005; 68 4.8 GHz, Gugliucci et al. 2007; 69 1.65 GHz, Liu et al. 2007; 70 4.8 GHz, Gugliucci et al. 2007; 71 5 GHz, Augusto et al. 1998; 72 8.4 GHz, Ojha et al. 2004; 73 1.6 GHz, Murgia 2003; 74 8 GHz, Peck et al. 1999; 75 2.3 GHz, Sokolovsky et al. 2011; 76 8.42 GHz, Orienti et al. 2006; 77 1.4 GHz, Momjian et al. 2003; 78 2.3 GHz, Sokolovsky et al. 2011; 79 0.6 GHz, Readhead et al. 1996.
Turnover frequency and flux density references: 1 Estimated by the authors from RFC spectrum; 2 Estimated by authors from NED spectrum; 3 Jeyakumar 2016; 4 Sotnikova et al. 2019; 5 An & Baan 2012; 6 Lister et al. 2020; 7 Marecki et al. 1999; 8 Callingham et al. 2017; 9 Labiano et al. 2007; 10 Xiang et al. 2006; 11 Snellen et al. 2004; 12 Gugliucci et al. 2007.
X-ray detection references: 1 Guainazzi et al. 2006; 2 Sobolewska et al. 2019b; 3 Vink et al. 2006; 4 Green et al. 2009; 5 Siemiginowska et al. 2016; 6 Lister et al. 2020; 7 Lister et al. 2020; 8 Romani et al. 2014; 9 She et al. 2017; 10 Younes et al. 2010; 11 Tengstrand et al. 2009; 12 Siemiginowska et al. 2008; 13 Siemiginowska 2009; 14 Tengstrand et al. 2009; 15 Guainazzi et al. 2004; 16 Sobolewska et al. 2019a; 17 Evans et al. 2010; 18 Beuchert et al. 2018.
γ-ray detection references: 1 Lister et al. 2020; 2 Lott et al. 2020; 3 Principe et al. 2021; 4 Gu et al. 2022; 5 Principe et al. 2020; 6 Migliori et al. 2016; 7 Ajello et al. 2020.
CSO and CSO candidate references: 1 Peck & Taylor 2000; 2 Dallacasa et al. 2002; 3 Gugliucci et al. 2005; 4 Augusto et al. 2006; 5 Gugliucci et al. 2007; 6 Tyul'Bashev 2009; 7 Marr et al. 2014; 8 Readhead et al. 1996; 9 Taylor et al. 1996a; 10 Augusto 1996; 11 Conway 1997; 12 Augusto et al. 1998; 13 Giovannini et al. 2005; 14 Liuzzo et al. 2009; 15 Willett et al. 2010; 16 Lister et al. 2020; 17 An et al. 2012; 18 Orienti et al. 2007; 19 Maness et al. 2004; 20 Taylor & Peck 2003; 21 Snellen et al. 2000; 22 Tremblay et al. 2016; 23 Helmboldt et al. 2007; 24 Taylor et al. 2005; 25 Biggs et al. 2016; 26 Fanti et al. 2011; 27 Bondi et al. 1998; 28 Xiang et al. 2005; 29 Xiang et al. 2006; 30 Principe et al. 2020; 31 Orienti & Dallacasa 2014; 32 Xiang et al. 2002; 33 Stanghellini 2003; 34 Yan et al. 2016; 35 Jeong et al. 2016; 36 Nagai et al. 2006; 37 Angioni et al. 2019; 38 Stanghellini et al. 1999; 39 Orienti et al. 2006; 40 Peck et al. 1999; 41 Peck & Taylor 2001; 42 Taylor et al. 2009; 43 Tschager et al. 1999; 44 Tschager et al. 2000; 45 Araya et al. 2010.
Footnotes
- 9
- 10
In this paper, we follow the lead of O'Dea & Saikia (2021) in their comprehensive review of peaked spectrum sources, and refer to gigahertz-peaked spectrum (GPS) sources as peaked spectrum (PS) sources.
- 11
- 12
- 13
- 14
- 15
- 16