


Abstract
We present an ALMA-Herschel joint analysis of sources detected by the ALMA Lensing Cluster Survey (ALCS) at 1.15 mm. Herschel/PACS and SPIRE data at 100–500 μm are deblended for 180 ALMA sources in 33 lensing cluster fields that are detected either securely (141 sources; in our main sample) or tentatively at S/N ≥ 4 with cross-matched HST/Spitzer counterparts, down to a delensed 1.15 mm flux density of ∼0.02 mJy. We performed far-infrared spectral energy distribution modeling and derived the physical properties of dusty star formation for 125 sources (109 independently) that are detected at >2σ in at least one Herschel band. A total of 27 secure ALCS sources are not detected in any Herschel bands, including 17 optical/near-IR-dark sources that likely reside at z = 4.2 ± 1.2. The 16th, 50th, and 84th percentiles of the redshift distribution are 1.15, 2.08, and 3.59, respectively, for ALCS sources in the main sample, suggesting an increasing fraction of z ≃ 1 − 2 galaxies among fainter millimeter sources (f1150 ∼ 0.1 mJy). With a median lensing magnification factor of  , ALCS sources in the main sample exhibit a median intrinsic star formation rate of
  M⊙ yr−1, lower than that of conventional submillimeter galaxies at similar redshifts by a factor of ∼3. Our study suggests weak or no redshift evolution of dust temperature with LIR < 1012 L⊙ galaxies within our sample at z ≃ 0 − 2. At LIR > 1012 L⊙, the dust temperatures show no evolution across z ≃ 1–4 while being lower than those in the local universe. For the highest-redshift source in our sample (z = 6.07), we can rule out an extreme dust temperature (>80 K) that was reported for MACS0416 Y1 at z = 8.31.
Export citation and abstract BibTeX RIS

Original content from this work may be used under the terms of the Creative Commons Attribution 4.0 licence. Any further distribution of this work must maintain attribution to the author(s) and the title of the work, journal citation and DOI.
1. Introduction
In massive star-forming galaxies (SFGs) at cosmological distances, a large fraction of star formation is found to be obscured by dust (e.g., Ivison et al. 1998; Heinis et al. 2014; Whitaker et al. 2017; Fudamoto et al. 2020). Observations at far-IR (FIR) wavelengths directly sample the thermal continuum emission from dust grains in the interstellar medium, a reliable tracer of recent star formation activity (e.g., Kennicutt & Evans 2012). With the high sensitivity and spatial resolution of Atacama Large Millimeter/submillimeter Array (ALMA), submillimeter galaxies (SMGs; or dusty SFGs, as they are often called) have been studied up to a redshift of 6.9 (Strandet et al. 2017; Marrone et al. 2018), and dust continuum emission from Lyman break galaxies has also been revealed up to a redshift of 8.3 (e.g., Tamura et al. 2019; Bakx et al. 2020). ALMA studies of dust-obscured star formation, combined with observations obtained at rest-frame UV/optical wavelengths (e.g., with Hubble Space Telescope (HST)), provide a comprehensive picture on galaxy formation and evolution across the past 13 Gyr (e.g., Bouwens et al. 2020; see a recent review by Hodge & da Cunha 2020).
In order to discover and study the physical properties of SMGs that are intrinsically faint (0.01–1 mJy around 1 mm wavelength), the effect of gravitational lensing has been widely utilized, which allowed the first detection of SMGs (Smail et al. 1997). The ALMA Lensing Cluster Survey (ALCS) is an ALMA Cycle 6 large program (PI: Kohno; Kohno 2019; K. Kohno et al. 2022, in preparation) dedicated to surveying intrinsically faint continuum sources and line emitters with the assistance of gravitational lensing. By surveying a total image-plane sky area of ∼134 arcmin2 (primary-beam response greater than 0.3) down to a depth of 0.07 mJy beam−1 (1σ), ALCS aimed to detect >100 continuum sources at ≥5σ significance at 1.15 mm. ALCS has an effective survey area of ∼10 arcmin2 for sources brighter than 0.1 mJy at 1.15 mm (>5σ; lensing corrected). This is the largest survey obtained with ALMA Band 6 at comparable depth so far. The detected continuum sources can then be used to examine the origin of cosmic infrared background, measure the [C ii] luminosity function in the epoch of reionization (Fujimoto et al. 2021), and constrain the evolution of gas and dust content of galaxies around the peak of cosmic star formation history.
All 33 cluster fields were selected from the best-studied clusters primarily from the Abell (Abell 1958; Abell et al. 1989) and MACS (Ebeling et al. 2001) catalogs that have been observed with HST Treasury Programs, including Cluster Lensing And Supernova survey with Hubble (CLASH, 12 clusters; PI: Postman; Postman et al. 2012), Hubble Frontier Fields (HFF, 5 clusters; PI: Lotz; Lotz et al. 2017), and Reionization Lensing Cluster Survey (RELICS, 16 clusters; PI: Coe; Coe et al. 2019). These survey programs utilized both the Advanced Camera for Surveys and Wide Field Camera 3 (WFC3) to obtain deep and high-resolution images of massive galaxy clusters at z = 0.2 − 0.9 from the optical to near-IR (NIR). Combined with Spitzer/IRAC coverage of at least medium depth (the median 5σ depth at 4.5 μm is 23.3 ± 0.1 AB mag; Sun et al. 2021a), these HST data provide direct constraints on unobscured or mildly obscured stellar components both in the environment of the massive galaxy cluster and in gravitationally lensed galaxies in the distant universe.
The ALCS fields were also observed by the Herschel Space Observatory (Pilbratt et al. 2010) in the wavelength range from 100 to 500 μm. Launched in 2009 and retired in 2013, Herschel was designed to study the dust-obscured universe at submillimeter wavelengths. Herschel data are critical for the interpretation of the ALCS fields owing to its unique wavelength coverage of thermal dust continuum of high-redshift (z ≳ 1) galaxies. Herschel and ALMA observations both detect thermal emissions from dust heated by the UV radiation from young stars. With a good sampling of FIR spectral energy distributions (SEDs) with four to six bands in total, ALMA and Herschel data provide critical constraints on photometric redshifts, thermal dust temperature, and dust mass of ALCS-selected galaxies.
Herschel data of the ALCS clusters were obtained through various programs. Among them, the Herschel Lensing Survey (HLS; Egami et al. 2010; Sun et al. 2021b) is the largest program imaging the fields of massive galaxy clusters to study cluster-lensed high-redshift galaxies. Deep Herschel observations in blank fields are often subject to confusion noise (Nguyen et al. 2010). This restricts the detection of typical ultraluminous infrared galaxies (ULIRGs; LIR ≥ 1012 L⊙) beyond z ∼ 2 (see Rawle et al. 2016). However, with the lensing magnification by massive clusters, which typically do not contain FIR-bright galaxies in the cluster core (e.g., Rawle et al. 2012), we are able to break the confusion limit and discover intrinsically faint sources (Smail et al. 1997). This has been demonstrated by the Herschel detection of the z = 2.8 LIRG (LIR = 1011 − 1012 L⊙) behind the Bullet Cluster with a lensing magnification of μ ∼ 75 (Rex et al. 2010). With cluster lensing, Sklias et al. (2014) and Dessauges-Zavadsky et al. (2015) explored the star formation history, dust extinction, and molecular gas content of LIRGs at z ≃ 1.5 − 3, and recent ALMA observations of cluster-lensed Herschel sources revealed the existence of low surface brightness SMGs with extended dust continua (Sun et al. 2021b).
In this work, we present the ALMA-Herschel joint analysis of the dusty SFGs detected by ALCS. Similar work has been presented in Rawle et al. (2016, hereafter R16) for the six HFF clusters, and here we expand the sample to 28 more cluster fields and use high-resolution (∼1'') ALMA continuum maps as priors for source extraction, in contrast to the mid-IR (MIR) priors (Spitzer and WISE) used in R16. Because of the well-known negative K-correction, the selection function of SMGs at millimeter wavelengths is nearly constant in terms of cold dust mass across z ≃ 1 − 6. Therefore, compared with R16, the use of ALMA priors allows more extensive and accurate measurements of Herschel flux densities of sources at higher redshifts (z > 2), constraining the redshift distribution, dust temperatures, and star formation rates (SFRs) of millimeter sources toward the faint end (f1150 ∼ 0.02 mJy).
This paper is arranged as follows: In Section 2, we introduce the sample discovered by the ALCS (which will be described in greater detail by S. Fujimoto et al. 2022, in preparation) and the obtained Herschel data, together with the data reduction techniques. Section 3 presents the procedure for source extraction using the Herschel data. Section 4 presents the FIR SED fitting and photometric redshift estimate. Section 5 presents the analysis of lensing magnification and uncertainty. In Section 6, we discuss the statistical results of galaxy properties and their implications. The summary can be found in Section 7. Throughout this work, we assume a flat ΛCDM cosmology with h = 0.7 and Ωm = 0.3. We define the IR luminosity (LIR) as the integrated luminosity over a rest-frame wavelength range from 8 to 1000 μm.
2. Observations and Data Reduction
2.1. ALMA Data and the Sample
All of the sources in this work are selected with the ALCS, which will be detailed in S. Fujimoto et al. (2022, in preparation). ALMA Band 6 observations for the 33 clusters were conducted through Program 2018.1.00035.L (ALCS; PI: Kohno), and we also combined archival data from Programs 2013.1.00999.S and 2015.1.01425.S (ALMA Frontier Fields; PI: Bauer; González-López et al. 2017). The list of the ALCS clusters with their coordinates, short names (e.g., M0553 for MACS J0553.4–3342), and HST program names is presented in Table 1. The observations were obtained at a central wavelength of 1.15 mm with a 15 GHz total bandwidth (i.e., two tunings of dual polarization: 250.0–257.5 GHz and 265.0–272.5 GHz). The use of two tunings instead of one allows us to search for line-emitting galaxies over a larger volume, which is another important science goal of ALCS. This, for example, led to the serendipitous discovery of a [C ii] emitter at z = 6.072 (Fujimoto et al. 2021). All the ALMA data were reduced with casa (McMullin et al. 2007), with different pipelines versions for observations obtained in different cycles (e.g., v5.4.0 for 26 clusters observed in Cycle 6 and v5.6.1 for the remaining clusters in Cycle 7). Natural-weighting continuum imaging was performed at both the native (FWHM ∼ 1'') and uv-tapered (∼2'') resolutions with the casa tclean algorithm.
Table 1. Summary of Herschel Observations for 33 ALCS Galaxy Cluster Fields
| Cluster Name | Group a | Coordinates | Short Name | Herschel/PACS 100/160 μm | Herschel/SPIRE 250/350/500 μm | |||
|---|---|---|---|---|---|---|---|---|
| R.A. | Decl. | Observation ID | tobs (hr) b | Observation ID | tobs (s) b | |||
| 18 HLS-"deep" clusters: | ||||||||
| A209 | CLASH | 01:31:52.5 | −13:36:38 | A209 | 134218841[8,9] | 4.28 | 1342188581 | 5803 |
| A383 | CLASH | 02:48:03.3 | −03:31:44 | A383 | 134218915[1,2] | 4.28 | 1342189503 | 5803 |
| MACS J0329.7–0211 | CLASH | 03:29:41.6 | −02:11:47 | M0329 | 134224928[0,1] | 4.28 | 13422[14564,39844] | 1580 |
| MACS J0429.6–0253 | CLASH | 04:29:36.1 | −02:53:08 | M0429 | 1342250[641,836] | 4.28 | 13422[39932,41124] | 1580 |
| MACS J1115.9+0129 | CLASH | 11:15:52.0 | 01:29:56 | M1115 | 13422476[72,91] | 4.28 | 13422[23226,56866] | 1580 |
| MACS J1206.2–0847 | CLASH | 12:06:12.2 | −08:48:02 | M1206 | 134225745[5,6] | 4.28 | 13422[34856,47273] | 1580 |
| MACS J1311.0–0310 | CLASH | 13:11:01.6 | −03:10:39 | M1311 | 13422486[26,56] | 4.28 | 13422[34800,59416] | 1580 |
| RX J1347–1145 | CLASH | 13:47:30.5 | −11:45:10 | R1347 | 134221383[6,7] | 5.23 | 13422[01256–63,47859–61] | 12728 |
| MACS J1423.8+2404 | CLASH | 14:23:47.7 | 24:04:40 | M1423 | 134218821[5,6] | 5.47 | 1342188159 | 6636 |
| MACS J1931.8–2635 | CLASH | 19:31:49.6 | −26:34:34 | M1931 | 13422416[19,81] | 4.28 | 13422[15993,54639] | 1580 |
| MACS J2129.4–0741 | CLASH | 21:29:26.2 | −07:41:26 | M2129 | 134218780[1,2] | 5.47 | 1342195710 | 5786 |
| RX J2129.7+0005 | CLASH | 21:29:39.9 | 00:05:18 | R2129 | 134218725[6,7] | 5.32 | 1342188167 | 6636 |
| A2744 | HFF | 00:14:21.2 | −30:23:50 | A2744 | 134218825[1,2] | 5.47 | 1342188584 | 5803 |
| A370 | HFF | 02:39:52.9 | −01:34:36 | A370 | 134222333[2,3] | 5.23 | 13422[01311–18,48002–04] | 12728 |
| MACS J0416.1–2403 | HFF | 04:16:08.9 | −24:04:28 | M0416 | 134225029[1,2] | 4.28 | 13422[39858,41122] | 1580 |
| MACS J1149.5+2223 | HFF | 11:49:36.3 | 22:23:58 | M1149 | 134221179[7,8] | 4.28 | 1342222841 | 5786 |
| AS1063 | HFF | 22:48:44.4 | −44:31:48 | AS1063 | 134218822[2,3] | 5.47 | 1342188165 | 6636 |
| A2537 | RELICS | 23:08:22.2 | −02:11:32 | A2537 | 1342187[799,800] | 5.47 | 1342188179 | 6636 |
| 15 HLS-"snapshot" clusters: | ||||||||
| RXC J0032.1+1808 | RELICS | 00:32:11.0 | 18:07:49 | R0032 | ⋯ | ⋯ | 1342234685 | 169 |
| MACS J0035.4–2015 | RELICS | 00:35:26.9 | −20:15:40 | M0035 | ⋯ | ⋯ | 1342234697 | 169 |
| ACTCL J0102–49151 | RELICS | 01:03:00.0 | −49:16:22 | ACT0102 | ⋯ | ⋯ | 1342258408 | 169 |
| MACS J0159.8–0849 | RELICS | 01:59:49.4 | −08:50:00 | M0159 | ⋯ | ⋯ | 1342237535 | 169 |
| AS295 | RELICS | 02:45:31.3 | −53:02:24 | AS295 | ⋯ | ⋯ | 1342236215 | 169 |
| MACS J0257.1–2325 | RELICS | 02:57:10.2 | −23:26:11 | M0257 | ⋯ | ⋯ | 1342214559 | 169 |
| PLCK G171.9–40.7 | RELICS | 03:12:56.9 | 08:22:19 | P171 | ⋯ | ⋯ | 1342239833 | 169 |
| A3192 | RELICS | 03:58:53.0 | −29:55:44 | A3192 | ⋯ | ⋯ | 1342239861 | 169 |
| MACS J0417.5–1154 | RELICS | 04:17:33.7 | −11:54:22 | M0417 | ⋯ | ⋯ | 1342239855 | 169 |
| MACS J0553.4–3342 | RELICS | 05:53:23.0 | −33:42:29 | M0553 | ⋯ | ⋯ | 1342227700 | 169 |
| RXC J0600.1–2007 | RELICS | 06:00:09.7 | −20:08:08 | R0600 | ⋯ | ⋯ | 1342230801 | 169 |
| SMACS J0723.3–7327 | RELICS | 07:23:19.4 | −73:27:15 | SM0723 | ⋯ | ⋯ | 1342229668 | 169 |
| RXC J0949.8+1707 | RELICS | 09:49:50.8 | 17:07:15 | R0949 | ⋯ | ⋯ | 1342246604 | 169 |
| A2163 | RELICS | 16:15:48.3 | −06:07:36 | A2163 | ⋯ | ⋯ | 1342229566 | 169 |
| RXC J2211.7–0350 | RELICS | 22:11:45.9 | −03:49:44 | R2211 | ⋯ | ⋯ | 1342211362 | 169 |
Notes. Clusters with Herschel/PACS data are considered as observed in the "deep" mode, and the remaining ones are considered as observed in the "snapshot" mode (see Section 2.3). Herschel observation IDs in brackets indicate the difference in the last few digits, for example, the SPIRE data of A370 were taken with observation IDs 1342201311–1342201318 and 1342248002–1342248004.
a Group name of HST Program. b Total scan time of all observations.Download table as: ASCIITypeset image
Through a peak pixel identification routine of SExtractor (Bertin & Arnouts 1996) with the ALMA maps at both the native and 2''-tapered resolutions (before primary-beam correction), we securely detected 141 sources that are at either (i) signal-to-noise ratio S/Nnat ≥ 5 in the native-resolution maps or (ii) S/Ntap ≥ 4.5 in the 2''-tapered maps, over an area of ∼134 arcmin2 with primary-beam response greater than 0.3 (S. Fujimoto et al. 2022, in preparation). Based on the number count of negative peaks, the number of spurious sources above these S/N cuts is expected to be around 1. We further refer to these 141 secure ALCS sources as the main sample.
A total of 258 sources were tentatively detected at (i) S/Nnat = 4 − 5 in the native-resolution maps and (ii) S/Ntap < 4.5 in the 2''-tapered maps, down to a minimal flux density of ∼0.2 mJy at 1.15 mm. Based on HST and Spitzer/IRAC images, we identified 39 of these sources with NIR/MIR counterparts within a separation of 1''. Given the high source densities in cluster fields (∼0.06 arcsec−2 in the HST/F160W band; Sun et al. 2021a), we expect 7 ± 3 pairs of random associations among these tentative ALCS sources and cross-matched NIR/MIR counterparts. Assuming that the majority of these HST/Spitzer-matched sources are real, we note that the number found is consistent with the number difference between positive and negative peaks in the ALMA maps in this S/N range (37 in total). We further refer to these 39 tentative ALCS sources as the secondary sample, but we warn that 18% ± 8% of these sources are likely to be false matched.
We note that the continuum S/N of ALCS sources could be boosted by serendipitous emission-line detections, for example, CO (5–4) line at z = 1.11 − 1.17 and 1.24 − 1.31 (e.g., M0553-ID133/190/249 at z = 1.142; Ebeling et al. 2017; Sun et al. 2021b). All the line emitters will be reported by a future paper of the collaboration. However, because of the large bandwidth (15 GHz), the CO line contamination to continuum S/N and flux density is limited to ≲1%–10%. In addition, ALCS can only sample faint high-J CO lines (upper J number at ≥ 7) for sources at z ≳ 2. According to the CO spectral line energy distribution (SLED) of high-redshift SMGs reported in the literature (e.g., Greve et al. 2014; Béthermin et al. 2016; Yang et al. 2017; Birkin et al. 2021), even the high-J CO SLED is as flat as those reported for local active-galactic-nucleus-host (AGN-host) galaxies (e.g., Rosenberg et al. 2015), and the CO contamination will be ∼1%–10% at most. Only one [C ii] emitter was found among all continuum sources (Fujimoto et al. 2021; Laporte et al. 2021), and the continuum flux density of this source was measured on a line-subtracted continuum image.
2.2. Herschel/PACS
The Photodetector Array Camera and Spectrometer (PACS; Poglitsch et al. 2010) on Herschel enabled simultaneous observations at 160 μm (red channel) with the long-wavelength camera and at either 70 or 100 μm (blue/green channel) with the short-wavelength camera. Eighteen out of the 33 clusters were imaged with PACS at both 100 and 160 μm, and two clusters were also observed with PACS at 70 μm (M1149 and AS1063). The analysis of PACS 70 μm data in these cluster fields has been presented by R16, and the only two matched sources are AS1063-ID17 (z = 1.44, f70 = 7.3 ± 0.9 mJy) and AS1063-ID147 (z = 0.610, f70 = 28.8 ± 2.3 mJy; analyzed in detail by Walth et al. 2019).
A total of 16 out of the 18 clusters were observed by PACS as part of the HLS (Egami et al. 2010; Sun et al. 2021b), which combines an Open-Time Key Program (KPOT; program ID: KPOT_eegami_1; nine clusters) and an Open-Time Cycle 2 (OT2; program ID: OT2_eegami_5; seven clusters) Program (both PI: Egami). The remaining two clusters, namely, A370 and RX J1347–1145, were observed as part of the PACS Evolutionary Probe (PEP; program ID: KPGT_dlutz_1, PI: Lutz; Lutz et al. 2011). All of the PACS 100 and 160 μm observations consist of two orthogonal scan maps, each comprising 18–22 repetitions of 13 parallel 4' scan legs. The summary of the PACS observations, including the observation IDs and total scan time for each cluster, is presented in Table 1.
We followed the same data reduction procedure as detailed in R16 for the HFF clusters. The PACS images were generated with UniMap (Piazzo et al. 2015) with a pixel scale of 1 0 at 100 μm and 20 at 160 μm. The final PACS image products have a typical field of view (FOV) with a radius of ∼4', covering the full ALMA footprints of the 18 clusters. The typical beam sizes are 74 and 114 at 100 and 160 μm, and the depths of the PACS data at the cluster center are presented in Table 2.
Table 2. Summary of Median 1σ Depth of Prior-based Herschel Catalogs within the ALCS Footprints
| Cluster Name | N(main) a | PACS 100 μm | PACS 160 μm | SPIRE 250 μm | SPIRE 350 μm | SPIRE 500 μm |
|---|---|---|---|---|---|---|
| (mJy) | (mJy) | (mJy) | (mJy) | (mJy) | ||
| A209 | 1 | ⋯(1.5) | ⋯(3.0) | ⋯(5.0) | ⋯(5.1) | ⋯(5.7) |
| A383 | 1 | 0.6 (1.5) | 1.8 (2.9) | 2.8 (5.5) | 2.7 (5.1) | ⋯(5.9) |
| MACS J0329.7–0211 | 1 | 0.5 (1.4) | ⋯(2.8) | ⋯(7.1) | ⋯(6.8) | ⋯(7.5) |
| MACS J0429.6–0253 | 3 | 0.6 (1.4) | 1.0 (2.9) | 3.3 (7.5) | ⋯(6.9) | ⋯(8.0) |
| MACS J1115.9+0129 | 4 | 0.8 (1.4) | 0.8 (2.9) | 3.2 (7.8) | 4.3 (6.5) | 3.9 (7.1) |
| MACS J1206.2–0847 | 6 | 0.5 (1.4) | 1.7 (3.1) | 15.5 (8.6) | 2.2 (7.5) | 4.4 (8.2) |
| MACS J1311.0–0310 | 2 | 0.5 (1.4) | 1.3 (2.8) | 3.2 (7.4) | 2.7 (6.5) | 2.6 (7.2) |
| RX J1347–1145 | 6 | 0.5 (1.3) | 0.7 (2.4) | 2.4 (4.3) | 6.7 (4.3) | 2.0 (5.2) |
| MACS J1423.8+2404 | 2 | 0.6 (1.5) | 1.3 (2.9) | 3.4 (5.0) | 3.0 (5.0) | 2.3 (5.6) |
| MACS J1931.8–2635 | 4 | 1.0 (1.4) | 1.2 (2.8) | 2.8 (7.0) | 3.0 (6.5) | 3.0 (7.2) |
| MACS J2129.4–0741 | 2 | 0.5 (1.5) | 0.8 (3.4) | 2.1 (6.8) | 2.9 (6.9) | ⋯(6.9) |
| RX J2129.7+0005 | 2 | ⋯(1.3) | 1.1 (3.1) | 3.2 (5.5) | ⋯(5.7) | 4.1 (6.1) |
| A2744 | 6 | 0.9 (1.5) | 1.5 (3.0) | 2.4 (5.1) | 3.3 (5.4) | 2.8 (5.8) |
| A370 | 5 | 0.5 (1.3) | 1.3 (2.8) | 2.8 (5.0) | 3.2 (5.3) | 2.2 (6.2) |
| MACS J0416.1–2403 | 4 | 0.5 (1.4) | 0.8 (2.7) | 2.7 (7.0) | 1.9 (6.0) | 1.7 (7.3) |
| MACS J1149.5+2223 | 1 | 0.9 (1.5) | 3.2 (3.0) | 2.1 (5.4) | 2.2 (4.9) | 3.5 (5.6) |
| AS1063 | 4 | 0.9 (1.4) | 0.8 (2.3) | 3.3 (5.5) | 5.0 (5.6) | 3.2 (6.4) |
| A2537 | 2 | 1.5 (1.5) | 2.2 (3.1) | 3.2 (5.9) | 4.0 (6.1) | 2.6 (6.0) |
| RXC J0032.1+1808 | 17 | ⋯ | ⋯ | 4.5 (14.4) | 6.4 (16.6) | 4.8 (16.9) |
| MACS J0035.4–2015 | 2 | ⋯ | ⋯ | 3.6 (10.7) | ⋯(11.6) | ⋯(12.9) |
| ACTCL J0102–49151 | 12 | ⋯ | ⋯ | 4.7 (11.8) | 4.8 (11.7) | 5.0 (15.7) |
| MACS J0159.8–0849 | 4 | ⋯ | ⋯ | 4.5 (11.1) | 4.1 (12.0) | 5.2 (13.7) |
| AS295 | 0 | ⋯ | ⋯ | ⋯(11.7) | ⋯(12.4) | ⋯(15.2) |
| MACS J0257.1–2325 | 1 | ⋯ | ⋯ | 4.4 (11.8) | 4.5 (11.8) | 4.7 (15.3) |
| PLCK G171.9–40.7 | 3 | ⋯ | ⋯ | 5.1 (12.3) | ⋯(12.8) | ⋯(13.7) |
| A3192 | 4 | ⋯ | ⋯ | 4.4 (11.1) | 4.7 (12.1) | 4.6 (14.1) |
| MACS J0417.5–1154 | 7 | ⋯ | ⋯ | 4.7 (10.9) | 5.7 (13.0) | 5.2 (15.2) |
| MACS J0553.4–3342 | 13 | ⋯ | ⋯ | 4.5 (10.6) | 4.6 (11.7) | 6.1 (14.5) |
| RXC J0600.1–2007 | 4 | ⋯ | ⋯ | 4.4 (11.5) | 5.6 (12.4) | ⋯(13.8) |
| SMACS J0723.3–7327 | 2 | ⋯ | ⋯ | ⋯(12.2) | ⋯(13.2) | ⋯(15.5) |
| RXC J0949.8+1707 | 4 | ⋯ | ⋯ | 5.0 (12.0) | 5.3 (12.1) | 5.7 (14.6) |
| A2163 | 0 | ⋯ | ⋯ | ⋯(11.1) | ⋯(10.9) | ⋯(13.8) |
| RXC J2211.7–0350 | 3 | ⋯ | ⋯ | 5.0 (12.5) | 6.3 (12.6) | 6.9 (14.4) |
Notes. Values in parentheses are rms noises directly measured from 2D Herschel uncertainty maps within the ALCS footprints (i.e., without any dedicated positional prior; Section 3.3).
a Number of ALMA sources in the main sample (S/Nnat ≥ 5 in the native-resolution maps, or S/Nnat ≥ 4.5 in the 2''-tapered maps).Download table as: ASCIITypeset image
2.3. Herschel/SPIRE
The Spectral and Photometric Imaging Receiver (SPIRE; Griffin et al. 2010) on Herschel worked simultaneously at 250, 350, and 500 μm. All 33 clusters were imaged with SPIRE in two observing modes with different depths. The 18 clusters also observed with PACS were scanned with SPIRE in the "deep" mode down to confusion-limited depths (RMSmap ∼ 6 mJy beam−1 at 250 μm; measured as the noise of sky background after sources being filtered out), and the remaining 15 clusters were observed in the "snapshot" mode with a shorter scan duration and thus at shallower depths (RMSmap ∼ 11 mJy beam−1; as visualized in Figure 1).

Figure 1. Median rms noise of SPIRE pixels (RMSmap; measured as the noise of sky background after sources being filtered out) at 250 μm within the footprints of 33 ALCS clusters. A total of 18 clusters were observed with Herschel in the "deep" mode (in blue), and they have deep SPIRE images (RMSmap < 9 mJy beam−1), as well as PACS ones. The remaining 15 clusters were observed in the "snapshot" mode (in orange), and they have shallower SPIRE data (RMSmap > 9 mJy beam−1; see Section 2.3) with no PACS coverage. The number of main-sample ALCS sources in each cluster field is noted at the bottom of each bar.
Download figure:
Standard image High-resolution imageAmong the total 18 clusters in the "deep" mode, 16 of them were observed as part of the HLS. Observations of the nine clusters through KPOT_eegami_1 consisted of 20 repetitions in the large scan map mode, each with two 4' scans and cross-scans (total scan time as tscan ∼ 1.7 hr per cluster). The other seven clusters observed through Open-Time Cycle 1/2 Programs (OT1_eegami_4 and OT2_eegami_5; both PI: Egami) were imaged through 11-repetition small scan maps (1 in OT1 and 10 in OT2), and each repetition consisted of one scan and one cross-scan of 4' length (tscan ∼ 0.4 hr per cluster). The remaining two clusters, A370 and R1347, were observed as part of the Herschel Multi-tiered Extragalactic Survey (HerMES; program ID: KPGT_soliver_1; PI: Oliver; Oliver et al. 2012). Both of these clusters were observed with eight small scan maps (six repetitions per each covering the cluster core) and three large scan maps (one repetition per each with 38' length covering a wider area), and the total scan time is 3.5 hr per cluster. The final SPIRE map products of these two clusters have a wider FOV, but the central depths are comparable to those of the HLS data.
All of the 15 clusters in the "snapshot" mode were observed as part of the HLS through single-repetition small scan maps, and each repetition consisted of one scan and one cross-scan of a 4' length ( per cluster). Fourteen of them were observed by the OT1 program OT1_eegami_4, and the remaining one was observed by the OT2 program OT2_eegami_6 (PI: Egami).
Table 1 summarizes the IDs and total scan times of all the SPIRE observations. All of the SPIRE data were processed by the standard reduction pipeline in HIPE v12.2 (Ott 2010), which is also detailed in R16. The output pixel sizes of the final image products are 6'', 9'', and 12'' at 250, 350, and 500 μm. The typical radii of the SPIRE FOVs are 7' for the 15 clusters observed in the "snapshot" mode, 8' for the seven clusters observed in OT1/2, 11' for the nine clusters observed in KPOT, and 33' for A370 and R1347. The full survey area of the ALCS was covered by these SPIRE images. The typical beam sizes are 18'', 24'', and 35'' in these three bands, and the depths of the SPIRE data at the cluster center are presented in Table 2.
2.4. Ancillary HST and Spitzer Data
For the purpose of enhancing the astrometric accuracy of Herschel data, we include the Spitzer/IRAC data of these 33 cluster fields in our analysis obtained from the NASA/IPAC Infrared Science Archive (IRSA 37 ). We also include the HST data of all the cluster fields but only for comparing the positions of dust continuum sources with the stellar components. We defer the study of optical/NIR counterparts and panchromatic SED modeling of ALCS sources to another paper from the collaboration.
2.5. Redshift Catalogs
To supply accurate redshifts for FIR SED modeling (Section 4), we cross-matched the ALCS source sample with the spectroscopic redshift (zspec) catalogs made available by the CLASH-VLT spectroscopic survey (Biviano et al. 2013), Grism Lens-Amplified Survey from Space (GLASS; Schmidt et al. 2014; Treu et al. 2015; Wang et al. 2015) and recent Very Large Telescope/MUSE surveys of massive cluster fields by Caminha et al. (2019) and Richard et al. (2021). A maximum separation of 15 is allowed for cross-matching, which is comparable to the FWHM of the IRAC point-spread function (PSF). We also include redshifts for a few sources reported by various studies in the literature (e.g., M0553 triply lensed system at z = 1.14; Ebeling et al. 2017) or private communication (e.g., M0417-ID46/58/121, an HST H-faint triply lensed system at z = 3.65; K. Kohno et al. 2022, in preparation). In addition, we also include two ALMA-HFF sources reported by Laporte et al. (2017), with their zspec values derived from the GLASS detection of the 4000 Å break, and a triply lensed ALCS source system that belongs to a MUSE-confirmed galaxy group at z = 4.32 (Caputi et al. 2021). Spectroscopic redshifts are available for 60 ALCS sources in both the main and secondary samples.
We also utilized the HST photometric redshift (zphot) catalogs of optical/NIR sources tabulated by CLASH (Molino et al. 2017), HFF (Shipley et al. 2018), and RELICS (Coe et al. 2019) groups. Sources are cross-matched by their coordinates, and a maximum separation of 15 is allowed. Fujimoto et al. (2016) reported a median offset of 025 between the HST and ALMA centroids of ALMA sources, and such an observed offset could be larger in cluster fields because of the lensing magnification. We also apply visual inspections of the HST F814W, F105W, and F160W images to remove any conspicuous mismatch. We identified cataloged HST zphot measurements for 125 ALCS sources in both the main and secondary samples, including 49 sources with additional spectroscopic redshifts.
3. Herschel Source Extraction
3.1. Preparation
3.1.1. Image Alignment
Following R16, we first aligned all the Herschel images to the IRAC Channel 1 (3.6 μm) images before the actual source extraction at 100–500 μm. We cross-matched the IRAC 3.6 μm source catalog in each field with the ∼10–20 brightest sources detected in Herschel bands using DAOFIND (Stetson 1987). We then computed the median R.A. and decl. offsets of the matched sources in the Herschel and IRAC bands and corrected these for the Herschel data. We only calculated the offsets independently for the PACS 100 μm and SPIRE 250 μm data and applied the same astrometric shift to other bands of the same instrument. This is because the offsets between different bands of the same Herschel instrument have been well calibrated. The median corrected offsets are 09 and 13 for PACS and SPIRE images, consistent with those reported in R16.
3.1.2. Input ALCS Source Catalog
We constructed the input catalog for Herschel source extraction using 180 ALCS sources at S/N ≥ 4 (Section 2.1). Among them, 141 secure sources (main sample) were extracted in the first two iterations, and 39 tentative sources with matched HST/Spitzer counterparts (secondary sample) were then extracted on the residual images. We note that 85% of tentative ALCS sources at S/Nnat = 4 − 5 and S/Ntap < 4.5 do not show any NIR/MIR counterpart. These sources are expected to mostly be spurious and not included for Herschel photometry. However, it is possible that a few of them represent highly obscured high-redshift galaxies (AV ≳ 5, z ≳ 4), which are missed by this study. The coordinates of ALMA sources were used as positional priors, and the S/Ns of ALMA detections were later used to rank the priority of extraction in Section 3.2.
3.1.3. Background Subtraction
We estimated and subtracted the 2D sky background of Herschel images using sigma-clipped statistics in each mesh of a grid that covers the whole input data frame. This is the same algorithm used by SExtractor (Bertin & Arnouts 1996). The typical box size of the mesh was 21 × 21/16 × 16 pixels for PACS/SPIRE bands, corresponding to an area of 10/20 beams. The size of the median filter, which was applied to suppress a possible overestimate of background due to bright sources, was 7 × 7/5 × 5 pixels for PACS/SPIRE bands (corresponding to an area of 1/2 beams). In the cluster fields with strong extended emissions seen in the SPIRE bands (R0032, M2129, P171, and A2163), we slightly reduced the sizes of mesh and filter for a better removal of foreground large-scale emissions. The 2D rms map was then created as a by-product of this background subtraction process.
3.1.4. Neighborhood Examination
Our Herschel source extraction process started from the bluest band for each cluster, i.e., 100 μm for the 18 clusters observed with PACS in the "deep" mode, and 250 μm for the other 15 clusters observed in the "snapshot" mode. Therefore, in the bluest band, we first extracted a source catalog using the DAOFIND algorithm, which contains sources detected or undetected by the ALCS. We then matched and removed the ALCS sources in this catalog within a maximum separation of 1/3 the PSF FWHM (i.e., 2'' at 100 μm and 6'' at 250 μm). Therefore, this catalog represents the 1.15 mm undetected Herschel sources that may blend with ALMA-detected sources in Herschel data at longer wavelengths (e.g., 500 μm). Compared with ALCS sources, these sources are likely at a lower redshift, and thus their SEDs peak at shorter wavelength and drop rapidly at longer wavelength. We only included ALMA-faint Herschel sources within a separation of 30'' (100 μm) or 36'' (250 μm) from the ALCS sources. This is because a larger searching area would not further increase the quality of source deblending for the ALCS sources.
To enhance the accuracy of flux extraction, we also manually added or adjusted the positions of several ALMA-faint Herschel sources according to the coordinates of their IRAC counterparts. This affects 5% of all ALMA-faint Herschel sources. For Herschel bands at longer wavelengths, we directly used this list of ALMA-faint Herschel sources in the bluest band. However, we find that if an ALMA-faint Herschel source cannot be extracted at >10 mJy for "deep"-mode clusters or >18 mJy for "snapshot"-mode clusters in a given SPIRE band, this source will be very unlikely to be detected above 2σ at any redder band. Therefore, such sources will be removed from fitting at longer wavelengths.
3.2. Iterative Herschel Photometry
Herschel source extraction was performed with an iterative PSF photometry approach in an increasing order of wavelength using photutils (Bradley et al. 2019). We adopted the PSF models of PACS and SPIRE from the Herschel Science Archive. 38 We also applied the spacecraft orientation angle to calculate the realistic PSF for the data taken in each cluster field.
3.2.1. Initial Guess of Flux Densities
To provide initial guesses of flux densities for PSF photometry, we performed circular aperture photometry for all the ALCS sources and ALMA-faint Herschel sources. The radii of the apertures were 5'', 8'', 12'', 15'', and 18'' from 100 to 500 μm, and the aperture correction factors (1.92, 1.90, 1.66, 1.79, 2.24) were computed based on the PSF models. In the PACS bands, these initial guesses of flux densities were used for all the sources in the main sample and ALMA-faint Herschel sources. In the SPIRE bands, these initial guesses were only used for all the  sources and ALMA-faint Herschel sources owing to a stronger source blending issue.
3.2.2. Iterations of PSF Photometry
The PSF photometry was performed in three rounds of iterations in decreasing order of the significance of detection. Because most of the ALCS sources are compact in spatial extent (FWHM ≲ 1''), we assumed a point-like profile for all of the sources to be extracted. In each iteration, we only kept the results of those sources with positive extracted flux densities. The uncertainties of extracted flux densities were estimated from the covariance matrix of least-squares fitting.
In the first iteration, we tentatively extract sources that were (i) ALCS sources at S/NALMA ≥ 10 or (ii) ALMA-faint Herschel sources described above. These two types of objects should be the brightest sources seen in a given Herschel map. Therefore, an accurate flux density modeling of these sources will provide helpful guesses for the final combined source models in the whole data frame. We applied the rotated PSFs and modeled the flux densities at given source positions. The DAOGROUP algorithm (Stetson 1987) was adopted to group sources within a separation of one beam FWHM. The best-fit model was then stored and used as prior information for the next iteration.
In the second iteration, we extracted sources that were (i) ALCS sources in the main sample or (ii) ALMA-faint Herschel sources. These two types of objects should be secure sources, and thus their flux densities should be positive in any Herschel band. The flux priors were given by the first iteration or aperture photometry if the sources were not modeled previously. In SPIRE bands, the initial flux guesses of sources at S/NALMA < 10 were assumed as RMSmap. With a similar PSF photometry routine, we modeled and subtracted sources with positive best-fit flux densities. In this intermediate step, most of the real sources in the current Herschel band have been extracted. The best-fit model and residual maps were recorded for the next iteration.
In the last iteration, we extracted tentative ALCS sources in the secondary sample. Source extraction was performed on the residual map of the second iteration, and the initial guesses of the flux densities were set to zero. Only sources modeled with positive flux densities were kept. The best-fit model and residual were then recorded as part of the final products.
Figures 2 and 3 display the Herschel scientific and residual images (i.e., before and after the source extraction) of two cluster fields observed in both the "deep" and "snapshot" modes, namely, A2744 (Figure 2; "deep") and M0417 (Figure 3; "snapshot"). Secure and tentative ALCS sources and ALMA-faint Herschel sources extracted at S/N > 2 are shown as open magenta, cyan, and green circles, respectively. No significant residual in SPIRE bands can be found within the ALCS footprint, shown as the region enclosed by the red solid line, although weak ring-shape residuals can be identified in PACS bands for a few very bright sources (f ≳ 50 mJy). This could be caused by the invalidity of point-source assumption or mismatch of PSF models, but our examination in Appendix A suggests no gain or loss of PACS flux densities through this PSF photometry routine.

Figure 2. Herschel images of A2744 (A2744) observed in the "deep" mode. PACS 100/160 μm images are shown on the left, and SPIRE 250/350/500 μm images are shown on the right. Each panel consists of the scientific image (left) and residual image after PSF source extraction (right). In each panel, the red patch represents the ALCS footprint (primary-beam response cut at 0.25), and the magenta circles (blue squares) represent the secure ALCS sources (main sample) extracted at S/N > 2 (S/N < 2) in each Herschel band. The cyan diamonds are tentative ALCS sources (secondary sample) extracted at S/N > 2 in the Herschel bands. The green triangles are ALMA-faint Herschel sources (see Section 3.2), which we also included for source extraction. A 1 scale bar is shown in the lower right corner of each panel.
Download figure:
Standard image High-resolution image
Figure 3. Herschel/SPIRE images of MACS J0417.5−1154 (M0417) observed in the "snapshot" mode. The layout and symbols are the same as those in Figure 2.
Download figure:
Standard image High-resolution image3.3. Nondetections
As a consequence of the limited depths of the Herschel data when compared with the deep ALCS data, a significant number of sources were not successfully extracted in the Herschel bands (see statistics in Section 3.5). Therefore, we only provide 3σ upper limits of their flux densities. As pointed out by R16 and other works, because the source positions are known from the ALMA data, the actual Herschel flux limit of nondetections is lower than the nominal confusion noise limit (e.g., Nguyen et al. 2010).
Based on the flux densities and their uncertainties modeled with PSF photometry, we calculated the median flux density uncertainty of the extracted secure sources in each band and each cluster field (main ALCS sample, Herschel S/N > 2). These uncertainties were obtained based on positional priors using the covariance matrix of least-squares PSF modeling, and thus we define them as RMSprior. Table 2 presents all the measured RMSprior, along with the RMSmap, which is directly measured from the 2D uncertainty map within the ALCS footprint. We also compare the RMSprior with RMSmap measured for all our Herschel data in Figure 4, and we find a median ratio of RMSprior to RMSmap of 0.43 ± 0.01 in the Herschel/SPIRE bands. A similar value can also be found for the PACS bands. This means that with prior knowledge of source positions, the actual 3σ limit of nondetection is around 1.3 times the local background RMSmap. Such an upper limit is adopted for all the Herschel nondetections in this work.
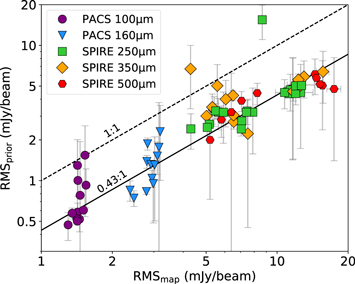
Figure 4. The rms noise of Herschel images measured from the prior-based catalogs (RMSprior; see Section 3.3) vs. the 2D uncertainty maps (RMSmap). Measurements obtained on the maps from 100 to 500 μm are shown as symbols with different colors as labeled in the upper left legend. The dashed line indicates the case in which the two rms noises are identical, and the solid line represents the median ratio of RMSprior to RMSmap of 0.43 ± 0.01.
Download figure:
Standard image High-resolution imageThe median 3σ depths derived for the 18 clusters observed in the "deep" mode are 7.5, 7.6, and 8.2 mJy at 250, 350, and 500 μm, respectively. These are consistent with the 3σ rms of deblended flux densities using the cross-identification procedure reported by Roseboom et al. (2010, for HerMES fields) and only slightly lower than the reported value in Swinbank et al. (2014) at 500 μm, which also included ALMA positional priors for deblending.
3.4. Special Sources
Several ALCS sources show secure close companions (i.e., angular separation less than 6'', which is one-third of the beam FWHM at 250 μm) at S/N ≥ 5 in the ALMA maps. Five of these seven systems have already been confirmed as lensed arcs or multiply lensed systems with HST or ALMA data. Due to the coarse resolution of the Herschel data, especially those of SPIRE, the flux density ratios among these source groups might be incorrectly modeled in Section 3.2.
In this step, we redistributed the Herschel flux densities of these source groups according to their ALMA flux density ratios. If a source was resolved on the native-resolution ALMA map with a major-axis FWHM less than 3'' (morphological parameters modeled with casa imfit; S. Fujimoto et al. 2022, in preparation), we adopted the ALMA flux density measured with a circular aperture of r = 2''. For sources with larger FWHMs, we adopted the best-fit ALMA flux densities derived from surface brightness profile modeling (assuming 2D Gaussian profile with imfit). For unresolved sources, we used the peak flux densities per beam measured on the 2''-tapered maps. We note that the redistribution of Herschel flux densities assumes a fixed FIR SED shape among blended sources in each group. Only one source from each blended group is considered for the discussions of dust temperature in Section 6.4.
We redistributed the Herschel fluxes for all the ALCS sources in the main sample and within a separation of 6''. This includes (i) ACT0102-ID215/224 (lensed galaxy pair known as "la Flaca"; Lindner et al. 2015; Wu et al. 2018; Caputi et al. 2021), (ii) ACT0102-ID223/294 (lensed galaxy pair; Wu et al. 2018), (iii) M0417-ID221/223 (two ALMA sources at S/N ≳ 6 with a separation of 23; K. Kohno et al. 2022, in preparation), (iv) M0553-ID133/190/249 (triply lensed arc; Ebeling et al. 2017; Sun et al. 2021b), (v) M1206-ID55/60/61 (known as the "Cosmic Snake"; Ebeling et al. 2009; Cava et al. 2018; Dessauges-Zavadsky et al. 2019), (vi) R0032-ID53/55/57/58 (lensed arc; Dessauges-Zavadsky et al. 2017), and (vii) R1347-ID145/148 (IR-bright lensed arc in R1347). In Figure 5 we display the HST, ALMA, and SPIRE images of all these source groups. Note that we only redistributed the 500 μm flux densities of ACT0102-ID215/224 because of a moderate separation (93).
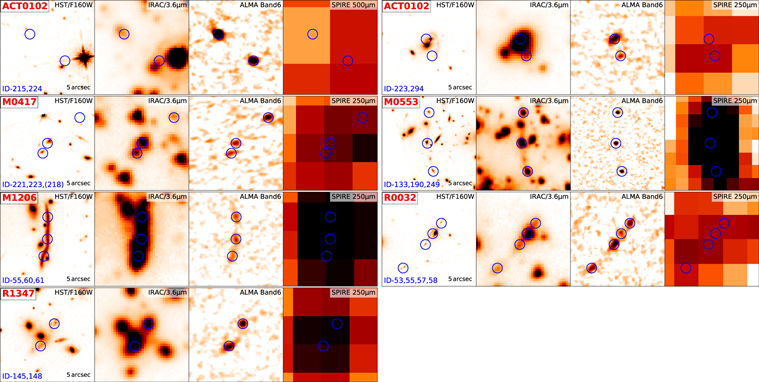
Figure 5. The seven special cases of sources with close companions for which we redistributed the Herschel flux densities based on the ALMA flux density ratios (see Section 3.4). In each postage stamp image, we show the HST WFC3-IR/F160W image, Spitzer IRAC 3.6 μm image, ALMA Band 6 image at native resolution, and SPIRE 250 μm image (500 μm for ACT0102-ID215/224) from left to right. ALCS sources are labeled with open blue circles, and cluster names, ALMA source IDs, and scale bars are shown in the corners of the F814W images.
Download figure:
Standard image High-resolution image3.5. Statistics of Herschel Detections
By comparing our PSF photometric results with those derived with aperture photometry, PSF photometry using MIR priors (R16) and different software (xid+; Hurley et al. 2017) as presented in Appendix A, we confirmed the quality of our Herschel flux density measurements. In Table C1 we present the Herschel photometric catalog of 180 ALCS sources in both the main and secondary samples (Section 2.1). The definition of these samples is also illustrated in Figure 6.
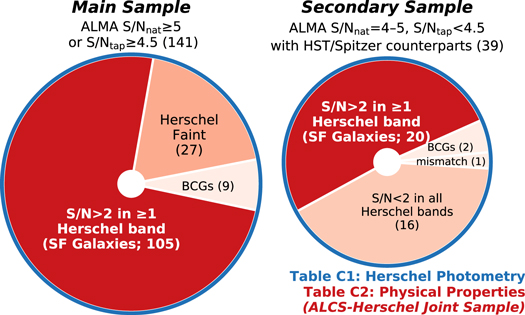
Figure 6. Summary of ALMA and Herschel detections and sample definition. The main sample includes all 141 secure ALCS sources detected at either S/Nnat ≥ 5 in the native-resolution maps or S/Ntap ≥ 4.5 in the 2''-tapered maps. The secondary sample includes 39 tentative ALCS sources (S/Nnat = 4 − 5 and S/Ntap < 4.5) showing HST/Spitzer counterparts within 1'' offset. Table C1 presents the Herschel photometric catalog of these 180 sources (shown as blue circles). Among 141 sources in the main sample, 105 of them are SFGs that are detected at S/N > 2 in at least one Herschel band. Together with 20 SFGs in the secondary sample above the same Herschel detection threshold, these galaxies are presented in Table C2 for their physical properties (shown as red filled regions). A total of 43 sources that are undetected in all Herschel bands (including 27 "Herschel-faint" galaxies in the main sample; see Sections 3.5 and 4.3), 11 BCGs, and one mismatched source (A2537-ID06) are not included in Table C2 (shown as shallow filled regions).
Download figure:
Standard image High-resolution imageFigure 7 shows the Herschel detection rates as functions of ALMA S/N cut from 100 to 500 μm. The rates of 100 and 250 μm detection (>2σ) are almost constant at S/NALMA ≥ 5. However, the detection rates at long wavelength (350 and 500 μm) are clearly correlated with the significance of ALMA sources. This is likely the consequence of (i) a larger beam size and stronger blending effect toward longer wavelength and (ii) a decreasing fraction of high-redshift sources (z > 3) toward lower 1.15 mm flux density (e.g., Béthermin et al. 2015; Casey et al. 2018; Popping et al. 2020). We also note one caveat that certain extragalactic ALMA surveys of rest-frame UV/optical-selected galaxies may have a selection bias against highly dust-obscured sources at z ≳ 3. For such surveys, the most accurate measurement of the redshift distribution can be obtained after the sample is spectroscopically complete (see Reuter et al. 2020; Chen et al. 2022).
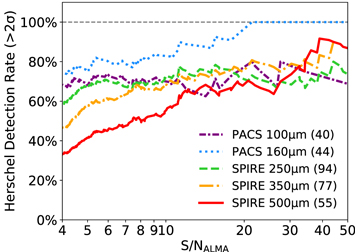
Figure 7. Detection (>2σ) rates of ALCS sources as functions of ALMA S/N cut in all five Herschel bands. Line color and style of each band are shown in the lower right legend, and values in parentheses indicate numbers of >2σ Herschel detections among secure ALCS sources (S/NALMA ≥ 5).
Download figure:
Standard image High-resolution imageAmong the total of 141 secure ALCS sources at S/Nnat ≥ 5 or S/Ntap ≥ 4.5 (58 of which fall in the PACS coverage), we successfully extracted 40, 44, 94, 77, and 55 sources at 100, 160, 250, 350, and 500 μm at above a 2σ significance, respectively. The SPIRE detection rate in the "deep"-mode clusters is higher than that in the "snapshot"-mode clusters by ∼10%. A total of 113 (99) ALCS sources were detected at >2σ ( >3σ) in one Herschel band at least (including eight brightest cluster galaxies (BCGs)), and 91 sources were detected at >2σ in two Herschel bands at least.
Only 28 secure ALCS sources (20% of the total 141 sources) cannot be extracted at S/N >2 in any Herschel band. The 16th, 50th, and 84th percentiles of 1.15 mm flux densities of these sources (0.45, 0.92, and 1.41 mJy) are smaller than those of Herschel-detected sources (0.66, 1.22, and 3.00 mJy). Except for M1206-ID58 as a BCG at z = 0.440, we refer to the remaining 27 sources as Herschel-faint galaxies in later analysis (Section 4.3; also called Herschel-dropout galaxies in Boone et al. 2013).
Among the 39 tentative ALCS sources at S/Nnat = 4 − 5 and S/Ntap < 4.5, 22 of them can be extracted above a 2σ significance in at least one Herschel band, including one BCG and one mismatched source. The remaining 17 sources are undetected in any Herschel band, including one BCG (R0032-ID162). These sources are excluded for further analysis because of a higher false-ID rate.
We further justify such a 2σ detection threshold by calculating the joint probability of spurious sources through a χ2 statistic of the detection significance in all available Herschel bands. For all ALCS sources extracted at S/N >2 in any Herschel band, only five sources (4% ± 2%) exhibit p-values of spurious detection at above 0.01, including three secure ALCS sources (ACT0102-ID118, P171-ID69, P171-ID177) and two tentative sources (AS295-ID269, M1115-ID33). The largest p-value = 0.03 is seen for source P171-ID69 with S/NALMA = 19.7. Therefore, we conclude that with the single-band 2σ detection threshold the number of spurious Herschel sources will be on the order of unity.
4. SED Fitting
4.1. Methodology
We perform FIR SED modeling of our sample with the best available redshifts (zbest) using magphys (da Cunha et al. 2008, 2015). Here the zbest is either spectroscopic redshift (zspec), published HST-derived zphot (Section 2.5), or FIR zphot (priority from high to low). Redshift uncertainty is propagated into the uncertainties of derived physical properties through a Monte Carlo sampling of zphot likelihood when zspec is not available. In order to derive and validate FIR zphot for sources without zspec or HST zphot, we also perform simultaneous FIR SED fitting and photometric redshift estimates of our sample using magphys+photoz (Battisti et al. 2019), the photoz extension of magphys.
magphys assumes a Chabrier (2003) initial mass function (IMF), a continuous delayed exponential star formation history with random starburst, and energy balance between dust absorption in the UV and reemission in the IR. At FIR wavelengths, the dust model assumed by magphys includes a warm (30–80 K) and a cold (20–40 K) component, and the prior distribution of luminosity-weighted dust temperature (Tdust) peaks around 37 K with a 1σ dispersion of ∼20%. Such a dust temperature is comparable to those of widely adopted spectral templates at around median LIR ∼1012 L⊙, including Chary & Elbaz (2001) and Magdis et al. (2012, which is based on the model of Draine & Li 2007). For a full description of the models and parameters assumed by magphys, see da Cunha et al. (2008, 2015) and Battisti et al. (2019). Here we only include five or three bands of Herschel data and ALMA 1.15 mm flux densities for our SED modeling. Further optical/NIR counterpart matching, uniform HST and Spitzer photometry, and panchromatic SED fitting will be presented by another paper of the ALCS collaboration, and certain conclusions on Tdust and redshift distribution depending on the FIR zphot values may be further revised.
Here we highlight several caveats of our SED modeling obtained with magphys. First of all, the accuracy of FIR zphot is subject to a well-known degeneracy between redshift and dust temperature, typically showing an error around Δz ∼ 0.2(1 + z). In addition, magphys+photoz assumes a prior redshift distribution peaking at z ∼ 1.7, and in practice we find that such a prior will lead to an artificial shift of zphot estimate toward such a redshift. To address this issue, we adopt a uniform redshift prior instead. Furthermore, the nonthermal emission of BCGs seen at 1.15 mm cannot be properly modeled, and thus their boosted ALMA flux densities (e.g., M1931-ID41; Fogarty et al. 2019) will lead to a wrong estimate of IR luminosity and SFR. Therefore, we do not perform SED modeling for all the known BCGs. We also note that only three lensed ALCS sources are detected in X-ray among 31 cluster fields with publicly available Chandra data (A370-ID110, M0416-ID117, M0329-ID11; these sources will be discussed by Uematsu et al. from the collaboration). We also estimate the upper limit of the AGN contribution to the derived IR luminosities. We assume the SKIRTOR model (Stalevski et al. 2012, 2016) for a type 2 AGN SED with an inclination angle of 70°. To estimate the upper limit of X-ray luminosity, we used a simple absorbed power-law model with a photon index of 1.9 and an intrinsic absorption of  . The median X-ray luminosity is LX < 2 × 1043 erg s−1 for X-ray-undetected sources, corresponding to an IR luminosity of ≲6 × 10⁹
L⊙. Therefore, the AGN contamination will not be a concern for the majority (≳95%) of ALCS sources, but we also note that in the case of a Compton-thick AGN (
. The median X-ray luminosity is LX < 2 × 1043 erg s−1 for X-ray-undetected sources, corresponding to an IR luminosity of ≲6 × 10⁹
L⊙. Therefore, the AGN contamination will not be a concern for the majority (≳95%) of ALCS sources, but we also note that in the case of a Compton-thick AGN ( ), the upper limit on LX can be larger by more than an order of magnitude. Finally, magphys can only provide weak constraints on the physical properties of Herschel-faint galaxies individually, which are specifically discussed in Section 4.3.
Table C2 presents a summary of the best-fit galaxy properties of 125 ALCS sources detected at S/N ≥ 4, including 47 sources that are spectroscopically confirmed and an additional 42 sources with cataloged HST zphot. This sample, further referred to as the ALCS-Herschel joint sample, includes 105 secure (i.e., the main sample) and 20 tentative ALCS sources (the secondary sample) detected above 2σ in one Herschel band at least, except for 11 BCGs and one special source (A2537-ID06) due to the poorness of SED fitting. A2537-ID06 is only detected with ALMA at S/N = 4.2 and offset from a passive cluster dwarf galaxy by 09, and therefore it is likely a false detection with Herschel/SPIRE fluxes coming from an ALMA-faint Herschel source. The definition of this sample is also visualized as the red filled regions in Figure 6. The postage stamp images and best-fit FIR SEDs of these 125 sources are shown in Appendix B.
We further model the dust temperature of sources in Table C2 with the Herschel and ALMA data. We fit the dust continuum emissions of all sources with a modified blackbody (MBB) using the best available redshifts. The dust absorption coefficient is assumed to be κ = 0.40 × (ν/250)β in units of cm2 g−1, where ν is the frequency in GHz in the rest frame. We assume a fixed dust emissivity of β = 1.8, which was widely adopted in previous studies (e.g., Díaz-Santos et al. 2017; Dudzevičiūtė et al. 2020; Sun et al. 2021b) and supported by a recent 2 mm study of SMGs at z ≃ 1 − 3 (da Cunha et al. 2021). Following previous work including Greve et al. (2012) and Sun et al. (2021b), we only fit the SED over a rest-frame wavelength of 50 μm to avoid an optically thick regime and eliminate any possible contribution of warm dust components at shorter wavelength. We note that luminous SMGs (LIR ≃ 1012.5 − 1013 L⊙) are found to be optically thick at λthick ∼ 100 μm (e.g., Spilker et al. 2016; Simpson et al. 2017; Dudzevičiūtė et al. 2020), but we argue that less luminous ALCS sources have lower dust mass densities (e.g., Sun et al. 2021b) and therefore smaller optical depths at the same wavelength in the rest frame. The best-fit dust temperatures and masses (Mdust) are also presented in Table C2. The uncertainty of redshift is propagated into that of the dust temperature if the zspec is unknown. The dust masses derived from this fitting procedure are also consistent with those from magphys.
We also note that many works use the rest-frame wavelength of FIR SED peak (λpeak) to quantify the luminosity-weighted dust temperature (e.g., Casey et al. 2018; Reuter et al. 2020; Burnham et al. 2021). This is because λpeak is less dependent on dust opacity assumption compared with Tdust. Under the dust absorption coefficient assumption that we adopt, the conversion between λpeak and Tdust is  μmK.
μmK.
4.2. Validity of FIR Photometric Redshifts
To validate the FIR photometric redshifts derived with magphys+photoz, we first compare the FIR zphot values of 47 spectroscopically confirmed sources with their zspec values in the left panel of Figure 8. The median redshift discrepancy is (zphot − zspec)/(1 + zspec) = −0.01 ± 0.04, indicating an excellent agreement. We apply a Kolmogorov–Smirnov (K-S) test on the discrepancy between zphot and zspec divided by the uncertainty of FIR zphot, in comparison with the standard normal distribution. We conclude that the standard deviation of (zphot − zspec)/(1 + zspec) is well predicted by the uncertainty of FIR zphot (p-value = 0.59).
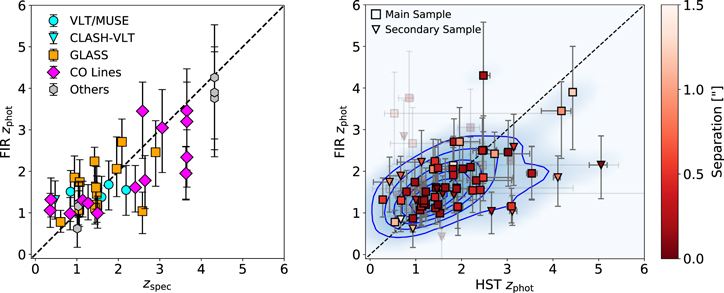
Figure 8. Left: comparison of FIR photometric redshifts and spectroscopic redshifts (see the references of zspec values in Table C2). The dashed black line indicates the cases where FIR zphot values are identical to zspec values. Right: comparison of photometric redshifts obtained through FIR (Herschel and ALMA) and optical/NIR (HST) SED fitting. Squares denote ALCS sources in the main sample, and downward-pointing triangles denote those in the secondary sample. All the sources are color-coded with their observed offsets between the HST and ALMA counterparts. The blue density map and contours represent the overall distribution of the cross-matched sample, except for 22 sources that are either out of HST/WFC3-IR coverage or detected at above 2σ in only one Herschel band (shown with transparent symbols). The dashed black line indicates the cases where zphot values obtained through FIR and HST SED fitting are identical.
Download figure:
Standard image High-resolution imageThe comparison of FIR and HST zphot values is shown in the right panel of Figure 8. We find a general agreement of zphot estimate between HST and FIR SED modeling, albeit with a significant dispersion. We note that the best-fit linear slope of zphot,FIR(zphot,HST) is only 0.31 ± 0.08. However, this is mainly contributed by roughly four tentative sources in the secondary sample with zphot,HST ∼ 4 but zphot,FIR ∼ 2, which may be subject to a high false-ID rate (∼18%). The discrepancy between the two zphot values, defined as (zphot,HST −zphot,FIR)/[1 + (zphot,HST + zphot,FIR)/2], is observed to be  (16th, 50th, and 84th percentile) with a typical uncertainty of 0.21. We perform a K-S test on the photometric redshift discrepancies divided by their uncertainties of the cross-matched sources. The null hypothesis that the FIR-HST zphot discrepancies relative to their uncertainties are drawn from a standard normal distribution cannot be ruled out (p-value = 0.33), reinforcing the agreement between these two photometric redshift estimates.
4.3. Herschel-faint Galaxies
Among the 27 Herschel-faint galaxies reported in Section 3.5, two of the sources have been spectroscopically confirmed. They are R0600-ID164 as a [C ii]-emitting lensed arc at z = 6.072 (Fujimoto et al. 2021; Laporte et al. 2021) and R0032-ID32 as the faintest component of a multiply lensed arc at z = 3.631 (Dessauges-Zavadsky et al. 2017). In addition to this, eight sources exhibit HST counterparts with tabulated photometric redshifts (median zphot = 2.0 ± 1.0; Molino et al. 2017; Coe et al. 2019). Postage stamp images of these 10 sources are shown in Appendix B (Figure B3). FIR SEDs of these galaxies are also modeled with magphys, and we note that the adopted IR spectral templates are essentially MBB spectra at around Tdust = 35 ± 6 K without exceeding the Herschel nondetection limits except for SM0723-ID93 (S/NALMA = 4.6 in 2''-tapered map), which is likely a random association between a cluster dwarf galaxy and spurious ALMA source.
The remaining 17 sources do not have cross-matched HST zphot because they are intrinsically faint shortward of 1.6 μm and/or out of HST/WFC3-IR coverage (Figure B4 in Appendix B). Such an NIR-dark (also often called "H-dropout/faint") nature suggests that they are likely dust-obscured SFGs at z ∼ 4 that have raised general interest in recent studies (e.g., Simpson et al. 2014; Franco et al. 2018; Alcalde Pampliega et al. 2019; Wang et al. 2019; Williams et al. 2019; Yamaguchi et al. 2019; Dudzevičiūtė et al. 2020; Gómez-Guijarro et al. 2022; Smail et al. 2021; Sun et al. 2021a). For each individual source, the nondetections in the HST and Herschel bands prevent us from deriving useful constraints of their redshifts and physical properties.
To address this issue, we stack the Herschel residual images of Herschel-faint galaxies without spectroscopic or HST photometric redshifts. We note that four out of five sources at S/NALMA < 5.5 do not show any counterpart in HST or Spitzer bands (ACT0102-ID11, M2129-ID24, ACT0102-ID251, and R1347-ID51). Therefore, these sources could be spurious detections, or highly obscured galaxies at very high redshift (i.e., similar to R0600-ID67 and R0949-ID19, the brightest Herschel-faint galaxies in Figure B4 that do not show any HST or Spitzer counterpart, and also the ALMA-only [C ii] emitters at z >6 reported recently by Fudamoto et al. 2021). Our stacking analysis suggests that including these sources will lead to a lower S/N in SPIRE 350 and 500 μm bands, and therefore we only present the stacked SEDs of 12 sources at S/NALMA >5.5.
We first normalize the Herschel/SPIRE residual and uncertainty images of all sources by their ALMA flux densities. Here the residual images are the scientific images with all the other Herschel sources subtracted assuming point-source models as described in Section 3.2. PACS images are not stacked because of the unavailability for most sources. We stack all the images in each SPIRE band using an inverse variance weighting method. The stacked SPIRE images are presented in Figure 9. We measure the flux densities of stacked sources using an aperture of raper = 18'' with appropriate aperture correction factors. The sky background is subtracted using the median of sigma-clipped local annulus, and photometric uncertainty is estimated from the rms of that.
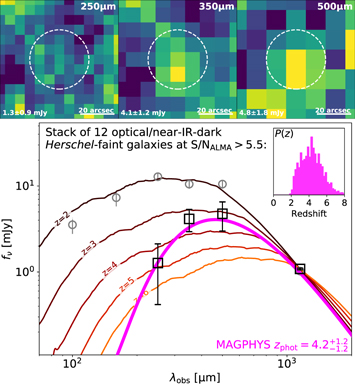
Figure 9. Top: stacked Herschel/SPIRE images of 12 Herschel-faint galaxies (S/NALMA >5.5) without zspec or HST zphot at 250, 350, and 500 μm. The white circles represent the apertures used for photometry. The flux density of the stacked source in each band is noted in the lower left corner of each plot. Scale bars of 20'' are shown in the lower right corners. Bottom: FIR SED of stacked sources (open black squares). The probability distribution of redshift is shown as the inset plot. The median FIR SEDs of sources in the ALCS-Herschel joint sample are shown as open gray circles. Composite SEDs of AS2UDS SMGs (stack of z >3 sources; Dudzevičiūtė et al. 2020) at z = 2 − 6, normalized to the median 1.15 mm flux density of Herschel-faint galaxies, are shown for comparison.
Download figure:
Standard image High-resolution imageThe stacked source can be detected at ∼3σ in SPIRE 350 and 500 μm band while remaining undetected at 250 μm (<2σ). The stacked FIR SED is shown below the stacked SPIRE images in Figure 9. We also show the median FIR SEDs of ALCS sources that are detected with Herschel to visualize the clear difference in the continuum strength at below 500 μm. Here all the photometric data are normalized to the median ALMA flux density (1.09 mJy). With magphys+photoz, we derive a median zphot of 4.2 ± 1.2 (uncertainties denote the 16th and 84th percentiles of the likelihood distribution), IR luminosity of 1012.1±0.3
μ−1
L⊙, and SFR of  μ−1
M⊙ yr−1 before lensing magnification correction. The derived redshift is consistent with those of HST H-faint galaxies in previous studies (e.g., Simpson et al. 2014; Wang et al. 2019; Alcalde Pampliega et al. 2019; Dudzevičiūtė et al. 2020; Sun et al. 2021a).
μ−1
M⊙ yr−1 before lensing magnification correction. The derived redshift is consistent with those of HST H-faint galaxies in previous studies (e.g., Simpson et al. 2014; Wang et al. 2019; Alcalde Pampliega et al. 2019; Dudzevičiūtė et al. 2020; Sun et al. 2021a).
Using the composite SED templates of AS2UDS SMGs at z >3 (Dudzevičiūtė et al. 2020) and ALESS SMGs at z >3.5 (da Cunha et al. 2015), we derive best-fit zphot of 3.8 ± 0.4 and 5.2 ± 0.6, respectively. Given the large scattering of Tdust for sources at given luminosity and redshift (e.g., Schreiber et al. 2018; Dudzevičiūtė et al. 2020), the redshift uncertainty can be significantly underestimated with single template matching techniques. In addition to this, the median IR luminosity of SMGs in the ALESS z >3.5 sample is ∼10 times higher than that of stacked Herschel-faint sources and therefore likely exhibits a higher Tdust. This likely leads to an overestimated zphot through template matching for the ALESS z >3.5 sample.
5. Lens Modeling
5.1. Models, Magnifications, and Multiple Images
We calculate the lensing magnification factor (μ) based on the best available redshifts. We adopt two sets of parametric lens models: the so-called Zitrin-NFW lens models (Zitrin et al. 2013, 2015) for all the HFF and CLASH clusters, and GLAFIC lens models (Oguri 2010; Okabe et al. 2020) for the RELICS clusters. The lensing magnification is derived using the maps
39
of projected cluster mass surface density (κ) and weak-lensing shear (γ) at the centroid of ALCS source as ![$\mu ={[{(1-\kappa \cdot {D}_{{ls}}/{D}_{s})}^{2}-{(\gamma \cdot {D}_{{ls}}/{D}_{s})}^{2}]}^{-1}$](https://content.cld.iop.org/journals/0004-637X/932/2/77/revision1/apjac6e3fieqn10.gif) , where Dls
is the angular diameter distance between the lens and the source and Ds
is the angular diameter distance to the source. We assume no magnification (μ = 1) for sources within or in front of the cluster fields (zs
< zcl
+ 0.1), following R16. For 16 Herschel-faint galaxies without cataloged redshifts (Section 4.3), we calculate their magnification at zs
= 4.2 uniformly.
, where Dls
is the angular diameter distance between the lens and the source and Ds
is the angular diameter distance to the source. We assume no magnification (μ = 1) for sources within or in front of the cluster fields (zs
< zcl
+ 0.1), following R16. For 16 Herschel-faint galaxies without cataloged redshifts (Section 4.3), we calculate their magnification at zs
= 4.2 uniformly.
The distribution of magnification factors of the ALCS-Herschel joint sample and Herschel-faint sample is shown in Figure 10. The 16th, 50th, and 84th percentiles of the distribution of μ are 1.8, 2.6, and 5.2, and seven sources exhibit a strong magnification with μ >10. The median lensing magnification suggests that the ALCS has reached a great depth that typical surveys in blank fields would require a ∼7 × longer observing time to achieve.
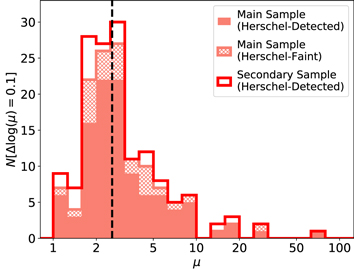
Figure 10. Stacked histogram of lensing magnification factor (μ) of 105 Herschel-detected ALCS sources in the main sample (filled light-red bars), 27 Herschel-faint sources (hatched-light-red bars), and 20 Herschel-detected sources in the secondary sample (solid red steps). The dashed black line denotes the median magnification factor (μmed = 2.6) of the whole sample. No significant difference in μmed can be identified for all three subsamples. The bin size is  .
.
Download figure:
Standard image High-resolution imageAmong the 125 sources in our ALCS-Herschel joint sample, six groups of sources have been spectroscopically confirmed as multiply imaged systems. These include (i) ACT0102-ID118/215/224 (Caputi et al. 2021), (ii) M0417-ID46/58/121 (K. Kohno et al. 2022, in preparation), (iii) M0553-ID133/190/249 (Ebeling et al. 2017), (iv) M1206-ID27/55/60/61 (Ebeling et al. 2009), (v) R0032-ID53/55/57/58 (Dessauges-Zavadsky et al. 2017), and (vi) R1347-ID145/148 (Richard et al. 2021). Additionally, M1931-ID47/55/61, R0032-ID208/281/304, and R0032-ID127/131/198 are also multiply lensed candidates yet to be spectroscopically confirmed, including HST H-faint sources M1931-ID47 and R0032-ID208/281/304, which are part of the Herschel-faint sample. This reduces the number of independent sources in Table C2 to 109. Multiply imaged sources of the same system are shown separately in diagrams for individual sources (e.g., Figure 8) but only counted once in all statistics of physical properties (e.g., redshifts, SFRs, and dust temperatures) in Section 6.
5.2. Uncertainties
The detailed characterization of the lensing magnification uncertainty (σμ
) will be presented by a forthcoming source count paper of the ALCS collaboration (S. Fujimoto et al. 2022, in preparation), and here we only present a qualitative estimate with a few quick methods. First of all, we estimate the σμ
based on the uncertainty of photometric redshift for sources without spectroscopic confirmation. The typical lensing magnification error propagated from zphot uncertainty is σμ
/μ ∼ 5%. In addition to this, we also compare the derived magnification factors using ALMA and HST source centroids, and the typical difference is found to be less than 1%. In order to quantify the σμ
caused by the extended source profile, we also measure the average magnification factor within a radius of 06 from the ALMA source centroid. Such an effect is negligible (σμ
/μ ≲ 2%) in most cases except for M0159-ID24 and R0032-ID57 (Figure 5) because of the galaxy−galaxy lensing effect, which provides a stronger magnification gradient over a smaller angular scale.
As an alternative method, we also analyze the uncertainty map of magnification presented by Zitrin et al. (2013, 2015) in the CLASH cluster fields, obtained through Markov Chain Monte Carlo (MCMC) fitting routines when the cluster mass models were constructed. We find that the σμ /μ is around ∼5% at μ = 3 assuming a fixed sky position and redshift. However, this uncertainty could be as large as ∼10% at μ = 10 and ∼50% at μ = 100, indicating that sources with larger magnifications are subject to a larger relative uncertainty, and therefore their intrinsic physical properties (e.g., LIR and SFR) are more uncertain.
Finally, based on the standard deviation of magnifications predicted by different lens models of the same clusters produced by different methods and groups (i.e., GLAFIC, CATS, Zitrin-NFW, and Zitrin Light-Traces-Mass (LTM) for Frontier Field clusters; Oguri 2010; Richard et al. 2014; Zitrin et al. 2015; Kawamata et al. 2016, 2018), we find a typical magnification uncertainty of σμ /μ ∼ 20%. This is comparable to the σμ reported in R16 (σμ = 0.5, ∼20% of the median magnification for sources in this work).
6. Discussion
6.1. FIR Colors
We further study the FIR colors of Herschel-detected ALCS sources. Figure 11 displays four color–color diagrams of our sample, covering the full wavelength range from 100 μm to 1.15 mm. Based on the average IR spectral templates in Rieke et al. (2009), we superimpose the redshift evolution tracks of a typical SFG (LIR = 1010.25 L⊙, corresponding to an SFRIR of ∼2 M⊙ yr−1 assuming the conversion factor in Kennicutt & Evans 2012) and a ULIRG (LIR = 1012 L⊙, corresponding to an SFRIR of ≳100 M⊙ yr−1) on all of the four color–color diagrams. The dust temperatures of the SFG and ULIRG templates are around 20 and 40 K. We also compare the distribution of our ALMA-selected sample with the R16 sample in two of the color–color diagrams where the 1.15 mm flux density is not invoked.

Figure 11. FIR colors of Herschel-detected ALCS sources, color-coded with the redshifts. (a) PACS–SPIRE color (f100/f250) vs. PACS color (f100/f160). (b) PACS–ALMA color (f100/f1150) vs. PACS color (f100/f160). (c) SPIRE color (f250/f350) vs. SPIRE color (f250/f500). (d) SPIRE–ALMA color (f350/f1150) vs. SPIRE color (f250/f500). Sources shown as squares are galaxies in the main sample (S/N ≥ 5), and downward-pointing triangles denote those in the secondary sample (S/N = 4 − 5). BCGs are shown with diamonds. We also compute and plot the redshift tracks of SFGs (LIR = 1010.25 L⊙, Tdust = 20 K; blue tracks) and ULIRGs (LIR = 1012 L⊙, Tdust = 40 K; red tracks) based on the spectral templates of Rieke et al. (2009), and FIR colors at redshifts of 0, 1, 2, 3, 4, and 5 are labeled out with pentagrams. In panels (a) and (c), the green contours enclose 68% and 95% of the FIR color distribution of Herschel sources detected in Hubble Frontier Fields (R16), and the background color maps denote the median redshift of these sources in each bin.
Download figure:
Standard image High-resolution image6.1.1. Selection Bias
Through a comparison with the redshift evolution tracks computed from the SED templates in Rieke et al. (2009), the color–color distributions of our sample match those of SFGs at 0 < z ≲ 2.5 and ULIRGs at 1 ≲ z ≲ 5. At z ≳ 2.5, the depth of Herschel data is not deep enough to select low-Tdust sources (i.e., ∼20 K for typical SFGs), even with a lensing magnification factor of a few tens.
The selection function of ALCS is nearly flat in terms of cold dust mass across z ≃ 1 − 6 (Mdust ≳ 108 μ−1 M⊙). However, with regard to a fixed LIR, the ALMA-Herschel joint selection does bias against low-redshift (z ≲ 1) galaxies with high dust temperature (∼ 40 K, ULIRG-like; see panels (a) and (b) of Figure 11). This could be interpreted as a combined effect of survey volume and 1.15 mm selection limit. At z < 1, the volume density of ULIRGs is ∼100 times lower than that of SFGs (e.g., Gruppioni et al. 2013), and therefore the expected number of ULIRG detections with ALCS in this redshift range is only on the order of unity. In addition, if we compare two galaxies with Tdust = 20 and 40 K at the same redshift (e.g., z = 0.5) and the same intrinsic IR luminosity, the warmer galaxy should be fainter at 1.15 mm and thus less likely to be selected by ALCS. These galaxies with high Tdust are likely to be selected as ALMA-faint Herschel sources, which are not included in our ALCS-Herschel joint sample. This further suggests that the observed-frame 1.15 mm selection has more bias in LIR than Mdust (e.g., Scoville et al. 2014; Dudzevičiūtė et al. 2021) because the Mdust − f1150 relation has less dependence on the dust temperature.
6.1.2. Comparison with Rawle et al. (2016)
We find that the majority of the Herschel-detected ALCS sources follow a similar distribution of FIR colors to the Herschel-selected sources in R16 (Figure 11, panels (a) and (c)). However, only 4% of the sources in R16 are at z >2, in contrast to a large fraction of 43% in our ALCS-Herschel joint sample. Sources in R16 were selected based on Spitzer and WISE MIR priors, and >4σ detections in at least two Herschel bands were required. Such a selection is biased against high-redshift sources that are faint in bluer Herschel bands (e.g., PACS 100 μm) but likely detectable with SPIRE 500 μm and ALMA Band 6. As shown in panel (a) of Figure 11, PACS-selected sources in R16 are mostly at z ≲ 1, which are populated by ALMA-faint Herschel sources that are not included in the ALCS sample. Meanwhile, as discussed earlier in this subsection, the ALCS-Herschel joint sample is biased against low-redshift sources with moderately low IR luminosity (LIR < 1011 L⊙) but high dust temperature. The combined selection effects lead to the significant difference in the redshift distributions of Herschel source samples of these two works.
6.2. Redshift versus 1.15 mm Flux Density
The top left panel of Figure 12 displays the redshift distribution of sources in our ALCS-Herschel joint sample. The 16th, 50th, and 84th percentiles of redshifts are 1.11, 1.90, and 2.95 (1.05, 1.81, and 2.96) for the main (full) joint sample, respectively, and no obvious difference in redshift distribution can be found among sources in clusters observed with "deep" and "snapshot" mode. The uncertainty of photometric redshifts is accounted for by the derivation of percentiles through a Monte Carlo sampling of the probability distributions. Among the joint sample, spectroscopically confirmed sources are generally at slightly lower redshifts. The 16th, 50th, and 84th percentiles of zspec values are 1.06, 1.55, and 2.90 (1.03, 1.49, and 2.70) for 26 (31) independent sources in the main (full) sample, respectively. However, we note that this ALCS-Herschel joint sample does not include 27 Herschel-faint galaxies that likely reside at higher redshifts (Section 4.3).
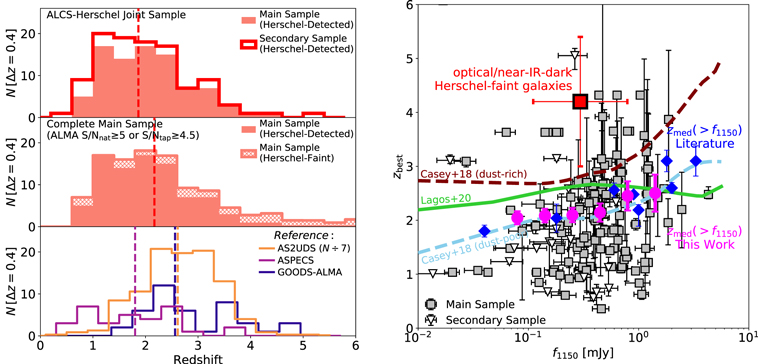
Figure 12. Left: distribution of best available redshifts of ALCS sources. ALCS-Herschel sources in the main sample (filled light-red bars) and secondary sample (solid red steps), cataloged in Table C2 (i.e., excluding Herschel-faint galaxies), are shown in the top panel. After assuming the probability distribution for the redshifts of optical/NIR-dark Herschel-faint galaxies derived with magphys+photoz (zphot = 4.2 ± 1.2; Section 4.3), the redshift distribution of sources in the main sample (S/Nnat ≥ 5 or S/Ntap ≥ 4.5) is shown in the middle panel. Note that cluster member galaxies are not included. The redshift distributions of reference samples, including AS2UDS (Dudzevičiūtė et al. 2020, orange steps; scaled by a factor of 1/7 for the purpose of displaying), ASPECS (Aravena et al. 2020, purple steps), and GOODS-ALMA (Gómez-Guijarro et al. 2022, blue steps), are shown in the bottom panel. The vertical dashed line indicates the median redshift for each sample. The bin sizes are Δz = 0.4. Right: best available redshifts versus ALMA 1.15 mm flux densities corrected for lensing magnification. Sources in the main (secondary) sample are shown as filled gray squares (open downward-pointing triangles). The median zbest and f1150 of 17 optical/NIR-dark Herschel-faint galaxies are visualized as the filled red square. Magenta circles denote the median redshifts of secure ALCS sources above the given 1.15 mm flux density thresholds. Blue diamonds denote zmed at various 1.1–1.2 mm flux density thresholds in the literature (Michałowski et al. 2012; Yun et al. 2012; Brisbin et al. 2017; Dunlop et al. 2017; Miettinen et al. 2017; Aravena et al. 2020; Gómez-Guijarro et al. 2022). The median redshifts as functions of 1.1 mm flux density cut, modeled by Casey et al. (2018, both dust-rich and dust-poor scenarios for z >4 universe) and Lagos et al. (2020), are plotted for comparison.
Download figure:
Standard image High-resolution imageTo estimate the median redshift of the full ALCS sample, we must include the Herschel-faint sources. Based on the probability distribution of 17 optical/NIR-dark Herschel-faint galaxies (intrinsically 15 sources after removing multiply lensed images) derived with magphys+photoz (zphot =4.2 ± 1.2), the 16th, 50th, and 84th percentiles of redshifts are 1.15, 2.08, and 3.59, respectively, for secure ALCS sources in the main sample (middle left panel of Figure 12; note that cluster member galaxies are not included).
The median redshift of secure ALCS sources is higher than that of the main ASPECS sample (zmed = 1.80 ± 0.15) in the Hubble Ultra Deep Field (HUDF; Aravena et al. 2020) but smaller than those of slightly shallower surveys, including AS2UDS (zmed = 2.61 ± 0.08 down to ∼1 mJy at 850 μm; Dudzevičiūtė et al. 2020), ASAGAO (zmed = 2.38 ± 0.14 down to ∼0.2 mJy at 1.2 mm; note that NIR-dark ALMA sources at z ∼ 4 are not included; Yamaguchi et al. 2019, 2020), and GOODS-ALMA (zmed = 2.56 ± 0.13 down to ∼0.5 mJy at 1.1 mm in their main sample; Franco et al. 2018; Gómez-Guijarro et al. 2022). The median redshift of ALCS sources is also smaller than those of millimeter-selected strongly lensed SMGs with wider but shallower surveys (e.g., zmed = 2.9 ± 0.1 with Planck's dusty GEMS sample, Cañameras et al. 2015; zmed = 3.9 ± 0.2 with the SPT sample, Reuter et al. 2020), as well as that of unlensed sources selected with the MORA survey at 2 mm (zmed = 3.6 ± 0.3 down to ∼ 0.3 mJy; Casey et al. 2021).
The median redshift of millimeter and submillimeter sources as a function of flux density limit is a key test for the evolution model of dust-obscured star formation history of the universe (see a review by Hodge & da Cunha 2020). The right panel of Figure 12 shows the best available redshifts versus intrinsic 1.15 mm flux densities of all ALCS sources in the main sample (excluding cluster member galaxies; filled squares) and Herschel-detected ALCS sources in the secondary sample (open downward-pointing triangles). Assuming the probability distribution of redshifts for optical/NIR-dark Herschel-faint galaxies derived with magphys+photoz, we are able to derive the median redshift of secure ALCS sources above the given 1.15 mm flux density cuts (i.e., zmed( >f1150); magenta circles). The uncertainty of photometric redshift is propagated into the uncertainty of zmed( >f) through a Monte Carlo sampling of zphot likelihood.
The median redshifts of secure ALCS sources decrease from zmed = 2.40 ± 0.29 at f1150 >1 mJy to zmed = 2.04 ± 0.12 at f1150 >0.1 mJy, where our survey is ∼50% complete given the depth and median lensing magnification. We also perform a K-S test for the redshift distributions of ALCS and ASPECS sources above 0.1 mJy, and no obvious difference can be found (p-value = 0.64). For the spectroscopically confirmed sample, the decrease of median redshift is not conspicuous because of a smaller sample size (zmed = 1.71 ± 0.87 at >1 mJy to zmed = 1.60 ± 0.21 at >0.1 mJy). We note that a higher-redshift assumption (e.g., zmed ∼ 6) of optical/NIR-dark Herschel-faint galaxies will not change our measurements of zmed( >f) despite a larger standard error. We also compute the median redshifts of ALCS sources in logarithmic flux density bins from 0.1 to 2 mJy (bin size is 0.1 dex), and the null hypothesis that there is no monotonic relation between zmed and f1150 can be ruled out (p-value = 0.03, computed from Spearman's rank correlation coefficient ρ = 0.56).
Further compared with previous 1.1–1.2 mm surveys of SMGs (Michałowski et al. 2012; Yun et al. 2012; Brisbin et al. 2017; Dunlop et al. 2017; Miettinen et al. 2017; Aravena et al. 2020; Gómez-Guijarro et al. 2022), the derived zmed( >f1150) function suggests an increasing fraction of z ≃ 1 − 2 galaxies at f1150 < 1 mJy (also shown with ASPECS and the semiempirical model presented in Popping et al. 2020). A linear fitting to the ![${z}_{\mathrm{med}}[\gt \mathrm{log}({f}_{1150})]$](https://content.cld.iop.org/journals/0004-637X/932/2/77/revision1/apjac6e3fieqn12.gif) measurements suggests that the positive correlation is significant ( >5σ). We note that zmed( >f1150) below 0.5 mJy was poorly probed with previous surveys because of either limited volume (ASPECS-like) or relatively shallower depth (e.g., GOODS-ALMA and single-dish surveys). Similar zmed( >f) trends were also reported at 870 μm (Ivison et al. 2007; Stach et al. 2019; Simpson et al. 2020; Birkin et al. 2021; Chen et al. 2022).
measurements suggests that the positive correlation is significant ( >5σ). We note that zmed( >f1150) below 0.5 mJy was poorly probed with previous surveys because of either limited volume (ASPECS-like) or relatively shallower depth (e.g., GOODS-ALMA and single-dish surveys). Similar zmed( >f) trends were also reported at 870 μm (Ivison et al. 2007; Stach et al. 2019; Simpson et al. 2020; Birkin et al. 2021; Chen et al. 2022).
The overall zmed( >f1150) function obtained with the main ALCS sample is lower than that predicted by the shark semianalytic model presented in Lagos et al. (2020; the offset is Δz ∼ − 0.4) but very close to that empirically modeled by Casey et al. (2018; Δz ∼ 0.1) assuming a negligible contribution (<10%) of SMGs to the cosmic SFR density at z >4, also known as the "dust-poor" scenario. Nevertheless, the observed zmed( >f1150) of our sample is much lower than that of the "dust-rich" scenario modeled by Casey et al. (2018, Δz ∼ −0.7), in which SMGs dominate the star formation ( ∼90%) at z >4. This may suggest that the majority of cosmic star formation at z >4 will be hosted in an unobscured environment, similar to the conclusions drawn in Dudzevičiūtė et al. (2020), Bouwens et al. (2020), Casey et al. (2021), and Zavala et al. (2021). However, we note that the decreasing obscured fraction of cosmic SFR density at z >4 cannot be considered as the unique cause of positive zmed( >f1150) relation. Other scenarios, e.g., a steep faint-end slope of dust mass function at z = 1 ∼ 2, can lead to a similar zmed( >f1150) function to that observed. Detailed characterization of IR luminosity function and cosmic SFR density evolution will be presented in a future work.
6.3. Statistics of Intrinsic (Source-plane) Properties
We study the distribution of the intrinsic SFRs (total SFR derived by magphys and corrected for lensing magnification) for ALCS sources in Figure 13. For all ALCS sources in the main sample (excluding cluster member galaxies and including Herschel-faint galaxies), the 16th, 50th, and 84th percentiles of the distribution are 40, 94, and 178 M⊙ yr−1, respectively, slightly larger than those of the GOALS sample (16th, 50th, and 84th percentiles of SFR as 25, 45, and 175 M⊙ yr−1, respectively; Armus et al. 2009; Howell et al. 2010), which is mostly composed of LIRGs in the local universe. Herschel-detected sources in the secondary sample exhibit LIRG-like SFRs with 16th, 50th, and 84th percentiles of the distribution of 10, 25, and 97 M⊙ yr−1, respectively.
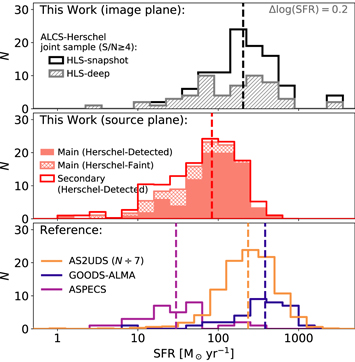
Figure 13. Stacked histograms of observed (top panel) and intrinsic SFRs (middle panel) of ALCS sources. In the top panel, we show the image-plane SFR distributions of sources in the ALCS-Herschel joint sample at S/NALMA ≥ 4 detected in both the "deep" mode (hatched gray bars) and "snapshot" mode (solid black steps). In the middle panel, we show the source-plane (intrinsic) SFR distributions of Herschel-detected sources in the main sample (shallow red filled bars), Herschel-faint sources (hatched bars), and Herschel-detected sources in the secondary sample (solid red steps). Cluster member galaxies are not included. We also show the SFR distributions of ALMA sources reported by AS2UDS (Dudzevičiūtė et al. 2020; orange steps, scaled by a factor of 1/7 for the purpose of displaying), GOODS-ALMA (Franco et al. 2020; blue steps), and ASPECS (Aravena et al. 2020; purple steps) in the bottom panel. The vertical dashed line in each panel indicates the median SFR of each sample. The bin size is  .
.
Download figure:
Standard image High-resolution imageWe also compare the intrinsic SFRs with those of ALMA sources reported by AS2UDS (707 SMGs at zmed = 2.6; Stach et al. 2019; Dudzevičiūtė et al. 2020), GOODS-ALMA (35 sources at zmed = 2.7 studied in Franco et al. 2020; note that the SFRs are recomputed assuming a Chabrier 2003 IMF), and ASPECS survey (32 sources in the main sample at zmed = 1.8; Aravena et al. 2020; González-López et al. 2020). Although the SFR distribution is similar in the image plane (lensing uncorrected), the median source-plane SFR (intrinsic) of ALCS sources is lower than that of conventional SMGs (i.e., f >1 mJy at 850 μm) in the AS2UDS sample by a factor of ∼3 (median SFR = 236 ± 8 M⊙ yr−1; although 92 sources in the AS2UDS sample are at <100 M⊙ yr−1 with a median redshift of 2.0 ± 0.1). Below 30 M⊙ yr−1, which is the median SFR of 32 sources in the main ASPECS sample down to a fidelity of 50%, our sample contains more sources than ASPECS (N = 16), including 11 Herschel-detected and ∼10 Herschel-faint sources at S/N ≥ 5, as well as 12 tentative sources in the secondary sample. Because of the same software (magphys) and SFR tracer (FIR) being used, these comparisons are fair. The median ratio between SFR and LIR is found to be  for both the main samples of ALCS and ASPECS, which is only offset from the conversion factor in Kennicutt & Evans (2012) by 0.1 dex (assuming Chabrier IMF). We also note that the ASPECS sample presented by Aravena et al. (2020) did not enforce any Herschel detection, and no SPIRE flux density information was given because of blending issues, making it difficult to directly and reliably constrain the dust temperature from the FIR SED. This highlights the uniqueness of our ALCS-Herschel joint sample as the probe of (sub-)LIRG population at z ≲ 2.
Figure 14 shows the distribution of intrinsic IR luminosity and SFR as functions of redshift, highlighting the less vigorous star formation among the ALCS sources compared with unlensed SMGs (Dudzevičiūtė et al. 2020). We calculate the nominal detection limits of infrared galaxies in the ALMA (>0.3 mJy at 1.15 mm) and Herschel ( >2σ in the "deep" mode; ≳5 mJy) bands assuming a ULIRG template at LIR = 1012 L⊙ (Rieke et al. 2009). We find that the intrinsic luminosities of 29% (37%) of sources in the ALCS-Herschel joint sample are lower than the nominal detection limit of Herschel (ALMA). This demonstrates the benefit of a sky survey in lensing cluster fields, especially for Herschel because the lensing magnification will allow us to extract and study sources below the nominal confusion noise limit.

Figure 14. Intrinsic IR luminosity (left) and SFR (right) of ALCS sources vs. redshift, including all sources in the main sample (Herschel-detected sources and Herschel-faint galaxies with zspec or HST-derived zphot; shown as squares) and Herschel-detected sources in the secondary sample (downward-pointing triangles). Spectroscopically confirmed sources are shown with filled black symbols, and the open symbols denote zphot-only ones. The stacked optical/NIR-dark Herschel-faint sources (Section 4.3) are shown as the filled red squares. Vertical bars indicate the logarithmic magnification ( ) corrected for each source. In the left panel, we plot the detection limit of ALMA (f >0.3 mJy) and Herschel (S/N >2, f ≳ 5 mJy) in the "deep" mode without lensing magnification, assuming a ULIRG spectral template (LIR = 1012
L⊙ and Tdust ∼ 40 K; Rieke et al. 2009). ALMA-faint Herschel sources and Herschel-faint galaxies that are not included in Table C2 (ALCS-Herschel joint sample) are mostly detected in the shaded green and red regions, respectively. In the right panel, we plot the SFRs of MS galaxies as a function of redshift at fixed stellar masses of 1011 and 1010.6
M⊙ (dotted and dashed line; Speagle et al. 2014). The 1σ dispersion of SFRMS (∼0.3 dex) at Mstar = 1010.6
M⊙ is shown as the filled gray region. ALMA sources reported by AS2UDS (Dudzevičiūtė et al. 2020; orange crosses) and ASPECS (Aravena et al. 2020; purple diamonds) are also plotted for comparison. The typical uncertainties of redshifts, LIR, and SFR are shown to the left of the lower right legends.
) corrected for each source. In the left panel, we plot the detection limit of ALMA (f >0.3 mJy) and Herschel (S/N >2, f ≳ 5 mJy) in the "deep" mode without lensing magnification, assuming a ULIRG spectral template (LIR = 1012
L⊙ and Tdust ∼ 40 K; Rieke et al. 2009). ALMA-faint Herschel sources and Herschel-faint galaxies that are not included in Table C2 (ALCS-Herschel joint sample) are mostly detected in the shaded green and red regions, respectively. In the right panel, we plot the SFRs of MS galaxies as a function of redshift at fixed stellar masses of 1011 and 1010.6
M⊙ (dotted and dashed line; Speagle et al. 2014). The 1σ dispersion of SFRMS (∼0.3 dex) at Mstar = 1010.6
M⊙ is shown as the filled gray region. ALMA sources reported by AS2UDS (Dudzevičiūtė et al. 2020; orange crosses) and ASPECS (Aravena et al. 2020; purple diamonds) are also plotted for comparison. The typical uncertainties of redshifts, LIR, and SFR are shown to the left of the lower right legends.
Download figure:
Standard image High-resolution imageSources whose observed flux densities are below either of the ALMA or Herschel detection thresholds are excluded from the ALCS-Herschel joint sample (Table C2). These sources are referred to as ALMA-faint Herschel sources (Section 3.2) or Herschel-faint galaxies (Section 4.3; also included in Figure 14) in our study. Based on the left panel of Figure 14, we find out that the ALMA-faint Herschel sources are likely distributed at z ≃ 0 − 2, consistent with the typical redshifts of Herschel sources detected in the Frontier Fields (R16). ALCS sources without secure Herschel detection primarily reside at z ≳ 3, consistent with the redshifts of Herschel-faint galaxies presented in Section 4.3.
We also find that ∼77% of ALCS sources (excluding cluster member galaxies) host a lower SFR than the star formation "main sequence" (MS) at a fixed stellar mass of Mstar = 1011 M⊙ (Speagle et al. 2014). Assuming that the majority of ALCS sources are on the MS (e.g., Aravena et al. 2020; Sun et al. 2021b), this suggests a lower intrinsic stellar mass than unlensed SMG samples in the literature (e.g., median Mstar = 1011.1 M⊙ in Dudzevičiūtė et al. 2020). The median stellar mass is likely around 1010.6±0.2 M⊙ based on a comparison with the MS across z ≃ 1 − 4 (Speagle et al. 2014), which will be further analyzed and constrained by a future work from the collaboration. The 1σ scattering of measured SFRs around the SFRMS(Mstar = 1010.6 M⊙) is 0.4 dex.
6.4. Dust Temperature versus IR Luminosity
We study the relation between the dust temperature and intrinsic IR luminosity of sources in the ALCS-Herschel joint sample as shown in the left panel of Figure 15. Sources with redistributed Herschel fluxes (Section 3.3) are considered only once among those in each blended group. We also compare our sample with a variety of galaxies, including nearby galaxies (KINGFISH sample; Skibba et al. 2011; Hunt et al. 2015), local (U)LIRGs (GOALS sample; Díaz-Santos et al. 2017), low-redshift LIRGs (HerMES/PEP sample at z ≲ 1; Symeonidis et al. 2013), 850 μm selected SMGs at zmed = 2.6 (AS2UDS sample; Dudzevičiūtė et al. 2020), 450 μm selected SMGs at zmed = 1.8 (STUDIES sample; Lim et al. 2020), and galaxy-lensed SMGs at zmed = 3.9 (SPT sample; Spilker et al. 2016; Strandet et al. 2016; Reuter et al. 2020).
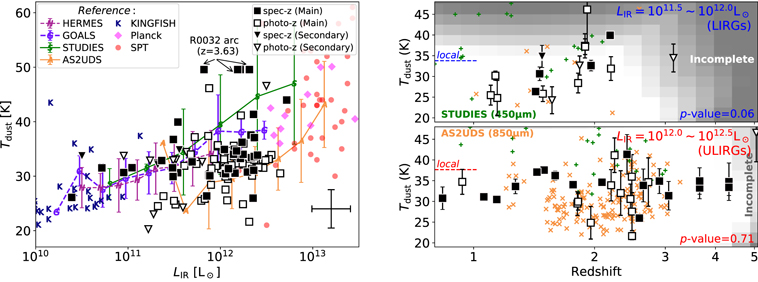
Figure 15. Left: dust temperature vs. intrinsic IR luminosity of sources in the ALCS-Herschel joint sample. Symbols of ALCS sources are the same as those in Figure 14, and the typical uncertainty is shown in the lower right corner. We also compare our sample with 850 μm selected SMGs (AS2UDS sample at zmed = 2.6; Dudzevičiūtė et al. 2020), 450 μm selected SMGs (STUDIES sample at zmed = 1.8; Lim et al. 2020), lensed SMGs (SPT sample at zmed = 3.9; Spilker et al. 2016; Strandet et al. 2016; Reuter et al. 2020; Planck's dusty GEMS sample at zmed = 2.9; Cañameras et al. 2015, 2018), low-redshift (z ≲ 1) LIRGs (HerMES/PEP sample; Symeonidis et al. 2013), local (U)LIRGs (GOALS sample; Díaz-Santos et al. 2017), and nearby galaxies (KINGFISH sample; Skibba et al. 2011; Hunt et al. 2015). Symbols of the reference sample are labeled in the legend in the upper left corner. Right: dust temperature vs. redshift of ALCS-Herschel sources in the intrinsic IR luminosity bins of 1011.5–1012 L⊙ (i.e., LIRGs; top) and 1012–1012.5 L⊙ (i.e., ULIRGs; bottom). Note that we only consider sources with either zspec or accurate HST zphot, and therefore the uncertainty of Tdust for each source is less than 20%. The p-value of Spearman's rank correlation is shown in the lower right corner of each panel, suggesting no conspicuous evolution of Tdust for the ULIRG bin but a tentative redshift dependence for the LIRG bin. Shaded gray regions indicate the Tdust − z space in which the samples are incomplete assuming 16th percentile lensing magnification (μ = 1.8), where the sources are not included for p-value calculation. The gradation in gray scale indicates the incompleteness from the highest to lowest LIR in each luminosity bin. The 450 μm selected SMGs (STUDIES sample; Lim et al. 2020; green plus signs) and 850 μm selected SMGs (AS2UDS sample; Dudzevičiūtė et al. 2020; orange crosses) with relatively accurate Tdust measurements (uncertainty <15%) are also shown for comparison. The median Tdust of local galaxies in the GOALS sample (Díaz-Santos et al. 2017) is shown as the horizontal short-dashed line in each bin.
Download figure:
Standard image High-resolution imageThe median dust temperature is 32.0 ± 0.5 K for the ALCS-Herschel joint sample (with or without FIR-zphot galaxies included). Spectroscopically confirmed sources have a slightly higher median dust temperature (33.6 ± 0.9 K) than that of sources without zspec values (31.9 ± 0.5 K). We identify a weak positive LIR–Tdust relation as  , where the units of LIR and Tdust are L⊙ and K, respectively. Such a weak LIR–Tdust relation (Spearman's ρ = 0.22, p-value = 0.03; uncertainties of Tdust are considered) is not consistent with the strong relations drawn from most of the high-redshift reference samples (see also Burnham et al. 2021). It is, however, consistent with some cosmological simulation results, including Liang et al. (2019).
We argue that a weak observed LIR–Tdust relation is a consequence of an inhomogeneous LIR(Tdust) selection threshold caused by the lensing effect. The LIR–Tdust relation is a joint effect of both physics (the Stefan–Boltzmann law) and selection. If lensing magnification is not applied, the detection threshold of LIR at each given redshift and millimeter flux density (e.g., z = 2 and f1150 = 0.3 mJy) will be exactly a monotonic function of Tdust (e.g., Lim et al. 2020). Combined with the selection bias toward high-LIR and high-Tdust sources at higher redshifts in the Herschel bands, a positive LIR–Tdust relation could be identified. In the image plane, we do find a positive μ LIR–Tdust correlation at 4σ significance. However, with the lensing magnification, we are able to detect sources with lower LIR at given Tdust inhomogeneously, leading to a weaker LIR–Tdust relation in the source plane. This is also seen with the strongly lensed SPT sources (Spilker et al. 2016; Reuter et al. 2020), where the significance of LIR–Tdust relation is also around 2σ, despite that SPT sources are far more luminous. We also note that a strong LIR–Tdust relation can be identified for the joint sample of ALCS and SPT. This is because the sources of two surveys are selected in distinct ranges of IR luminosities, and the increase of Tdust over a wider range of LIR becomes significant enough (T ∝ L0.25 R−0.5 according to the Stefan–Boltzmann law).
We find that at an intrinsic IR luminosity between 1011 and 1012
L⊙ (i.e., LIRGs;  for 16th, 50th, and 84th percentiles of the redshift distribution) the dust temperatures of ALCS sources resemble those of local analogs (Díaz-Santos et al. 2017) and low-redshift LIRGs selected by Herschel/SPIRE in cosmological deep fields (Symeonidis et al. 2013). This indicates no or weak evolution of the dust temperature of LIRG-like galaxies from z ∼ 2 to the local universe, consistent with the conclusion made based on lensed HLS sources at zmed = 1.9 on the ΣIR–Tdust plane (Sun et al. 2021b).
At LIR ≳ 1012
L⊙, ALCS sources ( for 16th, 50th, and 84th percentiles of the redshift distribution) show lower dust temperatures than those of local ULIRGs, resembling 850 μm selected SMGs at zmed = 2.6 (AS2UDS sample; Dudzevičiūtė et al. 2020) except for one warm outlying system (R0032 lensed arc at z = 3.63, Tdust ∼ 50 K; Figure 5 and Dessauges-Zavadsky et al. 2017). As a result, the difference in Tdust between LIRGs and ULIRGs in the ALCS-Herschel joint sample at z ≳ 1 is not significant, which is reflected by the weak slope of the LIR–Tdust relation. Previous works have reported a lower dust temperature or larger optical depth in z ≃ 1 − 3 SMGs compared to their local analogs (e.g., Symeonidis et al. 2009, 2013; Hwang et al. 2010; Swinbank et al. 2014). As also pointed out by a few of these studies, the high IR luminosity with relatively low dust temperature is likely caused by a larger size of the star-forming region in SMGs (Re = 1 ∼ 2 kpc, e.g., Ikarashi et al. 2015; Simpson et al. 2015; Hodge et al. 2016; Rujopakarn et al. 2016; Fujimoto et al. 2017; Elbaz et al. 2018; Gullberg et al. 2019; Lang et al. 2019; Sun et al. 2021b; Gómez-Guijarro et al. 2022), in contrast to the compact size often seen in local ULIRGs (e.g., ∼0.1 kpc in Arp 220; Soifer et al. 2000; Barcos-Muñoz et al. 2017; Sakamoto et al. 2017).
We further study the redshift evolution of dust temperature in the IR luminosity bins of 1011.5 − 1012 L⊙ (LIRGs) and 1012–1012.5 L⊙ (ULIRGs). Because 84% of ALCS sources have lensing magnification factors greater than 1.8, our joint sample is ≳80% complete for galaxies in the LIRG bin at z ≲ 2.5 and Tdust ≲ 35 K and galaxies in the ULIRG bin at z ≲ 4 and Tdust ≲ 45 K. The right panel of Figure 15 shows the dust temperatures versus redshifts of galaxies in the two LIR bins, with the incomplete region on the Tdust–z plane visualized with gray shading. Note that we only include galaxies with uncertainties of ΔT/T less than 20%, which only consist of sources with zspec or accurate HST zphot.
To test the existence of any monotonic redshift evolution of Tdust, we compute the Spearman's rank correlation coefficient and p-value for sources within the redshift ranges of high completeness. A weak positive Tdust(z) relation can be tentatively drawn for sources in the LIR = 1011.5–1012 L⊙ bin (p-value = 0.06), with sources at z ≲ 2 showing lower Tdust than that of local LIRGs (Díaz-Santos et al. 2017). We argue that the selection bias against low-redshift sources with warm dust temperatures (Tdust ≳ 35 K; discussed in Section 6.1) is likely the cause of this weak Tdust(z) relation.
We note that a similar trend is also seen with Symeonidis et al. (2013) for galaxies with LIR = 1011.6–1011.8 L⊙ at z < 1, and a positive Tdust(z) trend has been suggested by certain stacking analyses (e.g., Magnelli et al. 2014; Schreiber et al. 2018; Simpson et al. 2019) and simulations (e.g., Liang et al. 2019; also Lagos et al. 2020, but a weak Tdust(z) evolution). However, the samples used by most of the stacking analyses are stellar mass selected, which are different in total SFR from LIR- or Mdust-selected samples obtained with submillimeter/millimeter surveys. This means that the evolution of Tdust(z) at fixed stellar mass can be a combined effect of the weak evolution of the LIR–Tdust relation and strong evolution of star-forming MS (i.e., increasing SFR/Mstar and thus LIR/Mstar toward higher redshifts; see also a recent study by Drew & Casey 2022). The positive Tdust(z) trend is not seen in 450/850 μm selected SMGs in the AS2UDS and STUDIES samples (Dudzevičiūtė et al. 2020, 2021; Lim et al. 2020).
For ULIRGs in the bin of LIR = 1012–1012.5 L⊙, no redshift evolution of Tdust can be identified (p-value = 0.71). A similar conclusion can also be drawn with the STUDIES and AS2UDS SMGs with relatively accurate Tdust measurements (uncertainty <15%; typically requires ≥1-band SPIRE detection) in this LIR bin.
6.5. Gas Depletion Timescale
Assuming a canonical gas-to-dust mass ratio (GDR) of δGDR = 100, we can estimate a median gas depletion timescale for sources in the ALCS-Herschel joint sample as  Myr (error bar denotes 1σ dispersion). Sources with higher Tdust generally show shorter tdep (equivalently higher star-forming efficiency, SFE =SFR/Mgas). For sources only with FIR zphot, their dust temperatures are close to the peak of prior Tdust distribution as assumed by magphys, and therefore the tdep is nearly constant. Despite such a degeneracy, the derived median tdep does not change significantly if we exclude sources without zspec (166 ± 25 Myr) or HST zphot (219 ± 30 Myr) from the statistics. We further note that tdep is a conserved quantity independent of the lensing magnification effect.
The derived tdep of our sample is broadly consistent with those derived with the AS2UDS sample ( Myr; Dudzevičiūtė et al. 2020), ASPECS main sample (
 Myr; Aravena et al. 2020) and HLS bright lensed source sample (
 Myr; Sun et al. 2021b) using the same method (i.e., δGDR = 100 with Mdust derived from magphys SED modeling). Although the requirement of Herschel detections will result in a selection bias toward sources with higher Tdust and shorter tdep, the use of Herschel data provides characterization of obscured SFR and tdep in higher precision.
Figure 16 shows the gas depletion timescale as a function of redshift for sources in the ALCS-Herschel joint sample. We also compare ALCS sources with the ASPECS main sample (Aravena et al. 2020), AS2UDS (Dudzevičiūtė et al. 2020), GOODS-ALMA (Franco et al. 2020), and PHIBSS (Tacconi et al. 2018) across comparable redshift ranges. The best-fit models of tdep(z) at Mstar = 1010.6 M⊙ and MS SFR (Speagle et al. 2014), based on the prescriptions of Scoville et al. (2017), Tacconi et al. (2018), and Liu et al. (2019), are also plotted for comparison. Sources in our sample exhibit a shorter depletion timescale than the model predictions. This is caused by the IR-selection nature (i.e., favoring sources above the star-forming MS with higher LIR and Tdust) and potentially low-Tdust assumptions for single-band millimeter continuum sources in previous studies (e.g., 25 K in Scoville et al. 2017). Additionally, δGDR is observed to be a function of metallicity (e.g., Leroy et al. 2011; δGDR ∼ 200 at half-solar metallicity), which could introduce further uncertainty to Mgas and tdep.
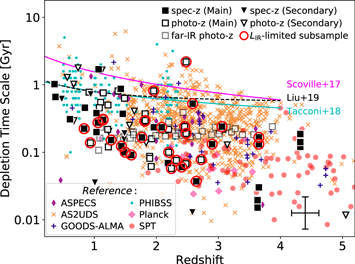
Figure 16. Molecular gas depletion timescale (tdep = δGDR Mdust/SFR) of sources in the ALCS-Herschel joint sample as a function of redshift. The typical uncertainty is shown in the lower right corner. Symbols are the same as those in Figure 14, but we de-emphasize FIR-zphot sources with semitransparent symbols to address the degeneracy between Tdust priors and tdep. Sources in the LIR-limited ULIRG subsample at z ≃ 1 − 4, where ALMA and SPIRE detections are ≳80% complete (see Section 6.4 and the lower right panel of Figure 15), are highlighted with red open circles, and no redshift dependence of tdep can be identified. We also plot sources in the ASPECS main sample (Aravena et al. 2020; purple diamonds), AS2UDS (Dudzevičiūtė et al. 2020; orange crosses), GOODS-ALMA (Franco et al. 2020; blue plus signs), PHIBSS (Tacconi et al. 2018; cyan circles), Planck's dusty GEMs (Cañameras et al. 2018; pink diamonds), and the SPT sample (Reuter et al. 2020; shallow red circles) for comparisons. The tdep(z) relations based on the prescriptions of Scoville et al. (2017), Tacconi et al. (2018), and Liu et al. (2019) are shown with magenta, cyan, and dashed black lines, respectively, assuming Mstar = 1010.6 M⊙ and an MS SFR.
Download figure:
Standard image High-resolution imageAlthough a declining trend of tdep toward higher redshift can be identified, we argue that this is a selection effect of sources with higher LIR and Tdust toward higher redshift. If we restrict the sample to an intrinsic IR luminosity of 1012–1012.5 L⊙ at z ≃ 1 − 4, where the ALMA and Herschel/SPIRE detections are ≳80% complete (Section 6.4 and the lower right panel of Figure 15), we find no significant redshift dependence of tdep (the p-value of Spearman's rank correlation is 0.21). This is consistent with the conclusion of Dudzevičiūtė et al. (2020) drawn upon the LIR-limited sample with both ALMA and SPIRE detections.
6.6. Dust Temperature of a [C ii] Emitter at z = 6.07
R0600-ID164 is a [C ii]-emitting lensed arc at z = 6.072 discovered blindly by the ALCS (named RXC J0600–2007 z6.1/z6.2 in Fujimoto et al. 2021). Laporte et al. (2021) reported the ALMA dust continuum detection of this source (S/N = 4.84 on the 2''-tapered map). Although this source is not detected in any Herschel band, the upper limits of flux densities at 250–500 μm can be used to constrain its dust temperature.
Figure 17 displays the observed FIR SED of R0600-ID164 before lensing magnification correction (red open circles; upper limits are at 3σ). We compare the SED with MBB spectral templates at intrinsic Tdust = 50 − 125 K with the CMB effects considered following the prescription of da Cunha et al. (2013). Based on the dust mass, dust continuum size reported in Laporte et al. (2021), and dust absorption coefficient adopted in Section 4.1, we find a low dust mass surface density of (6 ± 3) × 106 M⊙ kpc−2. Therefore, the optical depth of dust continuum is on the order of unity at λthick ≲ 30 μm in the rest frame. The dust emissivities are assumed as β = 1.6 and 2.0. We also compare R0600-ID164 with galaxies at z ≃ 6 − 7 with normal dust temperatures (40–50 K; shown as green circles) confirmed with ALMA continuum detections in two bands at least, including J1211–0118, J0217–0208 (z = 6.03 and 6.20, respectively; Harikane et al. 2020), A1689-zD1 (z =7.13; Watson et al. 2015; Knudsen et al. 2017; Inoue et al. 2020; Bakx et al. 2021), and B14–65666 (z = 7.15; Hashimoto et al. 2019; Sugahara et al. 2021).

Figure 17. Rest-frame FIR SED of R0600-ID164 (red open circles), a [C ii]-emitting lensed arc at z = 6.07 blindly discovered with the ALCS (Fujimoto et al. 2021; Laporte et al. 2021). MBB spectra at Tdust = 40−120 K (with dust emissivity β = 1.6 and 2.0 as dashed and solid lines) are plotted for comparison. Compared with the MACS0416 Y1 (open black squares; Bakx et al. 2020) with unusually warm dust temperature (Tdust >80 K) and/or steep dust emissivity index (β >2), we are able to rule out such a scenario with Herschel/SPIRE nondetections. SEDs of galaxies at z ≃ 6 − 7 with normal dust temperature (40–50 K; Hashimoto et al. 2019; Harikane et al. 2020; Bakx et al. 2021) are shown as green circles. Note: all SEDs of galaxies in the literature are scaled to the same flux density as R0600-ID184 at 160 μm in the rest frame. Upper limits are at 3σ.
Download figure:
Standard image High-resolution imageBakx et al. (2020) showed that MACS0416 Y1, a lensed galaxy at z = 8.31 (black open squares in Figure 17; also Tamura et al. 2019), exhibits abnormally warm dust temperature (Tdust >80 K, 90% confidence) and/or steep dust emissivity index (β >2). With the three-band SPIRE flux density upper limits, we calculate the χ2 of nondetections assuming a Tdust = 80 K, β = 2.0, and λthick = 30 μm dust continuum model. The derived χ2 is 6.6 (reduced  ), indicating that such a model can be ruled out at >90% confidence level. Although assuming lower dust emissivity and longer λthick will lead to a smaller χ2, we can draw the conclusion that the Tdust and β of R0600-ID164 are not as extreme as those observed for MACS0416 Y1. However, we also note that the differential lensing effect seen around the caustic line (μ = 30 − 160; Fujimoto et al. 2021) may introduce further uncertainty on the dust temperature constraint.
7. Summary
We present an ALMA-Herschel joint study of 1.15 mm continuum sources detected by the ALCS, an ALMA Cycle 6 large program (PI: Kohno) dedicated for surveying intrinsically faint millimeter sources with the assistance of gravitational lensing. All of the 33 ALCS cluster fields have been observed by Herschel/SPIRE at 250, 350, and 500 μm; 18 of them were observed down to confusion-limited noise levels and have high-quality Herschel/PACS 100 and 160 μm coverages (i.e., in the "deep" mode). We conducted PSF flux extraction for all 141 secure ALCS sources (S/Nnat ≥ 5 in the native-resolution maps or S/Ntap ≥ 4.5 in the 2''-tapered maps; the main sample) and 39 tentative ALCS sources with NIR/MIR counterparts (S/Nnat = 4 − 5 and S/Ntap < 4.5; the secondary sample). We then performed FIR SED modeling for 125 of them, which are detected in the Herschel bands at S/N ≥ 2 (the ALCS-Herschel joint sample). The main results are the following:
- 1.A total of 113 out of the 141 secure ALCS sources were detected at >2σ in at least one Herschel band, and 22 out of 39 tentative ALCS sources were detected above the same threshold (Table C1). The single-band Herschel detection rate remains nearly constant as a function of S/NALMA at 100 and 250 μm but is clearly correlated with S/NALMA at longer wavelengths (350 and 500 μm).
- 2.We conducted FIR SED modeling and derived photometric redshifts for 125 Herschel-detected ALCS sources (109 independently) excluding BCGs. Among them, 47 sources are spectroscopically confirmed, and an additional 42 sources have cataloged HST photometric redshifts. Physical properties (LIR, SFR, Mdust, Tdust) of sources in this ALCS-Herschel joint sample are presented in Table C2, derived based on the best available redshifts (zbest).
- 3.A total of 27 lensed ALCS sources in the main sample are not detected in any Herschel band ( < 2σ). Among these Herschel-faint galaxies, 10 sources have cataloged zspec (z = 3.631, 6.072; two sources) or HST zphot (zmed = 2.0 ± 1.0; eight sources). The remaining 17 optical/NIR-dark sources likely reside at zphot =4.2 ± 1.2, hosting a typical IR luminosity of 1011.7±0.3(2.6/μ) L⊙ and obscured SFR of
 M⊙ yr−1 (median lensing magnification factor μmed = 2.6).
 - 4.ALCS sources are cold dust mass selected (Mdust ≳ 108 μ−1 M⊙) across z ≃ 1 − 6. However, at a fixed LIR, the ALMA-Herschel joint selection is biased against galaxies with local-ULIRG-like dust temperature (Tdust ∼ 40 K) at z ≲ 1. This is because (i) the effective survey volume of ALCS at z < 1 is limited for the selection of ULIRGs (LIR >1012 L⊙) and (ii) at given redshift and intrinsic LIR galaxies with higher dust temperatures (i.e., ULIRG-like) will appear fainter in ALMA Band 6, and thus it is more challenging to detect them with the ALCS.
- 5.The 16th, 50th, and 84th percentiles of the redshift distribution of the ALCS sources in the main sample (excluding cluster member galaxies) are 1.15, 2.08, and 3.59. The median redshift of secure ALCS sources is higher than that of sources selected with the deep ASPECS survey (Aravena et al. 2020) but lower than those of sources in shallower ALMA Band 6/7 surveys (e.g., Dudzevičiūtė et al. 2020; Yamaguchi et al. 2020; Gómez-Guijarro et al. 2022). Together with the median redshift as a function of 1.15 mm flux density cut (zmed( >f1150)), this suggests an increasing fraction of z ≃ 1 − 2 galaxies among fainter millimeter sources (∼ 0.1 mJy) and potentially decreasing obscured fraction of cosmic star formation at z >4.
- 6.With a median lensing magnification of, we derive an intrinsic SFR distribution of
M⊙ yr−1 for sources at S/N ≥ 5 (error bar denotes 1σ dispersion). The intrinsic SFRs and IR luminosities of our sample are slightly higher than those of local LIRGs (e.g., GOALS sample; Howell et al. 2010) but lower than those of conventional unlensed SMGs selected at z ∼ 2 − 3 by a factor of ∼3 (Dudzevičiūtė et al. 2020).
- 7.We compare the dust temperatures (modeled by an MBB spectrum with β = 1.8) versus IR luminosities with various galaxy samples from the literature. The median Tdust is 32.0 ± 0.5 K for the ALCS-Herschel joint sample. Our result suggests no or weak evolution of the Tdust of LIRGs (LIR < 1012 L⊙) from z ∼ 2 to the local universe at a given LIR. At LIR ≳ 1012 L⊙, ALCS sources exhibit cooler dust temperature compared with local ULIRGs, and no evolution of Tdust can be found at z ≃ 1 − 4, as has been reported by previous SMG surveys (Dudzevičiūtė et al. 2020).
- 8.Assuming a canonical gas-to-dust ratio of 100, the gas depletion timescales for sources in the ALCS-Herschel sample are found to be Myr. For sources in the IR luminosity range of 1012 − 1012.5
L⊙, no redshift evolution of tdep can be identified across z ≃ 1 − 4.
- 9.The z = 6.072 [C ii]-emitting lensed arc, R0600-ID164, is the highest-redshift source in our ALCS continuum source sample (S/N ≥ 4) confirmed so far (Fujimoto et al. 2021; Laporte et al. 2021). With the Herschel/SPIRE nondetections, we can rule out a MACS0416 Y1-like warm dust temperature (Tdust >80 K; Bakx et al. 2020) at >90% confidence level.


With the lensing magnification provided by massive galaxy clusters, our joint analysis based on ALMA and Herschel observations reveals the population of galaxies at z ≃ 1 − 3 with moderate SFR at a few tens of solar masses per year. ALMA surveys in blank fields would require ∼7 times longer observation times to reach the same depth. In the high-redshift regime, we discover 17 optical/NIR-dark Herschel-faint sources that are likely dust-obscured SFGs at z ∼ 4. These sources are excellent targets for multiwavelength follow-up. Future ALMA spectral line-scan and JWST/NIRSpec observations will provide key insights into the nature of these distant dusty SFGs, revealing their contribution to the obscured cosmic SFR density at z >4.
We thank the anonymous referee for helpful comments. F.S. acknowledges support from the NRAO Student Observing Support (SOS) award SOSPA7-022. F.S. and E.E. acknowledge funding from JWST/NIRCam contract to the University of Arizona, NAS5-02105. K.K. acknowledges support from JSPS KAKENHI grant No. JP17H06130 and the NAOJ ALMA Scientific Research grant No. 2017-06B. I.R.S. acknowledges support from STFC (ST/T000244/1). P.G.P.-G. acknowledges support from Spanish Government grant PGC2018-093499-B-I00. M.O. acknowledges support from JSPS KAKENHI grant Nos. JP18K03693, JP20H00181, JP20H05856, and JP22H01260. A.Z. acknowledges support from the Ministry of Science and Technology, Israel. We thank Ugnė Dudzevičiūtė for sharing the composite SEDs of AS2UDS SMGs. We thank Claudia Lagos for helpful discussion.
This paper makes use of the following ALMA data: ADS/JAO.ALMA#2018.1.00035.L, 2013.1.00999.S and 2015.1.01425S. ALMA is a partnership of ESO (representing its member states), NSF (USA) and NINS (Japan), together with NRC (Canada), MOST and ASIAA (Taiwan), and KASI (Republic of Korea), in cooperation with the Republic of Chile. The Joint ALMA Observatory is operated by ESO, AUI/NRAO and NAOJ. The National Radio Astronomy Observatory is a facility of the National Science Foundation operated under cooperative agreement by Associated Universities, Inc. This work is based on observations made with Herschel. Herschel is an ESA space observatory with science instruments provided by European-led Principal Investigator consortia and with important participation from NASA. This work is based (in part) on observations made with the Spitzer Space Telescope, which was operated by the Jet Propulsion Laboratory, California Institute of Technology under a contract with NASA. This research is based on observations made with the NASA/ESA Hubble Space Telescope obtained from the Space Telescope Science Institute, which is operated by the Association of Universities for Research in Astronomy, Inc., under NASA contract NAS 526555. Some of the data presented in this paper were obtained from the Mikulski Archive for Space Telescopes (MAST) at the Space Telescope Science Institute. The specific observations analyzed can be accessed via Frontier Fields, 40 CLASH, 41 and RELICS. 42
Facility: HST (ACS and WFC3); Spitzer (IRAC); Herschel (PACS and SPIRE); ALMA. -
Software: astropy (Astropy Collaboration et al. 2013), Photutils (Bradley et al. 2019), MAGPHYS (da Cunha et al. 2008, 2015; Battisti et al. 2019).
Appendix A: Quality of the Photometric Results
In order to examine the quality of our PSF photometric results, we first compared our Herschel flux densities (fpsf) with those obtained with aperture photometry (faper) in the left panel of Figure A1. This comparison includes both the ALCS sources and ALMA-undetected Herschel sources extracted at S/N >5 in each Herschel band. We find that the majority of Herschel sources exhibit comparable flux densities obtained through both methods, i.e., faper/fpsf ∼ 1, up to a wavelength of 350 μm (see statistics for each band in the left panel of Figure A1). Because of source blending, a number excess of sources can be found at faper/fpsf >1, especially at longer wavelength (i.e., 500 μm). Such an effect is inevitable for the majority of ALCS sources given the large beam size of 35'' at 500 μm. We then conclude that our flux densities obtained through PSF photometry are not subject to any obvious systematic offset from those by aperture photometry.

Figure A1. Left: ratios of flux densities measured with aperture (faper) and PSF (fpsf) photometry in the five Herschel bands (100–500 μm from top to bottom). All the sources detected in the Herschel images at S/N >5 are shown as the hatched histograms, and the ALCS sources are shown as the filled ones. Dashed black lines indicate the cases where the flux densities obtained through PSF and aperture photometry are identical. The number of sources and the median faper/fpsf ratio (with 1σ standard error) are also shown in each panel for each Herschel band. Right: Herschel flux density ratios of submillimeter sources in Hubble Frontier Fields measured by Rawle et al. (2016) and this work (i.e., both detected and undetected by the ALCS), plotted as a function of S/N in the corresponding Herschel band (S/NHerschel). Symbols are the same as those in Figure 4 and also labeled in the upper right corner. The solid gray line indicates the case in which the two measurements are identical, and the dashed lines indicate the cases of ±10% deviation. The shaded region denotes the 1σ dispersion range of flux ratios for sources detected at any given S/NHerschel.
Download figure:
Standard image High-resolution imageWe also compare our flux density measurements of sources in Frontier Fields with R16. R16 reported 263 secure Herschel detections within the HST/ACS footprints of the six HFF clusters (both central regions and parallel footprints). We cross-match our photometric measurements (fThis; including both ALCS sources and ALMA-undetected Herschel sources) with those of R16 (fR16) allowing a maximum angular separation of 15. The flux density ratios are plotted as a function of Herschel band S/Ns in the right panel of Figure A1. We find a general consistency between the flux densities of these two works (median flux ratio is fR16/fThis = 0.98 ± 0.02) without any conspicuous systematic offset.
To evaluate the accuracy of SPIRE photometry without PACS information, we also experimented with extraction from 250 μm (instead of 100 μm) for the "deep"-mode clusters. The resultant SPIRE flux densities are generally consistent with those extracted using PACS information at the 1σ confidence level.
We also extracted the fluxes of ALCS sources using xid+ (Hurley et al. 2017). xid+ is a prior-based Herschel/SPIRE flux extraction software built on a probabilistic Bayesian framework. The positional prior that we used was the same as described in Section 3, i.e., including both ALCS-detected sources at S/NALMA ≥ 4 and ALMA-undetected Herschel sources. Compared with our iterative extraction procedure, xid+ does not distinguish the priority of input sources.
Figure A2 shows the comparisons of SPIRE flux densities measured by both deblending routines. We observe a general consistency between the flux density estimate using both methods. For ALCS sources in the main sample, the median difference of flux densities estimated with two routines is around 1 mJy in all three bands, and the standard deviations of flux density differences are well predicted by the joint uncertainty of both measurements. We further analyze ALCS sources whose xid+-derived flux densities are different from those extracted iteratively by a factor of >2. The median separation of these sources to their nearest neighbors is found to be 7'' ± 6'', significantly smaller than the typical separation of 14'' ± 10'' for the full sample. Therefore, we conclude that the large photometric discrepancy among these sources is mainly caused by a strong blending effect. With prior ALMA flux density information, an iterative extraction procedure has the potential to enhance the photometric accuracy in crowded lensing cluster fields.
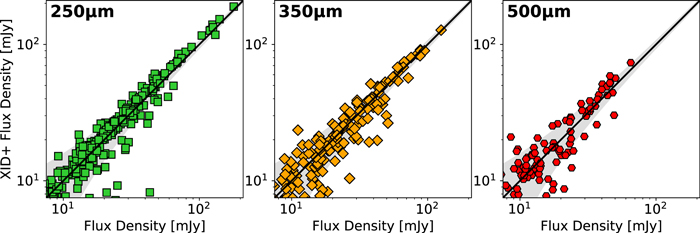
Figure A2. Comparisons of Herschel/SPIRE flux densities, including both submillimeter sources detected and undetected by the ALCS, measured with xid+ (Hurley et al. 2017) and our iterative extraction procedure (Section 3). Comparisons in the SPIRE 250, 350, and 500 μm band are shown in the left, middle, and right panels, respectively. In each panel, the diagonal solid black line indicates identical flux densities measured with the two procedures, and the shaded gray region indicates the expected 1σ dispersion range of flux densities given the depth of data taken in the "snapshot" mode.
Download figure:
Standard image High-resolution imageAppendix B: Postage Stamp Images and FIR SEDs of ALCS Sources
In the online journal, we show the figure sets (Figures B1 and B2) of HST-Spitzer-ALMA postage stamp images and best-fit FIR SED plots of all 125 sources in the ALCS-Herschel joint sample (Table C2).
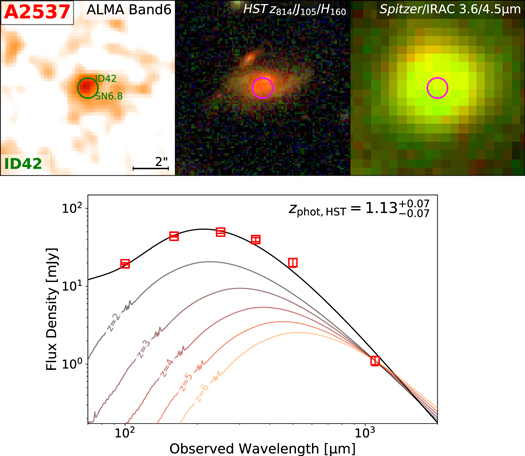
Figure B1.
Top: postage stamp images of A2537-ID42 (S/NALMA = 6.8), one of the 105 sources in the main ALCS-Herschel joint sample. From left to right we show the ALMA Band 6 continuum image, HST F814W/F105W/F160W true color image, and Spitzer/IRAC 3.6/4.5 μm true color image. The galaxy is in the center of each image labeled by green or magenta circles. Other ALCS sources in the field, if they exist, are also labeled out with their S/N and ID noted. A 2 scale bar is plotted in the lower right corner of the ALMA continuum image. Bottom: FIR SED of A2537-ID42. Herschel and ALMA photometric measurements are shown as open red squares (upper limits are at 3σ). The best-fit SED model derived with magphys at zbest is shown as a solid black line. For sources without spectroscopic confirmation (zspec), we also plot the spectral templates of (U)LIRGs (LIR = 1012
L⊙; Rieke et al. 2009) at z = 2 − 6 (normalized to the 1.15 mm flux density) for comparison. The complete figure set (105 images) is available in the online journal. (The complete figure set (105 images) is available.)
Download figure:
Standard image High-resolution image
Figure B2.
Same as Figure B1, but for A383-ID24 (S/NALMA = 4.0), one of the 20 sources in the secondary ALCS-Herschel joint sample. The complete figure set (20 images) is available in the online journal. (The complete figure set (20 images) is available.)
Download figure:
Standard image High-resolution imageIn addition to these, we also show the ALMA-HST-Spitzer postage stamp images of 10 Herschel-faint galaxies that have zspec or cataloged HST zphot (Figure B3) and the remaining 17 Herschel-faint galaxies without zspec or cataloged HST zphot (i.e., optical/NIR-dark; Figure B4).
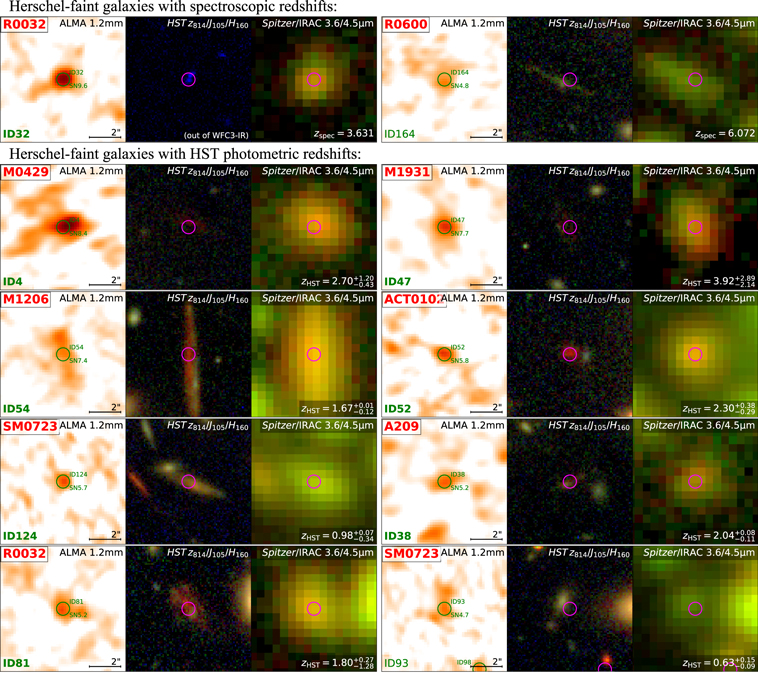
Figure B3. Postage stamp images of 10 Herschel-faint galaxies with either spectroscopic redshifts (R0032-ID32 and R0600-ID164) or HST photometric redshifts (the remaining eight sources). In each category, sources are shown in descending order of ALMA S/N. The layout of these postage stamp images is the same as that in Figure B1. The best available redshift is noted in the lower right corner of the Spitzer/IRAC image.
Download figure:
Standard image High-resolution image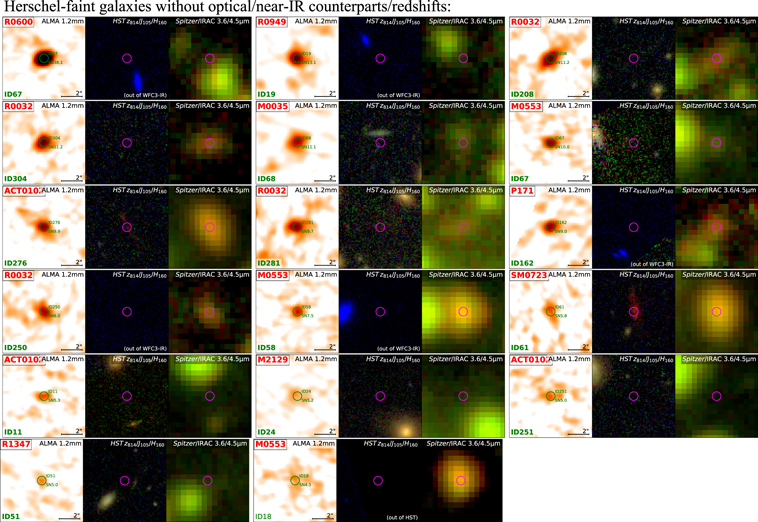
Figure B4. Same as Figure B3, but for 17 Herschel-faint sources without optical/NIR counterparts or cataloged redshifts.
Download figure:
Standard image High-resolution image
Appendix C: Catalogs of Herschel Photometry and Derived Physical Properties
Table C1 presents the Herschel flux density measurements of (i) 141 secure ALCS sources at S/Nnat ≥ 5 or S/Ntap ≥ 4.5 (the main sample) and (ii) 39 tentative ALCS sources at S/Nnat = 4 − 5 and S/Ntap < 4.5 with cross-matched HST or Spitzer/IRAC counterparts within 1'' separation (the secondary sample). Table C2 presents the galaxy properties of 125 ALCS sources that are detected at >2σ in ≥1 Herschel band (i.e., ALCS-Herschel joint sample). Note that BCGs and Herschel-faint galaxies are not included in this table. The definitions of the samples in these two tables are also visualized in Figure 6.
Table C1. Summary of Herschel Photometry
| No. | Name | Coordinates | S/NALMA | Herschel/PACS | Herschel/SPIRE | |||||
|---|---|---|---|---|---|---|---|---|---|---|
| R.A. | Decl. | 100 μm | 160 μm | 250 μm | 350 μm | 500 μm | ||||
| (mJy) | (mJy) | (mJy) | (mJy) | (mJy) | ||||||
| Main Sample (S/Nnat ≥ 5 or S/Ntap ≥ 4.5) | ||||||||||
| 1 | A209-ID38 a | 01:31:53.38 | −13:37:17.4 | 5.2 | <1.5 | <2.3 | <6.4 | <6.6 | <7.4 | |
| 2 | A2163-ID11 | 16:15:49.06 | −06:08:13.9 | 4.6 c | ⋯ | ⋯ | 37.7 ± 5.3 | 24.1 ± 5.2 | <17.2 | |
| 3 | A2537-ID42 | 23:08:24.43 | −02:11:05.5 | 6.8 | 19.5 ± 0.5 | 44.0 ± 0.9 | 49.7 ± 1.9 | 39.8 ± 2.5 | 20.2 ± 2.6 | |
| 4 | A2537-ID49 | 23:08:17.92 | −02:11:12.7 | 5.2 | 33.0 ± 2.5 | 55.9 ± 3.4 | 36.1 ± 4.5 | 30.9 ± 5.5 | 8.2 ± 4.3 | |
| 5 | A2537-ID66 | 23:08:19.68 | −02:11:25.3 | 4.9 | 15.5 ± 0.7 | 20.5 ± 2.6 | 20.3 ± 5.2 | <22.9 | <7.8 | |
| 6 | A2744-ID07 | 00:14:19.12 | −30:22:42.2 | 8.0 | <0.8 | <2.3 | 15.4 ± 6.6 | 18.1 ± 3.7 | 7.7 ± 3.0 | |
| 7 | A2744-ID21 | 00:14:22.09 | −30:22:49.7 | 6.8 | 4.4 ± 1.2 | 13.0 ± 2.1 | 7.1 ± 2.9 | <13.6 | <7.7 | |
| 8 | A2744-ID33 | 00:14:20.40 | −30:22:54.5 | 15.0 | 0.9 ± 0.5 | 2.1 ± 1.4 | 5.5 ± 5.3 | 5.2 ± 4.7 | 15.6 ± 4.4 | |
| 9 | A2744-ID56 | 00:14:17.58 | −30:23:00.6 | 11.9 | 28.3 ± 0.6 | 61.7 ± 1.2 | 64.3 ± 1.9 | 46.6 ± 2.4 | 24.0 ± 2.6 | |
| 10 | A2744-ID81 | 00:14:19.80 | −30:23:07.7 | 26.7 | <1.6 | 4.3 ± 1.8 | 9.8 ± 5.4 | 15.8 ± 4.6 | <15.0 | |
| 11 | A2744-ID319 | 00:14:18.26 | −30:24:47.5 | 14.2 | <1.9 | 7.8 ± 1.3 | 11.7 ± 1.9 | 10.5 ± 3.0 | 9.5 ± 2.6 | |
| 12 | A3192-ID31 | 03:58:50.02 | −29:56:30.8 | 32.6 | ⋯ | ⋯ | 124.9 ± 4.4 | 88.4 ± 4.7 | 40.3 ± 4.6 | |
| 13 | A3192-ID40 | 03:58:51.13 | −29:55:10.9 | 26.0 | ⋯ | ⋯ | 20.0 ± 4.4 | 15.8 ± 5.1 | <20.5 | |
| 14 | A3192-ID131 | 03:58:47.63 | −29:56:33.5 | 11.5 | ⋯ | ⋯ | 12.8 ± 4.0 | 10.0 ± 4.7 | <13.8 | |
| 15 | A3192-ID138 | 03:58:57.13 | −29:54:53.5 | 8.1 | ⋯ | ⋯ | 20.8 ± 4.5 | 12.2 ± 4.4 | <15.4 | |
| 16 | A370-ID18 | 02:39:50.20 | −01:35:42.1 | 12.9 | 1.2 ± 0.5 | 6.1 ± 1.3 | 9.8 ± 6.2 | 17.9 ± 9.2 | <11.5 | |
| 17 | A370-ID31 | 02:39:54.43 | −01:33:36.5 | 5.9 | 34.8 ± 0.6 | 49.1 ± 1.0 | 32.3 ± 1.8 | 17.3 ± 5.4 | <20.9 | |
| 18 | A370-ID103 | 02:39:58.15 | −01:34:24.5 | 6.8 | 8.1 ± 0.5 | 22.7 ± 3.2 | 33.6 ± 10.1 | 27.3 ± 2.8 | 13.0 ± 2.2 | |
| 19 | A370-ID110 | 02:39:56.57 | −01:34:26.3 | 24.9 | 48.8 ± 0.6 | 105.5 ± 0.9 | 108.8 ± 2.8 | 76.7 ± 2.8 | 30.9 ± 2.2 | |
| 20 | A370-ID146 | 02:39:51.44 | −01:34:41.5 | 5.4 | 0.6 ± 0.5 | 5.1 ± 1.4 | 9.5 ± 4.9 | 8.3 ± 3.5 | <5.8 | |
| 21 | A383-ID40 b | 02:48:03.39 | −03:31:44.8 | 34.2 | 14.1 ± 0.6 | 24.0 ± 1.8 | 16.6 ± 2.8 | 7.3 ± 2.7 | <7.7 | |
| 22 | ACT0102-ID11 a | 01:02:59.47 | −49:17:25.4 | 5.3 | ⋯ | ⋯ | <13.6 | <15.0 | <20.5 | |
| 23 | ACT0102-ID22 | 01:03:03.04 | −49:17:11.2 | 7.9 | ⋯ | ⋯ | 6.1 ± 5.3 | 10.2 ± 4.8 | 12.2 ± 5.6 | |
| 24 | ACT0102-ID50 | 01:02:59.40 | −49:16:55.6 | 5.8 | ⋯ | ⋯ | 18.8 ± 4.1 | 12.2 ± 4.4 | 11.0 ± 5.0 | |
| 25 | ACT0102-ID52 a | 01:03:01.47 | −49:16:56.6 | 5.8 | ⋯ | ⋯ | 6.3 ± 4.1 | <15.3 | <20.5 | |
| 26 | ACT0102-ID118 | 01:02:51.09 | −49:15:38.9 | 34.3 | ⋯ | ⋯ | 9.0 ± 5.2 | 14.6 ± 7.3 | 9.0 ± 5.7 | |
| 27 | ACT0102-ID160 | 01:03:00.20 | −49:16:03.7 | 4.9 c | ⋯ | ⋯ | 14.3 ± 3.6 | <12.0 | <20.4 | |
| 28 | ACT0102-ID215 | 01:02:54.92 | −49:15:14.7 | 42.4 | ⋯ | ⋯ | <16.1 | <22.6 | 11.4 ± 3.8 | |
| 29 | ACT0102-ID223 | 01:02:49.24 | −49:15:08.9 | 7.9 | ⋯ | ⋯ | 11.7 ± 3.9 | 14.0 ± 4.7 | 10.6 ± 3.5 | |
| 30 | ACT0102-ID224 | 01:02:55.68 | −49:15:09.1 | 91.8 | ⋯ | ⋯ | 18.4 ± 5.4 | 28.7 ± 7.5 | 28.2 ± 9.4 | |
| 31 | ACT0102-ID241 | 01:02:58.13 | −49:14:56.2 | 5.4 | ⋯ | ⋯ | 6.2 ± 3.4 | 12.0 ± 4.3 | 12.2 ± 4.3 | |
| 32 | ACT0102-ID251 a | 01:02:55.07 | −49:14:19.2 | 5.0 | ⋯ | ⋯ | <14.8 | <15.5 | <20.1 | |
| 33 | ACT0102-ID276 a | 01:02:49.29 | −49:14:38.2 | 9.9 | ⋯ | ⋯ | <14.6 | 6.3 ± 4.0 | <20.1 | |
| 34 | ACT0102-ID294 | 01:02:49.37 | −49:15:05.3 | 19.1 c | ⋯ | ⋯ | 36.0 ± 12.0 | 42.9 ± 14.3 | 32.6 ± 10.9 | |
| 35 | AS1063-ID15 | 22:48:46.58 | −44:30:46.9 | 7.7 c | 6.3 ± 1.0 | 10.4 ± 0.8 | 5.3 ± 3.6 | <25.4 | <27.3 | |
| 36 | AS1063-ID17 | 22:48:47.29 | −44:30:48.2 | 15.5 | 24.0 ± 0.5 | 61.6 ± 0.8 | 62.7 ± 3.6 | 48.4 ± 8.5 | 22.5 ± 9.2 | |
| 37 | AS1063-ID147 | 22:48:41.82 | −44:31:57.5 | 6.0 c | 66.9 ± 0.9 | 98.4 ± 0.9 | 67.8 ± 3.3 | 30.8 ± 5.0 | 7.3 ± 3.2 | |
| 38 | AS1063-ID222 | 22:48:49.06 | −44:32:25.4 | 85.7 | <1.4 | 3.0 ± 0.9 | 10.6 ± 2.6 | 21.8 ± 3.2 | 23.3 ± 2.6 | |
| 39 | M0035-ID41 | 00:35:20.46 | −20:15:35.2 | 7.2 | ⋯ | ⋯ | 8.3 ± 3.6 | <13.4 | <13.7 | |
| 40 | M0035-ID68 a | 00:35:30.76 | −20:15:54.9 | 11.1 | ⋯ | ⋯ | <14.3 | <15.1 | <14.5 | |
| 41 | M0035-ID94 | 00:35:27.24 | −20:16:17.4 | 4.6 c | ⋯ | ⋯ | 23.6 ± 3.4 | <12.8 | <16.7 | |
| 42 | M0159-ID05 | 01:59:51.69 | −08:49:10.1 | 16.0 | ⋯ | ⋯ | 24.0 ± 4.0 | 20.4 ± 4.1 | 10.2 ± 5.4 | |
| 43 | M0159-ID24 | 01:59:47.33 | −08:49:33.2 | 6.3 | ⋯ | ⋯ | 24.1 ± 5.2 | <15.7 | 9.0 ± 6.6 | |
| 44 | M0159-ID46 b | 01:59:49.35 | −08:49:59.0 | 32.8 | ⋯ | ⋯ | 11.7 ± 4.4 | <15.6 | 14.2 ± 5.2 | |
| 45 | M0159-ID61 | 01:59:51.56 | −08:50:13.3 | 5.8 | ⋯ | ⋯ | 14.1 ± 4.7 | <15.6 | <17.8 | |
| 46 | M0257-ID13 | 02:57:11.25 | −23:25:43.6 | 12.2 c | ⋯ | ⋯ | 11.7 ± 4.4 | 13.4 ± 4.5 | 15.1 ± 4.7 | |
| 47 | M0329-ID11 | 03:29:41.76 | −02:10:56.8 | 11.1 | 1.7 ± 0.5 | 1.6 ± 0.8 | <9.2 | <8.6 | <9.7 | |
| 48 | M0416-ID51 | 04:16:06.97 | −24:04:00.0 | 7.1 | 1.8 ± 0.5 | 4.0 ± 0.7 | <9.0 | <7.8 | <9.4 | |
| 49 | M0416-ID79 | 04:16:11.67 | −24:04:19.5 | 5.3 | 1.4 ± 0.5 | 1.1 ± 0.9 | 6.3 ± 2.7 | <7.8 | <9.4 | |
| 50 | M0416-ID117 | 04:16:10.80 | −24:04:47.6 | 15.7 | 3.9 ± 0.5 | 10.4 ± 0.8 | 12.4 ± 2.2 | 9.3 ± 1.9 | 9.8 ± 1.7 | |
| 51 | M0416-ID160 | 04:16:08.83 | −24:05:22.5 | 6.0 | 3.5 ± 0.5 | 5.8 ± 0.8 | 6.0 ± 2.7 | 3.5 ± 2.7 | <9.4 | |
| 52 | M0417-ID46 | 04:17:33.32 | −11:55:03.3 | 48.0 | ⋯ | ⋯ | 45.4 ± 5.8 | 39.0 ± 6.2 | 30.7 ± 5.1 | |
| 53 | M0417-ID49 | 04:17:40.15 | −11:55:00.8 | 36.1 | ⋯ | ⋯ | 43.4 ± 4.7 | 60.6 ± 7.7 | 35.8 ± 5.6 | |
| 54 | M0417-ID58 | 04:17:35.65 | −11:54:53.3 | 30.4 | ⋯ | ⋯ | 11.1 ± 7.3 | 14.8 ± 5.3 | 11.1 ± 5.7 | |
| 55 | M0417-ID121 | 04:17:37.02 | −11:54:19.8 | 20.7 | ⋯ | ⋯ | 10.9 ± 6.3 | 6.9 ± 4.7 | 17.6 ± 5.2 | |
| 56 | M0417-ID204 | 04:17:32.23 | −11:52:39.1 | 4.5 c | ⋯ | ⋯ | 13.8 ± 4.4 | <18.2 | <34.2 | |
| 57 | M0417-ID218 | 04:17:32.01 | −11:52:57.4 | 14.5 | ⋯ | ⋯ | 37.7 ± 5.1 | 44.0 ± 8.9 | 14.9 ± 7.4 | |
| 58 | M0417-ID221 | 04:17:32.48 | −11:53:02.8 | 7.7 | ⋯ | ⋯ | 20.9 ± 1.8 | 14.3 ± 2.9 | 7.3 ± 3.7 | |
| 59 | M0417-ID223 | 04:17:32.55 | −11:53:05.0 | 6.0 | ⋯ | ⋯ | 38.6 ± 3.2 | 26.4 ± 5.3 | 13.6 ± 6.8 | |
| 60 | M0429-ID04 a | 04:29:35.01 | −02:52:39.3 | 8.4 | <0.7 | <2.3 | <9.7 | <9.0 | 5.7 ± 4.1 | |
| 61 | M0429-ID19 b | 04:29:36.03 | −02:53:06.8 | 27.6 | 31.2 ± 0.6 | 44.4 ± 1.1 | 25.5 ± 3.9 | 7.3 ± 5.1 | <10.4 | |
| 62 | M0429-ID27 | 04:29:37.10 | −02:53:35.2 | 6.9 | 4.2 ± 0.5 | 8.8 ± 0.9 | 12.5 ± 2.6 | 5.2 ± 3.5 | 6.3 ± 3.4 | |
| 63 | M0553-ID17 | 05:53:15.40 | −33:41:35.4 | 8.5 | ⋯ | ⋯ | 19.5 ± 4.9 | 12.4 ± 5.7 | <16.4 | |
| 64 | M0553-ID18 a | 05:53:16.75 | −33:41:35.6 | 4.5 c | ⋯ | ⋯ | <14.6 | 5.7 ± 5.7 | <18.7 | |
| 65 | M0553-ID58 a | 05:53:30.18 | −33:41:52.1 | 7.5 | ⋯ | ⋯ | <13.3 | <15.3 | <18.9 | |
| 66 | M0553-ID61 | 05:53:21.49 | −33:41:54.7 | 10.7 | ⋯ | ⋯ | 17.9 ± 4.5 | 15.5 ± 4.6 | <22.6 | |
| 67 | M0553-ID67 a | 05:53:29.30 | −33:41:56.3 | 10.0 | ⋯ | ⋯ | <59.2 | 27.3 ± 22.9 | <18.9 | |
| 68 | M0553-ID133 | 05:53:27.79 | −33:42:16.0 | 39.0 | ⋯ | ⋯ | 119.3 ± 3.1 | 83.7 ± 4.2 | 43.5 ± 6.1 | |
| 69 | M0553-ID190 | 05:53:27.85 | −33:42:30.6 | 67.5 | ⋯ | ⋯ | 179.1 ± 4.7 | 125.6 ± 6.3 | 65.2 ± 9.2 | |
| 70 | M0553-ID200 | 05:53:33.40 | −33:42:31.7 | 5.1 c | ⋯ | ⋯ | 20.6 ± 7.5 | <18.8 | <18.9 | |
| 71 | M0553-ID249 | 05:53:27.63 | −33:42:43.9 | 44.0 | ⋯ | ⋯ | 126.1 ± 3.3 | 88.4 ± 4.4 | 45.9 ± 6.5 | |
| 72 | M0553-ID275 | 05:53:26.05 | −33:42:51.6 | 6.6 | ⋯ | ⋯ | 47.0 ± 4.2 | 38.1 ± 6.0 | 9.6 ± 6.0 | |
| 73 | M0553-ID303 | 05:53:31.98 | −33:43:00.5 | 8.2 c | ⋯ | ⋯ | 79.2 ± 4.5 | 48.7 ± 4.7 | 12.6 ± 4.3 | |
| 74 | M0553-ID355 | 05:53:23.28 | −33:43:16.0 | 12.4 | ⋯ | ⋯ | 12.4 ± 3.8 | 24.1 ± 4.5 | 17.3 ± 4.3 | |
| 75 | M0553-ID375 | 05:53:13.29 | −33:43:21.3 | 8.3 | ⋯ | ⋯ | 18.9 ± 4.7 | 9.9 ± 4.3 | <16.2 | |
| 76 | M0553-ID398 | 05:53:29.87 | −33:43:26.0 | 13.5 | ⋯ | ⋯ | 9.2 ± 4.3 | 10.9 ± 4.4 | 5.0 ± 4.3 | |
| 77 | M1115-ID02 | 11:15:50.69 | 01:30:35.5 | 11.3 | 24.8 ± 3.0 | 38.2 ± 1.8 | 72.8 ± 6.6 | 72.0 ± 4.6 | 49.2 ± 4.6 | |
| 78 | M1115-ID04 | 11:15:52.03 | 01:30:28.2 | 7.6 | 16.5 ± 0.8 | 29.1 ± 0.9 | 35.5 ± 3.2 | 27.7 ± 3.9 | 12.8 ± 3.2 | |
| 79 | M1115-ID34 | 11:15:54.14 | 01:29:56.3 | 16.1 | 0.7 ± 0.5 | 2.5 ± 0.8 | 7.7 ± 3.2 | <8.3 | <9.2 | |
| 80 | M1115-ID36 b | 11:15:51.90 | 01:29:54.9 | 7.5 | 2.8 ± 0.5 | 3.4 ± 0.8 | <10.2 | <8.4 | <7.6 | |
| 81 | M1149-ID77 | 11:49:36.10 | 22:24:24.5 | 5.5 c | 2.2 ± 0.9 | 9.4 ± 3.2 | 15.4 ± 2.1 | 11.5 ± 2.2 | 7.3 ± 3.5 | |
| 82 | M1149-ID229 | 11:49:34.04 | 22:23:16.7 | 4.7 c | 2.3 ± 0.8 | 4.9 ± 1.5 | <15.3 | <6.4 | <7.3 | |
| 83 | M1206-ID27 | 12:06:11.26 | −08:47:43.6 | 7.7 c | 14.2 ± 0.6 | 33.3 ± 6.0 | 26.9 ± 11.1 | 42.6 ± 6.0 | 13.0 ± 4.7 | |
| 84 | M1206-ID54 a | 12:06:15.94 | −08:47:59.4 | 7.4 c | 0.7 ± 0.5 | <2.4 | <11.4 | <9.4 | 3.6 ± 2.6 | |
| 85 | M1206-ID55 | 12:06:10.74 | −08:48:00.6 | 9.2 c | 24.8 ± 0.3 | 44.9 ± 1.2 | 42.2 ± 14.1 | 26.4 ± 1.6 | 11.1 ± 3.5 | |
| 86 | M1206-ID58 b | 12:06:12.15 | −08:48:03.5 | 6.5 c | <0.7 | <2.4 | <11.1 | <9.8 | <10.7 | |
| 87 | M1206-ID60 | 12:06:10.75 | −08:48:05.3 | 10.4 c | 29.7 ± 0.4 | 53.7 ± 1.5 | 50.5 ± 16.8 | 31.6 ± 1.9 | 13.3 ± 4.1 | |
| 88 | M1206-ID61 | 12:06:10.80 | −08:48:08.9 | 8.0 c | 40.6 ± 0.6 | 73.4 ± 2.0 | 69.1 ± 23.0 | 43.3 ± 2.6 | 18.1 ± 5.6 | |
| 89 | M1311-ID27 | 13:11:01.32 | −03:10:33.6 | 9.2 c | 5.8 ± 0.5 | 19.0 ± 1.5 | 28.5 ± 3.0 | 23.3 ± 2.4 | 13.6 ± 2.6 | |
| 90 | M1311-ID33 | 13:11:00.14 | −03:10:42.4 | 8.3 | 1.4 ± 0.5 | 13.8 ± 1.2 | 9.4 ± 3.4 | 10.4 ± 3.0 | 6.8 ± 3.9 | |
| 91 | M1423-ID38 | 14:23:47.01 | 24:04:54.2 | 5.5 | 5.3 ± 0.6 | 9.4 ± 1.2 | 14.4 ± 3.4 | 8.7 ± 3.0 | <7.2 | |
| 92 | M1423-ID50 b | 14:23:47.88 | 24:04:42.4 | 23.1 | 11.3 ± 0.6 | 19.7 ± 1.3 | 22.5 ± 3.4 | 13.8 ± 3.1 | 14.1 ± 2.3 | |
| 93 | M1931-ID41 b | 19:31:49.63 | −26:34:33.2 | 83.3 | 233.6 ± 1.4 | 243.3 ± 1.3 | 121.0 ± 2.8 | 44.7 ± 3.0 | 18.5 ± 3.0 | |
| 94 | M1931-ID47 a | 19:31:52.08 | −26:34:36.4 | 7.7 | <0.7 | <2.9 | <9.2 | <8.5 | <6.9 | |
| 95 | M1931-ID55 | 19:31:48.10 | −26:34:43.4 | 11.6 c | 7.6 ± 0.6 | 13.2 ± 1.0 | 9.3 ± 2.8 | 12.5 ± 3.0 | 4.4 ± 3.0 | |
| 96 | M1931-ID61 | 19:31:49.28 | −26:34:50.9 | 10.5 c | 0.6 ± 0.6 | 2.2 ± 1.2 | 5.3 ± 2.8 | 7.2 ± 3.3 | 6.4 ± 3.4 | |
| 97 | M2129-ID24 a | 21:29:25.28 | −07:41:07.7 | 5.2 c | <0.7 | <2.7 | <9.7 | <9.2 | <8.9 | |
| 98 | M2129-ID46 | 21:29:29.45 | −07:41:31.2 | 6.2 | 4.8 ± 0.5 | 11.1 ± 0.8 | 12.9 ± 2.1 | 8.6 ± 2.9 | <9.1 | |
| 99 | P171-ID69 | 03:12:52.76 | 08:22:45.0 | 19.7 | ⋯ | ⋯ | 11.6 ± 5.4 | 9.8 ± 7.7 | <17.4 | |
| 100 | P171-ID162 a | 03:12:58.70 | 08:23:29.2 | 9.0 | ⋯ | ⋯ | <16.6 | <17.4 | <23.6 | |
| 101 | P171-ID177 | 03:12:55.48 | 08:23:44.0 | 7.3 c | ⋯ | ⋯ | 11.9 ± 4.8 | <21.2 | <21.6 | |
| 102 | R0032-ID32 a | 00:32:09.77 | 18:06:24.5 | 9.6 | ⋯ | ⋯ | 9.0 ± 7.5 | 14.3 ± 8.7 | <23.3 | |
| 103 | R0032-ID53 | 00:32:08.22 | 18:06:40.3 | 11.3 | ⋯ | ⋯ | 21.8 ± 1.9 | 20.4 ± 2.8 | 12.3 ± 3.2 | |
| 104 | R0032-ID55 | 00:32:07.84 | 18:06:46.1 | 18.9 c | ⋯ | ⋯ | 41.6 ± 3.6 | 38.9 ± 5.4 | 23.5 ± 6.1 | |
| 105 | R0032-ID57 | 00:32:07.71 | 18:06:48.8 | 7.5 | ⋯ | ⋯ | 7.4 ± 0.6 | 7.0 ± 1.0 | 4.2 ± 1.1 | |
| 106 | R0032-ID58 | 00:32:07.56 | 18:06:51.4 | 12.2 | ⋯ | ⋯ | 22.7 ± 2.0 | 21.2 ± 2.9 | 12.9 ± 3.3 | |
| 107 | R0032-ID81 a | 00:32:12.86 | 18:07:02.0 | 5.2 | ⋯ | ⋯ | <17.6 | <19.6 | <21.3 | |
| 108 | R0032-ID127 | 00:32:13.16 | 18:08:14.3 | 53.6 | ⋯ | ⋯ | 13.2 ± 5.3 | 30.2 ± 7.4 | <38.9 | |
| 109 | R0032-ID131 | 00:32:12.19 | 18:08:13.3 | 46.8 | ⋯ | ⋯ | 12.7 ± 5.3 | 15.6 ± 7.4 | 32.7 ± 11.4 | |
| 110 | R0032-ID198 | 00:32:08.54 | 18:08:26.7 | 18.3 | ⋯ | ⋯ | 33.8 ± 7.7 | 24.9 ± 8.4 | <23.0 | |
| 111 | R0032-ID208 a | 00:32:13.97 | 18:08:33.7 | 11.2 | ⋯ | ⋯ | <15.6 | <21.7 | 10.6 ± 8.8 | |
| 112 | R0032-ID220 | 00:32:08.61 | 18:09:08.9 | 6.8 c | ⋯ | ⋯ | 33.1 ± 9.5 | 18.5 ± 18.3 | <23.1 | |
| 113 | R0032-ID238 | 00:32:07.83 | 18:09:33.8 | 6.6 | ⋯ | ⋯ | 8.6 ± 3.7 | 7.2 ± 6.5 | 19.4 ± 4.8 | |
| 114 | R0032-ID250 a | 00:32:08.76 | 18:09:20.8 | 8.0 | ⋯ | ⋯ | <17.1 | 11.4 ± 11.3 | <23.1 | |
| 115 | R0032-ID276 | 00:32:08.61 | 18:08:59.2 | 14.9 | ⋯ | ⋯ | 13.0 ± 10.3 | 20.0 ± 17.1 | 36.7 ± 9.1 | |
| 116 | R0032-ID281 a | 00:32:12.25 | 18:08:49.0 | 9.7 | ⋯ | ⋯ | <15.7 | <21.8 | <21.8 | |
| 117 | R0032-ID287 | 00:32:07.70 | 18:08:52.9 | 11.4 | ⋯ | ⋯ | 46.3 ± 7.8 | 30.8 ± 7.9 | <36.2 | |
| 118 | R0032-ID304 a | 00:32:08.95 | 18:08:41.8 | 11.2 | ⋯ | ⋯ | 13.2 ± 7.7 | <27.0 | <22.7 | |
| 119 | R0600-ID12 | 06:00:06.32 | −20:10:04.6 | 5.3 | ⋯ | ⋯ | 19.9 ± 5.8 | 22.0 ± 5.6 | <19.7 | |
| 120 | R0600-ID13 | 06:00:05.05 | −20:09:51.1 | 9.9 | ⋯ | ⋯ | 41.4 ± 3.9 | 27.3 ± 5.7 | 9.5 ± 6.6 | |
| 121 | R0600-ID67 a | 06:00:05.01 | −20:09:24.3 | 38.1 | ⋯ | ⋯ | <15.5 | <16.3 | <18.0 | |
| 122 | R0600-ID111 | 06:00:08.91 | −20:08:55.9 | 5.2 | ⋯ | ⋯ | 15.2 ± 4.4 | 9.5 ± 4.4 | <14.7 | |
| 123 | R0600-ID164 a | 06:00:09.10 | −20:08:26.5 | 4.8 c | ⋯ | ⋯ | <15.1 | <16.1 | <18.0 | |
| 124 | R0949-ID10 | 09:49:52.13 | 17:05:47.2 | 61.9 | ⋯ | ⋯ | 8.5 ± 4.5 | 14.1 ± 5.3 | 24.7 ± 5.9 | |
| 125 | R0949-ID19 a | 09:49:53.85 | 17:05:57.7 | 13.1 | ⋯ | ⋯ | <16.2 | <15.9 | <16.5 | |
| 126 | R0949-ID122 | 09:49:51.16 | 17:08:12.8 | 5.3 | ⋯ | ⋯ | 12.8 ± 4.6 | 5.6 ± 5.4 | 17.4 ± 5.6 | |
| 127 | R0949-ID124 | 09:49:54.62 | 17:08:10.5 | 12.1 | ⋯ | ⋯ | 19.0 ± 5.4 | 9.9 ± 5.0 | 11.3 ± 7.3 | |
| 128 | R1347-ID41 | 13:47:31.11 | −11:44:38.8 | 7.2 | 6.5 ± 0.4 | 17.3 ± 0.7 | 13.2 ± 1.6 | 5.5 ± 1.8 | 6.1 ± 4.4 | |
| 129 | R1347-ID51 a | 13:47:33.74 | −11:44:48.9 | 5.0 | <0.6 | <1.9 | <5.6 | <5.5 | <13.2 | |
| 130 | R1347-ID75 b | 13:47:30.63 | −11:45:09.5 | 57.0 | 5.8 ± 0.4 | 6.4 ± 0.7 | <5.6 | <5.5 | 9.4 ± 4.3 | |
| 131 | R1347-ID145 | 13:47:27.65 | −11:45:51.1 | 22.0 | 12.0 ± 0.5 | 29.6 ± 0.7 | 42.8 ± 2.6 | 37.1 ± 7.9 | 21.6 ± 1.1 | |
| 132 | R1347-ID148 | 13:47:27.85 | −11:45:55.8 | 21.4 c | 16.5 ± 0.7 | 40.7 ± 0.9 | 58.8 ± 3.5 | 51.0 ± 10.8 | 29.7 ± 1.4 | |
| 133 | R1347-ID166 | 13:47:28.00 | −11:46:12.2 | 5.0 | <1.3 | 1.0 ± 0.8 | 10.3 ± 2.3 | 15.5 ± 5.5 | 16.1 ± 2.6 | |
| 134 | R2129-ID20 b | 21:29:39.96 | 00:05:21.0 | 17.8 | 1.1 ± 0.6 | <2.4 | 6.2 ± 2.4 | 5.9 ± 3.8 | <12.3 | |
| 135 | R2129-ID37 | 21:29:38.24 | 00:04:52.6 | 5.8 | 1.1 ± 1.0 | 9.3 ± 1.1 | 9.8 ± 4.0 | 10.3 ± 7.5 | 8.7 ± 4.1 | |
| 136 | R2211-ID19 | 22:11:47.70 | −03:51:03.6 | 6.5 | ⋯ | ⋯ | 19.5 ± 6.4 | 8.9 ± 5.0 | <18.7 | |
| 137 | R2211-ID35 | 22:11:42.91 | −03:50:41.7 | 17.8 c | ⋯ | ⋯ | 131.1 ± 5.0 | 94.8 ± 6.3 | 46.0 ± 6.9 | |
| 138 | R2211-ID171 | 22:11:42.20 | −03:50:23.8 | 10.1 | ⋯ | ⋯ | 24.4 ± 4.7 | 11.1 ± 6.3 | <20.8 | |
| 139 | SM0723-ID61 a | 07:23:03.86 | −73:27:06.2 | 5.8 | ⋯ | ⋯ | <16.2 | <17.4 | <20.2 | |
| 140 | SM0723-ID93 a | 07:23:03.15 | −73:27:21.0 | 4.7 c | ⋯ | ⋯ | <16.2 | <17.4 | <20.2 | |
| 141 | SM0723-ID124 a | 07:23:25.08 | −73:27:38.9 | 5.7 | ⋯ | ⋯ | <15.7 | <17.1 | <20.2 | |
| Secondary Sample (S/Nnat = 4 − 5 and S/Ntap < 4.5) | ||||||||||
| 142 | A2537-ID06 | 23:08:20.81 | −02:10:34.6 | 4.2 | <0.8 | <2.4 | 6.8 ± 2.8 | 6.3 ± 2.5 | 4.9 ± 2.2 | |
| 143 | A2537-ID24 | 23:08:21.17 | −02:10:54.5 | 4.5 | 18.4 ± 0.5 | 30.9 ± 0.8 | 24.7 ± 1.5 | 18.0 ± 2.5 | 9.9 ± 2.2 | |
| 144 | A2744-ID17 | 00:14:19.51 | −30:22:48.6 | 4.4 | <0.8 | <2.3 | <6.6 | <6.9 | <7.7 | |
| 145 | A2744-ID47 | 00:14:17.29 | −30:22:58.6 | 4.7 | 3.4 ± 0.6 | 2.8 ± 1.0 | 3.7 ± 1.8 | <5.9 | <7.7 | |
| 146 | A2744-ID176 | 00:14:17.36 | −30:23:45.4 | 4.2 c | 0.7 ± 0.5 | <2.3 | <6.8 | <7.0 | 2.3 ± 1.5 | |
| 147 | A2744-ID178 | 00:14:24.12 | −30:23:46.0 | 4.7 | 4.9 ± 0.5 | 9.3 ± 0.9 | 11.8 ± 1.5 | 3.6 ± 1.8 | <7.5 | |
| 148 | A2744-ID227 | 00:14:16.56 | −30:24:10.0 | 4.6 | 7.6 ± 0.5 | 9.2 ± 0.8 | <6.8 | <7.1 | 1.8 ± 1.5 | |
| 149 | A3192-ID83 | 03:58:53.92 | −29:55:55.4 | 4.2 | ⋯ | ⋯ | <14.4 | <13.2 | <18.4 | |
| 150 | A3192-ID154 | 03:58:56.69 | −29:54:20.1 | 4.2 | ⋯ | ⋯ | <11.7 | <12.8 | <13.1 | |
| 151 | A370-ID27 | 02:39:53.54 | −01:33:35.3 | 4.3 | 1.4 ± 0.5 | 2.3 ± 0.8 | 5.4 ± 1.4 | 3.0 ± 1.6 | 2.0 ± 1.7 | |
| 152 | A370-ID172 | 02:39:47.38 | −01:34:53.1 | 4.3 | <0.7 | <2.3 | <6.7 | <6.9 | <8.1 | |
| 153 | A383-ID24 | 02:48:02.83 | −03:31:26.5 | 4.0 | 17.5 ± 0.6 | 27.6 ± 1.0 | 21.2 ± 1.8 | 8.1 ± 1.5 | <7.7 | |
| 154 | A383-ID50 | 02:48:02.82 | −03:31:57.5 | 4.2 | 5.9 ± 0.5 | 5.1 ± 0.8 | 3.0 ± 1.7 | <6.6 | <7.7 | |
| 155 | ACT0102-ID128 | 01:02:50.47 | −49:15:41.7 | 4.5 | ⋯ | ⋯ | <14.6 | <14.8 | <20.2 | |
| 156 | AS295-ID09 | 02:45:36.63 | −53:03:27.4 | 4.3 | ⋯ | ⋯ | <15.8 | <13.6 | 8.2 ± 6.1 | |
| 157 | AS295-ID269 | 02:45:22.33 | −53:00:48.9 | 4.3 | ⋯ | ⋯ | 12.3 ± 5.3 | 7.5 ± 5.0 | <15.9 | |
| 158 | M0035-ID33 | 00:35:25.50 | −20:15:29.5 | 4.1 | ⋯ | ⋯ | <12.7 | <15.1 | <16.7 | |
| 159 | M0416-ID120 | 04:16:10.51 | −24:04:49.0 | 4.4 | <1.5 | <2.3 | <6.5 | <7.8 | <9.4 | |
| 160 | M0416-ID138 | 04:16:10.52 | −24:05:04.8 | 4.9 | 3.2 ± 0.5 | 2.7 ± 0.8 | 6.0 ± 2.2 | 4.1 ± 2.0 | <9.4 | |
| 161 | M0416-ID156 | 04:16:08.79 | −24:05:17.6 | 4.5 | 3.9 ± 0.5 | 0.9 ± 0.7 | <9.3 | <7.9 | <9.4 | |
| 162 | M1115-ID33 | 11:15:54.34 | 01:29:57.1 | 4.3 | 0.8 ± 0.5 | 1.9 ± 0.8 | <10.2 | <8.4 | <9.2 | |
| 163 | M1149-ID27 | 11:49:40.00 | 22:24:57.1 | 4.6 | <0.7 | 4.1 ± 0.8 | 6.2 ± 1.4 | 3.6 ± 1.6 | 4.1 ± 1.8 | |
| 164 | M1149-ID95 | 11:49:41.05 | 22:24:16.9 | 4.1 | 1.3 ± 0.5 | 3.5 ± 0.8 | 4.6 ± 1.8 | 7.6 ± 1.8 | 4.1 ± 1.4 | |
| 165 | M1206-ID38 | 12:06:08.25 | −08:47:51.1 | 4.4 | 3.2 ± 0.5 | 6.9 ± 0.9 | <11.1 | 9.0 ± 2.4 | 4.5 ± 2.2 | |
| 166 | M1206-ID84 | 12:06:13.13 | −08:48:27.2 | 4.4 | 14.9 ± 0.5 | 20.2 ± 1.5 | 9.8 ± 4.1 | <12.6 | <10.2 | |
| 167 | M1423-ID52 | 14:23:47.57 | 24:04:37.6 | 4.4 | 3.9 ± 0.5 | <2.7 | <6.5 | <6.5 | <7.2 | |
| 168 | M1423-ID76 | 14:23:48.03 | 24:04:12.2 | 5.0 | 3.3 ± 0.6 | 3.7 ± 0.8 | 3.8 ± 1.9 | <6.3 | <7.3 | |
| 169 | M1931-ID42 b | 19:31:49.48 | −26:34:31.3 | 4.2 | 13.5 ± 1.3 | 4.3 ± 1.2 | <9.1 | <8.5 | <9.3 | |
| 170 | M1931-ID69 | 19:31:47.63 | −26:35:02.2 | 4.3 | <0.7 | 4.4 ± 0.7 | <9.2 | <8.5 | <6.2 | |
| 171 | M2129-ID62 | 21:29:29.63 | −07:41:37.7 | 4.3 | 4.5 ± 0.5 | 6.2 ± 0.8 | <5.9 | <10.4 | <9.1 | |
| 172 | P171-ID161 | 03:12:55.35 | 08:23:43.7 | 4.3 | ⋯ | ⋯ | <16.6 | <21.2 | <21.5 | |
| 173 | R0032-ID63 | 00:32:11.39 | 18:06:52.2 | 4.5 | ⋯ | ⋯ | <18.1 | <19.6 | <22.1 | |
| 174 | R0032-ID162 b | 00:32:11.53 | 18:07:52.3 | 4.8 | ⋯ | ⋯ | 8.2 ± 4.5 | <21.9 | <21.4 | |
| 175 | R0032-ID245 | 00:32:09.46 | 18:09:28.9 | 4.6 | ⋯ | ⋯ | 8.2 ± 4.3 | <20.9 | <12.9 | |
| 176 | R0949-ID14 | 09:49:52.36 | 17:05:46.6 | 4.7 | ⋯ | ⋯ | <16.7 | <15.9 | <14.0 | |
| 177 | R0949-ID113 | 09:49:53.87 | 17:08:17.0 | 4.0 | ⋯ | ⋯ | <15.4 | <15.7 | <14.9 | |
| 178 | R0949-ID119 | 09:49:52.12 | 17:08:09.7 | 4.2 | ⋯ | ⋯ | 18.8 ± 4.1 | <13.8 | <18.9 | |
| 179 | R2211-ID164 | 22:11:44.72 | −03:50:13.7 | 4.6 | ⋯ | ⋯ | <16.3 | <16.3 | <18.7 | |
| 180 | SM0723-ID98 | 07:23:02.63 | −73:27:24.9 | 4.1 | ⋯ | ⋯ | <16.2 | <17.4 | <20.2 | |
Notes. Here we only present Herschel photometry for all secure ALMA sources (141 sources in total; main sample) and tentative ALMA sources with cross-matched HST or Spitzer counterparts (39 sources in total; secondary sample).
a Herschel-faint sources with low significance of detection (S/N < 2) in all Herschel bands but secure detection (S/N ≥ 5) at 1.15 mm (see Section 4.3). b BCGs in corresponding clusters. M1931-ID42 was identified as the extended tail of the BCG M1931-ID41 (Fogarty et al. 2019). c Measured from 2''-tapered ALMA maps instead of native-resolution maps owing to a higher significance of detection.A machine-readable version of the table is available.
Table C2. Summary of MAGPHYS SED Fitting Results
| No. | Name | zbest a | zFIR b | Ref. a | μc | Model d |
 e
e
|
 e
e
|
 e
e
|
 f
f
|
|---|---|---|---|---|---|---|---|---|---|---|
| (μ−1 L⊙) | (μ−1 M⊙ yr−1) | (μ−1 M⊙) | (K) | |||||||
| Main Sample (S/NALMA ≥ 5) | ||||||||||
| 1 | A2163-ID11 |

|

| HST | 3.2 | (1) | 12.48 ± 0.33 | 2.31 ± 0.44 | 8.39 ± 0.11 | 35.5 ± 7.7 |
| 2 | A2537-ID42 |

|

| HST | 3.6 | (1) | 12.43 ± 0.06 | 2.27 ± 0.15 | 8.77 ± 0.06 | 30.2 ± 1.1 |
| 3 | A2537-ID49 |

| ⋯ | FIR | 2.9 | (1) | 12.44 ± 0.43 | 2.33 ± 0.49 | 8.36 ± 0.10 | 35.7 ± 7.2 |
| 4 | A2537-ID66 |

|

| HST | 15.5 | (1) | 13.25 ± 0.04 | 3.39 ± 0.21 | 7.72 ± 0.16 | 63.7 ± 9.8 |
| 5 | A2744-ID07 | 2.41 |

| (1) | 1.9 | (2) | 12.64 ± 0.16 | 2.52 ± 0.23 | 8.30 ± 0.09 | 41.4 ± 4.8 |
| 6 | A2744-ID21 | 2.64 |

| (1) | 1.9 | (2) | 12.67 ± 0.04 | 2.61 ± 0.11 | 8.18 ± 0.15 | 33.9 ± 4.0 |
| 7 | A2744-ID33 | 3.06 |

| (1) | 2.2 | (2) | 12.43 ± 0.11 | 2.32 ± 0.16 | 8.70 ± 0.10 | 31.4 ± 3.4 |
| 8 | A2744-ID56 | 1.50 |

| (1) | 3.2 | (2) | 12.83 ± 0.02 | 2.61 ± 0.18 | 8.61 ± 0.04 | 37.5 ± 0.5 |
| 9 | A2744-ID81 | 2.90 |

| (2) | 3.3 | (2) | 12.56 ± 0.10 | 2.45 ± 0.15 | 8.57 ± 0.07 | 34.9 ± 3.0 |
| 10 | A2744-ID319 | 2.58 |

| (1) | 1.9 | (2) | 12.64 ± 0.06 | 2.57 ± 0.10 | 9.29 ± 0.07 | 26.0 ± 0.9 |
| 11 | A3192-ID31 |

|

| HST | 2.4 | (1) | 12.90 ± 0.12 | 2.68 ± 0.31 | 9.02 ± 0.06 | 33.1 ± 1.1 |
| 12 | A3192-ID40 |

| ⋯ | FIR | 2.7 | (1) | 12.85 ± 0.25 | 2.77 ± 0.28 | 9.04 ± 0.20 | 31.6 ± 7.4 |
| 13 | A3192-ID131 |

| ⋯ | FIR | 2.9 | (1) | 12.41 ± 0.33 | 2.30 ± 0.40 | 8.58 ± 0.22 | 31.9 ± 7.7 |
| 14 | A3192-ID138 |

|

| HST | 3.0 | (1) | 11.80 ± 0.34 | 1.64 ± 0.43 | 8.53 ± 0.15 | 24.5 ± 3.7 |
| 15 | A370-ID18 |

|

| HST | 2.7 | (2) | 12.49 ± 0.13 | 2.36 ± 0.18 | 8.64 ± 0.11 | 27.5 ± 4.6 |
| 16 | A370-ID31 | 0.38 |

| (3) | 1.0 | (-1) | 11.38 ± 0.09 | 1.31 ± 0.16 | 8.13 ± 0.09 | 28.2 ± 0.2 |
| 17 | A370-ID103 |

|

| HST | 1.0 | (-1) | 12.23 ± 0.07 | 2.03 ± 0.18 | 8.73 ± 0.08 | 28.5 ± 1.0 |
| 18 | A370-ID110 | 1.06 |

| (4) | 2.3 | (2) | 12.73 ± 0.04 | 2.50 ± 0.18 | 8.94 ± 0.04 | 31.1 ± 0.2 |
| 19 | A370-ID146 | 1.07 |

| (5) | 8.9 | (2) | 11.34 ± 0.05 | 1.02 ± 0.25 | 8.25 ± 0.12 | 26.1 ± 1.7 |
| 20 | ACT0102-ID22 |

| ⋯ | FIR | 1.9 | (1) | 12.41 ± 0.28 | 2.30 ± 0.36 | 8.61 ± 0.17 | 32.0 ± 9.1 |
| 21 | ACT0102-ID50 |

|

| HST | 2.3 | (1) | 12.58 ± 0.16 | 2.47 ± 0.23 | 8.23 ± 0.09 | 41.1 ± 4.2 |
| 22 | ACT0102-ID118 | 4.32 |

| (6) | 5.2 | (1) | 12.89 ± 0.17 | 2.81 ± 0.20 | 8.89 ± 0.13 | 34.8 ± 4.5 |
| 23 | ACT0102-ID160 |

|

| HST | 2.5 | (1) | 12.43 ± 0.17 | 2.31 ± 0.25 | 8.31 ± 0.11 | 33.9 ± 3.8 |
| 24 | ACT0102-ID215 | 4.32 |

| (6) | 8.8 | (1) | 12.83 ± 0.19 | 2.76 ± 0.23 | 9.03 ± 0.15 | 30.1 ± 3.6 |
| 25 | ACT0102-ID223 |

|

| HST | 2.0 | (1) | 12.21 ± 0.17 | 2.08 ± 0.27 | 8.65 ± 0.11 | 28.4 ± 2.4 |
| 26 | ACT0102-ID224 | 4.32 |

| (6) | 9.2 | (1) | 13.30 ± 0.09 | 3.22 ± 0.12 | 9.37 ± 0.08 | 33.4 ± 2.0 |
| 27 | ACT0102-ID241 |

|

| HST | 1.9 | (1) | 12.32 ± 0.17 | 2.21 ± 0.24 | 8.59 ± 0.15 | 30.6 ± 3.6 |
| 28 | ACT0102-ID294 |

| ⋯ | FIR | 2.4 | (1) | 12.84 ± 0.33 | 2.72 ± 0.41 | 9.04 ± 0.17 | 31.8 ± 7.3 |
| 29 | AS1063-ID15 | 1.43 |

| (5) | 2.1 | (2) | 12.17 ± 0.06 | 2.08 ± 0.10 | 9.02 ± 0.05 | 26.4 ± 0.6 |
| 30 | AS1063-ID17 | 1.44 |

| (5) | 2.4 | (2) | 12.75 ± 0.03 | 2.52 ± 0.19 | 8.61 ± 0.04 | 37.1 ± 0.6 |
| 31 | AS1063-ID147 | 0.61 |

| (7) | 5.7 | (2) | 12.12 ± 0.05 | 1.92 ± 0.23 | 8.41 ± 0.07 | 32.9 ± 0.2 |
| 32 | AS1063-ID222 |

|

| HST | 1.8 | (2) | 12.57 ± 0.07 | 2.39 ± 0.16 | 9.73 ± 0.06 | 21.6 ± 0.9 |
| 33 | M0035-ID41 |

| ⋯ | FIR | 2.1 | (1) | 12.37 ± 0.33 | 2.25 ± 0.40 | 8.49 ± 0.24 | 29.9 ± 9.6 |
| 34 | M0035-ID94 | 0.36 |

| (8) | 1.0 | (-1) | 11.17 ± 0.22 | 1.00 ± 0.39 | 8.01 ± 0.16 | 21.9 ± 2.4 |
| 35 | M0159-ID05 |

|

| HST | 2.4 | (1) | 12.46 ± 0.18 | 2.35 ± 0.26 | 8.81 ± 0.10 | 29.5 ± 2.8 |
| 36 | M0159-ID24 |

| ⋯ | FIR | 0.7 | (1) | 12.36 ± 0.29 | 2.16 ± 0.40 | 8.40 ± 0.14 | 33.2 ± 8.7 |
| 37 | M0159-ID61 |

|

| HST | 2.9 | (1) | 11.84 ± 0.22 | 1.67 ± 0.34 | 8.33 ± 0.16 | 26.3 ± 3.5 |
| 38 | M0257-ID13 |

|

| HST | 1.1 | (1) | 12.27 ± 0.25 | 2.14 ± 0.36 | 9.05 ± 0.13 | 24.9 ± 3.9 |
| 39 | M0329-ID11 |

|

| HST | 2.2 | (2) | 12.38 ± 0.12 | 2.29 ± 0.14 | 8.63 ± 0.16 | ⋯ |
| 40 | M0416-ID51 | 1.96 |

| (5) | 2.2 | (2) | 12.04 ± 0.05 | 1.93 ± 0.10 | 8.30 ± 0.11 | 32.6 ± 1.3 |
| 41 | M0416-ID79 |

|

| HST | 1.9 | (2) | 11.90 ± 0.09 | 1.79 ± 0.15 | 8.13 ± 0.17 | 31.9 ± 2.9 |
| 42 | M0416-ID117 | 2.09 |

| (5) | 1.8 | (2) | 12.44 ± 0.04 | 2.39 ± 0.09 | 8.76 ± 0.09 | 34.6 ± 0.7 |
| 43 | M0416-ID160 |

|

| HST | 1.9 | (2) | 12.14 ± 0.10 | 2.06 ± 0.14 | 8.00 ± 0.23 | 37.4 ± 2.9 |
| 44 | M0417-ID46 | 3.65 |

| (9) | 5.2 | (1) | 13.43 ± 0.09 | 3.37 ± 0.13 | 8.85 ± 0.04 | 44.0 ± 1.2 |
| 45 | M0417-ID49 |

| ⋯ | FIR | 1.9 | (1) | 12.92 ± 0.38 | 2.79 ± 0.48 | 9.24 ± 0.27 | 30.5 ± 6.7 |
| 46 | M0417-ID58 | 3.65 |

| (9) | 4.0 | (1) | 12.82 ± 0.15 | 2.73 ± 0.19 | 8.95 ± 0.11 | 33.3 ± 2.6 |
| 47 | M0417-ID121 | 3.65 |

| (9) | 3.6 | (1) | 12.71 ± 0.17 | 2.62 ± 0.20 | 8.74 ± 0.10 | 34.9 ± 3.2 |
| 48 | M0417-ID204 |

| ⋯ | FIR | 3.0 | (1) | 12.37 ± 0.27 | 2.25 ± 0.34 | 8.58 ± 0.27 | 30.4 ± 9.4 |
| 49 | M0417-ID218 |

| ⋯ | FIR | 4.0 | (1) | 12.61 ± 0.36 | 2.47 ± 0.46 | 8.77 ± 0.17 | 32.0 ± 6.4 |
| 50 | M0417-ID221 |

|

| HST | 2.9 | (1) | 11.97 ± 0.20 | 1.85 ± 0.36 | 8.73 ± 0.12 | 24.8 ± 4.2 |
| 51 | M0417-ID223 |

|

| HST | 2.8 | (1) | 12.24 ± 0.19 | 2.10 ± 0.31 | 8.84 ± 0.21 | 25.5 ± 2.4 |
| 52 | M0429-ID27 |

|

| HST | 4.0 | (2) | 12.69 ± 0.23 | 2.63 ± 0.27 | 8.52 ± 0.19 | 34.7 ± 5.8 |
| 53 | M0553-ID17 |

| ⋯ | FIR | 1.6 | (1) | 12.63 ± 0.30 | 2.53 ± 0.36 | 8.80 ± 0.22 | 31.7 ± 7.5 |
| 54 | M0553-ID61 |

|

| HST | 2.0 | (1) | 12.14 ± 0.18 | 2.01 ± 0.30 | 8.81 ± 0.08 | 25.8 ± 1.9 |
| 55 | M0553-ID133 | 1.14 |

| (10) | 4.4 | (1) | 12.80 ± 0.12 | 2.62 ± 0.30 | 9.10 ± 0.04 | 30.4 ± 0.5 |
| 56 | M0553-ID190 | 1.14 |

| (10) | 6.6 | (1) | 12.98 ± 0.12 | 2.79 ± 0.30 | 9.28 ± 0.04 | 30.6 ± 0.4 |
| 57 | M0553-ID200 |

| ⋯ | FIR | 2.2 | (1) | 12.36 ± 0.31 | 2.21 ± 0.39 | 8.41 ± 0.15 | 31.3 ± 9.1 |
| 58 | M0553-ID249 | 1.14 |

| (10) | 5.8 | (1) | 12.82 ± 0.12 | 2.64 ± 0.30 | 9.12 ± 0.04 | 30.5 ± 0.5 |
| 59 | M0553-ID275 |

|

| HST | 2.5 | (1) | 12.41 ± 0.17 | 2.22 ± 0.34 | 8.36 ± 0.11 | 34.7 ± 3.0 |
| 60 | M0553-ID303 | 0.84 |

| (8) | 1.5 | (1) | 12.48 ± 0.16 | 2.31 ± 0.31 | 8.66 ± 0.12 | 30.8 ± 2.7 |
| 61 | M0553-ID355 |

|

| HST | 1.8 | (1) | 12.32 ± 0.14 | 2.17 ± 0.25 | 8.64 ± 0.09 | 29.9 ± 2.0 |
| 62 | M0553-ID375 |

| ⋯ | FIR | 1.0 | (-1) | 12.54 ± 0.29 | 2.44 ± 0.34 | 8.69 ± 0.20 | 31.9 ± 7.4 |
| 63 | M0553-ID398 |

| ⋯ | FIR | 1.7 | (1) | 12.62 ± 0.27 | 2.53 ± 0.32 | 8.79 ± 0.22 | 32.8 ± 8.7 |
| 64 | M1115-ID02 |

|

| HST | 3.1 | (2) | 13.04 ± 0.09 | 2.91 ± 0.14 | 9.11 ± 0.07 | 33.9 ± 1.3 |
| 65 | M1115-ID04 | 1.60 |

| (11) | 2.7 | (2) | 12.66 ± 0.03 | 2.55 ± 0.09 | 8.51 ± 0.06 | 36.2 ± 1.1 |
| 66 | M1115-ID34 |

| ⋯ | FIR | 2.9 | (2) | 12.53 ± 0.28 | 2.43 ± 0.31 | 8.73 ± 0.23 | 25.6 ± 6.9 |
| 67 | M1149-ID77 | 1.46 |

| (2) | 3.0 | (2) | 12.01 ± 0.05 | 1.81 ± 0.22 | 8.38 ± 0.09 | 30.6 ± 1.6 |
| 68 | M1149-ID229 |

|

| HST | 2.0 | (2) | 11.79 ± 0.13 | 1.63 ± 0.20 | 8.54 ± 0.14 | 25.5 ± 2.5 |
| 69 | M1206-ID27 | 1.04 |

| (12) | 5.2 | (2) | 12.20 ± 0.04 | 1.98 ± 0.21 | 8.56 ± 0.06 | 29.9 ± 1.2 |
| 70 | M1206-ID55 | 1.04 |

| (12) | 7.7 | (2) | 12.37 ± 0.05 | 2.24 ± 0.11 | 8.54 ± 0.05 | 31.5 ± 0.5 |
| 71 | M1206-ID60 | 1.04 |

| (12) | 25.5 | (2) | 12.45 ± 0.05 | 2.32 ± 0.11 | 8.62 ± 0.05 | 31.6 ± 0.5 |
| 72 | M1206-ID61 | 1.04 |

| (12) | 73.1 | (2) | 12.58 ± 0.05 | 2.46 ± 0.11 | 8.76 ± 0.07 | 31.5 ± 0.6 |
| 73 | M1311-ID27 | 2.19 |

| (11) | 15.8 | (2) | 12.74 ± 0.03 | 2.61 ± 0.10 | 8.45 ± 0.05 | 39.9 ± 0.8 |
| 74 | M1311-ID33 |

|

| HST | 2.6 | (2) | 12.53 ± 0.21 | 2.42 ± 0.33 | 8.30 ± 0.12 | 32.0 ± 5.4 |
| 75 | M1423-ID38 |

|

| HST | 4.3 | (2) | 12.36 ± 0.08 | 2.27 ± 0.12 | 8.18 ± 0.13 | 37.2 ± 1.9 |
| 76 | M1931-ID55 |

| ⋯ | FIR | 2.9 | (2) | 12.60 ± 0.25 | 2.56 ± 0.29 | 8.80 ± 0.15 | 35.6 ± 5.6 |
| 77 | M1931-ID61 |

| ⋯ | FIR | 2.4 | (2) | 12.34 ± 0.34 | 2.24 ± 0.42 | 8.56 ± 0.25 | 32.0 ± 8.1 |
| 78 | M2129-ID46 | 1.48 |

| (5) | 3.7 | (2) | 12.06 ± 0.04 | 1.91 ± 0.16 | 7.91 ± 0.12 | 36.7 ± 1.8 |
| 79 | P171-ID69 |

| ⋯ | FIR | 2.7 | (1) | 12.77 ± 0.27 | 2.69 ± 0.31 | 8.95 ± 0.25 | 30.1 ± 9.0 |
| 80 | P171-ID177 |

| ⋯ | FIR | 2.6 | (1) | 12.47 ± 0.27 | 2.35 ± 0.33 | 8.58 ± 0.18 | 31.5 ± 9.3 |
| 81 | R0032-ID53 | 3.63 |

| (13) | 9.2 | (1) | 13.18 ± 0.08 | 3.16 ± 0.15 | 8.34 ± 0.04 | 49.6 ± 1.5 |
| 82 | R0032-ID55 | 3.63 |

| (13) | 18.8 | (1) | 13.46 ± 0.08 | 3.44 ± 0.16 | 8.61 ± 0.04 | 49.6 ± 1.2 |
| 83 | R0032-ID57 | 3.63 |

| (13) | 7.5 | (1) | 12.70 ± 0.08 | 2.66 ± 0.14 | 7.95 ± 0.07 | 49.6 ± 2.7 |
| 84 | R0032-ID58 | 3.63 |

| (13) | 7.7 | (1) | 13.20 ± 0.07 | 3.18 ± 0.15 | 8.36 ± 0.04 | 49.6 ± 1.5 |
| 85 | R0032-ID127 |

| ⋯ | FIR | 9.7 | (1) | 12.89 ± 0.23 | 2.79 ± 0.29 | 9.16 ± 0.18 | 31.4 ± 7.7 |
| 86 | R0032-ID131 |

| ⋯ | FIR | 3.3 | (1) | 12.83 ± 0.32 | 2.74 ± 0.36 | 9.09 ± 0.28 | 31.9 ± 8.1 |
| 87 | R0032-ID198 |

| ⋯ | FIR | 2.0 | (1) | 12.55 ± 0.54 | 2.41 ± 0.63 | 8.67 ± 0.16 | 32.3 ± 6.9 |
| 88 | R0032-ID220 |

| ⋯ | FIR | 2.1 | (1) | 12.47 ± 0.34 | 2.31 ± 0.42 | 8.52 ± 0.14 | 33.6 ± 8.1 |
| 89 | R0032-ID238 |

| ⋯ | FIR | 1.7 | (1) | 12.57 ± 0.29 | 2.47 ± 0.35 | 8.84 ± 0.25 | 31.3 ± 8.0 |
| 90 | R0032-ID276 |

| ⋯ | FIR | 2.6 | (1) | 12.46 ± 0.37 | 2.31 ± 0.45 | 8.56 ± 0.20 | 33.1 ± 9.6 |
| 91 | R0032-ID287 |

| ⋯ | FIR | 1.6 | (1) | 12.56 ± 0.29 | 2.41 ± 0.38 | 8.62 ± 0.11 | 33.0 ± 6.7 |
| 92 | R0600-ID12 |

| ⋯ | FIR | 1.2 | (1) | 12.14 ± 0.36 | 1.96 ± 0.46 | 8.17 ± 0.12 | 33.6 ± 8.7 |
| 93 | R0600-ID13 | 1.27 |

| (8) | 1.3 | (1) | 12.49 ± 0.13 | 2.34 ± 0.26 | 8.52 ± 0.07 | 33.6 ± 1.8 |
| 94 | R0600-ID111 |

|

| HST | 2.7 | (1) | 12.31 ± 0.19 | 2.18 ± 0.29 | 7.97 ± 0.09 | 46.1 ± 8.1 |
| 95 | R0949-ID10 |

| ⋯ | FIR | 3.0 | (1) | 12.94 ± 0.35 | 2.85 ± 0.41 | 9.23 ± 0.31 | 31.5 ± 8.0 |
| 96 | R0949-ID122 |

| ⋯ | FIR | 2.8 | (1) | 12.19 ± 0.42 | 2.05 ± 0.53 | 8.31 ± 0.22 | 32.2 ± 8.7 |
| 97 | R0949-ID124 |

| ⋯ | FIR | 3.3 | (1) | 12.69 ± 0.31 | 2.60 ± 0.35 | 8.86 ± 0.24 | 32.4 ± 8.1 |
| 98 | R1347-ID41 | 0.85 |

| (11) | 4.4 | (2) | 11.60 ± 0.04 | 1.50 ± 0.15 | 8.16 ± 0.08 | 30.7 ± 0.8 |
| 99 | R1347-ID145 | 1.77 |

| (14) | 3.3 | (2) | 12.77 ± 0.03 | 2.62 ± 0.10 | 8.84 ± 0.05 | 34.0 ± 0.3 |
| 100 | R1347-ID148 | 1.77 |

| (14) | 5.8 | (2) | 12.91 ± 0.04 | 2.76 ± 0.10 | 8.98 ± 0.04 | 34.0 ± 0.2 |
| 101 | R1347-ID166 |

| ⋯ | FIR | 3.2 | (2) | 12.19 ± 0.37 | 2.00 ± 0.54 | 8.59 ± 0.20 | 34.0 ± 7.6 |
| 102 | R2129-ID37 |

|

| HST | 1.9 | (2) | 12.52 ± 0.13 | 2.41 ± 0.19 | 8.24 ± 0.08 | 36.0 ± 5.3 |
| 103 | R2211-ID19 |

| ⋯ | FIR | 2.0 | (1) | 12.24 ± 0.31 | 2.10 ± 0.39 | 8.31 ± 0.16 | 33.1 ± 8.9 |
| 104 | R2211-ID35 |

| ⋯ | FIR | 2.4 | (1) | 12.86 ± 0.48 | 2.62 ± 0.62 | 8.99 ± 0.12 | 32.9 ± 6.3 |
| 105 | R2211-ID171 |

| ⋯ | FIR | 2.5 | (1) | 12.65 ± 0.43 | 2.56 ± 0.50 | 8.80 ± 0.23 | 32.1 ± 7.2 |
| Secondary Sample (S/NALMA = 4 − 5) | ||||||||||
| 106 | A2537-ID24 |

|

| HST | 19.8 | (1) | 13.27 ± 0.08 | 3.44 ± 0.22 | 7.83 ± 0.06 | 65.9 ± 5.3 |
| 107 | A2744-ID47 |

|

| HST | 2.8 | (2) | 11.93 ± 0.07 | 1.87 ± 0.11 | 8.48 ± 0.33 | 32.9 ± 5.1 |
| 108 | A2744-ID178 | 0.94 |

| (15) | 2.0 | (2) | 11.61 ± 0.06 | 1.50 ± 0.12 | 8.36 ± 0.16 | 32.4 ± 1.1 |
| 109 | A2744-ID227 | 2.58 |

| (5) | 1.8 | (2) | 12.71 ± 0.05 | 2.77 ± 0.19 | 7.88 ± 0.27 | ⋯ |
| 110 | A370-ID27 |

|

| HST | 5.2 | (2) | 12.35 ± 0.06 | 2.28 ± 0.10 | 8.39 ± 0.26 | 34.5 ± 3.4 |
| 111 | A383-ID24 |

|

| HST | 2.6 | (2) | 11.65 ± 0.08 | 1.48 ± 0.23 | 7.95 ± 0.10 | 32.9 ± 0.8 |
| 112 | A383-ID50 | 1.01 |

| (16) | 13.2 | (2) | 11.62 ± 0.07 | 1.57 ± 0.16 | 7.12 ± 0.34 | 33.7 ± 6.4 |
| 113 | AS295-ID269 |

| ⋯ | FIR | 2.0 | (1) | 12.37 ± 0.31 | 2.26 ± 0.38 | 8.56 ± 0.28 | ⋯ |
| 114 | M0416-ID138 |

|

| HST | 1.5 | (2) | 11.99 ± 0.07 | 1.93 ± 0.11 | 8.07 ± 0.22 | 32.6 ± 2.3 |
| 115 | M0416-ID156 |

|

| HST | 1.8 | (2) | 11.84 ± 0.06 | 1.81 ± 0.15 | 8.21 ± 0.23 | 24.2 ± 3.2 |
| 116 | M1115-ID33 |

|

| HST | 1.6 | (2) | 10.69 ± 0.14 | 0.44 ± 0.27 | 7.69 ± 0.59 | 15.8 ± 1.1 |
| 117 | M1149-ID27 |

|

| HST | 2.4 | (2) | 12.88 ± 0.08 | 2.89 ± 0.19 | 7.96 ± 0.17 | 46.6 ± 7.0 |
| 118 | M1149-ID95 |

|

| HST | 1.3 | (2) | 11.40 ± 0.43 | 1.20 ± 0.56 | 8.42 ± 0.36 | 23.0 ± 4.2 |
| 119 | M1206-ID38 | 1.49 |

| (17) | 4.2 | (2) | 11.94 ± 0.05 | 1.81 ± 0.12 | 8.09 ± 0.17 | 32.1 ± 1.6 |
| 120 | M1206-ID84 | 0.48 |

| (17) | 1.0 | (-1) | 11.33 ± 0.11 | 1.24 ± 0.16 | 8.03 ± 0.20 | 30.6 ± 0.9 |
| 121 | M1423-ID52 |

|

| HST | 4.0 | (2) | 11.79 ± 0.08 | 1.64 ± 0.18 | 7.95 ± 0.21 | ⋯ |
| 122 | M1423-ID76 |

|

| HST | 1.2 | (2) | 11.05 ± 0.41 | 0.95 ± 0.45 | 7.96 ± 0.54 | 33.7 ± 4.9 |
| 123 | M1931-ID69 |

| ⋯ | FIR | 1.8 | (2) | 11.77 ± 0.41 | 1.65 ± 0.49 | 7.95 ± 0.27 | 33.1 ± 7.6 |
| 124 | M2129-ID62 | 1.48 |

| (5) | 2.7 | (2) | 11.98 ± 0.05 | 1.90 ± 0.10 | 8.09 ± 0.17 | 34.8 ± 2.7 |
| 125 | R0949-ID119 |

|

| HST | 1.5 | (1) | 11.39 ± 0.22 | 1.21 ± 0.38 | 8.32 ± 0.15 | 20.3 ± 2.4 |
Notes.
a Best redshifts. HST or FIR photometric redshifts are presented as the median of their likelihood distributions with 1σ confidence range. References of spectroscopic redshifts: (1) CO spectroscopy (private communication from F. Bauer); (2) GLASS and Laporte et al. (2017); (3) Wold et al. (2012); (4) Soucail et al. (1999); (5) GLASS (Treu et al. 2015; Schmidt et al. 2014); (6) Caputi et al. (2021); (7) Gómez et al. (2012), GLASS (Treu et al. 2015; Schmidt et al. 2014), and Walth et al. (2019); (8) CO spectroscopy (ALCS; S. Fujimoto et al. 2022, in preparation); (9) CO spectroscopy (K. Kohno et al. 2022, in preparation); (10) Ebeling et al. (2017); (11) Caminha et al. (2019); (12) "Cosmic Snake" (e.g., Ebeling et al. 2009; Biviano et al. 2013; Cava et al. 2018); (13) Dessauges-Zavadsky et al. (2017); (14) Richard et al. (2021); (15) GLASS (Wang et al. 2015); (16) Sand et al. (2004); (17) Biviano et al. (2013). HST photometric redshifts are taken from Molino et al. (2017), Shipley et al. (2018), and Coe et al. (2019) for sources detected in CLASH, HFF, and RELICS cluster fields, respectively. b FIR photometric redshifts modeled with magphys+photoz (Battisti et al. 2019; see Section 4.1). This column is left blank if zbest = zFIR. c Lensing magnification factors are calculated based on the cluster mass models and the best redshifts of sources (see also Section 5.1 for the evaluation of uncertainty). d Adopted models of lensing magnifications. (1): GLAFIC (Oguri 2010); (2): Zitrin-NFW (Zitrin et al. 2013, 2015); (-1): lensing models are not available (e.g., the sources are cluster member galaxies, or out of HST footprint). e These quantities, derived with magphys (da Cunha et al. 2008, 2015; Battisti et al. 2019), are not corrected for lensing magnification. f Modeled with MBB spectrum with fixed dust emissivity at β = 1.8 (Section 4.1).A machine-readable version of the table is available.
Footnotes
- 37
- 38
- 39
These maps are made available on Mikulski Archive for Space Telescopes (MAST) as high-level science products (HLSP; https://archive.stsci.edu/hlsp/) and scaled to Dls /Ds = 1.
- 40
- 41
- 42