


Abstract
In this paper, the pulsation behavior of high-amplitude δ Scuti star GSC 4552-1498 was analyzed. Using the high-precision photometric data from the Transiting Exoplanet Survey Satellite, two new independent frequencies F1 = 22.6424(1) day−1 and F2 = 28.6803(5) day−1 were identified for this source, along with the fundamental one F = 17.9176(7) day−1, which was previously known. In addition, the classical O − C analysis was conducted to give a new ephemeris formula of BJDmax = T0 + P × E = 2453321.534716(4) + 0.055811(0) × E. The O − C diagram reveals a continuous period increase, but the rate of (1/P)(dP/dt) = 1.11(3) × 10−7 yr−1 seems much larger (about hundreds) than predicted by evolution theories, which is long been noticed but not well understood, possibly related to nonlinear mode interaction. Based on frequency parameters (i.e., F, F1, and F2), a series of theoretical models were conducted by employing the stellar evolution code. It turns out that F1 should be a non-radial mode and F2 is the second overtone radial mode. Due to the mass–metallicity degeneracy, the stellar parameter of the star can however not be determined conclusively. We suggest high-resolution spectral observation is highly desired in the future to further constrain models. We note GSC 4552-1498 is located on the main sequence in the H-R diagram.
Export citation and abstract BibTeX RIS

Original content from this work may be used under the terms of the Creative Commons Attribution 4.0 licence. Any further distribution of this work must maintain attribution to the author(s) and the title of the work, journal citation and DOI.
1. Introduction
One of the long-standing goals in astronomy is to improve our understanding of stellar evolution by constraining the unknown interior physics of stars. At present, the only method to detect the interior physics of star is astroseismology, which uses the resonant pulsation frequencies of a star to constrain its interior properties from a quantitative comparison to stellar models including different input physics (Aerts 2021). The high-precision time series photometric data from space-based telescopes such as Kepler (Borucki et al. 2010; Balona & Dziembowski 2011; Uytterhoeven et al. 2011) and Transiting Exoplanet Survey Satellite (TESS; Ricker et al. 2015; Antoci et al. 2019) provide us an excellent opportunity to detect the period and amplitude of more pulsation modes besides the fundamental one (Antoci et al. 2019). δ Scuti stars are multi-periodic pulsators with periods in range of 0.02–0.25 days and spectral types from A–F, and locate in the classical Cepheid instability strip across the main sequence (MS) in the H-R diagram. They pulsate in radial as well as non-radial modes (Breger 2000; Qian et al. 2018) excited mainly in the κ mechanism (Breger 2000; Aerts et al. 2010; Antoci et al. 2014; Murphy et al. 2020), usually identified as low-radial-order (n) low-angular-degree (l) pressure (p) modes (Uytterhoeven et al. 2011; Holdsworth et al. 2014). Their masses are generally between 1.5 and 2.5 M⊙, which place them in the transition region, that is to say, the lower mass stars with thick outer convective envelope and the massive stars with thin convective shell (Bowman 2017). Thus, these characteristics make them excellent targets for astroseismology, in particular for the detailed studies on the structure and evolution of stars in this transition region (Bowman & Kurtz 2018).
High-amplitude δ Scuti (HADS) stars are a subclass of δ Scuti stars with peak-to-peak light amplitudes larger than 0.3 mag. They are traditionally found to be slow rotators with ν sin i < 30 km s−1 and pulsation periods between 1 and 6 hr (McNamara 2000). From the ground-based observations, HADS stars typically have only one or two radial pulsation modes, in the fundamental and/or first overtone mode (Balona et al. 2012; Yang et al. 2018a, 2018b). In recent decades, thanks to the high photometric precision observations from space telescopes, especially in the Kepler mission (Borucki et al. 2010), low-amplitude frequencies can also be found in the frequency spectrum of HADS. For instance, in HADS KIC 5950759, a pair of low-amplitude triplet structures centered on the main frequency was reported by Yang et al. (2018b), which was suggested to be caused by the amplitude modulation of stellar rotation. Furthermore, Bowman et al. (2021) re-analyzed the light variation of this star KIC 5950759 and 12 additional independent frequencies were extracted and regarded as non-radial modes. Another HADS star KIC10284901 also shows a weak amplitude modulation with two frequencies, which might be related to the Blazhko effect (Yang & Esamdin 2019). Moreover, low-amplitude frequencies can also be radial mode and thus lead to the discovery of multimode HADS. By using the Kepler data, three independent frequencies were identified in KIC 10975348, and identified as radial modes, which reclassified this star as a triple-mode HADS (Yang et al. 2021). Therefore, detection of low-amplitude frequencies will enrich the features of light variation of HADS, and hence provide more information about the internal structure of a star. Based on the high-precision time series photometric data from TESS (Ricker et al. 2014, 2015), more HADS with low-amplitude frequencies pulsation modes (radial and/or non-radial modes) are expected to be detected.
GSC 4552-1498 (α2000 = 11h24m25 350, δ2000 = +77°42'15
 629, 2MASS: J11242535+7742156), was discovered by A.V. Khruslovas, who classified the star as an HADS with a pulsation period of 0.05581096 days. Its amplitude changed from 12.9–13.4 mag (Jafarzadeh & Poro 2017). Jafarzadeh & Poro (2017) derived the frequencies of the fundamental mode F =17.899 day−1 and its harmonic 2F = 35.204 day−1 from the ground-based observations. According to the empirical relations, they calculated several parameters of GSC 4552-1498: the effective temperature is Teff = 7766 ± 59 K, luminosity L =9.09 ± 2.50 L⊙, mass M = 1.68 ± 0.10 M⊙
, and the radius is 1.67 R⊙. They also obtained four times the maximum light in 2017. During 2009 and 2014, 75 more maxima were collected by Wils et al. (2009, 2012, 2013, 2014, 2015). Some basic parameters of GSC 4552-1498 are listed in Table 1. In order to limit the parameters more accurately and investigate its long-term periodic variation, we downloaded the high-precision photometric data provided by TESS and conducted a detailed study.
629, 2MASS: J11242535+7742156), was discovered by A.V. Khruslovas, who classified the star as an HADS with a pulsation period of 0.05581096 days. Its amplitude changed from 12.9–13.4 mag (Jafarzadeh & Poro 2017). Jafarzadeh & Poro (2017) derived the frequencies of the fundamental mode F =17.899 day−1 and its harmonic 2F = 35.204 day−1 from the ground-based observations. According to the empirical relations, they calculated several parameters of GSC 4552-1498: the effective temperature is Teff = 7766 ± 59 K, luminosity L =9.09 ± 2.50 L⊙, mass M = 1.68 ± 0.10 M⊙
, and the radius is 1.67 R⊙. They also obtained four times the maximum light in 2017. During 2009 and 2014, 75 more maxima were collected by Wils et al. (2009, 2012, 2013, 2014, 2015). Some basic parameters of GSC 4552-1498 are listed in Table 1. In order to limit the parameters more accurately and investigate its long-term periodic variation, we downloaded the high-precision photometric data provided by TESS and conducted a detailed study.
2. Observations and Data Reduction
GSC 4552-1498 was observed by TESS (Ricker et al. 2015) during Sectors 14, 20, and 21, from BJD 2458683.346–2458897.782 in 2 min cadence. All the data were downloaded from TESS Asteroseismic Science Operations Center (TASOC) database. 3 In this work, we converted the corrected flux to stellar magnitudes and performed corrections, including eliminating the outliers and detrending the light curve. Then the mean value of each sector was subtracted, and the rectified time series was obtained with 53,568 data points in total, spanning over about 214 days. The typical error per observation of this star is 0.007 mag. A section of the rectified light curves of GSC 4552-1498 is shown in Figure 1. To help the reader visualize the shape of the light curve, a phased curve of GSC 4552-1498 is presented in Figure 2, as well. The light curve shows a faster rise than the decline with a peak-to-peak amplitude of about 0.4 mag, which is typical for HADS stars (McNamara 2000).

Figure 1. A 0.5 day section of the TESS light curve of GSC 4552-1498. The solid curves represent the fitting with the 13 frequency solutions listed in Table 2. BJD, barycentric Julian date.
Download figure:
Standard image High-resolution image
Figure 2. Phase diagram of GSC 4552-1498, folded by the frequency F = 17.9176(7) day−1. The obvious light variation of rapid climb and slow descent is typical for a HADS star.
Download figure:
Standard image High-resolution image3. Frequency Analysis
In this work, the TESS data of GSC 4552-1498 were searched for significant frequencies using PERIOD04 (Lenz & Breger 2005), which was based on the Fourier transformations. The light curve was fitted with the following formula:

where m0 is the zero-point, Ai is the amplitude, fi is the frequency, and ϕi is the corresponding phase.
To detect more significant frequencies, we chose a frequency range of 0 < ν < 100 day−1, which covers the pulsation frequency of δ Scuti stars, and it is still below the Nyquist frequency (fNy = 1/(2Δt) = 360 day−1, i.e., Equation (9) in Murphy et al. (2013), where Δt is the sampling interval between consecutive points). At each step in the process of extracting frequency, the frequency of the highest amplitude peak was determined as a significant frequency, then optimized to the light curve using formula (1), and the solutions of frequency and amplitude were obtained. Then the light curve constructed using the above solutions was subtracted from the data, and the residual was used as input in the next step. The above steps were repeated until there was no significant peak in the residual. The standard stop criterion of a signal-to-noise ratio (S/N) > 4.0 (Breger et al. 1993) was chosen to extract all significant frequencies. The uncertainties of all frequencies were calculated following the method provided by Montgomery & Odonoghue (1999). We note a higher detection threshold (S/N = 5.4) was suggested to be a reliable and safe condition for time series data from space mission such as the Kepler K2 mission (Baran et al. 2015). Adopting this higher detection threshold does not influence the result of frequency analysis of this star.
The initial amplitude spectra was shown in the top panel of Figure 3, in which the frequency of the highest amplitude peak (F) was labeled. We removed F to produce the amplitude spectra in the second panel, where the four harmonic frequencies of F were visible. The last panel shows the amplitude spectra of the residuals after 13 detected frequencies were removed from the data. Following Breger et al. (1993), we drew the detection limit at an S/N = 4.0 for the judgment of a significant peak. There is no obvious peak in the residuals and the overall distribution of the residual is typical noise.
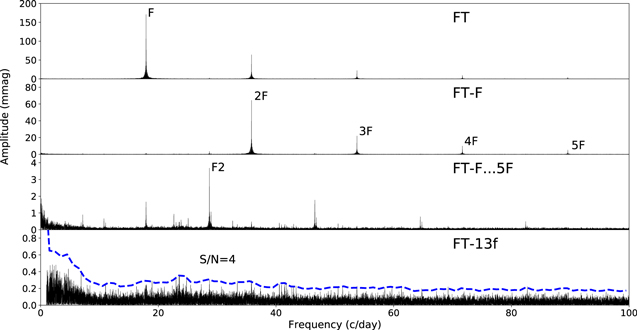
Figure 3. Fourier amplitude spectra of the frequency pre-whitening process for the light curves of GSC 4552-1498. Top panel, the initial Fourier amplitude spectra of the light curve, where the highest peak is F = 17.9176(7) day−1. The second panel, amplitude spectra of the residuals after subtracting the F, which shows four harmonic frequencies of F. The third panel shows amplitude spectra after subtracting the F and its harmonic frequencies, where the independent frequency F2 is marked. The bottom panel shows the residual after the fit shown in Table 2. Dotted curve refers to detection limit of S/N = 4.0.
Download figure:
Standard image High-resolution imageThe solutions of 13 frequencies with S/N > 4.0 are listed in Table 2, including two frequencies that are consistent with those found by Jafarzadeh & Poro (2017) and 11 frequencies newly detected in this work. The frequency of the highest amplitude was usually assumed to be the fundamental radial mode, since the light variations were dominated by this frequency. Therefore, we marked fS1 as F in Table 2. The period ratio of P1/P0 = fS1/fS8 = 0.791 is very close to the result (0.756–0.787) from Petersen & Christensen-Dalsgaard (1996). So fS8 may be the first overtone (1O) or a non-radial mode, which will be discussed in Section 5. And fS1 and fS6 have a period ratio of 0.625 (0.611–0.632) identifying fS6 as the second overtone radial mode (Breger 2000; Petersen & Christensen-Dalsgaard 1996; Stellingwerf 1979). Therefore, we marked fS8 and fS6 as F1 and F2, respectively. We note these two independent frequencies were first identified in this study. Due to this discovery, the source GSC 4552-1498 was no longer a single mode as previously thought. Another similar sample is KIC 10975348 (Yang et al. 2021), in which a low-amplitude frequency was detected recently, by using the Kepler data. It is very encouraging that in the space era, more sources with much weaker pulsation modes could be detected while it might be missed (i.e., falling in the noise) in the ground-based era. Since mode identification is of great importance in seismic modeling, and hence the study of stellar structure and evolution, we urge that a larger such sample is still needed in the near future.
4. O − C Diagram
We used the O − C technique to detect the long-term period changes of GSC 4552-1498. O − C is the difference between the observed and calculated maximum times (Sterken 2005). The observed times of maximum light were determined by fitting the light curves. We made a second-order polynomial fit to a part of the light curves around each maximum. Generally, we chose a range with an amplitude of around one-third of the full amplitude, since this section of the light curves can reach a satisfactory fit. The fitting errors typically 0.00001 day−1 were estimated using Monte Carlo simulations (Lenz & Breger 2005). Finally, 1102 new maximum times were obtained from the TESS data and listed in Table A1 in the Appendix.
In order to make O − C analysis of GSC 4552-1498, the newly determined times of maximum light were considered together with those provided by earlier studies: the maxima with numbers 19, 13, 20, 7, 16, and 4 obtained by Wils et al. (2009, 2012, 2013, 2014, 2015) and Jafarzadeh & Poro (2017), respectively. Then, these times of maximum light from ground-based observations (total 79, summarized in Table A2 in the Appendix), which were originally in HJD, were converted to BJD to be consistent in both timescale and format with the TESS data.
A total of 1181 maxima were collected. To obtain the calculated times of maximum light, O − C values and their corresponding cycles, we fitted the 1181 maximum times with a straight-line and derived a new ephemeris formula:

where T0, P, and E are the initial epoch, period, and the cycle number, respectively. And this ephemeris formula is consistent with the linear ephemeris given by Jafarzadeh & Poro (2017): T = 2,453,321.53540 + 0.05581097 × E. All the O − C values and the corresponding cycle numbers are listed in Tables A1 and A2 in the Appendix, respectively. The O − C diagram is shown in Figure 4, where the blue dots represent the previous 79 points and the red dots are the 1102 new points.
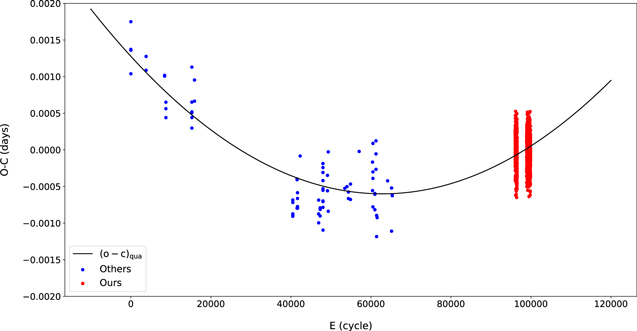
Figure 4. O − C diagram of GSC 4552-1498, based on 1181 times of maximum light. The O − C values are in days. Blue dots represent the previous 79 points and red dots are the 1102 new points. The black solid line shows the fit related to a continuously increasing period change.
Download figure:
Standard image High-resolution imageWe made a second-order polynomial fit to the 1181 points. The new ephemeris was obtained:
with the standard deviation of the fitting residuals of 0.00026 day.
In the lower instability strip where the δ Scuti stars are found, stellar evolution theory predicts an increasing period in most of stars (Breger & Pamyatnykh 1998). And in pulsating stars, when a pulsation period changes linearly with time, the O − C diagram will show a parabolic form that rises or falls depending on whether the period is increasing or decreasing (Sterken 2005). For GSC 4552-1498, from the O − C diagram in Figure 4, the parabolic fit reveals a continuously increasing period change. From Equation (3), the quadratic term indicates the rate of period change (1/P)(dP/dt) = 1.11(3) × 10−7 yr−1.
5. Stellar Models and Fitting Results
We constructed a grid of evolutionary models of stars and calculated their corresponding adiabatic frequencies using the submodule "pulse_adipls" of the Modules for Experiments in Stellar Astrophysics (MESA v10398; Paxton et al. 2011, 2013, 2015, 2018, 2019). In the grid, the stellar mass ranges from 1.4–2.0 M⊙ with a step of 0.02 M⊙, and metallicities ranging from 0.002−0.030 with a step of 0.002. For the helium abundance Y, we adopted Y = 0.249 + 1.33 Z as a function of Z. Besides, the classical mixing length theory of Bohm–Vitense (1958) with α = 1.9 (Paxton et al. 2013) was adopted. The effect of stellar rotation was not included in our calculations since the HADS star usually rotates slowly (McNamara 2000). Each model in the above grid was evolved from the zero-age MS to the post-MS stage, to give the pulsation frequencies of radial (ℓ = 0) and/or non-radial with ℓ = 1 and ℓ = 2. Then by using the method from Chen et al. (2019), i.e., Equation (5), χ2 method), the goodness of fit can be obtained, by comparing model frequencies with the observed frequencies F, F1, and F2.
In Figure 5, we present the changes of 1/χ2 as a function of metallicity Z (top panel) and mass M (bottom panel), with F1 taken as radial 1O (blue circles) and non-radial (red circles) mode, respectively. Each circle represents one minimum value of χ2 for each specific model. We note the blue circles are more concentrated along smaller value of 1/χ2, hence larger χ2, and then lower likelihood of the fitting, while the red circles spread widely, and may have much smaller χ2. Therefore, we suggest F1 is more likely to be a non-radial mode. And It can be seen clearly that the metallicity Z converges from 0.008–0.018, and the mass M from 1.52–1.72 M⊙, which is within the range of typical value of δ Scuti stars.
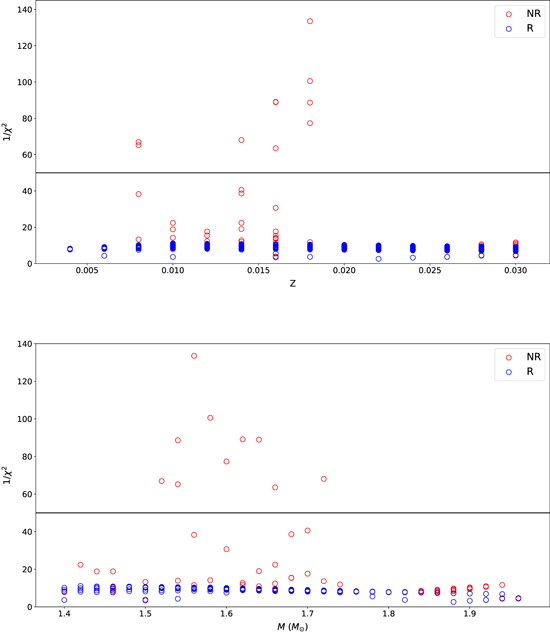
Figure 5. Visualization of the resulting 1/χ2 as a function of metallicity Z (top panel) and stellar mass M (bottom panel), respectively. The red circles mark F1 taken as radial (R) 1O and blues circles non-radial (NR) mode, respectively. Ten candidate models were selected with a threshold of χ2 ≤ 0.02 (horizontal black line), as listed in Table 3.
Download figure:
Standard image High-resolution imageTo select the best-fitting models, we chose a threshold of χ2 = 0.02 (horizontal line in the figures), which results in 10 candidate models, as listed in Table 3. These models can clearly be divided into two subgroups, that is to say, the metal-poor subgroup (with Z = 0.008), and the metal-rich subgroup (with Z around 0.016). Accordingly, the mass of this star was suggested to be M =  in the case of Z = 0.008, and M =
  if Z around 0.016, if taking models with the smallest χ2 as the best-fitting models. Interestingly, models with mass M = 1.54 M⊙ can have two different metallicities, i.e., 0.008 and 0.018, which is due to different mode identifications of F1, with ℓ = 1 and 2, respectively, as marked in Table 3. We note, in any case, the frequency F1 should be identified as a non-radial mode.
And we stress that, from Table 3 and Figure 5, the mass–metallicity degeneracy of the fittings is notable, and similar to that found by Bowman et al. (2021). Due to the large uncertainties of Z and the mass–metallicity degeneracy, we suggest high-resolution spectra is highly desired in the future, which would help not only give an accurate determination of the metallicity that may break the degeneracy, but also provide other parameters, such as effective temperature and rotational rate, which could further narrow down the parameter space of this star.
In addition, we calculated the rate of period change in either case (models in Table 3) in order to compare with observations. The results were listed in Table 3 (the second to the last column), as well. It is notable that all predicted rates of period change are significantly smaller than the value we obtained from O − C, by about two orders of magnitude. We note this discrepancy has long been established for δ Scuti stars (Rodríguez et al. 1995; Breger & Pamyatnykh 1998; Rodríguez & Breger 2001; Bowman et al. 2016, 2021), which may not be accounted for solely by stellar evolution. The possible reason is still uncertain, possibly due to nonlinear mode interaction, resonant mode coupling (Breger & Montgomery 2014) and/or in special cases mass accretion in binaries (DY Pegasi; Xue & Niu 2020), all of which still need further investigation. A larger sample of δ Scuti stars with similar temporal properties to GSC 4552-1498 is no doubt helpful to further address this issue.
In Figure 6, we showed the evolutionary tracks from the zero-age MS to the post-MS stage for models in Table 3 in order to better understand the evolution of GSC 4552-1498. The color lines represent different combinations of metallicity Z and mass M. The crosses mark the minimum χ2 for each specific model. In order to be in line with the derived value of Teff given by (Jafarzadeh & Poro 2017, i.e., 7766 ± 59 K) and TESS website (7615 K), models with a broader range of temperature between 7000 and 8500 K were adopted. We note all these models suggest that GSC 4552-1498 is located on the MS in the H-R diagram. When compared with another five HADS stars (see Table 12 in Xue et al. 2018), we note GSC 4552-1498 has the shortest P0. Using the basic pulsation relation  (P is the period and Q is the pulsation constant), the mean density
  could be roughly estimated. Then this leads to the largest
  for GSC 4552-1498 among the six HADS, revealing that GSC 4552-1498 is still at an earlier stage than the others. Our result is consistent with the tendency derived by Xue et al. (2018), that the lower the fundamental frequency is, the later the star would have evolved into (also see Figure 9 in Xue et al. 2018).

Figure 6. Evolutionary tracks from the zero-age MS to the post-MS for the 10 candidate models, as listed in Table 3. The crosses mark the minimum χ2 for each specific model by fitting the calculated F, F1, and F2 with the observed values. The two vertical dotted lines mark Teff at 7000 and 8500 K, respectively.
Download figure:
Standard image High-resolution image
6. Summary
By analyzing the light variations of GSC 4552-1498 using photometric data delivered by the TESS mission, we detected 13 significant frequencies (see Table 2) including three independent frequencies F = 17.9176 day−1, F1 = 22.6424 day−1 and F2 = 28.6803 day−1. Among them, F1 and F2 were newly detected in this work and F is also consistent with previous study (see Table 1, Jafarzadeh & Poro 2017). And according to the period ratio of F/F2, the independent frequency F2 is the second radial mode.
Table 1. Basic Properties of GSC 4552-1498
| Parameters | GSC 4552-1498 | References |
|---|---|---|
| Brightness | 12.655 mag | a |
| P | 0.05581096 days | b |
| Teff | 7615 K | a |
| log g | 4.34248 dex | a |
| B | 13.047 mag | a |
| V | 12.987 mag | a |
| J | 12.395 mag | a |
| H | 12.264 mag | a |
| K | 12.228 mag | a |
| R | 12.77 mag | a |
| Gaia | 12.8319 mag | a |
| Mv | 2.312 ± 0.263 mag | b |
| Mbol | 2.344 ± 0.264 mag | b |
| L | 9.09 ± 2.50 L⊙ | b |
| M | 1.68 ± 0.10 M⊙ | b |
Note. (a) These parameters are available in the TASOC; (b) Jafarzadeh & Poro (2017).
Download table as: ASCIITypeset image
Table 2. Multifrequency Solution of the Light Curves of GSC 4552-1498 (denoted by fSi )
| fSi | Frequency (day−1) | Amplitude (mmag) | S/N | Identification |
|---|---|---|---|---|
| 1 | 17.9176(7) | 170.8 | 1042.4 | F |
| 2 | 35.8352(2) | 64.4 | 721.3 | 2F |
| 3 | 53.7529(1) | 22.0 | 394.8 | 3F |
| 4 | 71.6705(2) | 10.0 | 177.8 | 4F |
| 5 | 89.5882(1) | 5.2 | 104.9 | 5F |
| 6 | 28.6803(5) | 3.7 | 34.5 | F2 |
| 7 | 46.5980(7) | 1.8 | 25.1 | F+F2 |
| 8 | 22.6424(1) | 0.9 | 10.9 | F1 |
| 9 | 7.1546(1) | 0.9 | 9.3 | 2F–F2 |
| 10 | 64.5156(2) | 0.8 | 14.1 | 2F+F2 |
| 11 | 25.0722(2) | 0.7 | 8.3 | 3F–F2 |
| 12 | 10.7628(4) | 0.7 | 10.2 | F2–F |
| 13 | 82.4335(3) | 0.5 | 9.2 | 3F+F2 |
Note. A total of 13 significant frequencies were detected, with S/N ratio larger than 4.0. Among these frequencies, there are three independent frequencies F, F1, and F2, four harmonic frequencies, and six combined frequencies.
Download table as: ASCIITypeset image
We obtained the O − C diagram with 1181 times of maximum light including 1102 from the TESS mission in this work (see Table A1) and 79 from the literature (see Table A2), and derived a new ephemeris: BJDmax = T0 + P × E = 2453321.534716(4) + 0.055811(0) × E. In addition, the change of period of GSC 4552-1498 was determined for the first time in this work, i.e., increasing continuously with a rate of (1/P)(dP/dt) = 1.11(3) × 10−7 yr−1, which is about two orders of magnitude larger than predicted by evolution theories (see Table 3, the second to the last column). The possible reason might be related to nonlinear mode interaction but still need further investigation.
Table 3. Candidate Models with χ2 ≤ 0.02
| Mass | Z | Teff | L/L⊙ | F | F1 (ℓ, n) | F2 | (1/P)(dP/dt) | χ2 |
|---|---|---|---|---|---|---|---|---|
| (M⊙) | (dex) | (K) | (c days−1) | (c days−1) | (c days−1) | (yr−1) | ||
| 1.52 | 0.008 | 7700.60 | 8.60 | 17.8196 | 22.3405 (1, 1) | 28.1392 | 5.49 × 10⁻¹⁰ | 0.0145 |
| 1.54 | 0.008 | 7779.01 | 9.03 | 18.1020 | 22.6703 (1, 1) | 28.5744 | 5.63 × 10⁻¹⁰ | 0.0149 |
| 1.54 | 0.018 | 7013.48 | 5.90 | 18.0473 | 22.7719 (2, 0) | 28.6620 | 2.92 × 10⁻¹⁰ | 0.0109 |
| 1.56 | 0.018 | 7083.43 | 6.21 | 18.0079 | 22.5679 (2, 0) | 28.5868 | 3.07 × 10⁻¹⁰ | 0.0073 |
| 1.58 | 0.018 | 7160.02 | 6.53 | 18.0511 | 22.5404 (2, 0) | 28.6401 | 3.21 × 10⁻¹⁰ | 0.0096 |
| 1.60 | 0.018 | 7230.77 | 6.87 | 18.0058 | 22.5137 (2, 0) | 28.5603 | 3.36 × 10⁻¹⁰ | 0.0125 |
| 1.62 | 0.016 | 7438.58 | 7.76 | 18.0554 | 22.7286 (2, 0) | 28.5950 | 3.92 × 10⁻¹⁰ | 0.0108 |
| 1.64 | 0.016 | 7517.68 | 8.15 | 18.0725 | 22.7151 (2, 0) | 28.6133 | 4.06 × 10⁻¹⁰ | 0.0109 |
| 1.66 | 0.016 | 7582.41 | 8.55 | 18.0044 | 22.7248 (2, 0) | 28.4990 | 4.03 × 10⁻¹⁰ | 0.0153 |
| 1.72 | 0.014 | 7948.37 | 10.52 | 18.0894 | 22.6375 (2, 0) | 28.5598 | 5.20 × 10⁻¹⁰ | 0.0142 |
Note. (ℓ, n) are the spherical harmonic degree and the radial order of the model frequency, respectively. The (ℓ, n) of F of all candidate models is (0, 0), while F2 is (0, 2).
Download table as: ASCIITypeset image
The stellar evolutionary models were constructed with different mass M and metallicity Z using MESA. By comparing the observed values of F, F1, and F2 with models, we suggest that F1 is a non-radial mode (see Table 3). Due to the mass–metallicity degeneracy, the mass of this star can still not be determined conclusively, that is to say, M =  if Z = 0.008, and M =
  M⊙ if Z is around 0.016. We suggest high-resolution spectral observation in the future is needed to accurately determine the stellar parameters. Consequently, GSC 4552-1498 is no longer a single-mode HADS star, having a continuously increasing period change, and located on the MS stage in the H-R diagram.
We would like to thank the TESS science team for providing such excellent data. This research is supported by the program of the National Natural Science Foundation of China (grant Nos. 11573021, U1938104, and 12003020).
Appendix
In Tables A1 and A2, we listed all the O − C values and the corresponding cycle numbers, respectively.
Table A1. 1102 New Times of Maximum Light and O − C Values of GSC 4552-1498
| BJD | E | O − C | BJD | E | O − C | BJD | E | O − C |
|---|---|---|---|---|---|---|---|---|
| (2450000+) | (day) | (2450000+) | (day) | (2450000+) | (day) | |||
| 8683.4103 | 96,072 | 0.000278 | 8709.4737 | 96,539 | −0.000044 | 8868.1997 | 99,383 | −0.000435 |
| 8683.4657 | 96,073 | −0.000133 | 8709.5298 | 96,540 | 0.000245 | 8868.4235 | 99,387 | 0.000121 |
| 8683.5219 | 96,074 | 0.000256 | 8709.5850 | 96,541 | −0.000366 | 8868.5912 | 99,390 | 0.000388 |
| 8683.6892 | 96,077 | 0.000123 | 8709.6410 | 96,542 | −0.000177 | 8868.6466 | 99,391 | −0.000023 |
| 8683.8009 | 96,079 | 0.000201 | 8709.6968 | 96,543 | −0.000188 | 8868.7028 | 99,392 | 0.000366 |
| 8683.8563 | 96,080 | −0.000210 | 8709.7527 | 96,544 | −0.000099 | 8868.7581 | 99,393 | −0.000145 |
| 8683.9124 | 96,081 | 0.000079 | 8709.8085 | 96,545 | −0.000110 | 8870.9907 | 99,433 | 0.000016 |
| 8683.9683 | 96,082 | 0.000168 | 8709.9204 | 96,547 | 0.000168 | 8871.0467 | 99,434 | 0.000205 |
| 8684.0239 | 96,083 | −0.000043 | 8709.9757 | 96,548 | −0.000343 | 8871.3257 | 99,439 | 0.000151 |
| 8684.0800 | 96,084 | 0.000246 | 8710.0316 | 96,549 | −0.000254 | 8871.3813 | 99,440 | −0.000060 |
Note. Tmax is the observed times of maximum light of GSC 4552-1498. E: Cycle number. O − C is in days. E and O − C are based on the ephemris formula: BJDmax = T0 + P × E = 2453321.534716(4) + 0.055811(0) × E. Table A1 is published in its entirety in the machine-readable format. A portion is shown here for guidance regarding its form and content.
Only a portion of this table is shown here to demonstrate its form and content. A machine-readable version of the full table is available.
Download table as: DataTypeset image
Table A2. 79 Previous Times of Maximum Light and O − C Values of GSC 4552-1498
| BJD | E | O − C | S | BJD | E | O − C | S |
|---|---|---|---|---|---|---|---|
| (2450000+) | (day) | (2450000+) | (day) | ||||
| 3321.5361 | 0 | 0.001372 | 1 | 6001.4116 | 48,017 | −0.000308 | 3 |
| 3321.5919 | 1 | 0.001361 | 1 | 6001.4673 | 48,018 | −0.000419 | 3 |
| 3321.6481 | 2 | 0.001750 | 1 | 6001.5230 | 48,019 | −0.000530 | 3 |
| 3321.7032 | 3 | 0.001039 | 1 | 6001.5791 | 48,020 | −0.000241 | 3 |
| 3534.3990 | 3814 | 0.001087 | 1 | 6001.6346 | 48,021 | −0.000552 | 3 |
| 3534.4550 | 3815 | 0.001276 | 1 | 6002.3041 | 48,033 | −0.000784 | 3 |
| 3792.3016 | 8435 | 0.001018 | 1 | 6002.3596 | 48,034 | −0.001095 | 3 |
| 3792.3574 | 8436 | 0.001007 | 1 | 6002.4158 | 48,035 | −0.000706 | 3 |
| 3810.3281 | 8758 | 0.000562 | 1 | 6064.4780 | 49,147 | −0.000347 | 3 |
| 3810.3840 | 8759 | 0.000651 | 1 | 6064.5336 | 49,148 | −0.000558 | 3 |
| 3810.4396 | 8760 | 0.000440 | 1 | 6075.5289 | 49,345 | −0.000027 | 3 |
| 4172.3742 | 15,245 | 0.000652 | 1 | 6075.5839 | 49,346 | −0.000838 | 3 |
| 4172.4298 | 15,246 | 0.000441 | 1 | 6305.6930 | 53,469 | −0.000525 | 4 |
| 4172.4863 | 15,247 | 0.001130 | 1 | 6336.5007 | 54,021 | −0.000501 | 4 |
| 4172.5415 | 15,248 | 0.000519 | 1 | 6356.5925 | 54,381 | −0.000664 | 4 |
| 4172.5973 | 15,249 | 0.000508 | 1 | 6356.6484 | 54,382 | −0.000575 | 4 |
| 4172.6529 | 15,250 | 0.000297 | 1 | 6385.5028 | 54,899 | −0.000467 | 4 |
| 4209.3211 | 15,907 | 0.000665 | 1 | 6385.5584 | 54,900 | −0.000678 | 4 |
| 4209.3772 | 15,908 | 0.000954 | 1 | 6506.4457 | 57,066 | −0.000021 | 4 |
| 5580.4286 | 40,474 | −0.000873 | 2 | 6692.6865 | 60,403 | −0.000556 | 5 |
| 5580.4846 | 40,475 | −0.000684 | 2 | 6692.7427 | 60,404 | −0.000167 | 5 |
| 5580.5402 | 40,476 | −0.000895 | 2 | 6698.3790 | 60,505 | −0.000778 | 6 |
| 5580.5960 | 40,477 | −0.000906 | 2 | 6698.4352 | 60,506 | −0.000389 | 6 |
| 5580.6520 | 40,478 | −0.000718 | 2 | 6698.4911 | 60,507 | −0.000300 | 6 |
| 5640.3697 | 41,548 | −0.000796 | 2 | 6698.5473 | 60,508 | 0.000089 | 6 |
| 5640.3701 | 41,548 | −0.000396 | 2 | 6725.3359 | 60,988 | −0.000595 | 5 |
| 5640.4259 | 41,549 | −0.000407 | 2 | 6725.3917 | 60,989 | −0.000606 | 5 |
| 5646.2858 | 41,654 | −0.000663 | 2 | 6725.4473 | 60,990 | −0.000817 | 5 |
| 5646.3415 | 41,655 | −0.000774 | 2 | 6741.3542 | 61,275 | −0.000055 | 5 |
| 5646.3975 | 41,656 | −0.000585 | 2 | 6741.4098 | 61,276 | −0.000266 | 5 |
| 5646.4531 | 41,657 | −0.000796 | 2 | 6741.4660 | 61,277 | 0.000123 | 5 |
| 5683.4007 | 42,319 | −0.000084 | 2 | 6749.6131 | 61,423 | −0.001184 | 5 |
| 5941.4142 | 46,942 | −0.000874 | 3 | 6749.6692 | 61,424 | −0.000895 | 5 |
| 5941.4702 | 46,943 | −0.000685 | 3 | 6757.4269 | 61,563 | −0.000925 | 5 |
| 5941.5257 | 46,944 | −0.000996 | 3 | 6903.4290 | 64,179 | −0.000423 | 5 |
| 5962.2876 | 47,316 | −0.000791 | 3 | 6958.6254 | 65,168 | −0.001110 | 5 |
| 5962.3433 | 47,317 | −0.000902 | 3 | 6958.6818 | 65,169 | −0.000521 | 5 |
| 5962.3992 | 47,318 | −0.000813 | 3 | 6968.2812 | 65,341 | −0.000614 | 5 |
| 6001.3001 | 48,015 | −0.000186 | 3 | 6968.3370 | 65,342 | −0.000625 | 5 |
| 6001.3554 | 48,016 | −0.000697 | 3 |
Note. Tmax is the observed times of maximum light in BJD 2450000. E: Cycle number. O − C is in days. E and O − C are based on the ephemris formula: BJDmax = T0 + P × E = 2453321.534716(4) + 0.055811(0) × E. Source [S]: (1) Wils et al. (2009); (2) Wils et al. (2012); (3) Wils et al. (2013); (4) Wils et al. (2014); (5) Wils et al. (2015); (6) Jafarzadeh & Poro (2017).
A machine-readable version of the table is available.
Download table as: DataTypeset image
Footnotes
- 3
TASOC database: https://tasoc.dk.