


Abstract
PSR J2129−0429 is a 7.62 ms eclipsing millisecond pulsar (MSP) with a non-degenerate binary companion star that is likely in an early stage of the recycling process. It has one of the largest companion masses of a so-called "redback" (0.4 M⊙) and has an unusually high surface magnetic field (1.6 × 10⁹ G) for an MSP. We present here an X-ray and optical study of PSR J2129−0429 using new NuSTAR and LCOGT data of the system in addition to archival Swift and XMM-Newton data. Its X-ray light curve shows strong orbital variation from the intra-binary shock, about five times greater than is typical for other systems, and is clearly and persistently double-peaked. Its X-ray spectrum has a very hard power-law component (Γ = 1.1–1.2) which extends to ∼40 keV and exhibits an efficiency of up to a few percent in the X-ray band. The X-ray spectrum at the second peak of the light curve exhibits strong variability, while the spectrum of the first peak remains constant across observations. The hardness of the spectrum is suggestive of driven magnetic reconnection occurring at the shock. In addition, we observe the companion to be currently optically brightening after a multi-year period where it was dimming. The changes in color suggest that it has been continually cooling, implying that the companion is currently expanding.
Export citation and abstract BibTeX RIS

Original content from this work may be used under the terms of the Creative Commons Attribution 3.0 licence. Any further distribution of this work must maintain attribution to the author(s) and the title of the work, journal citation and DOI.
1. Introduction
The discovery of the first millisecond pulsar (MSP) by Backer et al. (1982) led to much speculation regarding the formation of such a system. The now well-established scenario of pulsar recycling proposed by Alpar et al. (1982) and Radhakrishnan & Srinivasan (1982) to explain the 1.5 ms spin period posits that MSPs are old pulsars that are spun up over millions of years by angular momentum transfer through accretion from the companion star. This process occurs due to the companion overflowing its Roche lobe and subsequently losing matter to the neutron star (NS). During an accretion phase it is believed that the pulsar would be visible as a low-mass X-ray binary (LMXB) and pulsed radio emission would be quenched. Hence, radio pulsars may only be visible prior to accretion or after accretion has ceased (as MSPs).
Recently, many such systems have been found, and MSP binaries that exhibit regular radio eclipses over some portion of their orbit have been divided into two classes: black widows (BWs) and redbacks (Roberts 2011). Both classes exhibit very tight orbits of P < 1 day and short spin periods <10 ms (Fruchter et al. 1988; D'Amico et al. 2001; Archibald et al. 2009; Roberts 2013). The redbacks differ from BWs in that their companion masses are an order of magnitude greater than those of BWs, Mc > 0.2 M⊙ in contrast to Mc ≪ 0.1 M⊙ for BWs. Redback companions are non-degenerate, while the companions of BWs may or may not be degenerate (van Kerkwijk et al. 2011; Roberts et al. 2014).
It is widely believed that some fraction of BWs will eventually become isolated MSPs due to ablation of the companion by the pulsar wind. Arons & Tavani (1993) predicted the close encounter between the pulsar wind and the companion would cause a shock, resulting in synchrotron X-ray emission modulated at the orbital period due to Doppler boosting. Observations support this argument, finding X-ray power-law emission with a photon index of Γ ∼ 1.5–2, consistent with an intra-binary shock, and evidence for mild flux modulation over the course of an orbit (e.g., Bogdanov et al. 2005; Gentile et al. 2014).
On the other hand, redbacks seem to be MSPs still in the process (Archibald et al. 2009) of being recycled where accretion has temporarily halted. The best studied of these, PSR J1023+0038 (hereafter J1023; Archibald et al. 2009), was initially observed in X-ray observations in an accreting state (Bond et al. 2002) well before its discovery as a non-accreting radio pulsar. While in the rotation-powered state, NuSTAR observations showed that its X-ray spectrum exhibited an uncharacteristically hard power-law component (Γ = 1.17) extending to ∼50 keV with a remarkably high X-ray efficiency of ∼2% (Tendulkar et al. 2014). The system has since switched back into an accretion-powered state (Patruno et al. 2014; Stappers et al. 2014). Timing observations have shown that the pulsar's spin-down rate has increased by ∼27%, contrary to expectations of pulsar spin-up during accretion (Jaodand et al. 2016); however, the mechanisms for the increase in spin-down rate are unclear. Archibald et al. (2015) have detected X-ray pulsations from the system despite its much lower luminosity in comparison to other accreting X-ray MSPs, which they interpret as the result of episodic channelled accretion. Its low luminosity, and hence very low accretion rate, may explain why it is still spinning down rather than spinning up.
J1023, the "canonical redback," showed that this class of pulsars may serve as the link between LMXBs and MSPs in the theory of pulsar recycling. The short timescales involved in the change between accretion and rotation-powered states indicate that the transition is incredibly dynamic, switching back and forth on timescales of months (as seen in the M28 system; Linares et al. 2014) to years (as with J1023), which was not predicted by models of irradiation feedback (Büning & Ritter 2004). Episodes of cyclic mass transfers were predicted to each last a few centuries, thus we should be able to observe a state change, from accretion- to rotation-powered or vice versa, at most only once. This is in contradiction with observation, as J1023 and other systems like it have now been observed to switch states more than once (Papitto et al. 2013; Roy et al. 2015). However, instabilities in the accretion disks may be able to account for such fast (∼1 yr) state transitions (see Lasota 2001; D'Angelo & Spruit 2012).
Systems with orbital periods and companion masses similar to redbacks follow the standard evolutionary tracks of LMXBs whose initial orbital periods were below the "bifurcation period" of ∼2 days (Tauris & Savonije 1999; Podsiadlowski et al. 2002). They lack direct paths to BW-type systems from just the evolution of their companions, but allow for BW formation through ablation of their presumably degenerate companions post-accretion. More recent evolutionary models by Benvenuto et al. (2014) strongly suggest that redbacks evolve naturally from compact binary systems, given short inital orbital periods Porb < 1 day, predicting that some of them eventually become BWs. However, Chen et al. (2013) argue that BWs and redbacks follow separate evolutionary tracks that diverge due to varying efficiencies in companion evaporation. Benvenuto et al.'s (2015) calculations suggest that redback systems are in quasi-Roche lobe overflow (q-RLOF) states: the companion is nearly filling its Roche lobe, such that matter can just barely escape the star. As a consequence, there is unbound matter between the pulsar and the companion.
Compact binary systems like redbacks provide us with a great probe of the physics of the intra-binary shock that inevitably occurs between the pulsar wind and the companion. Since the two stars are relatively close to each other, the interactions between them can be studied more closely than is possible for systems with wider orbits. Simple geometric modeling by Bogdanov et al. (2011) showed that the observed X-ray orbital modulation in J1023 may result primarily from the companion obscuring part of the emission region. They find that the emission is non-thermal and is primarily composed of synchrotron radiation; however, they are unable to shed light on the physical mechanism by which sharply peaked modulation could occur.
PSR J2129−0429 (J2129) was discovered in a 350 MHz radio survey of unidentified Fermi sources conducted at the Green Bank Telescope (Hessels et al. 2011; Ray et al. 2012, Bangale et al. 2018, in preparation). It is an eclipsing MSP with a 7.62 ms spin period, relatively slow in comparison to the other redbacks. It has a 15.2 hr orbital period, and shows extensive radio eclipses that cover as much as half of the orbit at low frequencies. Optical observations find the companion mass, Mc = 0.44 ± 0.04 M⊙ (Bellm et al. 2016), to be among the largest for any redback yet discovered. These characteristics, in addition to its unusually high inferred surface magnetic field, B ∼ 1.6 × 10⁹ G, an order of magnitude above that of typical MSPs, indicate that J2129 might be in a much earlier evolutionary stage relative to other known redbacks. Basic parameters for the pulsar system can be found in Table 1. For our analyses in this paper we use the preliminary ephemeris from Bangale et al. (2018, in preparation, courtesy Scott M. Ransom), with a binary period Pb = 0.63522741345407 days and T0 = 55702.1111614088.
Table 1. Basic Parameter Values for PSR J2129−0429
| Parameter | Value | References |
|---|---|---|
| Spin period (P) | 7.62 ms | Hessels et al. (2011) |
| Orbital period (Porb) | 0.64 days | Hessels et al. (2011) |
| Surface magnetic field (B) | 1.6 × 10⁹ G | Roberts et al. (2014) |
Spin-down energy ( ) ) |
3.9 × 1034 erg s−1 | Roberts et al. (2014) |
| Characteristic age (τ) | 4 × 10⁸ yr | Roberts et al. (2014) |
| Optical distance (d) | 1833 ± 110 pc | Bellm et al. (2016) |
| Dispersion measure (DM) distance (d) | 900 pc (DM = 16.9 pc cm−3) | Hessels et al. (2011) |
| Mass ratio (q) | 3.94 ± 0.07 | Bellm et al. (2016) |
| Companion mass (Mc) | 0.44 ± 0.04 M⊙ | Bellm et al. (2016) |
| Pulsar mass (Mns) | 1.74 ± 0.18 M⊙ | Bellm et al. (2016) |
| Inclination angle (i) | 80 5 ± 70 5 ± 70 |
Bellm et al. (2016) |
| Irradiation temperature (Tirr)a | 2001 ± 91 K | Bellm et al. (2016) |
| Irradiation efficiency (η)b | 3.0%± 0.6 | Bellm et al. (2016) |
| Roche lobe filling factor (R/RL) | 0.95 ± 0.01 | Bellm et al. (2016) |
Notes.
aDefined as .
bDefined as
.
bDefined as  .
.
Download table as: ASCIITypeset image
XMM-Newton observations by Roberts et al. (2015) (see also Hui et al. 2015) indicate that J2129's light curve exhibits very high amplitude variation in the non-thermal component, around 11-fold, between minimum and maximum flux over the orbit. This variation is the greatest seen in any eclipsing MSP system by about a factor of 5. The X-ray light curve also features two sharp peaks around orbital phases ∼0.6 and ∼0.9, thought likely to be caused by Doppler boosting, indicating an unexpected morphology of the intra-binary shock. Roberts et al. (2015) suggest that the companion's magnetic field may be playing a role in influencing the shock structure. The X-ray spectrum, as with J1023 and other redbacks, is very hard with a photon index of Γ = 1.04 ± 0.11 (Roberts et al. 2015). Optical observations (Bellm et al. 2016) of the system suggest the companion to be nearly Roche lobe filling and the system to be at a high inclination, i ∼ 80°. They also showed a long-term dimming trend of the companion in the r' band. Evolutionary simulations indicate that J2129 could take one of two evolutionary paths depending on how much mass transfer occurs in the future: becoming a BW or evolving into a pulsar binary with a He-core white dwarf (Bellm et al. 2016).
In this paper, we present new X-ray and optical data from NuSTAR and Las Cumbres Observatory (LCOGT) observations of J2129, along with data from previous X-ray observations using XMM-Newton and Swift.
2. Observations and Analysis
2.1. Swift X-Ray
We obtained all the available Swift X-ray Telescope (XRT) (Burrows et al. 2005) data sets taken of J2129 until the end of 2017 from the High Energy Astrophysics Science Archive Research Center (HEASARC) database, amounting to 17 observations in total, listed in Table 2, for a total exposure time of ∼24.7 ks. We used xselect to extract data products, a circular extraction region of 60'' radius for the source region, and an annulus of radius 180'' (excluding the source region of 60'') for the background region. We obtained a total of 106 photons after background subtraction (152 photon counts prior to subtraction), spread across 10 orbital phase bins. We find that the observations sample the orbit roughly evenly across phase bins, which differ in exposure time by a maximum of a factor of two.
Table 2. Swift Observations of PSR J2129−0429
| Observation ID | Date | Exposure Time (ks) |
|---|---|---|
| 00041495001 | 2010 Dec 17 | 10.4 |
| 00041495002 | 2015 May 27 | 0.19 |
| 00041495003 | 2015 May 31 | 0.80 |
| 00041495004 | 2015 Jul 22 | 0.81 |
| 00041495005 | 2015 Sep 17 | 0.49 |
| 00041495006 | 2015 Sep 19 | 0.26 |
| 00041495007 | 2015 Nov 11 | 0.85 |
| 00041495008 | 2015 Dec 24 | 0.20 |
| 00041495009 | 2015 Dec 28 | 0.92 |
| 00081668001 | 2016 Mar 30 | 1.8 |
| 00081668002 | 2016 Apr 11 | 2.0 |
| 00092229001 | 2016 May 10 | 1.0 |
| 00092229002 | 2016 Jun 14 | 1.0 |
| 00092229003 | 2016 Jul 19 | 0.97 |
| 00092229004 | 2016 Oct 23 | 0.81 |
| 00092229005 | 2016 Sep 27 | 0.89 |
| 00092229006 | 2016 Nov 2 | 0.94 |
Download table as: ASCIITypeset image
2.2. XMM-Newton X-Ray
The XMM-Newton observatory observed J2129 beginning on 2013 October 28 (Obs-ID 0725070101, PI Roberts) for ∼79 ks with a livetime of ∼74 ks for the MOS detectors and of ∼58 ks for the PN detector. Basic results from this observation were presented in Roberts et al. (2015) (see also Hui et al. 2015). Here, the aim is to see if the XMM-Newton spectra and light curves are consistent with what is seen by NuSTAR and with optical observations.
The observation was analyzed using the XMM-Newton Science Analysis System (SAS) version 15.0.0 (Gabriel et al. 2004), and HEASoft version 6.16. The observation was remarkably free from background flaring. Starting with the pipeline-processed event files, the EPIC event tasks were screened for flaring using the SAS task espfilt, and then barycentered with the task barycen. From these events light curves were created using an 18'' extraction region around the radio timing position of J2129 (a relatively small extraction region was chosen so as to exclude a nearby source, but should still contain ∼75% of the source photons). We created light curves in the 0.3–10 keV energy range, combining the counts from the two MOS detectors. A total of 49 orbital bins were used, with an entire orbit covered by 31 bins. We plot the light curves as a function of orbital phase in Figure 1, with phase 0 defined as the time of ascending node of the pulsar, making superior conjunction of the pulsar phase 0.25. Two successive superior conjunctions were covered by the observation.
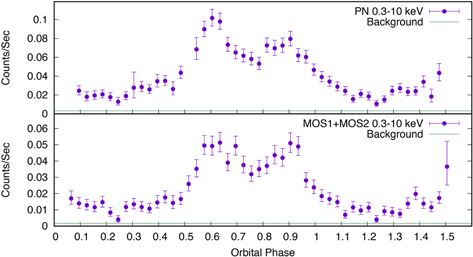
Figure 1. XMM-Newton 0.3–10 keV light-curves of PSR J2129−0429 (J2129) over the entire observation as a function of orbital phase, showing the results of the PN detector (top) and the combined MOS detectors (bottom). The background flux levels are represented in green.
Download figure:
Standard image High-resolution imageIn all detectors, there appears to be a small dip in the light curve each time at pulsar superior conjunction. If this is a result of the pulsar surface being eclipsed, we would expect this dip to be more pronounced in the soft band than in the hard band (see Section 4). We attempted to verify this by creating folded light curves in the 0.3–1.5 keV and 1.5–10 keV bands, and we present those in Figure 2. These bands were chosen since 1.5 keV is approximately where the emission goes from being mostly thermal to mostly non-thermal at the lower count rates near superior conjunction.
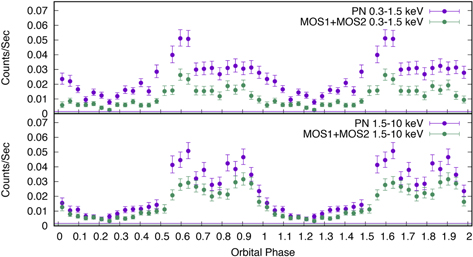
Figure 2. XMM-Newton 0.3–1.5 keV (top) and 1.5–10 keV (bottom) light-curves of J2129 folded at the orbital period as a function of orbital phase, shown for two full orbits. The background flux levels are shown at the bottom of each plot.
Download figure:
Standard image High-resolution image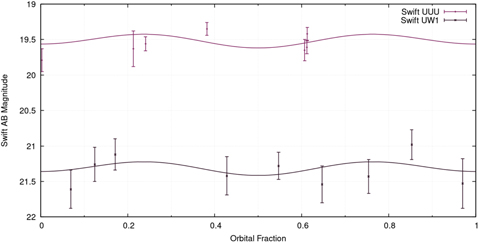
Figure 3. J2129 uw1 and uuu light curve. The data are fit to the model described in Bellm et al. (2016): an analytic function of sines and cosines (as in Equation (1)), with coefficients that are tied to different physical processes in the system.
Download figure:
Standard image High-resolution imageSince one can generally expect a thermal X-ray component from the NS surface in MSP systems, we fit the spectra in XSPEC (Arnaud 1996) using an absorbed thermal plus power law model, where the thermal component is either a blackbody (BB) or standard XSPEC NS atmosphere (NSA) model. We find a best-fit absorption NH = 1.8(2.9) × 1020 cm−2 and temperature kT = 0.21 keV ( K) for the BB (NSA) thermal model for the entire observation, consistent with previously reported results. The light curves suggest that the second peak is somewhat harder than the first peak. We therefore extracted spectra at orbital phases 0.55–0.65 and 0.85–0.95 and fit them separately, keeping the absorption and thermal parameters fixed to the values derived from the entire spectra. Using either a BB or NSA model for the thermal emission, we see a marginally significant hardening of the second peak, with Γ = 1.05 ± 0.07 with a BB thermal component (Γ = 1.07 ± 0.07 with NSA; errors are 90% confidence) for the first peak and Γ = 0.93 ± 0.08 (Γ = 0.94 ± 0.08) for the second peak.
2.3. NuSTAR
J2129 was observed by NuSTAR (Harrison et al. 2013) twice, between 2015 December 23 and 24 for an exposure of ∼44 ks, and between 2016 April 9 and 11 for an exposure of ∼79 ks (observation IDs 30101057002 and 30101057004, respectively). The data were cleaned, processed, and science products extracted using the standard NuSTAR pipeline NuSTARDAS (v1.5.1) that is part of the HEASoft (v6.17) package. We used the light-curve data produced by the pipeline for our light-curve analysis, choosing to select photons only up to an energy of 40 keV to reduce background noise, since we see little evidence for higher-energy photons in the energy spectrum. We bin the photons in 10 bins based on orbital phase, setting phase 0 to the time of ascending node, measure the cumulative detector exposure time, and keep count of the number of total photons in each bin to calculate count rates and errors, taking care to subtract background photons from our analysis. We use the analytical approximations for 68% confidence regions as given in Gehrels (1986). Because our source and background extraction regions are of unequal sizes, background subtraction inevitably results in fractional counts. Strictly speaking, Poisson statistics only apply to integer values, and as such we admit that the methods we employ are not entirely correct.
Our background regions were carefully selected to avoid any bright background sources that might interfere with the analysis, as we found that the size and location of the background region had a significant impact on our ability to produce reasonable fits to the X-ray spectra. We used a source region filter of radius 80'' centered on the source, and a background region filter of radius 90'' placed on the same detector chip as the source, as close as possible to the source while safely avoiding contamination from the source photons. Due to our sources lying very close to the chip-gaps during both of the observations, on each of the two detectors (FPMA and FPMB), we were unable to use larger extraction regions.
Due to potential systematic effects involved with low-count fitting and background modeling, we employed three different methods of data fitting (see van Dyk et al. 2001 for a summary of statistical issues). (1) We fit the spectra generated by running the pipeline, using the extraction regions detailed above for both the source and the background. (2) We constructed a simple model for the background comprising bremsstrahlung, power -law, and Gaussian line emission, with which we fit the pipeline-extracted background files. We found that our model agrees fairly well with the blank sky as seen by NuSTAR (Wik et al. 2014). We fit the source spectra simultaneously on top of the background model using an absorbed power-law model for the spectrum. (3) We used the cleaned Earth occultation data to account for the scattered photon noise in the data. Using the same extraction regions mentioned earlier, applied to the event files taken during the occultation observing mode, we manually extracted spectra using xselect. We then subtracted the occultation data from the science (pipeline-extracted) source and background data, adjusting for count rate variation between occultation and science observing modes. We then fit a simple absorbed power-law to the occultation-subtracted spectrum. We used the C-statistic for fitting when using methods 1 and 2, and we used χ2 for fits using method 3.
Considering the large amount of uncertainty involved in fitting low-count data with substantial noise, we feel confident with our X-ray spectrum model as our best fits using the three different methods are in rough agreement. We used XSPEC version 12.9.0 for the spectral fitting presented in this paper.
2.4. Swift and XMM-Newton UV
The companion of J2129 was first identified through its UV counterpart in Swift data. The various Swift UVOT (Roming et al. 2005) observations used a variety of UV filters, including u, uvw1, uwv2, and uwm2. Exposure and sky coordinate images for these filters were obtained from NASA's HEASARC. These level 2 products have been previously processed through the standard pipeline for bias, bad pixel adjustment, and coordinate transformation. Packages from HEASoft's Swift software were used for data processing. Specifically, uvotdetect was used to detect the source on the level 2 products, using the provided calibration database for the SWIFT UVOT instrument on HEASARC. Photometry was done with the uvotsource package using a standard sky substraction region and the suggested source region by uvotdetect.
For uw1, there were nine exposures totaling an effective exposure of 7448 s. Only one of these observations was made in 2016, while the rest were all taken for the same epoch in 2013. U exposures were more distributed, with a couple of observations each year between 2013 and 2016. While the light curve was constrained on these filters, systematic and statistical errors inherent to the processing through the UVOT pipeline and associated HEASoft mission-specific packages precluded any long-term trend analysis. As for uvm2 and uw2, the source was too faint on these filters for analysis or light-curve constraints.
Fitting parameters for uw1 return an average AB magnitude of 21.30 ± 0.07. The fit suggests the light curve is dominated by ellipsoidal modulation, in correspondence with g', r', i' data (see Figure 3). In comparison, the standard processing for XMM-Newton Optical Monitor (OM) uvw1 data for an observation with a total exposure of 67,400 s in 2014 leads to an average AB magnitude of 20.70 ± 0.02, a difference of 0.6 from the Swift value. However, a systematic difference of 0.83 ± 0.23 is found with other sources in the field of view between the XMM-Newton OM and Swift sources. The XMM-Newton value is significantly brighter than expected from an extrapolation of g', r', i', and z' values using the Bellm et al. (2016) fits for the temperature. While this could be interpreted as an UV excess during the XMM-Newton observation, the consistency of Swift uw1 values before and after the XMM-Newton observation with the extrapolation from longer wavelengths suggests the XMM-Newton OM value is in error.
2.5. LCOGT
For this study, J2129 was monitored across six epochs, starting on 2014 November and ending on 2017 October. These observations were made with 1 and 2 m telescopes from the LCOGT network, using exposures which were typically 200 s in duration. Data were obtained at each epoch using the standard i', r', and g' SDSS filters. Images obtained in 2016 and 2017 were processed using the LCOGT BANZAI reduction pipeline while earlier observations used the ORAC pipeline (Jenness et al. 2013). Table 3 summarizes the start and end dates for each epoch, and the number of measurements taken during each. Some measurements had to be discarded due to poor image quality. A total of 10 exposures were discarded, accounting for about 4% of all observations taken. A few were discarded for shutter issues, where only a fraction of the field of view was observed; in these cases, the source would be within the unobserved region. A few other exposures were discarded due to poor image quality where the source was undetectable with the g' filter or the measured errors were so large that the measurement gave no meaningful constraints on the observed trends. A few others were discarded due to visible patterns present in the image, either as a result of lens condensation or bad flat-field, that interfered directly with the area of extraction and affected the integrity of the image.
Table 3. FITS Files Processed for Each Epoch, and SDSS Filter
| Begin | End | FITS Processed | |||
|---|---|---|---|---|---|
| Epoch | MJD | MJD | i' | r' | g' |
| 2014.85 | 56956.4 | 56988.2 | 12 | 16 | 15 |
| 2015.88 | 57335.8 | 57357.0 | 5 | 4 | 5 |
| 2016.50 | 57531.1 | 57554.8 | 9 | 9 | 8 |
| 2016.70 | 57632.0 | 57660.9 | 19 | 20 | 19 |
| 2017.35 | 57849.4 | 57861.1 | 18 | 19 | 18 |
| 2017.79 | 58033.9 | 58046.9 | 9 | 10 | 9 |
Download table as: ASCIITypeset image
Image Reduction and Analysis Facility v2.16 (IRAF; Tody 1986) and SAOImage DS9 v7.5 (Joye & Mandel 2003) were used to carry out aperture photometry analysis on the reduced images. Aperture radii were optimized for every image with respect to the source only. In order to measure trends in the average orbital flux, the procedure outlined in Bellm et al. (2016) was followed to fit the light curves with a simple model of sines and cosines. Equation (1) shows this model where ϕ is the orbital phase and coefficients a1 through a5 account for the shape of the light curve.
3. Results
3.1. X-Ray Light Curve
The Swift-XRT observations were taken over the course of approximately six years. Although the observations are short and collectively do not sample the entire orbit, the light curve we are able to produce is consistent with the XMM-Newton observation in terms of orbital variation as a function of phase, as can be seen in Figure 4, indicating that the prominent double-peaked feature noted by Roberts et al. (2015) persists over several years. We use the online PIMMS tool (v4.8d) (Mukai 1993) provided by HEASARC to convert the Swift count-rates into their XMM-Newton equivalent, setting the Galactic NH = 4 × 1020 cm−2, which we find is the best fit to our data, and the source model to a power law of Γ = 1.0.
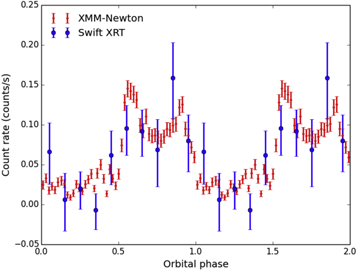
Figure 4. Swift and XMM-Newton light-curves of J2129 in soft X-rays (0.1–10 keV).
Download figure:
Standard image High-resolution imageThe NuSTAR observations exhibit the same double-peaked phenomenon, as shown in Figure 5. This double-peaked feature has been hinted at in other spiders (Bogdanov et al. 2005, 2014a, 2014b; Gentile et al. 2014; Romani 2015; Salvetti et al. 2015); however, J2129's features are the most prominent seen so far.
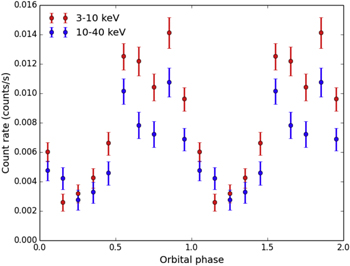
Figure 5. NuSTAR light-curve of J2129 in soft and hard X-rays.
Download figure:
Standard image High-resolution image3.2. X-Ray Spectrum
We find that the X-ray spectrum extends to around ∼40 keV, is well fit with a single absorbed power law with a very hard photon index of Γ ∼ 1.05–1.3, and shows no evidence for breaking. It overlaps well with the XMM-Newton data in the soft regime, as can be seen in Figure 6. We fit the data with an absorbed power law, with either a blackbody or an NS atmosphere component (Romani 1987; Zavlin et al. 1996). The best-fit parameters we find for the spectrum using the three methods detailed in Section 2.3 are shown in Table 4. There does not appear to be a significant change in the overall spectrum between the two NuSTAR observations, so we only show parameters for simultaneous fitting of both.
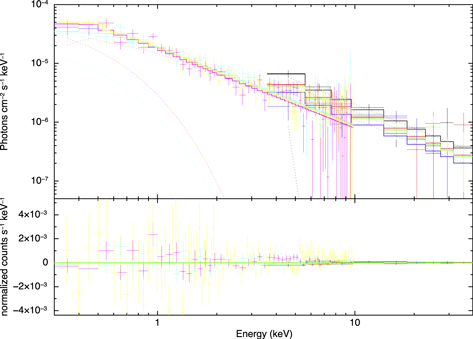
Figure 6. Top: unfolded X-ray spectrum of J2129. The NuSTAR (3–40 keV) and XMM-Newton (0.3–10 keV) data are fitted by a single power law. Bottom: fitting residuals. The colors represent data from the two NuSTAR observations in each of the two detectors, FPMA and FPMB (black, red, green, and blue), fitted simultaneously with data from the XMM-Newton detectors PN, MOS1, and MOS2 (yellow, pink, and cyan). The background is accounted for using method 1, fitting the data with an absorbed power law and NS atmosphere model.
Download figure:
Standard image High-resolution imageTable 4. Best-fit Parameters for the Full X-Ray Spectrum (XMM-Newton and NuSTAR) of J2129
| Method 1 | Method 2 | Method 3 | |
|---|---|---|---|
| NH (×1020 cm−2) | 5.38 ± 3.2 | 7.60 ± 5.3 | 6.05 ± 5.3 |

|
6.07 ± 0.107 | 5.89 ± 0.115 | 5.85 ± 0.164 |
| Γ | 1.03 ± 0.102 | 1.18 ± 0.063 | 1.35 ± 0.060 |
| reduced χ2 (DOF) | 1.27 (250) | 2.75 (284) | 1.49 (250) |
| NH (×1020 cm−2) | 3.59 ± 2.2 | 2.93 ± 3.1 | 4.88 ± 3.8 |
| kT (keV) | 0.180 ± 0.028 | 0.170 ± 0.040 | 0.132 ± 0.035 |
| Γ | 1.09 ± 0.056 | 1.16 ± 0.058 | 1.36 ± 0.053 |
| reduced χ2 (DOF) | 1.28 (250) | 2.75 (284) | 1.49 (250) |
Note. We try fitting to an absorbed power law with either an NSA or a BB component. For the NSA model we use the canonical values Mns = 1.4 M⊙ and Rns = 10 km. The values do not change significantly if we instead use Mns = 1.7 M⊙ and Rns = 12 km.
Download table as: ASCIITypeset image
Table 5. Best-fit Flux Estimates
| Method 1 | Method 2 | Method 3 | |
|---|---|---|---|
| 0.3–10 keV (NSA) | 2.10 ± 0.10 | 2.11 ± 0.10 | 1.87 ± 0.10 |
| 10–40 keV (NSA) | 7.15 ± 0.11 | 2.95 ± 0.11 | 5.30 ± 0.11 |
| Reduced χ2 (DOF) | 1.95 (254) | 3.00 (288) | 1.52 (254) |
| Total | 9.24 ± 0.15 | 5.06 ± 0.15 | 7.17 ± 0.15 |
| 0.3–10 keV (BB) | 2.12 ± 0.10 | 2.10 ± 0.10 | 1.88 ± 0.10 |
| 10–40 keV (BB) | 6.79 ± 0.11 | 2.73 ± 0.11 | 5.68 ± 0.11 |
| Reduced χ2 (DOF) | 1.77 (254) | 2.96 (288) | 1.52 (254) |
| Total | 8.91 ± 0.15 | 4.83 ± 0.15 | 7.56 ± 0.15 |
Note. Units are in 10−13 erg cm−2 s−1. The fluxes were computed using the XSPEC model cflux following the parameters listed in Table 4. Only XMM-Newton data from the PN detector are used to compute flux estimates.
Download table as: ASCIITypeset image
We also note that emission from the second peak appears to have significantly hardened between the first and second observations, which are less than four months apart, as can be seen in the hardness ratios in the bottom left plot of Figure 7. To compute hardness ratios, we follow the same procedure used to produce our light curves, and then divide the soft by the hard count rates. Due to the statistical biases this method introduces, we additionally use the two Bayesian-based methods developed by Park et al. (2006) to produce better estimates of the hardness ratio. Their method employs Bayesian analysis on a Poisson posterior distribution, integrating using either a Markov chain Monte Carlo (MCMC) technique or numerically through Gaussian quadrature (see also van Dyk et al. 2001). Hardness ratios computed using both those methods, using the BEHR program (Park et al. 2006), are shown in the plots on the right in Figure 7. We used the mode of each distribution as data points, seeing as it provides the most robust hardness ratio estimate.
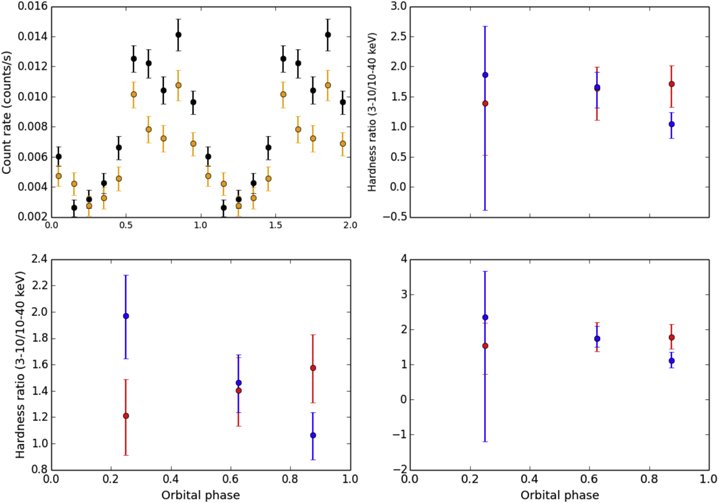
Figure 7. Top left: NuSTAR light-curve of J2129, with the soft band (3–10 keV) in black and the hard band (10–40 keV) in orange. Bottom left: simple hardness ratios (R = soft/hard), binned over the orbital phase in three bins roughly corresponding to the first half of the orbit, the first peak, and the second peak. Background is subtracted from each energy band before computing the ratio, with errors (68% confidence) added in quadrature. Hardness ratios from the first observation are in red, while those of the second observation are in blue. Right: hardness ratios computed using Bayesian inference, through the BEHR program described and presented in Park et al. (2006). Two ways of computing hardness ratios are provided; estimates calculated using numerical integration through Gaussian quadrature (top), and estimates calculated through Gibbs (MCMC) sampling (bottom).
Download figure:
Standard image High-resolution imageFitting only NuSTAR photons that fall between phase 0.5 and 0.75, to an absorbed power-law model, we find a photon index 1.10 ± 0.13 (fixed NH = 4.4 × 1020 cm−2), with reduced χ2 = 1.05. We find that the spectrum of the first peak does not change significantly between observations. However, the spectra we obtain for the second peak vary significantly between the two observations, as reflected in Figure 7. The best-fit parameters for the spectrum of the second peak (0.85–0.95 phase) are shown in Table 6 for our three analysis methods. The variation in spectral index is considerably less obvious when we instead use the photons between phases 0.75–1.0, indicating that the mechanism that causes emission at the peaks is highly geometrically constrained.
Table 6. Best-fit Photon Indices for the NuSTAR Spectrum between Phases 0.55–0.65 and 0.58–0.95, Corresponding to the First and Second Peaks Observed in the Light Curve Respectively, Using the Three Analysis Methods Detailed in Section 2
| Phase | Γ | Method 1 | Method 2 | Method 3 |
|---|---|---|---|---|
| 0.55–0.65 | First observation | 1.08 ± 0.34 | 0.96 ± 0.04 | |
| 0.55–0.65 | Second observation | 0.84 ± 0.20 | 0.84 ± 0.03 | 0.62 ± 0.21 |
| 0.55–0.65 | Reduced χ2 (DOF) | 0.70 (29) | 1.67 (52) | 0.92 (29) |
| 0.55–0.65 | Joint fit | 0.90 ± 0.17 | 0.88 ± 0.03 | |
| 0.55–0.65 | Reduced χ2 (DOF) | 0.69 (30) | 1.70 (53) | |
| 0.85–0.95 | First observation | 1.62 ± 0.24 | 1.43 ± 0.33 | 1.86 ± 0.47 |
| 0.85–0.95 | Second observation | 0.56 ± 0.28 | 0.46 ± 0.48 | 0.38 ± 0.37 |
| 0.85–0.95 | Reduced χ2 (DOF) | 1.30 (29) | 2.04 (52) | 0.65 (29) |
Note. We fit to an absorbed power-law, fixing NH = 4 × 1020 cm−2. In the case of the first peak, we omit the third analysis method due to background subtraction issues that result in the two detectors producing wildly inconsistent results. We fit the two observations separately, as well as together for comparison.
Download table as: ASCIITypeset image
In comparison, the spectrum of the first peak (0.55–0.65 phase) shows little evidence for variation, with a best-fit photon index of Γ ∼ 0.9 using the first two methods of analysis (Table 6). While employing the occultation subtraction method, we found difficulty in producing results that agree between the two detectors. For this reason we do not use this method for studying the first peak.
Simultaneously fitting the individual peaks (0.55–0.65 and 0.85–1.0 in phase for the first and second peaks respectively) with the XMM-Newton data, assuming an absorbed power-law with a blackbody component model, it is clear that the hard emission (Γ < 1.2) is a persistent phenomenon. We find a best-fit photon index of Γ = 0.83 ± 0.132 (χ2 = 0.607 with 59 DOF) corresponding to the first peak, a value consistent with the NuSTAR spectrum at that phase. Emission from the second peak, however, appears to be somewhat erratic. We find a best-fit photon index of Γ = 1.08 ± 0.126 (χ2 = 1.460 with 40 DOF), almost halfway between the spectra from the first and second NuSTAR observations.
3.3. Optical
The orbital variations in the LCOGT light curves were dominated by the a2 and a5 sinusoidal components, which roughly account for ellipsoidal modulation and residual distortions, respectively (Bellm et al. 2016). Figure 8 shows the fitted light curves for the i' filter, spanning all epochs from 2014 November to 2017 October. From 2014 November to 2016 June a dimming was observed, i.e., an increase in average apparent magnitude, whereas from 2016 June to 2017 October the apparent magnitude of the system was observed to decrease. Figure 9 shows these trends in all filters. The magnitude values we use for these analyses are the fit m0 values. In Figure 10, we plot the first and last epoch for each filter. There is a clear decrease in the g' intensity and an increase in the i' intensity, indicating cooling. There appears to a systematic shift in the light curve, something that has been seen in other systems (Li et al. 2014); however, in this case there are not enough data to conclusively say that the shift is real and not due to fluctuations in the data. In Figure 11 we plot a color–color diagram which suggests continuous cooling since 2014.
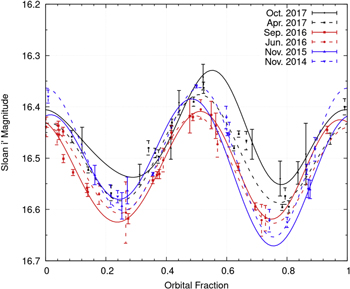
Figure 8. Light curves for J2129 taken with standard SDSS i' filters across six epochs, spanning from 2014 November to 2017 October. The trends are similar for the r' and g' filters. The data used to create this figure are available.
Download figure:
Standard image High-resolution image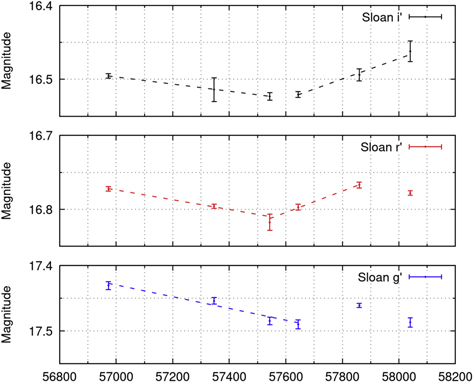
Figure 9. Observed trends for J2129 in the i', r', and g' bands between 2014 November and 2017 October. An increase in apparent magnitude is observed between 2014 November and 2016 June, whereas a decrease is observed between 2016 June and 2017 October.
Download figure:
Standard image High-resolution image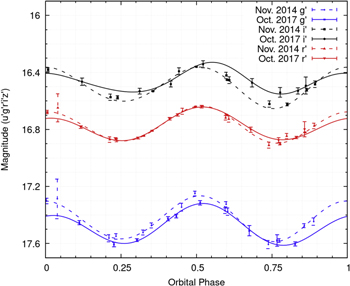
Figure 10. Comparison of light curves for J2129 between the first and last epochs, 2014 November and 2017 October, taken with standard SDSS i', r', and g' filters.
Download figure:
Standard image High-resolution image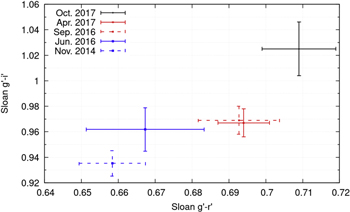
Figure 11. Color trends for J2129 from 2014 November to 2017 October.
Download figure:
Standard image High-resolution image
4. Discussion
4.1. The Double-peaked Structure of the Light Curve
The two-peaked orbital light curve of J2129 provides a puzzle for the shock geometry. As pointed out by Roberts et al. (2015), if the peaks are due to Doppler boosting along the shock front, then their orbital phases at ∼0.6 and ∼0.9 would suggest the shock is directed away from the companion rather than wrapping around it, as would be expected if a powerful pulsar wind is interacting with a much weaker stellar wind. However, with only one observation of the orbit, the peaks could have represented random flaring rather than be associated with particular orbital phases. Here we have shown that, in two observations with NuSTAR and the average light-curve of the Swift observations, these peaks are persistent phenomena and so must reflect something intrinsic and relatively stable about the shock geometry. The large variance seen also suggests that the system must have been observed at a high inclination angle. This is consistent with the photometric results of the companion and the interpretation of the X-ray dips seen at orbital phase 0.25 as an eclipse of the pulsar's surface emission by a nearly Roche lobe filling companion and a high inclination angle of the system (Bellm et al. 2016). The greater X-ray dips in the lower energy band (0.3–3 keV, see Figure 2) are due to the obscuration of thermal emission from the pulsar surface.
In addition, if the shock region wrapped closely around the companion, then the size of the emission region is roughly that of the companion. The optical observations reported in Bellm et al. (2016) suggest that the companion fills ∼95% of the Roche lobe in the period from 2012 to 2014, from which we calculate that it takes up about 1% of the pulsar sky. From this estimate, assuming an isotropic pulsar wind, then we would estimate a spin-down conversion efficiency of about 20% into 0.3–40 keV X-rays. If the wind is fully confined to the equator, we would estimate the companion to intercept ∼7% of the wind, implying instead a conversion efficiency of ∼2%–3%. These very high efficiencies suggest that the pulsar wind may be interacting with something much more extended than the companion star itself.
Two models have been proposed to explain how heating from an intra-binary shock can produce a double-peaked light curve such as that of J2129. Romani & Sanchez (2016, hereafter RS16) construct a model where the pulsar wind flux is concentrated equatorially, modeling it with sin4θ dependence, and shocks against an isotropic companion wind. They find that the ratio of the momentum flux from the two winds is

where  and vw are the companion wind mass-loss rate and velocity respectively, and largely determines the geometry of the intra-binary shock. According to their model, J2129 fits nicely with the case where η > 1, although η may have to be as high as 10 or greater to be in agreement with the model.
Another model, presented by Wadiasingh et al. (2017, hereafter W17), finds similar conclusions. Their model follows from the thin-shell approximation for the collision of two isotropic winds (Canto et al. 1996), with a bow shock forming around the pulsar. Doppler-boosting along the shock would correspond to the orbital modulation we observe. Constraining the X-ray model using the fraction of radio eclipses observed in the system, the synthetic light curves they produce are dependent mostly on the shock radius R (from the MSP) and the inclination angle i, with greater modulation as the bulk velocity at the shock β increases. Based on their model, given J2129's inclination angle of i ∼ 80°, we would expect R ≤ 0.1 r0, where r0 is the orbital separation between the pulsar and the companion, and β > 0.9. Both models imply a shock dominated by the companion's wind, η ≫ 1 in RS16 and R ≤ 0.1 r0 in W17, a scenario that we find difficult to justify on physical grounds. Wadiasingh et al. (2015) argue that an intra-binary shock surrounding the pulsar in a transitional redback system is not entirely unexpected as it may have recently been in an accretion-powered state. In such a case the wind may shock against the remnants of the accretion disk, although Bellm et al. (2016) find no evidence to support such a scenario. The companion "wind" directed toward the pulsar may also be enhanced by some material overflowing its Roche lobe and falling into the pulsar's gravity well (q-RLOF) with the formation of a disk being inhibited by the pulsar wind. Whether or not this would result in a fairly stable shock front of the required shape would need to be investigated further. Chernyakova et al. (2017) find flux and spectral variations on hour-long timescales in the X-ray binary system LSI +61 303, which they attribute to the the stellar wind probing different structures as it moves around the system. Such a scenario may be able to account for some of the short-term modulations we see if any evidence for an accretion disk can be found.
Estimating the magnetic field at the intra-binary shock based on these two models, we find a lower limit of 13 G based on a shock distance of ∼0.3 r0 (RS16). However W17 predict that the shock would occur within 800 light-cylinder radii of the pulsar, with a magnetic field of ≥42 G at the shock. Sanchez & Romani (2017) derive an expression for the shock radius as a function of the momentum flux ratio, where for η = 15 the shock is as close to the pulsar as 0.01 r0, whereas for η = 3 it occurs at 0.23 r0. According to these values the magnetic field strength at the shock may be 18 G < B < 420 G.
The second peak falls off more slowly than the first peak rises, which may be due to instabilities in the trailing wind at the shock, as is seen most clearly in Figures 1 and 2. The simulations of Bosch-Ramon et al. (2012) show turbulent mixing at the contact discontinuity between the pulsar and the companion's winds (see also Bosch-Ramon et al. 2015). The trailing edge appears to be more turbulent than the leading side, and is likely much more sensitive to the geometry.
4.2. Spectral Shape
The photon index we find, Γ ∼ 1.1–1.2 (and the even harder photon indices at the peaks), is inconsistent with Doppler-boosted emission from shock-accelerated particles, which tends to be much softer with Γ ≥ 1.5 (Sironi et al. 2015). A much more likely mechanism for the production of such hard X-ray power-law emission is driven magnetic reconnection, for which the expected photon index can be as hard as Γ ∼ 1 (Zenitani & Hoshino 2001; Larrabee et al. 2003). Some numerical calculations (Kagan et al. 2016; Werner et al. 2016) suggest that the photon index is dependent on the plasma magnetization parameter, defined as the ratio of Poynting to kinetic energy flux,

where n is the plasma number density and γ is the average bulk Lorentz factor, such that Γ hardens from ∼1.4 (for σ = 3) to ∼1.2 (for σ = 1000) as the magnetization increases. Magnetic reconnection is believed to contribute to particle acceleration in the pulsar wind, as was first discussed by Coroniti (1990) and Michel (1994). In this scenario, the "striped" pulsar wind forms a shock against the companion's wind, which drives reconnection in the alternatingly magnetized stripes of plasma in the pulsar wind. It is thought that the magnetically striped wind annihilates fully through magnetic reconnection at the termination shock of a pulsar wind nebula (PWN), a possible solution to the "σ problem" in pulsar winds (Lyubarsky 2003). Particle-in-cell 2D and 3D simulations come to similar conclusions regarding the hardness of the power law (Lyubarsky & Liverts 2008; Sironi & Spitkovsky 2011; Werner & Uzdensky 2017). This makes it a much more viable acceleration mechanism for the observed emission, considering the hardness of J2129's spectrum.
We may be able to constrain the cascade pair production multiplicity factor κ, if we interpret the variation in the spectrum of the second peak as resulting from partial, rather than full, magnetic dissipation at the shock, where the pulsar wind still maintains alternating sheets of magnetized plasma. Pétri & Lyubarsky (2007, hereafter PL07) argue similarly in an attempt to explain the modulation observed in the double pulsar system PSR J0737−3039 (McLaughlin et al. 2004). We note that 2D and 3D simulations (e.g., Sironi & Spitkovsky 2011) have found results contrary to those of PL07, in that they conclude that full dissipation always occurs. Although it is widely accepted that the striped wind is completely annihilated by the time it reaches the termination shock in a PWN, that may not necessarily be the case for intra-binary shocks seen in redbacks or BWs (Hoshino & Lyubarsky 2012). If we follow the condition PL07 find for full magnetic dissipation at the shock:

where the light cylinder radius, corresponding to J2129, and the separation between the pulsar and the companion's surface are Rlc = 363 km and R ∼ 2.1 × 10⁶ km respectively, we estimate a lower bound for the pair multiplicity factor, κ ∼ 2760, assuming the shock occurs exactly at the companion's surface where the pulsar's magnetic field would be ∼6 G. Lyubarsky & Kirk (2001) calculate a theoretical maximum radius for the striped wind, which in this case would be much greater than ∼100 R, hence the partial reconnection interpretation may be plausible. Although the value of the pair multiplicity is uncertain, our calculations fall safely within κ ∼ 103–104 believed to be the pair multiplicity for MSPs (Harding & Muslimov 2011). If the intra-binary shock lies very close to the pulsar as predicted by RS16 and W17, however, the pair multiplicity may have to be several orders of magnitude greater. Constraints on the pair multiplicity factor may help inform theories on the nature of pulsar radio emission. This interpretation, however, leaves open the question of why the spectrum at the first peak is left undisturbed.
We calculate estimates of the magnetization, σ, that agree well with the simulations of Werner et al. (2016) and Kagan et al. (2016). High magnetization (σ ≫ 1) in the wind is a requirement for relativistic magnetic reconnection. Assuming a bulk plasma with Lorentz factor γ = 100 (Lyutikov et al. 1999), and using the plasma density approximation scaled from the Goldreich–Julian density (Goldreich & Julian 1969; Lyubarsky & Kirk 2001),

where Blc is the magnetic field strength at the light cylinder, e is the electron charge, Ω is the angular velocity of the pulsar, and κ = 2760 from the lower limit calculated above. We find that for a shock at a distance of 0.1 r0 with B = 42 G, as would be the case in W17, we find a magnetization factor σ ≲ 1300. For a shock at 0.3 r0 and B = 13 G, as in RS16, we calculate σ ≲ 1100. If the shock instead occurs near the surface of the companion we find σ ≲ 1400, values that are all consistent with what is needed for our measured photon index and the simulations of Werner et al. (2016) and Kagan et al. (2016). Interestingly, Lyubarsky (2003) finds an estimate of the plasma magnetization given based on the pulsar spin-down power, which gives roughly double the estimates we find above, σ ∼ 2300 at 0.1 r0, for J2129.
Based on the flux estimates, we calculate J2129's power-law X-ray luminosity in the 0.3–40 keV band to be around (5–9) × 1031  erg−1 s−1, depending on the analysis method and model used. We choose the optically derived distance rather than the dispersion measure distance as it is more constrained (see Table 5). This corresponds to roughly 0.12% to 0.23% of the spin-down power,
  1034 erg s−1 (Roberts et al. 2014). Given this energy budget, we would expect the power-law emission to cut off or begin to curve below 10 MeV.
Sironi & Spitkovsky (2014) calculate a maximum photon energy that depends on the magnetization and the spectral index, γmax ∼ [σ(3−2Γ)/2(Γ−1)]1/(3−2Γ), which corresponds to synchrotron emission, in the case of J2129, of about ∼12–280 keV for a photon index Γ ∼ 1.2. For Γ ∼ 1.1 the maximum photon energy is ∼0.3–7.4 keV. For greater Γ, the emission would fall well within the range detectable by the Fermi Large Area Telescope. For an emission cut-off ∼40 keV, as our data suggest, we would expect Γ ∼ 1.17, consistent with the observed photon index. We adopt a magnetization of σ = 1000 for these calculations.
Recent work by Sanchez & Romani (2017) suggests that the intra-binary shock reprocesses the pulsar wind, with particles being ducted to the companion's magnetic poles, resulting in additional heating when compared to direct heating, and leads to better agreement with BW light curves. The model seems to apply to redbacks as well. Such a model would necessitate the presence of a strong companion magnetic field. In this case, the magnetic field may play a role in the position and shape of the shock, as well as the inferred magnetic field in the emitting region. A strong companion magnetic field may also contribute toward observed stochastic orbital variations in tight binaries (Applegate 1992; Applegate & Shaham 1994).
4.3. Optical features
Wolff et al. (2009) suggest that magnetic cycling in the companion may account for orbital variation in the binary period, a plausible scenario in the case of J2129 considering the rapid rotation of its companion. It may even be possible, depending on the degree of magnetic cycling in the companion, to see changes in the X-ray spectra that correlate with the magnetic cycles of the star.
It has been shown that heating plays a role in the dynamics of redback systems, although the contribution is much stronger for BWs. Optical studies by Breton et al. (2013) show that eclipsing MSP companions exhibit ∼10%–30% efficiency in recycling the incoming pulsar wind energy flux for surface heating. However in the case of J2129 the companion is very mildly irradiated, with a irradiation efficiency η ∼ 2%. The X-ray flux we observe would at most contribute to 10% of the heating. However, the companion has been observed to dim and then brighten up, but has an overall cooling trend (Bellm et al. 2016, this paper). This suggests some alternative heating source in the past, perhaps due to increased X-rays during a recent accretion episode or tidal heating.
Using the temperature scale of Pinsonneault et al. (2013) to convert colors to effective temperatures, and correcting for extinction, (Av = 0.14 ± 0.09, Bellm et al. 2016), we estimate the change in the temperature of the companion over the years of observation. The values in parentheses are errors corresponding to measurement errors on the color. In the g − r colors, the temperature went down from 5222 (5199–5245) K to 5104 (5082–5127) K within the three years between 2014 November and 2017 October. The temperatures derived from the g − i values dropped from 5104 (5025–5157) K to 5001 (4971–5031) K. We convert the changes in magnitudes in the g − r and g − i colors over the three years to a ratio of intensities (I14/I17 = 10−Δm/2.5) and, assuming that the ratio of the companion radii squared is directly proportional to the ratio of intensities, we can estimate the change in the companion's size by accounting for the blackbody temperatures of the measured colors, from which we find that 19 RNov14 ≈ 20 ROct17. Considering that J2129 was, at the time of Bellm et al. (2016), 95% Roche lobe filling, this estimate implies that the system is currently, or almost, filling its Roche lobe and may enter an accreting state very soon. We plan to monitor the system in radio, optical, and X-rays in anticipation of such an event.
5. Conclusions
Our study of the X-ray emission from J2129 in the 0.3–40 keV regime using data from XMM-Newton, Swift, and NuSTAR reveals a light curve with two prominent peaks surrounding inferior conjunction, with an orbital variability in non-thermal emission of 11×, much greater than observed in other redback systems such as J1023 that have shown hints of a similar double-peaked structure. Two models have been put forth by RS16 and W17 that suggest an intra-binary shock very close to the surface of the pulsar, implying strong winds from the companion. The X-ray spectrum we observe extends to ∼40 keV and it exhibits a very hard photon index of Γ ∼ 1.1–1.2, inconsistent with the softer power-law emission expected from shock Fermi acceleration (Γ > 1.5). The hardness of the spectrum is instead suggestive of magnetic reconnection at the intra-binary shock. The spectra at the two peaks are harder than the overall spectrum, and we observe large variability in the hardness of the second peak (Γ ∼ 0.4–1.6) between our two NuSTAR observations. In the optical regime using LCOGT we have found that the companion has been continually cooling since 2014, but with the dimming trend previously observed having switched to an increasing brightness since mid-2016. Close monitoring of the system is important since the companion may soon be expanding past its Roche lobe, in which case the system may enter an accreting phase.
We would like to thank Maxim Lyutikov and Anatoly Spitkovsky for enlightening discussions regarding the geometry of the binary system and the relevance of reconnection simulations respectively. Portions of this work performed at NRL were supported by NASA. J.W.T.H. acknowledges funding from an NWO Vidi fellowship and from the European Research Council under the European Union's Seventh Framework Programme (FP/2007–2013)/ERC Starting Grant agreement no. 337062 ("DRAGNET"). This work makes use of observations from the Las Cumbres Observatory Global Telescope Network. M.A.M., P.A.G., and P.S.R. are members of the NANOGrav Physics Frontiers Center which is supported by NSF award 1430284. H.A.N. would like to thank G. Schrödinger for her indispensable support in identifying relevant journal articles by sitting on them. Part of this work is based on archival data, software or online services provided by the ASI Space Science Data Center (SSDC). Based on observations obtained with XMM-Newton, an ESA science mission with instruments and contributions directly funded by ESA Member States and NASA. This research has made use of NASA's Astrophysics Data System.
Facilities: LCOGT - Las Cumbres Observatory Global Telescope, XMM-Newton (PN - , M1 and M2) - , Swift(XRT) - , NuSTAR (FPMA and FPMB). -
Software: XSelect, XSPEC, SAS, NuSTARDAS, HEASoft, PIMMS tool, BANZAI pipeline, ORAC pipeline, IRAF, DS9, BEHR.