


Abstract
We present here AMUSING++: the largest compilation of nearby galaxies observed with the MUSE integral-field spectrograph so far. This collection consists of 635 galaxies from different MUSE projects covering the redshift interval 0.0002 < z < 0.1. The sample and its main properties are characterized and described here. It includes galaxies of almost all morphological types, with a good coverage in its color–magnitude diagram, within the stellar mass range between 108 and 1012 M⊙, and with properties resembling those of a diameter-selected sample. The AMUSING++ sample is, therefore, suitable for studying, with unprecendented detail, the properties of nearby galaxies at global and local scales, providing us with more than 50 million individual spectra. We use this compilation to investigate the presence of galactic outflows. We exploit the use of combined emission-line images to explore the shape of the different ionized components and the distribution along classical diagnostic diagrams to disentangle the different ionizing sources across the optical extension of each galaxy. We use the cross-correlation function to estimate the level of symmetry of the emission lines as an indication of the presence of shocks and/or active galactic nuclei. We uncovered a total of 54 outflows, comprising ∼8% of the sample. A large number of the discovered outflows correspond to those driven by active galactic nuclei (∼60%), suggesting some bias in the selection of our sample. No clear evidence was found that outflow host galaxies are highly star-forming, and outflows appear to be found within all galaxies around the star-formation sequence.
Export citation and abstract BibTeX RIS
1. Introduction
Galactic outflows are phenomena that are predicted by theoretical models of galaxy evolution and observed in a wide variety of galaxies at many different redshifts. They can be driven either by supernova (SN) explosions or by an active galactic nucleus (AGN), through mechanisms that inject energy into both the interstellar and intergalactic medium (hereafter the ISM and IGM, respectively). They are, indeed, the most common explanation to the observed metal enrichment of the intergalactic medium (e.g., Pettini et al. 1998; Ferrara et al. 2000). How the energy released in these processes is dissipated through the disks and how much gas mass is expelled, are key questions to explain whether outflows are capable of quenching the SF in galaxies and, therefore, explain the transition to the observed retired population of galaxies (e.g., Bower et al. 2006; Hopkins & Hernquist 2009). On the other hand, some studies have suggested that outflows can inject positive feedback and trigger galaxy SF, instead of halting it (e.g., Silk 2013; Zubovas et al. 2013; Maiolino et al. 2017; Gallagher et al. 2019).
Outflows driven by SF have been clearly identified in nearby galaxies, particularly in Luminous and Ultra Luminous Infrared Galaxies (LIRGs and ULIRGs, respectively) and starbursts (e.g., Heckman et al. 2000; Aguirre et al. 2001; Rupke et al. 2005a, 2005b, 2005c); although, they are neither ubiquitous nor exclusive of galaxies with high rates of star formation (SF; see Ho et al. 2014; López-Cobá et al. 2019). It is believed that the presence of this type of outflow is closely related to the amount of SFR in a galaxy. Depending on how intense and efficient the SF is in producing massive stars, via the initial mass function (IMF), those stars will eventually produce supernovae explosions in few megayears, injecting energy to its surroundings. Its eventual expansion into the ISM produces typically ionized cones result of the stratified density between the disk and the gaseous halo.
Despite the fact that these outflows are usually found in low-mass galaxies (e.g., Veilleux et al. 2005), where they apparently prevent the formation and growth of dwarf galaxies (e.g., Silk & Rees 1998), recent studies have shown that they are also present in galaxies as massive as ∼1011 M☉ or more.
On the other hand, supermassive black holes in the center of galaxies are responsible of launching powerful radio jets, sweeping the surrounding ISM to form outflows. The energy source of this is the accretion of material onto the central black holes of galaxies. Most massive galaxies tend to host massive black holes. Therefore, the produced energy when active is some orders of magnitude (assuming a high efficiency mass–energy conversion, typically 0.1), larger than that produced by SN explosions, surpassing, in some cases, the binding energy of a hole galaxy (Veilleux et al. 2005; Harrison et al. 2018). These outflows are usually found in the most luminous AGNs.
Regardless of its origin, the warm phase of outflows (T ≈ 104 K) is the most accessible part to explore, given their strong emission in the optical emission lines. In particular, the high-excitation [O iii]λ5007 line (hereafter [O iii]) traces AGN winds in general, while Hα + [N ii]λ6584 (hereafter, [N ii]) traces SF outflows produced by supernova explosions (Veilleux et al. 2005; Sharp & Bland-Hawthorn 2010). Therefore, in outflows emerging from the disk, an increase is expected of these emission lines with respect to hydrogen recombination lines along the semiminor axis. These lines reveal typically ionized gas with conical structures as the result of the expansion of the gas and its interaction with the ISM (e.g., López-Cobá et al. 2016), which filamentary shapes. The extension of an outflow ranges from a few parsecs to a few kiloparsecs (Heckman et al. 1990), depending on how intense and efficient the AGN is in producing massive stars or on the degree of luminosity of the AGN.
Before any detailed studies of the physical conditions of outflows are done, it is necessary to have large samples of bona fide outflows across a broad range of galaxy properties. The study of outflows has been addressed using different observational techniques and at different wavelength ranges, from X-ray to radio wavelengths (e.g., Husemann et al. 2019).
The methodology applied to detect and study galactic outflows has been improved by the implementation of modern observational techniques, going from an incomplete vision provided by long slit spectroscopy to the fully spatially resolved picture provided by Integral Field Spectroscopy (IFS). This technique provides a spatial and spectral description of galaxies, limited only by the specifications of the spectrographs (and telescopes). However, to date, there is a lack of robust methods to detect ionized gas outflows in large samples of galaxies.
Even though the outflowing ionized gas is more or less constrained by models (e.g., Allen et al. 2008), further information, such as velocity dispersion, multiple kinematic components, distance to the mid plane, and morphology of the ionized gas, are required to identify shocks beside the use of pure ionization diagnostic diagrams (D'Agostino et al. 2019; López-Cobá et al. 2019).
Recent large IFS galaxy surveys (IFS-GS), like MaNGA (Bundy et al. 2015), CALIFA (Sánchez et al. 2012), and SAMI (Croom et al. 2012) have enabled investigations into the presence of outflows at kiloparcec scales in the nearby universe (e.g., Ho et al. 2014; López-Cobá et al. 2019; Rodríguez del Pino et al. 2019). Our understanding of this phenomena and its impact on the overall evolution of galaxies would improve with the detection of larger and less-biased samples of host galaxies (López-Cobá et al. 2019). However, all of those explorations have been limited by the spatial resolution of the above surveys (∼2 5).
5).
New instruments, like the Multi Unit Spectroscopic Explorer (MUSE; Bacon et al. 2010) with its unprecedented combination of high spatial and spectral resolutions, provide new ways to study galaxies at scales of hundreds of parsecs. While there does not exist an MUSE galaxy survey with a large sample size that matches the numbers from previous IFS-GSs, there are now available multiple distinct projects (with public data) from which it is possible to create a synthetic compilation sample.
In the present work, we compile the "AMUSING++" nearby galaxy sample and use this to identify and study galactic outflows at sub-kiloparsec scales over a large number of different galaxies. The paper is structured as follows: the presentation of the AMUSING++ sample is presented in Section 2. The data analysis is presented in Section 3, while the methodology used to select the outflows is discussed in Section 4. The outflows sample is presented in Section 5, and finally, some scaling relations of the sample are presented in Section 6.
Throughout the paper, we adopt the standard ΛCDM cosmology with H0 = 70 km s−1 Mpc−1, Ωm = 0.3, and ΩΛ = 0.7.
2. The AMUSING++ sample
The MUSE instrument provides a wide field of view (FoV) of 1' × 1', with a spatial sampling of 02 × 02 per spaxel, thus, the spatial resolution is seeing limited. MUSE covers the whole optical range from 4750 to 9300 Å, with a spectral sampling of 1.25 Å, and a full width at half maximum (FWHM) that depends slightly on the wavelength (Bacon et al. 2017), being ∼2.4 Å at the red part of the spectrum (at 7500 Å). Although the instrument was designed to study intermediate/high redshift objects, MUSE is an excellent instrument to study, with unprecedented detail, the structural components of nearby galaxies (e.g., Sánchez-Menguiano et al. 2018).
As indicated before, the study of galactic outflows has been limited by the coarse spatial resolution of the previous IFS-GS (FWHM ∼ 25). The seeing limited resolution of MUSE (FWHM ∼ 1'') allows one to select galaxies where the spatial resolution is of the order of sub-kiloparsec scales at similar redshifts. Therefore, we selected galaxies observed with this instrument from the European Southern Observatory (ESO) archive, acquired until 2018 August with redshifts below z < 0.1. This is basically the highest redshift covered by the previously quoted IFS-GS. We perform a visual inspection to select galaxies that fit into the FoV of MUSE. A more detailed diameter selection cannot be applied given the lack of information of the R25 parameter for a large fraction of these Southern galaxies (based on a scan through the Hyperleda database). Nevertheless, as we will argue later, our final galaxy collection broadly resembles a diameter selection sample (see Figure 2).
Nearby galaxies (z ∼ 0), where the optical extension is not covered entirely by the MUSE FoV were treated separately. In those cases, we selected galaxies where at least the optical nuclei is covered, since galactic outflows are nuclear processes. Partial pointings, where just a small fraction of a galaxy is observed, are excluded from the sample (i.e., spiral arms, bars, tails), except in cases where it was possible to do mosaics in order to cover larger areas of a galaxy. All together, the current compilation comprises a total of 635 galaxies observed with MUSE at the VLT, covering the redshift interval 0.0002 < z < 0.1, with a mean value of ∼0.019. The full list of ESO MUSE programs used in the present galaxy compilation is presented in the acknowledgment section.
Galaxies from different MUSE projects were collected by using the previous selection criterion. The projects with larger data contributions to the final AMUSING++ collection are briefly described below (more details should be found in the presentation articles of each project):
- (i)The All-weather MUse Supernova Integral-field of Nearby Galaxies (AMUSING; Galbany et al. 2016) survey. AMUSING is an ongoing project at the ESO that aims to study the environments of supernovae and their relation to their host galaxies. For details about the observation strategy and data reduction, we refer the reader to Galbany et al. (2016). So far, it comprises ∼328 galaxies, as it is the core of the current compilation. This sample has been used to explore different science topics: (i) the radial profiles of the oxygen abundances in galaxies (Sánchez-Menguiano et al. 2018) and its azimuthal variation (Sánchez et al. 2015; Sánchez-Menguiano et al. 2016); (ii) extended ionized gas fillaments associated with galaxy interactions (Prieto et al. 2016); (iii) the discovery of new strong lenses (Galbany et al. 2018), and the optical counterpart of a radio jet (López-Cobá et al. 2017); (iv) the derivation of main galaxy kinematic parameters such as velocity and velocity dispersion by different approaches (Bellocchi et al. 2019); (v) individual type II supernova (Meza et al. 2019); (vi) ionized gas tails (Boselli et al. 2018), in addition to the local environment of supernovae, i.e., the major goal of the survey (Galbany et al. 2016; Krühler et al. 2017).
- (ii)CALIFA galaxies observed with MUSE. In order to compare with previous analyses (e.g., López-Cobá et al. 2019), we selected all of those galaxies observed within the CALIFA survey (Sánchez et al. 2012) covered with MUSE. This sample comprises six galaxies so far. In addition, we searched through the ESO archive looking for any galaxy within the footprint of the CALIFA selection (redshift, magnitude, diameter), relaxing the decl. limits to include all Southern galaxies, which results in 41 galaxies.
- (iii)The GAs Stripping Phenomena in galaxies with MUSE (GASP; Poggianti et al. 2017). This project has observed 114 stripping candidates galaxies at redshifts 0.04 < z < 0.07. GASP aims to study the gas removal process in galaxies due to this physical process, i.e., when galaxies fall into clusters. They also observe a comparison sample of field galaxies. In this study, 26 galaxies are included from this sample.
- (iv)The MUSE Atlas of Disks (MAD; Erroz-Ferrer et al. 2019). This is an ongoing project that studies star-forming galaxies (SFGs) at very low redshift. So far, MAD has observed 38 galaxies. MAD is focused in the study of the properties of the ionized gas, such as oxygen abundances, and star-formation rates, in local disks at scales of hundreds of pc. In the present study, 22 of the 38 galaxies from this survey are included.
- (v)The Close AGN Reference Survey (CARS; Husemann et al. 2017). CARS aims to explore the AGN-host galaxy connection over a sample of 40 nearby unobscured AGNs (0.01 < z < 0.06) and, thus, establish a connection toward high-redshift AGNs. Our compilation includes 12 CARS galaxies.
- (vi)The Time Inference with MUSE in Extragalactic Rings (TIMER; Gadotti et al. 2019). TIMER is a project that observed 24 nearby barred galaxies (z < 0.0095), with rings or inner disks. The goal of TIMER is to understand when the disk galaxies settle dynamically. The target galaxies present isophotal sizes slightly larger than the FoV of the instrument (D25 > 1'). Seven galaxies from this project are included in our study.
As indicated before, nearly two-thirds of the galaxy compilation was extracted from the AMUSING survey, and for this reason, we named it AMUSING++.
Figure 1 shows the distribution on the sky for all of the galaxies analyzed in this study on top of the NASA-Sloan Atlas (NSA) catalog (Blanton et al. 2011), for comparison. As the VLT is located in the Southern hemisphere, just a few galaxies coincide with the Sloan Digital Sky Survey (SDSS; York et al. 2000). This limits our ability to extract useful information from this exquisite survey, like photometry, comparison of spectroscopy at the same aperture, or even perform an estimation of the volume correction just assuming a random sub-selection of the targets (like the one presented by Sánchez et al. 2018). The decl. limits of our sample reflect the sky visibility of the VLT, −80° < δ < 40°. On the other hand, the sample is distributed randomly around any right accession (R.A.), once the region coincident with the Milky Way disk is considered. Therefore, it is well suitable for any further survey-mode exploration along the year with a telescope or antennae in the Southern Hemisphere.
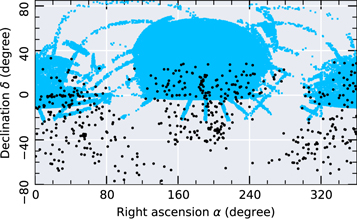
Figure 1. Distribution in the sky of AMUSING++ galaxies. The black dots represent the 634 galaxies analyzed in this paper. For comparison, we have added the distribution of galaxies in the NASA-Sloan Atlas catalog (NSA), shown with cyan dots.
Download figure:
Standard image High-resolution imageThe redshift coverage of AMUSING++ spans over the range covered by other large IFS-GS (such as MaNGA, CALIFA, and SAMI; see Figure 2, top panel). The physical spatial resolution was derived for each object by extracting the DIMM seeing along the observations from the header of each datacube and shifting it to the corresponding cosmological distance. The average seeing of the sample is 10 with a standard deviation of 04. This corresponds to typical physical resolution of ∼400 pc for the average redshift of the sample, although it ranges from 10 pc (for the lowest redshift galaxy) to ∼3 kpc (for the highest redshift ones). Figure 2 demonstrates that at any redshift interval, the AMUSING++ sample offers a better spatial physical resolution with respect to the IFS-GS mentioned above. Thus, spatial resolution is clearly one of the major advantages of the considered data set. However, we stress that the current data set does not comprise a homogeneously selected and well-defined sample, being a collection of different galaxies observed with MUSE.
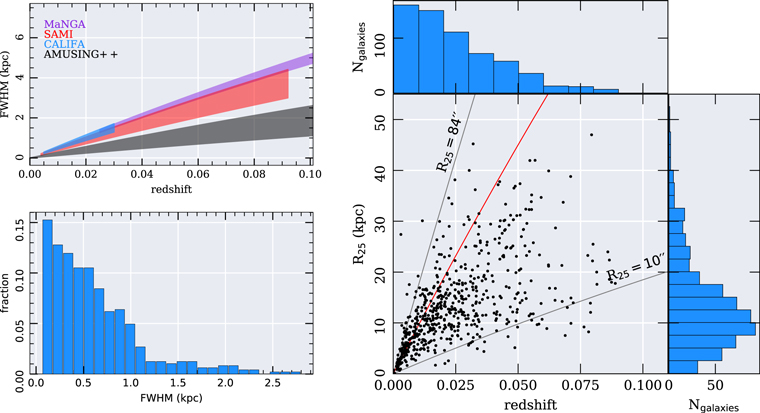
Figure 2. Top left panel: PSF spatial resolution (FWHM) vs. redshift for different IFU galaxy surveys together with the AMUSING++ compilation. The shaded color regions accounts for 1σ error in the reported FWHMs. The purple region shows the distribution of the MaNGA survey (254 < FWHM < 28, 0.025 < z < 0.15) (Yan et al. 2016), the red corresponds to SAMI (FWHM = 216 ± 041, 0.004 < z < 0.092) (Green et al. 2018), in blue is CALIFA (FWHM = 25 ± 034, 0.005 < z < 0.03; Sánchez et al. 2016a). Finally, in black, the AMUSING++ compilation is shown with 06 < FWHMDIMM < 14 covering a redshift interval 0.0002 < z < 0.1. Bottom-left panel: distribution of the physical spatial resolution of the data normalized to the total number of galaxies. Right panel: distribution of the R25 parameter along the redshift for the AMUSING++ objects. Diagonal lines confine galaxies between 10'' < R25 < 84''. The red line indicates R25 = 42'', that is, the maximum radius that fits into the FoV of MUSE. Over each axis are plotted histograms of the corresponding z and R25 distributions.
Download figure:
Standard image High-resolution imageGiven the redshift range of the sample, the optical diameter (D25) is not covered completely by the FoV of MUSE for all galaxies of the sample. In a few cases (three galaxies), there are multiple pointings available for the same galaxy, from which we performed mosaics joining together the data cubes to cover the maximum extension for those galaxies. In order to estimate which fraction of the optical extension of each galaxy is covered by our IFS data, we perform an isophotal analysis on the V-band images extracted from the data cubes, deriving the position angle, ellipticity and R25 isophotal radii (the semimajor axis length at which a surface brightness of 25 mag arcsec−2 is reached). For this purpose, we adopt the publicly available isophote fitting tool Photutils (Bradley et al. 2016) as part of the python based package Astropy (Astropy Collaboration et al. 2013). This routine mimics the standard procedures implemented in the SExtractor package (e.g., Bertin & Arnouts 1996). An interactive tool was developed for this propose, including a visual masking of foreground stars and/or close companion galaxies, a selection of the centroid of the galaxy, and certain tuning of the background level, in order to derive those parameters for all galaxies. In Appendix A, the procedure is described in greater detail, and the derived parameters are presented (see Table 3).
The bottom panel of Figure 2 shows the distribution of R25 as a function of redshift for our compilation. Unexpectedly, the distribution of galaxies seems to be grouped in a narrow region in this diagram. Indeed, it resembles a diameter-selected sample, limited by 10'' < R25 < 84'' for 92% of the objects. This property could be used, in principle, to provide a volume correction, something that will be explored in a forthcoming article. The red line in this figure traces the maximum isophotal radius that fits into the FoV of MUSE. For ∼80% of the sample, we have complete coverage of the optical extent of the AMUSING++ galaxies, which is R25 < 42'' (extension from the center to the corner of the MUSE FoV).
The top panel of Figure 3 shows the morphological distribution of the sample. All types are covered by the compilation, with early types (E+S0) comprising one-third of the total number, and the remaining ones comprising mostly late types (Sc mainly), with a low fraction of Sd-Sm-Irregulars. The bottom panel of Figure 3 shows the g − r color versus the r-band absolute magnitude distribution. Like in the case of the morphological types, the AMUSING++ compilation covers a substantial fraction of this diagram. A visual comparison with similar distributions presented by other IFS-GS, in particular CALIFA (Walcher et al. 2014) or MaNGA (Sánchez et al. 2018), does not show any clear/strong difference. Thus, the current compilation does not seem to be biased toward a particular morphological type, color, or magnitude.
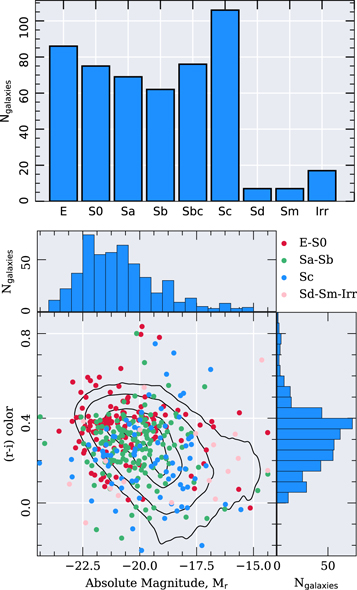
Figure 3. Top panel: morphology distribution of the AMUSING++ sample. This parameter was extracted directly from the Hyperleda database (Makarov et al. 2014, http://leda.univ-lyon1.fr/). For ∼100 galaxies, there is no information about their morphology; therefore, they were not included in this plot. Bottom panel: r − i color vs. Mr absolute magnitude diagram for the sample. The red circles comprise E-S0s, green circles include Sa–Sb–Sbc, blue circles Sc, and pink circles Sd-Sm-Irr. The contours represent the same distribution for the NSA catalog, at different density levels (99% for the outermost, then 95%, 80%, 65%). Over each axis a histogram of the distribution of the r − i color and Mr absolute magnitude is plotted.
Download figure:
Standard image High-resolution image3. Data Analysis
The reduction of the AMUSING raw data cubes was performed with reflex (Freudling et al. 2013) using version 0.18.5 of the MUSE pipeline (Weilbacher et al. 2014) with default parameters. Also, we use the processed data cubes downloaded directly from the ESO archive.10 At this stage, we perform a visual inspection of the reduced data cubes to exclude objects observed under very poor weather conditions (mostly bad seeing), with clear problems in the sky subtraction (plagued of residuals in the entire spectral range) or showing problems in the combination of different cubes (vertical/horizontal patterns). In some cases, the problems were not evident after performing a preliminary analysis of the data, as the one described below. Altogether, poor data cubes correspond to a few percent of the compiled data set, and they are all excluded from further considerations.
The analysis of the emission lines and the stellar population content of the data cubes was performed using the Pipe3D pipeline (Sánchez et al. 2016b), a fitting routine adapted to analyze IFS data using the package FIT3d (Sánchez et al. 2016c). Pipe3d has been extensively used in the analysis of data cubes from the main large IFS surveys: CALIFA (e.g., Cano-Díaz et al. 2016; Sánchez-Menguiano et al. 2018), MaNGA (e.g., Ibarra-Medel et al. 2016; Barrera-Ballesteros et al. 2017; Sánchez et al. 2018; Thorp et al. 2019), and SAMI (Sánchez et al. 2019). This package provides the user with data products that contain information of the emission lines and the stellar continuum.
The fitting procedure is described in detail by Sánchez et al. (2016b); here, we provide just a brief description. The procedure starts by performing a spatial binning on the continuum (V-band) in order to increase the signal-to-noise ratio (S/N) in each spectrum of the datacube, preserving as much as possible the original shape of the light distribution. After that, all of the spectra within each spatial bin are co-added and treated as a single spectrum. First, the stellar kinematics and stellar dust attenuation are derived, using a limited set of SSPs comprising 12 populations. We adopted a stellar population library extracted from the MIUSCAT templates (e.g., Vazdekis et al. 2012), which cover the full optical range included in the MUSE spectra. This first step is performed to limit the effects of the degeneracy between metallicity, velocity dispersion, and dust attenuation. Once these parameters are recovered, the final stellar population model is derived by performing a similar fitting procedure using an extensive SSP library. The actual Pipe3D implementation adopts the GSD156 stellar library, which comprises 39 ages (from 1 Myr to 14 Gyr) and four metallicities (from 0.2 to 1.6 Z⊙), extensively described in Cid Fernandes et al. (2013), and used in previous studies (e.g., Ibarra-Medel et al. 2016; Ellison et al. 2018; Thorp et al. 2019). Then, a model of the stellar continuum in each spaxel is recovered by re-scaling the model within each spatial bin to the continuum flux intensity in the corresponding spaxel. The best model for the continuum is then subtracted to create a pure gas data cube (plus noise).
A set of 30 emission lines within the MUSE wavelength range (HeIλ4922, [O iii]λ5007, [O iii]λ4959, Hβ, [Fe ii]λ4889, [Fe ii]λ4905, [Fe ii]λ5111, [Fe ii]λ5159, [N i]λ5199, [Fe ii]λ5262, [Cl iii]λ5518, [Cl iii]λ5537, O iλ5555, [O i]λ5577, [N ii]λ5754, HeIλ5876, [O i]λ6300, [S iii]λ6312, Si iiλ6347, [O i]λ6364, Hα, [N ii]λ6548, [N ii]λ6584, He iλ6678, [S ii]λ6717, [S ii]λ6731, [Ar iii]λ7136, [O ii]λ7325, [Ar iii]λ7751, and [S iii]λ9069), are fitted spaxel by spaxel for the pure gas cube, by performing a non-parametric method based on a moment analysis. We re-cover the main properties of the emission lines, including the integrated flux intensity, line velocity and velocity dispersion. For this analysis, we assume that all emission lines within a spaxel share the same velocity and velocity dispersion, as an initial guess. For doing so, we select, as an initial guess, the values derived from the fitting of the usually strongest emission line across the entire FoV, i.e., Hα, using a simple Gaussian function. Then, we perform a moment analysis weighted by this Gaussian function, as extensively described in Sánchez et al. (2016c). This way, we suppress the possible contribution of adjacent emission lines and derive the properties of considered line without considering a particular shape. The data products of this procedure are a set of bidimensional maps of the considered parameters, with their corresponding errors, for each analyzed emission line. Figure 4 shows an example of the results of the fitting procedure for a spectrum extracted from an MUSE cube.
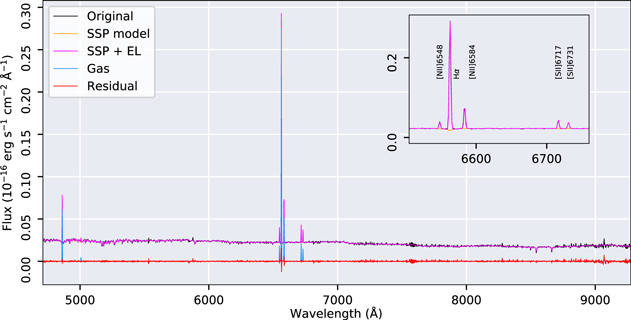
Figure 4. An example of the results of the fitting procedure to recover the best model of the stellar population and emission lines applied to a spectrum extracted from a galaxy within our compilation, NGC 1762, shifted to the rest frame. In black is shown the spectrum corresponding to a spaxel from the nuclear region. In yellow is shown the best stellar population model. In magenta, the best joint model of the multi-SSP fitting and emission lines (EL) is shown. In blue, the pure gas spectrum after subtraction of the best-fit SSP model to the original spectrum is shown. Finally, in red, the residuals of the fitting procedure are shown. Right upper inset: zoom of the same figure covering the Hα to [S ii]λλ6717,6731 spectral window.
Download figure:
Standard image High-resolution image4. Methodology to Select Outflows
In order to uncover the presence of outflows in the AMUSING++ compilation, we first need to describe the spatially resolved ionization conditions and kinematics for galaxies without accompanying outflows (i.e., the majority of the compilation sample). Then, we identify which galaxies present extended ionized gas structures visible morphologically but presumably not associated with other sources (e.g., star formation, post-AGBs, and AGNs). We describe the adopted procedure by exploring the properties of two galaxies, a methodology later applied to all galaxies in our sample.
4.1. NGC 1762: A Normal Star-forming Galaxy
The interplay between the ionized gas and stellar continuum emission is closely related to the local conditions of the ISM. In the absence of non-stellar ionization, there is a spatial coupling between gas ionization and stars. That is, the ionized gas is distributed throughout the stellar disk, with the main source of ionizing photons produced by massive OB stars. The Hα emission traces the spiral arms, while [N ii] emission is increased toward the center of spiral galaxies either for the higher abundance in the nuclear regions (Vila-Costas & Edmunds 1992; Sánchez et al. 2014), by the presence of nonthermal photoionization like shocks (e.g., Ferland & Netzer 1983), the existence of an AGN (e.g., Osterbrock 1989; Davies et al. 2016), or ionization due to old stars (e.g., Binette et al. 1994; Singh et al. 2013). On the other hand, elliptical galaxies present weak or undetected emission lines, with poor or null star-formation activity. Post-AGB and evolved stars represent the major contribution to the ionization in retired galaxies (Gomes et al. 2016), with the possible presence of AGN ionization in a fraction of them (e.g., Sánchez et al. 2018).
To illustrate the different contributions to the ionization in a single galaxy, we use the spiral galaxy NGC 1762 (part of the AMUSING++ sample) as an example case. Figure 5(a) shows the gri color image11 of this object extracted from the MUSE data. This 60'' × 60'' size image shows a nearly face-on late-type galaxy with clear spiral arms.
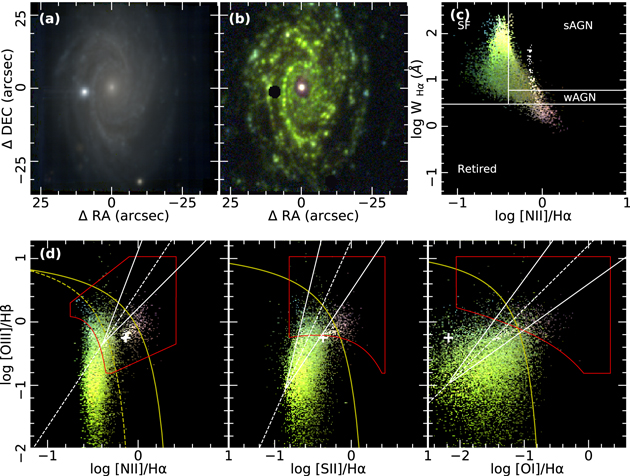
Figure 5. Different maps and diagnostic diagrams derived for NGC 1762, a star-forming galaxy in the AMUSING++ sample. Panel (a): gri color image reconstructed from the MUSE data cube. Panel (b): emission-line image constructed with the fluxes of [N ii]λ6584 in red, Hα in green, and [O iii]λ5007 in blue. No cut in the signal-to-noise was applied to construct this image. A square-root scale has been applied to each filter to enhance the emission of the ionized gas. The three filters are at the same scale flux. Black represents regions of very low intensity or no ionized gas. Panel (c): spatially resolved WHAN diagram (Cid Fernandes et al. 2011), [N ii]/Hα vs.  , which separated SF galaxies from strong and weak AGNs (sAGNs and wAGNs, respectivelly) and retired sources. Each point corresponds to a single spaxel, showing the same color of that spaxel in the emission-line image presented in figure (b). Panel (d): spatially resolved diagnostic diagrams associated with the ionized gas distribution from (b) ([N ii] = [N ii]λ6584, [S ii] = [S ii] λλ6717, 6731 and [O i] = [O i]λ6300). The color code is the same as that used in the previous panel. The yellow dashed and discontinuous curves represent the demarcation lines from Kauffmann et al. (2003) and Kewley et al. (2001), respectively. The red lines shows the boundaries of fast and slow shock models grids from mappings iii (e.g., Allen et al. 2008) with different shock velocities, metallicities, and pre-shock densities computed by Alatalo et al. (2016). The white cross represents the central ionization (3'' × 3'' centered in the optical nucleus). The continuous diagonal white lines represent the locus proposed by Sharp & Bland-Hawthorn (2010) of shock ionization (rightmost) and AGN ionization (leftmost). The white dashed line between them represents the bisector line between shocks and AGN ionization. All demarcation lines have been included for reference.
Download figure:
Standard image High-resolution imageIn order to visualize the ionized gas distribution across galaxies, we construct an RGB emission-line image where each color represents the flux intensity of a single emission line, R: [N ii]λ6584, G: Hα and B: [O iii]λ5007. We show the constructed color emission-line image for NGC 1762 in Figure 5(b). This image reveals how the spatial distribution of the ionized gas follows the same distribution of the continuum emission. In particular, note that the Hα flux dominates the emission over the two other lines in most of the disk, with [N ii] increasing toward the nucleus and [O iii] being weak compared with the two other lines almost at any location (apart from the nucleus). At this resolution, one is able to identify many green clumpy structures associated with H ii regions. Quantifying the number of H ii regions in MUSE galaxies is important to understanding the chemical evolution in galaxies (e.g., Sánchez et al. 2015; Sánchez-Menguiano et al. 2018). Finally, the central region presents an almost point-like strong ionized region, with high [N ii] and [O iii] that most probably corresponds to an AGN. The advantages of displaying the ionized gas component in one RGB image is that we can explore immediately the distribution of different ionization sources by just looking at such color and intensity.
Line ratios sensitive to the ionization are commonly used to explore the ionization source in galaxies. The [N ii]/Hα ratio gives a quantitative assessment of the different physical processes that ionize the gas. This ratio has the advantage (over other lines) of being both accessible in optical spectra and being almost insensitive to dust attenuation due to their small wavelength separation. The equivalent width (EW) of Hα ( ) has also been used to explore the ionization in galaxies. Ionizing sources that produce weak emission lines also present low equivalent widths (
 < 3 Å). Ionization by evolved stars, as post-AGB, frequently present this kind of line ratio and EWs (e.g., Binette et al. 1994; Stasińska et al. 2008; Lacerda et al. 2018). The remaining ionization sources that produce emission lines present higher
  in general (>3 Å). Figure 5(c) shows the WHAN diagram, introduced by Cid Fernandes et al. (2011), which combines both the [N ii]/Hα ratio and the
  , for each ionized spaxel from the emission-line image presented previously. Note that the
  is one of the parameters derived as part of the fitting procedure performed by Pipe3D.
Each pixel in the emission-line image is associated with an unique pair of values  and [N ii]/Hα in the WHAN diagram. The result is the spatially resolved WHAN diagram shown in Figure 5(c). We note that the gas in the spiral arms is mainly distributed in the SF regions in this diagram as revealed by the green color. Meanwhile, the inter-arm gas and the gas surrounding the nucleus are distributed in the AGN region and in regions associated with ionization by hot low-mass evolved stars (HOLMES), the main ionization source in retired galaxies.
Excluding the demarcation at  = 3 Å, the transition lines in the WHAN diagram are just the best transposition of the demarcation curves from Kewley et al. (2006) and Stasińska et al. (2006) in the classical diagnostic diagram, like the BPT one involving the [O iii]/Hβ versus [N ii]/Hα line ratios (e.g., Baldwin et al. 1981). The vertical line at log [N ii]/Hα = −0.4 maps the division between SF and AGNs regions, while the horizontal line at
  = 6 Å represents the classical separation between quasars and Seyfert galaxies (e.g., Baldwin et al. 1981). Since this is a projection, the separation between the different ionizating sources is not as clean as in the classical diagnostic diagrams, and its use is recommended only if the [O iii]/Hβ ratio is not available, as indicated by Cid Fernandes et al. (2011).
Veilleux & Osterbrock (1987) were the first to introduce diagnostic diagrams based on emission line ratios as a method to classify entire galaxies. They introduced the [N ii]/Hα, [S ii]/Hα and [O i]/Hα versus [O iii]/Hβ diagnostics already presented by Baldwin et al. (1981). Several demarcation curves have been proposed over these diagrams to try to separate the soft ionization sources, like H ii regions, from those with a harder ionization, like AGNs. The most common is the one proposed by Kewley et al. (2001, hereafter K01) based on photoionization grid models. This curve represents the maximum envelope in the considered line ratios that can be reached by ionization due to multiple bursts of star formation. Line ratios above this curve cannot be reproduced by ionizing photons produced by young OB stars. Classically the region above this curve is known as the region populated by AGNs, although it is not exclusive of this ionizing source (as is broadly assumed).
The ionization produced by old stars (post-AGBs, HOLMES), commonly found in retired galaxies, at large extra-planar distances in disk galaxies, or in the central and inter-arm regions of galaxies, can also reproduce the line ratios observed in the LINER region of the BPT diagram (e.g., Binette et al. 1994; Stasińska et al. 2008; Singh et al. 2013). The equivalent widths that produce these sources tend to be much lower compared with that from SF or AGN ionization (Singh et al. 2013; Lacerda et al. 2018). It has been shown that the demarcation at  < 3 Å is a good indicator for the ionization produced by this kind of star (e.g., Gomes et al. 2016).
Photoionization induced by shocks can also reproduce the line ratios observed in the AGN/LINER region (e.g., Alatalo et al. 2016). The combination of three free parameters in shocks (magnetic fields, shock velocities, and the pre-shock densities), give rise to a wide range of values of line ratios that may cover an ample region in the diagnostic diagrams, from SF regions to AGN/LINER ones (e.g., Allen et al. 2008). As a consequence, for shock ionization, a demarcation curve does not exist, as for the other ionizing sources. Nevertheless, there have been efforts to constrain certain regions of the diagram where shocks are more frequently found, depending on the origin of the galactic wind, i.e., SF-driven or AGN-driven (e.g., Sharp & Bland-Hawthorn 2010).
In Figure 5(d), we present the spatially resolved diagnostic diagrams for the example galaxy NGC 1762. They, combined with the emission-line image, provide us with unique information about where the different sources of ionization take place inside a galaxy. The ionized gas located at the spiral arms (greenish in Figure 5(b)), is found in the SF regions of the diagrams clearly below the K01 demarcation in the three of them. On the other hand, the gas in the nucleus is located at the AGN/LINER region. If we combine the information provided by these diagnostic diagrams with the distribution along the WHAN diagram, we can conclude that nuclear regions present two kinds of ionizations. The very center presents a hard ionization with high  (i.e., the signatures of an AGN). However, the surrounding regions present also hard ionization, but with low
  (i.e., the signature of ionization by old stars). This later one is spatially associated with the optical extension of the bulge.
Despite the several spaxels falling in regions constrained by the shock models grids, and in regions compatible with SF- and AGN-driven winds, it is unlikely that they are associated with shock ionization due to their spatial distribution (as they are concentrated in a nuclear almost point-like emission region). Although small galactic fountains can drive outflows and produce shock line ratios (such as giant H ii regions), it is unlikely that this is the main ionization source in galaxy disks. Furthermore, in this work, we are interested in kiloparsec scale outflows, instead of galactic fountains.
Although the previous analysis was made with a spiral galaxy, the spatial concordance of the ionized gas distribution with the stellar continuum emission also applies for ellipticals, although these might present weaker ionized gas (in the absence of an AGN). For those galaxies, most of the ionized regions would be spread from the right-end of the SF-region toward the LINER-like region in the diagnostic diagrams (e.g., Lacerda et al. 2018). They will present little or no evidence of clumpy ionized regions (like the HII regions observed in spirals), with low values of  (Gomes et al. 2016), and with an underlying continuum dominated by an old stellar population (e.g., Figure 3 of Sánchez et al. 2014).
4.2. Outflows and Extended Emission-line Objects in AMUSING++
Under the presence of a mechanism perturbing the gas, the spatial coincidence with the continuum emission might not necessarily persist. Galactic outflows are one phenomenon that can eject gas out of the galaxies making the emission of ionized gas and the continuum emission become spatially uncoupled. The warm phase of outflows (T ∼ 104 K) is directly observable in high spatial resolution images (e.g., Strickland et al. 2004; Mutchler et al. 2007). At this temperature, optical emission lines reveals typically hollow conical, biconical, or filamentary structures of ionized gas emerging from the nuclear regions (e.g., Veilleux & Rupke 2002; Strickland et al. 2004; López-Cobá et al. 2016). Therefore, our primary criteria to select galaxies hosting galactic outflows is based on the spatial distribution of the ionized gas: ionized gas decoupled from a plausible underlying source (young/old stars or an AGN), spatially distributed following bi-cones, cones or filamentary structures, departing from the inner toward the outer regions of galaxies (e.g., Heckman et al. 1990; Veilleux & Rupke 2002; Strickland et al. 2004).
Based on the emission-line images of the AMUSING++ galaxies as well as the spatially resolved diagnostic diagrams described before, we select our outflow candidates among those galaxies with extended, filamentary, and conical emission. The location of the extended emission in the diagnostic diagrams must be at least not fully dominated by SF ionization and must be spatially decoupled from the stellar continuum. It is possible that, in some cases, the extended emission might not be due to the presence of an outflow. We will discuss their nature in Section 6. On the other hand, small-scale outflows (below the resolution of our data) could escape this scrutiny. So far, we have focused on large-scale ones, clearly identified with the current data set. Finally, we note galaxies with outflows analyzed in this study that have already been reported. However, it will be possible to make comparisons with galaxies not hosting outflows using data of similar quality, a task not yet addressed with MUSE data. Finally, the so-called jellyfish galaxies are excluded from this selection criterion due to the different nature of the extended ionized gas emission.
In the next section, we show the case of an outflow galaxy detected using the previous technique to illustrate the main features that enabled us the identification of all candidates.
4.2.1. The Ionized Cone in IC 1657
Figures 6(a), (b) shows the gri color image and ionized gas distribution of galaxy IC 1657. This is a highly inclined (i = 78°) spiral galaxy. There is no information in the literature about the presence or signature of an outflow in this galaxy, although it is in list of outflows candidates by Colbert et al. (1996) but with no reported analysis of the emission lines. The RGB emission-line image in Figure 6(b), reveals what seems to be a conical structure of gas (more intense in [N ii], i.e., reddish) perpendicular to the disk plane, which looks to be outflowing from the optical nucleus. As indicated before, conical structures like this are typical from outflows produced by either SF or AGNs. The Hα emission reveals the H ii regions in the galaxy disk (greenish), while some ionized clumps present a slightly larger [O iii] emission at the edge of disk (blueish). The  and [N ii]/Hα ratio of the gaseous cone component is not compatible with being ionized by SF (log [N ii]/Hα < −0.4 ). It is neither compatible with being ionized by evolved stars (
 > 3 Å) as revealed by the WHAN diagram (Figure 6(c)).
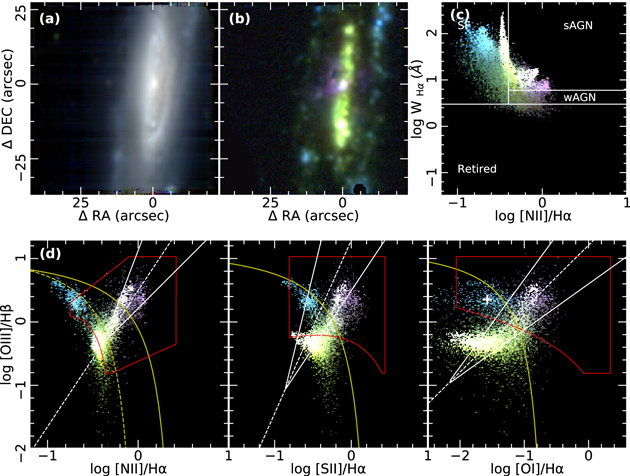
Figure 6. IC 1657 an outflow host galaxy in the AMUSING++ sample. All panels are similar to those presented for NGC 1762, in Figure 5.
Download figure:
Standard image High-resolution imageThe spatially resolved diagnostic diagrams can be interpreted as follows: the clumps with stronger [O iii], located at the outskirts in the emission-line image, are compatible with having low-gas metallicities in these diagrams. Finally, the clumps dominated by Hα emission in the center of the disk are located where the high-metallicity H ii regions are found. Thus, the emission-line color-image illustrates qualitatively the metallicity gradient observed in galaxies (e.g., Sánchez et al. 2014). On the other hand, the gaseous cone, visible morphologically, is well separated in all diagnostic diagrams from the ionization most probably due to star formation (green clumpy structures). It clearly spreads toward regions where a harder ionization source is required to reproduce the observed line ratios. In the WHAN diagram, the cone nebulae is identified in regions characteristic of AGN-like ionization. Low values of the  (<3 Å) are characteristic in extra-planar (Flores-Fajardo et al. 2011; Jones et al. 2017) and non-extra-planar diffuse ionized gas (Singh et al. 2013; Lacerda et al. 2018). Nevertheless, the predominant large values of the
  exclude the low-mass evolved stars as the main source of ionization in the cone nebulae. Regarding the line ratio diagnostic diagrams, the spaxels spatially associated with the ionized cone are also located at the classical AGN-ionized region. Indeed, all of them fall within the region occupied by shock ionization according to the predicted line ratios from theoretical models (e.g., mappings iii). Moreover, the line ratios at the ionized cone are more compatible with the SF-driven wind scenario according to the empirical demarcations from AGN-driven and starburst-driven winds by Sharp & Bland-Hawthorn (2010). Therefore, shock ionization produced by an SF-driven outflow seems to be the most likely explanation for the observed morphology as well as its observed line ratios.
From this example, it is clear that the intrinsic complexity of outflows inhibits its direct identification in diagnostic diagrams. It is just by a discarding process of ionizing sources, considering both line rations and morphologies simultaneously, in which it is possible to obtain hints of shock ionization, indicative of the possible presence of outflows (in agreement with the recent review by Sanchez 2019).
4.3. Kinematics: Velocity Dispersion and Hα Velocity
Most SFGs are disk-dominated spiral galaxies (e.g., Sánchez et al. 2018), which typically present a velocity dispersion ranging from some tens of km s−1 (e.g., Bershady et al. 2010) to ∼100 km s−1 in the case of turbulent or high-SF galaxies (Genzel et al. 2008; Green et al. 2010). At the wavelength of Hα, the spectral resolution of MUSE is σ ∼ 50 km s−1, which allows us to resolve the velocity dispersion of these galaxies in a wide range of galactocentric distances. For early-type galaxies, the velocity dispersion is much larger, in general, and therefore, it is well recovered with this data. Galactic outflows are generally associated with increases in the velocity dispersion, a property used to characterize, detect, and confirm them (e.g., Monreal-Ibero et al. 2010; Rich et al. 2011, 2015).
Figure 7 shows 2D maps of the [N ii]/Hα line ratio and Hα velocity dispersion for the two archetypal galaxies described throughout this article. In the case of NGC 1762, there is a clear increase of the line ratios toward the center, as discussed in previous sections. This increase is spatially associated with an increase in the velocity dispersion, which traces clearly the location of the bulge. This reinforces our interpretation that a fraction of the ionization in this region is due to old stars that dynamically present hot/warm orbits comprising the bulge (e.g., Zhu et al. 2018a, 2018b). On the other hand, the velocity dispersion along the disk presents values ∼40–70 km s−1, i.e., within the expected values for an SF disk galaxy (e.g., Genzel et al. 2008; Bershady et al. 2010).
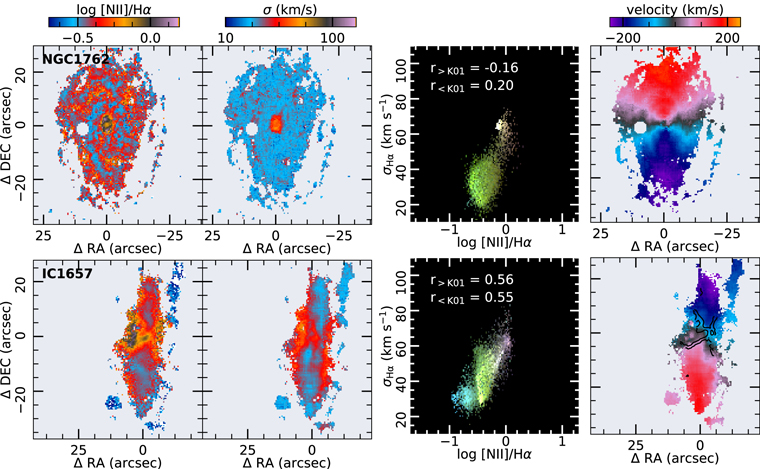
Figure 7. Ionization and kinematic diagrams for the two example galaxies: NGC 1762 (top panels) and IC 1657 (bottom panels). Each panel shows, from left to right: (i) the spatially resolved [N ii]/Hα line ratio; (ii) velocity dispersion maps; (iii) the [N ii]/Hα–σ resolved map color coded with the emission-line image from Figures 5(b) and 6(b), respectively. Two correlation coefficients r, between these variables were computed for spaxels lying above (r > K01) and below (r < K01) the K01 curves; and (iv) the rightmost panel shows the Hα velocity map. The black contours superimposed in the IC 1657 velocity map represent the best demarcation of the ionized cone traced with the log [N ii]/Hα ratio map with levels −0.3 and −0.2 dex.
Download figure:
Standard image High-resolution imageIn the case of the galaxy hosting an outflow, IC 1657, the velocity dispersion along the disk is of the same order. However, there is an evident increase of the velocity dispersion associated with an enhancement of the [N ii]/Hα ratio along the semiminor axis of the galaxy. This enhancement is spatially associated not only with the cone structure observed in the emission-line image (Figure 6) but additionally with another conical structure in the opposite direction of the main one described above (i.e., behind the disk). A detailed inspection of Figure 6 shows that indeed this second conical structure is appreciable there too. The dust attenuation of the disk (see, Figure 6(a)) may be causing the partial obscuration of this second cone.
Following a similar procedure as the one adopted to create the diagnostic diagrams (Figures 5 and 6), we construct a spatially resolved σ–[N ii]/Hα diagram. A positive correlation between the ionization strength and velocity dispersion is typically found in the presence of shocks (e.g., Monreal-Ibero et al. 2010; Rich et al. 2011, 2015; Ho et al. 2014; López-Cobá et al. 2016). This is a natural correlation if the emission lines present a broad component, induced by an asymmetry of the line profile, associated with shocks. Velocity dispersions larger than 90 km s−1 have been associated with shocks produced by galactic winds (e.g., Rich et al. 2015).
Figure 7 (right panel) shows the spatially resolved σ–[N ii]/Hα diagram, color coded with the emission-line images presented in Figures 5(b) and 6(b), respectively. In general, low-velocity-dispersion values (<50 km s−1) are observed where the SF is the dominant ionization. The nucleus in both cases present high dispersion values (>50 km s−1). As a positive correlation between these variables is a signature of shocks (Monreal-Ibero et al. 2010), we compute the correlation coefficients between both parameters for spaxels dominated by SF ionization (those lying below the K01 curve in the BPT diagram) and for spaxels lying above the K01 curve, presumable mostly dominated by shocks in the presence of outflows. In the case of NGC 1762, the spaxels with higher dispersion (those close the nucleus) present a negative correlation, while those associated with the disk present a very weak correlation (r < K01 = 0.20). On the other hand, IC 1657 presents a moderate positive correlation for spaxels in the disk and also in the ionized cone (r < K01 = 0.55 and r > K01 = 0.56, respectively). The positive correlation in the ionized cone may suggests the presence of multiple or broad components, produced most probably by the presence of a shocked layer of gas.
The rightmost panel of Figure 7 shows the Hα velocity maps for the two considered galaxies. In absence of an external agent perturbing the ISM, a regular rotation pattern is expected in the gas kinematics. NGC 1762 shows, indeed, the typical pattern of a rotating disk with symmetrical velocities around the center with a receding (north) and an approaching (south) side. On the other hand, the presence of the ionized cone observed in IC 1657 is producing deviations from the expected velocity pattern around the galaxy semiminor axis, where the outflow is expanding. This is also clear in the distribution of differential velocities between the ionized gas and the stars, i.e., the vgas − v⋆ maps (Figure 18 in Appendix C). We observe differences >60 km s−1 in the outflow influenced regions between both velocity maps, while in the unperturbed disks, the velocity difference is much smaller (compatible with zero in many cases). In Table 3, we report the W90 value of the absolute difference between both velocities across the FoV of the data,  . In general, spaxels of non-outflow host galaxies and with line ratios above the K01 curve tend to present smaller differences in
  than in galaxies hosting outflows.
As part of our candidates selection, beside looking for ionized regions where line ratios cannot be explained by the underlying continuum (stellar or AGN), with filamentary or conical structures, we explore the distribution of the velocity dispersion and its agreement with an enhancement of the [N ii]/Hα (and when feasible of [S ii]/Hα and [O i]/Hα, which are also associated with shocks). In addition, we explore possible perturbations in the velocity maps, again associated with similar enhancements in the considered line ratios and increases in the velocity dispersion.
4.4. The Cross-correlation Function: Emission-line Asymmetries
The broad profiles detected at the location of the outflowing regions may indicate the presence of multiple components. Therefore, analyzing the shape of the emission lines is important in the identification of these processes. This shape is the result of the sum of all of the kinematics components associated with different ionizing processes occurring at each location within a galaxy, integrated along the line of sight. Although the typical profile to model emission line at our spectral resolution is a Gaussian function (Voigt functions are used in the case of better resolution), in many cases more complex profiles are required to characterize the observed emission lines. Regardless of the functional form adopted for modeling, and in the absence of any perturbing external mechanism, the emission lines appear to be symmetrical around their intensity peak. Line bisectors are the best way to describe the symmetry of a line. The study of asymmetries of line profiles is a technique that was developed for the analysis of stellar spectra to study granulation decades ago (e.g., Gray 1988). Although this technique was designed to analyze absorption lines, it is straightforward to adapt it to study emission line profiles. In this case, it is useful to derive the cross-correlation using a model profile. This way, the contrast is enhanced, and it is possible to include several emission lines simultaneously in the analysis.
The cross-correlation technique is an estimation of the similarity of two signals that gives as result a set of correlation coefficients for every lag or offset in the frequency or velocity space (defined as τ). If the two signals are similar but they differ by a certain lag/offset, then the maximum of equivalence between them is reached at  , where rmax is the maximum value of the cross correlation, following a symmetrical profile. This technique has already been applied successfully to measure the degree of symmetry of emission lines associated with ionized gas in galaxies (e.g., García-Lorenzo 2013; García-Lorenzo et al. 2015). The resultant cross-correlation function (CCF), i.e., the distribution of correlation coefficients along τ (in this case the velocity), is a measure of the average profile of the spectrum of reference (in the velocity space).
Following García-Lorenzo (2013), we compute the CCF in a spectral window that covers multiple emission lines close in wavelength. We use the pure gas spectra (i.e., continuum subtracted, as described in Section 3), and a model of all involved emission lines is generated by adopting a set of Gaussian functions with FWHMs equal to the spectral resolution of the data (FWHM ∼ 2.6 Å). Preliminary fits to the spectra are performed with the considered model to estimate the intensity of the emission lines involved. The relative intensities of the lines are then passed to the template. Finally, the template is shifted to the redshift of the galaxy (previously determined by Pipe3D). The cross-correlation is finally performed between this adjusted template and the gas-pure spectra.
Figure 8 shows the cross-correlation technique applied to two particular spectra in a spectral window that covers the Hα + [N ii] λλ6548,6584 emission lines. This way the effect of the residual-continuum is mitigated. The top panels show the case of a spectrum extracted from an H ii region of NGC 1762. The emission profiles seems to be well described by a single Gaussian component. When it is cross correlated with the appropriate template, the CCF shows multiple peaks at different velocities. However, the maximum similarity is reached for a peak that is near the systemic velocity (i.e., near zero at the scales shown in the figure). We select the CCF at a regime within ±500 km s−1 around this peak, and compute the bisectors at different intensity levels relative to the peak (from 90% to 20%, with steps of a 10%). Then, a fit to the selected range of the CCF is performed to have a better estimation of the peak velocity and velocity dispersion. Finally, we estimate Δvlevel, i.e., the velocity difference between the bisector at each intensity level and the corresponding velocity of the peak intensity. The mean of all estimated Δvlevel for the different levels is stored as the final estimation of the asymmetry of the lines for the considered spectrum and spectral range (defined as Δv).
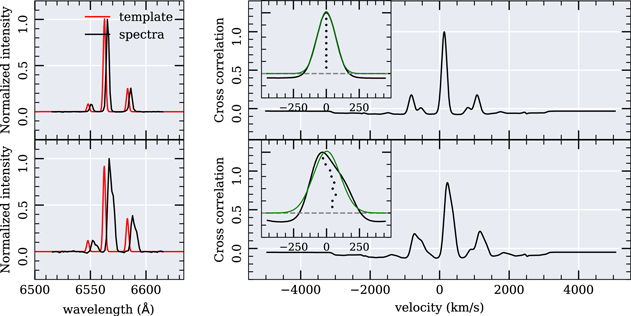
Figure 8. Illustration of the cross-correlation method applied to the emission line spectra to compute the asymmetries of the line profiles. Top (bottom) panels show the cross-correlation technique applied to a spectra containing the Hα + [N ii] emission lines described in this case by a single (multiple) kinematic component. Top left panel: the black solid line represents the normalized gas spectrum, shifted to the rest frame, for a spaxel located on a spiral arm of NGC 1762. The red line represents the template used to cross-correlate the observed spectra. The templates are modeled with three Gaussian functions (one for each emission line) with the FWHM fixed to the instrumental resolution. Top right panel: the main panel shows the normalized cross-correlation function (CCF) in velocity space between the model and the spectra for a wide range of velocities (−5500 to 5500 km s−1). The inset in the right panels shows a zoom for the velocity range (shifted to the zero velocity) where the maximum of the cross correlation is observed. Crosses represent the bisectors of the CCF at different intensity levels relative to the peak, ranging from 10% to 90%. The green line represents the best Gaussian fit to the CCF distribution. The bottom panels show the same plots for a spectrum extracted from the conical ionized gas structure detected in IC 1657 (see Figure 6(b)), i.e., a clear candidate to galactic outflow.
Download figure:
Standard image High-resolution imageThe second example in Figure 8 corresponds to a spectrum extracted from the outflowing region discovered in IC 1657. In this case, the bisectors show clear deviations from the peak velocity, with an obvious shift to the blue with respect the central velocity. These kinds of asymmetries are typical of outflows (e.g., Ho et al. 2014; Maiolino et al. 2017). In general, Δvlevel represents the velocity with respect to that of the intensity peak, which does not necessarily correspond to the systemic velocity (except in the case that the emission line profiles are described well by a single component).
We apply the described methodology to the whole pure gas cube of each galaxy to obtain a set of asymmetry maps (Δvlevel, one for each intensity level) and the corresponding mean asymmetry (Δv), estimated along all asymmetry levels.
Figure 9 shows the derived asymmetry maps for the different levels and the final mean map for NGC 1762 and IC 1657. In the case of NGC 1762, almost no asymmetry is detected across the entire disk of the galaxy. At the central regions—dominated by the bulge—an asymmetry toward the opposite velocity of the disk is found. This asymmetry may indicate the existence of a central-region counter rotation or disturbed kinematics that could be associated with the presence of an AGN candidate discussed above.
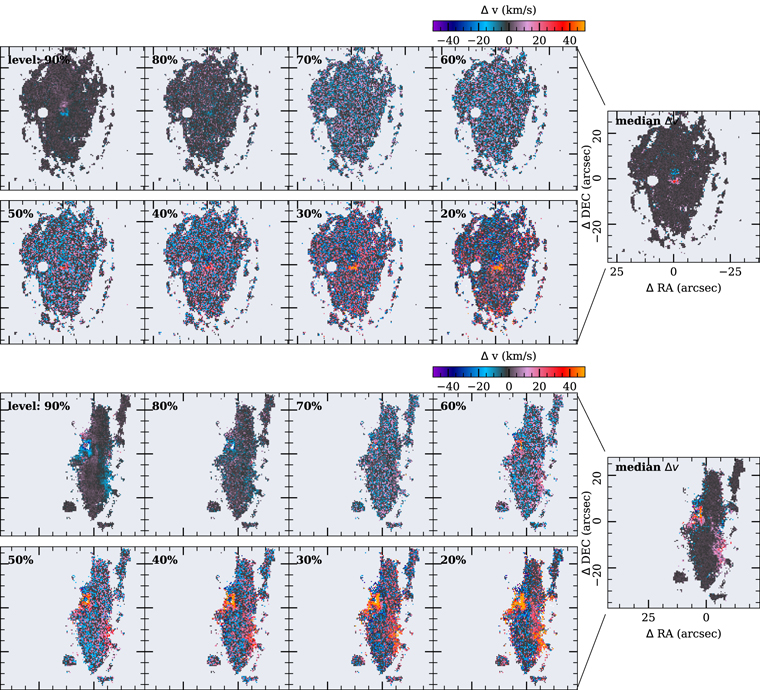
Figure 9. 2D maps of the asymmetries at different intensity levels for the two archetypal galaxies described in this article: NGC 1762 and IC 1657 in the top and bottom panels, respectively. Spaxels with S/N > 4 in Hα are shown in these maps. Each panel shows the percentage of the flux with respect to the peak of the CCF at which the asymmetry is estimated (as illustrated in Figure 8), ranging from 90% to 20% in steps of 10%. The asymmetry, Δv, is defined as the difference between the bisector velocity at the corresponding intensity level and the velocity at which the peak intensity is found.
Download figure:
Standard image High-resolution imageOn the other hand, the asymmetry maps of IC 1657 clearly illustrate the complex kinematic structure associated with galactic outflows. The higher values of asymmetry are spatially associated with the velocity perturbations, the increase of velocity dispersion and the enhancement of line ratios found at the biconical structure that we describe as a galactic outflow. Following these results, we explore the asymmetry maps derived for all of the galaxies in the sample and inspect the possible association of high asymmetry values with the other properties describing an outflow. Any galaxy including these properties is selected as a candidate outflow for further inspection.
Figure 10 shows the distribution of the absolute value of asymmetries ( ) for all spaxels with an S/N > 4 in Hα for the two archetypal galaxies. This figure shows that NGC 1762 is dominated, in general, by low values of asymmetry (<15 km s−1), while IC 1657 presents a tail toward higher values (>50 km s−1). Although
  does not represent the real velocity of the extra components, it represents a lower limit of the velocity of the shocked gas in the case of outflows. Finally, we derive for each galaxy the W90 parameter for
  , i.e., the velocity difference between the 5th and 95th percentiles of the distribution of asymmetries for all of the spaxels of each datacube. We include in Table 2 this parameter just for spaxels dominated by the outflows in each of the host galaxy candidates. Figure 11 shows the distribution of these W90 values compared with the same distribution for all galaxies in the sample (and for all spaxels). This figure clearly illustrates how different the asymmetries are in the presence of perturbations like the ones introduced by outflows.
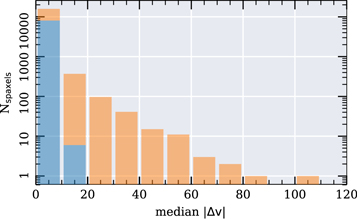
Figure 10. Distribution of the median values of the asymmetries  in each spaxel. The blue histogram corresponds to NGC 1762, and the orange corresponds to IC 1657.
Download figure:
Standard image High-resolution image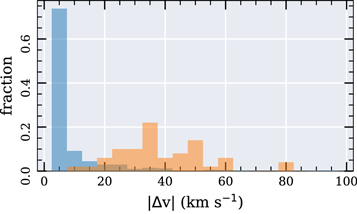
Figure 11. Distribution of asymmetries W90 parameter for the entire AMUSING++ sample without outflows (blue colors), and with an outflow (orange colors). W90 was calculated in each galaxy from the median  map, taking spaxels where the S/N > 4 in Hα. Histograms are normalized to the total number of galaxies in each subsample.
Download figure:
Standard image High-resolution image5. Results
Following the examples above, here we present the results of the search for and selection process of galactic outflows in the AMUSING++ compilation.
5.1. Candidate Galactic Outflows
Our continuum and emission-line images, the spatially resolved diagnostic diagrams, the kinematic properties of the lines, and their level of asymmetry, together provide a robust method to select candidate galactic outflows. All galaxies with detected conical/biconical emission in AMUSING++ are presented in Figure 12, and their main properties are listed in Table 2. The reconstructed continuum images as well as those of emission lines, are presented in Figure 12. This is our final sample of galaxies hosting a galactic outflow. Comments on some individual objects are included in Appendix B. The figures summarizing the whole analysis of the emission lines discussed before (asymmetries maps, kinematics, line ratios, and diagnostic diagrams) for each of these galaxies are included in Appendix C. The final sample of galactic outflows comprises 54 objects. Similar figures for all of the remaining 582 galaxies in the AMUSING++ compilation are included in Appendix D for reference.
Download figure:
Standard image High-resolution image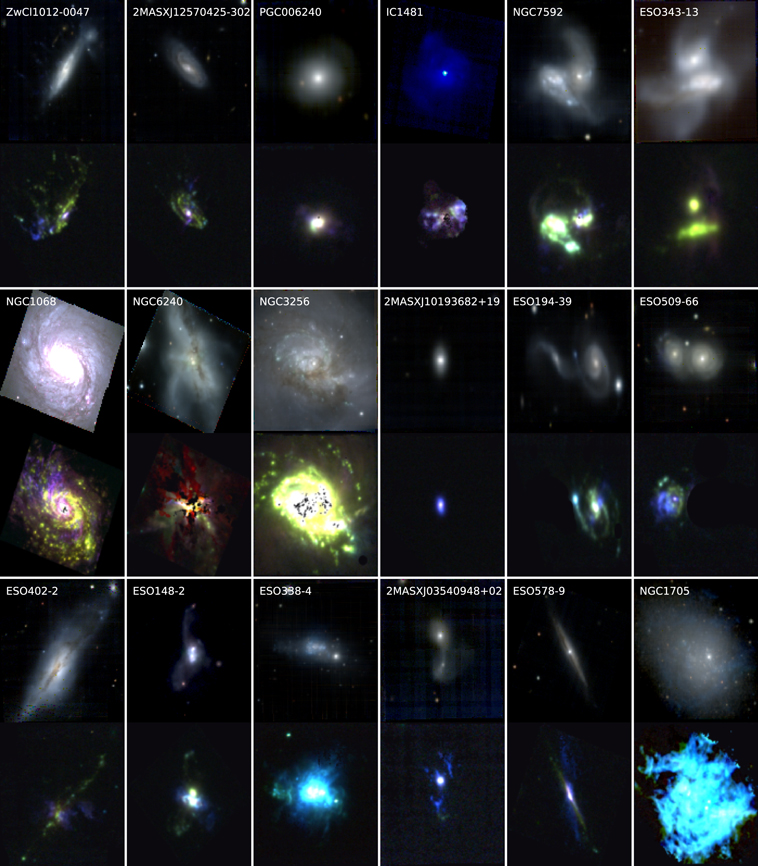
Download figure:
Standard image High-resolution image
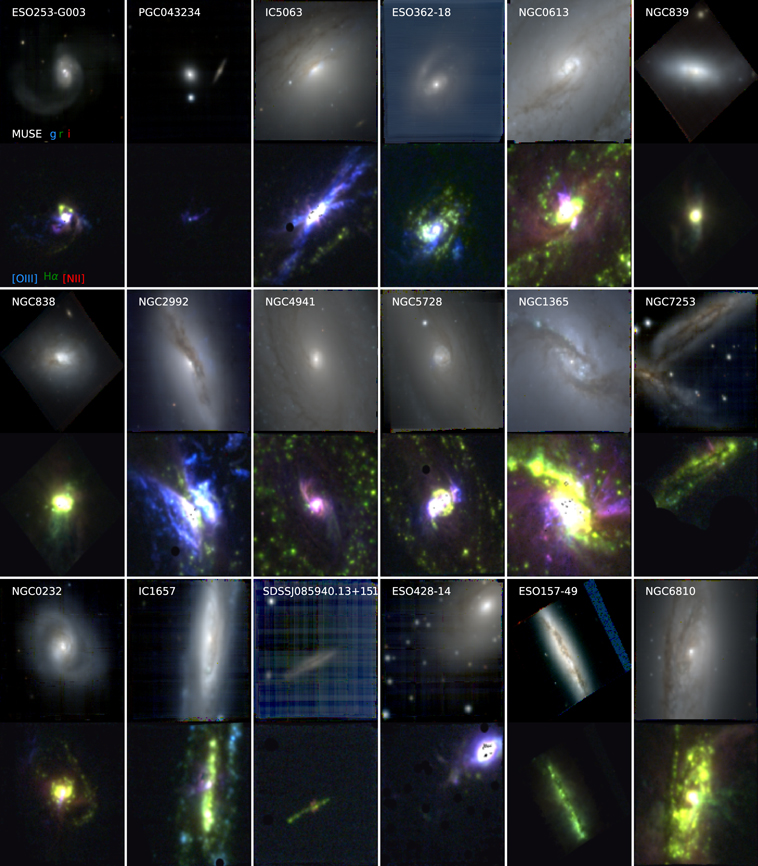
Figure 12. Galaxy outflow candidates based on our selection criteria (see the text). The continuum image and its corresponding emission-line image, as described in Figure 5 (panels (a) and (b)), are shown for each galaxy. The same FoV of 60'' × 60'' was selected for each galaxy, although the scale varies depending the redshift of the object (and the presence of a Mosaic or a single pointing).
Download figure:
Standard image High-resolution imageIn addition to the objects hosting galactic outflows, in the process of selecting them, we found a set of galaxies with extended ionized gas emission, but not fulfilling all of the criteria outlined in the selection process. Thus, for these galaxies, the ionization appears to be driven by other physical processes. These objects are presented in Figure 13 and their main properties in Table 2. We note that all of these galaxies are Elliptical and, in many cases, are located at the central regions of galaxy clusters. These filaments might be associated with the optical counterpart of cooling flows in elliptical galaxies.

Figure 13. Shown are galaxies with extended emission and filaments but that do not fulfill all of the criteria to be selected as bona fide galactic outflows. The panels show similar images as the one described in Figure 12.
Download figure:
Standard image High-resolution image5.2. Global Properties of the Sample
In this section, we characterize the main spectroscopic properties of the AMUSING++ sample, in order to (i) understand how the properties of galaxies hosting outflows compare with those of the general population, and (ii) determine which is the most likely physical mechanism driving the observed outflows.
5.2.1. Central Ionizing Source
Figure 14 shows the distribution of the [N ii]/Hα, [S ii]/Hα, [O i]/Hα, and [O iii]/Hβ line ratios extracted from a 3'' aperture centered in the optical nuclei, for those galaxies with detected line emission (601 out of 635), together with the WHAN diagram using the same aperture. This figure shows the galaxy distribution over the three classical diagnostic diagrams, which reflects the variety of ionizing sources in the nuclear regions of galaxies. Bluish colors in these diagrams ( > 6 Å) are associated with an SF nucleus (on the left) or with a strong AGN (on the right), while reddish colors are associated with retired galaxies or an LINER nucleus.

Figure 14. Diagnostic diagrams for the central spectrum of the AMUSING++ galaxies. Line ratios and equivalent widths were extracted from a 3'' × 3'' square around the optical nucleus of each galaxy, based on the analysis performed by Pipe3D. The [N ii]/Hα vs. [O iii]/Hβ diagnostic diagram is presented in the left panel, with the [S ii]/Hα vs. [O iii]/Hβ one centrally and finally the [O i]/Hα vs. [O iii]/Hβ in the right. The colored circles represent the AMUSING++ galaxies without outflows. Blue (black) inverted triangles represent galaxies hosting SF-driven (AGN-driven) outflows; pink diamonds are outflow host galaxies whose nuclei are dominated by either SF–AGN or characterized by shock excitation; green diamonds represent galaxies hosting outflows with central  < 3 Å; finally, red squares represent the elliptical galaxies with extended emission and filaments (see Figure 13). The black solid curve in the three diagnostic diagrams represents the Kewley et al. (2001) demarcation curves; the black straight line represents the Kewley et al. (2006) Seyfert-LINER demarcation line; the dotted line in the [N ii]/Hα represents the Kauffmann et al. (2003) demarcation curve. The rightmost panel shows the WHAN diagram (e.g., Cid Fernandes et al. 2011), comprising [N ii]/Hα vs.
  . In all diagrams, the color code represents the log
 value.
Download figure:
Standard image High-resolution imageWe define SF nuclei in general, or an SF-driven outflow (for candidates), as those galaxy nuclei located simultaneously below the K01 curves and with an  > 6 Å. Moreover, we define as AGNs, in general or AGN-driven outflows (for candidates), as those galaxy nuclei located simultaneously above the K01 curves and with an
  > 3 Å. These include both weak and strong AGNs as defined by Cid Fernandes et al. (2011). If the central value of
  < 3 Å, the galaxy is classified as retired or post-AGB dominated, irrespective of their location in the diagnostic diagrams (for the central ionization). Objects that present a
  > 3 Å with some ratio below the K01 curves are either SF–AGN or shock dominated. Thus, they are poorly classified.
The results of this classification are summarized in Table 1 and shown in Figure 14. There are 19 objects with outflows that lie well below the K01 curves in all diagnostic diagrams (NGC 839, NGC 838, NGC 7253, PS15mb, ESO 157-49, NGC 6810, NGC 7592, ESO 343-13, NGC 3256, ESO 194-39, ESO 148-IG002, ESO 338-IG04, NGC 1705, NGC 4945, NGC 5253, ESO 286-35, MCG-05-29-017, NGC 7174, and NGC 5010). These outflow galaxies are clearly not driven by an AGN. Other sources lie close to the border between the AGN-SF demarcation, and they could be either classified as AGN- or SF-driven depending on the diagram. In addition, 19 objects (IC 5063, ESO 362-18, NGC 2992, NGC 4941, NGC5728, ESO 428-14, JO204, JO135, PGC 006240, NGC 1068, NGC 6240, 2MAS XJ10193682+1933131, ESO 509-66, ESO 402-21,HE 0351+0240, ESO 339-11, Mrk926, 3C277.3, NGC 5128) are located (in all diagrams) in regions where AGN-dominated ionization is usually found.
Table 1. Classification of the Nuclear Ionization of the AMUSING++ Galaxies
| SF | AGN | SF-AGN-Shocks | Retired | |
|---|---|---|---|---|
| AMUSING++ | 255 | 52 | 76 | 217+35a |
| Outflows | 19 | 19 | 13 | 3 |
| Extended/Fillaments | 0 | 0 | 10 | 2 |
Notes. The BPT and WHAN diagnostic diagrams presented in Figure 14 for the central spectrum were used to classify the galaxy nuclear ionization considering both their location with respect to the K01 curves and the central  value.
Download table as: ASCIITypeset image
Table 2 lists the results of the galaxy classification based on the properties of the ionized gas in the central region. Assuming that this indicates which is the driving mechanism for the observed outflow, we conclude that ∼3% of them are driven by SF, ∼3% are driven by an AGN, and ∼2% can be either AGN- or SF-driven. If the AMUSING++ compilation comprises a representative sample of galaxies in the nearby universe, these numbers would indicate that ∼8% of galaxies host an outflow. This fraction is in agreement with that reported recently using complete and well-defined samples extracted from IFS-GS (2%–8% Ho et al. 2016; López-Cobá et al. 2019). Comparing this fraction with the random Poisson noise of the sample, ( ), the total fraction of outflows found doubles this error. However, this is not achieved if it is considered as either SF- or AGN-driven outflows, separately. Although this is a low value, even in more controlled galaxy samples, the reported fraction of outflows is still at the limit of the Poisson noise (Ho et al. 2016; López-Cobá et al. 2019).
Table 2. Main Properties of the Galaxies Hosting Outflows Found in AMUSING++
| AMUSING++ | Galaxy | z | Morph. | i | PA | Re | log M⋆ | log SFR | Nuclear | W90 | References |
|---|---|---|---|---|---|---|---|---|---|---|---|
| (°) | (°) | (arcsec) | (M⊙) | (M⊙ yr−1) | Ionization | (km s−1) | |||||
| ASASSN14ko | ESO 253-G003 | 0.0426 | Sa | 57.5 | 43.1 | 44.9 | 11.0 | 0.84 | SF-AGN | 57 | 1 |
| ASASSN14li | PGC043234 | 0.0205 | E? | 33.5 | 152.1 | 11.1 | 9.7 | −2.18 | Retired | 23 | 2 |
| ICP1 | IC5063 | 0.0115 | S0-a | 36.4 | 27.6 | 55.4 | 11.1 | 0.17 | AGN | 77 | 3 |
| IRAS | ESO 362-18 | 0.0122 | S0-a | 39.0 | 42.2 | 22.5 | 10.5 | 0.21 | AGN | 46 | 4 |
| NGC 0613 | NGC 0613 | 0.0049 | Sbc | 62.1 | 36.6 | 72.6 | 10.6 | 0.07 | SF-AGN | 24 | 5 |
| NGC 839 | NGC 839 | 0.0128 | S0-a | 65.1 | 174.6 | 57.6 | 10.7 | 1.04 | SF | 45 | 6 |
| NGC 838 | NGC 838 | 0.0128 | S0-a | 42.2 | 168.9 | 53.5 | 10.7 | 1.14 | SF | 59 | 6 |
| NGC 2992 | NGC 2992 | 0.0078 | Sa | 58.3 | 108.5 | 45.0 | 10.8 | 0.25 | AGN | 49 | 3 |
| NGC 4941 | NGC 4941 | 0.0037 | SABa | 55.2 | 106.1 | 60.5 | 10.1 | −1.14 | AGN | 22 | 7 |
| NGC 5728 | NGC 5728 | 0.0093 | Sa | 57.0 | 117.2 | 65.8 | 11.1 | 0.19 | AGN | 42 | 8 |
| NGC | NGC 1365 | 0.0054 | Sb | 44.9 | 131.2 | 52.1 | 10.9 | 0.89 | SF-AGN | 46 | 3 |
| SN2002jg2 | NGC 7253 | 0.0154 | ⋯ | 59.8 | 33.9 | 49.9 | 10.1 | −0.18 | SF | 37 | new |
| SN2006et | NGC 0232 | 0.0227 | SBa | 39.6 | 128.4 | 34.4 | 11.3 | 1.45 | SF-AGN | 32 | 9 |
| SN2012hd | IC1657 | 0.0119 | SBbc | 75.0 | 79.9 | 68.0 | 10.6 | 0.22 | SF-AGN | 37 | new |
| PS15mb | SDSSJ085940.13+151113.6 | 0.0291 | S? | 75.6 | 20.7 | 18.5 | 10.3 | −0.70 | SF | 10 | new |
| SN2008fp2 | ESO 428-14 | 0.0056 | S0 | 44.9 | 52.4 | 68.7 | 10.3 | −0.16 | AGN | 21 | 10 |
| ESO 157-49 | ESO 157-49 | 0.0056 | Sc | 68.6 | 120.4 | 47.7 | 9.6 | −0.54 | SF | 17 | new |
| NGC 6810 | NGC 6810 | 0.0067 | Sab | 58.8 | 83.2 | 67.2 | 10.9 | 0.49 | SF | 29 | 11 |
| JO204 | ZwCl1012-0047 | 0.0425 | ⋯ | 66.6 | 52.9 | 31.8 | 10.9 | 0.37 | AGN | 51 | 12 |
| JO135 | 2MASXJ12570425-3022305 | 0.0545 | S? | 60.6 | 128.7 | 22.6 | 10.9 | 0.57 | AGN | 46 | 12 |
| ASASSN14mw | PGC006240 | 0.0271 | E-S0 | 46.9 | 26.8 | 23.2 | 10.9 | 0.51 | AGN | 39 | new |
| IC1481 | IC1481 | 0.0207 | Sd | 26.8 | 12.2 | 4.8 | 9.4 | −0.40 | Retired | 37 | 13 |
| SN2017ffm | NGC 7592 | 0.0246 | S0-a | 33.6 | 105.7 | 30.7 | 11.0 | 1.15 | SF | 36 | 14 |
| ESO P2 | ESO 343- 13 | 0.0192 | ⋯ | 53.6 | 45.6 | 33.0 | 10.9 | 0.51 | SF | 34 | 15 |
| NGC 1068 | NGC 1068 | 0.0038 | Sb | 38.5 | 118.2 | 86.5 | 11.4 | 1.35 | AGN | 41 | 3 |
| NGC 6240 | NGC 6240 | 0.0235 | S0-a | 54.1 | 124.5 | 70.4 | 11.7 | 0.34 | AGN | 98 | 16 |
| NGC 3256 | NGC 3256 | 0.0095 | Sbc | 43.3 | 1.9 | 57.6 | 11.2 | 1.69 | SF | 36 | 17 |
| LSQ14aeg | 2MASXJ10193682+1933131 | 0.0648 | E | 54.1 | 89.2 | 11.6 | 10.8 | −0.04 | AGN | 45 | new |
| AM0044-521 | ESO 194-39 | 0.0278 | ⋯ | 47.6 | 160.9 | 31.4 | 10.9 | 0.78 | SF | 34 | new |
| AM1331-231 | ESO 509-66 | 0.0344 | ⋯ | 46.3 | 114.6 | 14.9 | 10.7 | 0.28 | AGN | 96 | new |
| AM2113-341 | ESO 402-21 | 0.0300 | SBa | 74.5 | 65.3 | 51.4 | 11.0 | −0.28 | AGN | 52 | new |
| ESO 148-IG002 | ESO 148-2 | 0.0450 | Sm | 62.2 | 80.8 | 37.6 | 11.0 | 1.26 | SF | 82 | 15 |
| ESO 338-IG04 | ESO 338-4 | 0.0097 | S? | 66.1 | 162.5 | 37.2 | 10.1 | 0.64 | SF | 20 | 18 |
| HE0351+0240 | 2MASXJ03540948+0249307 | 0.0355 | ⋯ | 53.0 | 115.3 | 12.4 | 10.8 | 0.79 | AGN | 32 | 19 |
| HE1353-1917 | ESO 578-9 | 0.0349 | Sbc | 76.1 | 117.8 | 37.6 | 10.9 | 0.24 | SF-AGN | 33 | 20 |
| NGC 1705 | NGC 1705 | 0.0020 | E-S0 | 36.1 | 137.2 | 37.3 | 8.9 | −0.54 | SF | 21 | 21 |
| NGC 4945 | NGC 4945 | 0.0019 | SBc | 41.1 | 123.9 | 74.3 | 9.7 | −0.42 | SF | 44 | 22 |
| NGC 7582 | NGC 7582 | 0.0052 | SBab | 72.3 | 69.1 | 94.1 | 10.5 | 0.42 | SF-AGN | 30 | 31 |
| ASASSN14lp1new | NGC 4666 | 0.0050 | SABc | 70.4 | 133.5 | 96.2 | 10.9 | 0.73 | Retired | 19 | 23 |
| NGC 5253 | NGC 5253 | 0.0013 | SBm | 63.9 | 129.2 | 55.7 | 8.8 | −0.20 | SF | 27 | 24 |
| NGC 7130 | NGC 7130 | 0.0162 | Sa | 40.5 | 169.7 | 38.0 | 11.2 | 0.97 | SF-AGN | 17 | 25 |
| ESO 097-013 | ESO 097-013 | 0.0019 | Sb | 54.7 | 115.0 | 94.1 | 11.0 | 0.63 | SF-AGN | ⋯ | 3 |
| ESO 339-G011 | ESO 339-11 | 0.0192 | SBb | 38.6 | 170.1 | 28.5 | 11.3 | 1.12 | AGN | 19 | new |
| 1414 | ESO 286-35 | 0.0180 | Sc | 72.5 | 117.6 | 44.6 | 10.5 | 0.80 | SF | 85 | new |
| HE2302-0857 | Mrk926 | 0.0472 | Sbc | 37.6 | 12.1 | 26.7 | 11.4 | 0.81 | AGN | 184 | new |
| ESO 353-G020 | ESO 353-20 | 0.0161 | S0-a | 67.8 | 162.1 | 38.0 | 10.9 | 0.82 | SF-AGN | 54 | new |
| 3C 227 | 3C 227 | 0.0866 | ⋯ | 43.4 | 61.2 | 11.4 | 11.1 | 0.83 | SF-AGN | 48 | 32 |
| 3C 277.3 | 3C 277.3 | 0.0859 | E | 8.1 | 94.9 | 14.9 | 11.2 | 0.64 | AGN | 66 | 33 |
| Centaurus | NGC 5128 | 0.0017 | S0 | 57.0 | 11.5 | 66.6 | 9.8 | 0.21 | AGN | 35 | 37 |
| ESO 440-IG058 | MCG-05-29-017 | 0.0232 | Sd | 62.5 | 145.9 | 26.9 | 10.6 | 0.86 | SF | 48 | 34 |
| HCG90bd | NGC 7174 | 0.0090 | Sb | 81.1 | 171.6 | 20.6 | 10.9 | −0.77 | SF | 29 | new |
| NGC 0034 | NGC 0034 | 0.0192 | S0- a | 35.9 | 144.4 | 34.5 | 10.8 | 1.25 | SF-AGN | 37 | new |
| NGC 5010 | NGC 5010 | 0.0099 | S0-a | 63.1 | 30.0 | 37.6 | 9.9 | −0.67 | SF | 22 | new |
| SCG0018fieldB1 | NGC 89 | 0.0110 | S0-a | 67.3 | 45.9 | 36.9 | 9.9 | −0.02 | SF-AGN | 13 | new |
| Abell | IC4374 | 0.0217 | E-S0 | 38.2 | 17.9 | 37.7 | 10.9 | −0.44 | SF-AGN | 68 | 26 |
| R0338 | 2MASXJ03384056+0958119 | 0.0346 | E | 48.9 | 43.0 | 20.2 | 11.3 | 0.54 | SF-AGN | 45 | 27 |
| PGC015524 | PGC015524 | 0.0328 | E | 44.3 | 86.8 | 55.2 | 11.6 | −0.44 | SF-AGN | 38 | new |
| UGC 09799 | UGC 09799 | 0.0344 | E | 44.1 | 127.4 | 42.2 | 11.3 | −0.47 | SF-AGN | 32 | 28 |
| NGC 4936 | NGC 4936 | 0.0108 | E | 34.6 | 68.3 | 21.5 | 11.4 | −0.69 | SF-AGN | 49 | new |
| NGC 4486 | NGC 4486 | 0.0042 | E | 17.4 | 68.3 | 37.5 | 11.1 | −1.40 | SF-AGN | 70 | 29 |
| LSQ13cmt | ESO 541-13 | 0.0568 | E | 57.6 | 112.8 | 38.1 | 11.7 | −1.26 | Retired | 27 | new |
| A2626 | WINGSJ233630.49+210847.3 | 0.0547 | ⋯ | 56.3 | 125.8 | 39.4 | 11.5 | −1.03 | SF-AGN | 20 | new |
| MCUBE | M84 | 0.0034 | E | 31.0 | 36.4 | 44.8 | 10.7 | −1.86 | SF-AGN | 27 | 30 |
| 3C 318.1 | NGC 5920 | 0.0443 | S0 | 50.5 | 14.0 | 34.5 | 11.3 | −1.23 | Retired | ⋯ | 35 |
| N4325 | NGC 4325 | 0.0255 | E | 48.5 | 92.0 | 34.5 | 11.1 | −0.81 | SF-AGN | 34 | 36 |
| S555 | ESO 364-18 | 0.0442 | E | 42.5 | 52.4 | 26.4 | 11.4 | −0.35 | SF-AGN | 59 | new |
Note. AMUSING++ identification (col. 1), galaxy names (col. 2), redshift derived with the SSP analysis (col. 3), Hubble type from Hyperleda (col. 4), inclination (col. 5), position angle (col. 6), effective radius (col. 7), stellar mass derived with the SSP analysis (col. 8) source of the outflow based on the nuclear ionization (col. 9), W90 of the absolute value of the median on the asymmetry map (col. 10) References at the observed outflow (col. 10). References: (1) Bonatto & Pastoriza (1997), Yuan et al. (2010), (2) Prieto et al. (2016), (3) Mingozzi et al. (2019), (4) Mulchaey et al. (1996), Fraquelli et al. (2000), Humire et al. (2018), (5) Gadotti et al. (2019), (6) Rich et al. (2010), Vogt et al. (2013), (7) Barbosa et al. (2009), (8) Durré & Mould (2018, 2019), (9) López-Cobá et al. (2017), (10) Falcke et al. (1998), (11) Venturi et al. (2018), (12) Poggianti et al. (2019), (13) López-Cobá et al. (2019), (14) Rafanelli & Marziani (1992), (15) Rich et al. (2015), (16) Müller-Sánchez et al. (2018), Treister et al. (2018), (17) Rich et al. (2011), (18) Bik et al. (2015), (19) Powell et al. (2018), (20) Husemann et al. (2019), (21) Menacho et al. (2019), (22) Venturi et al. (2017), (23) Dahlem et al. (1997), (24) Heckman et al. (2015), (25) Davies et al. (2014), (26) Farage et al. (2012), Canning et al. (2013), Olivares et al. (2019), (27) Donahue et al. (2007), (28) Balmaverde et al. (2018), (29) Jarvis (1990), Sparks et al. (1993), Gavazzi et al. (2000), (30) Bower et al. (1997), (31) Storchi-Bergmann & Bonatto (1991), (32) Prieto et al. (1993), (33) Solórzano-Iñarrea & Tadhunter (2003), (34) Monreal-Ibero et al. (2010), (35) Edwards et al. (2009), (36) McDonald et al. (2011), (37) Santoro et al. (2015).
The fraction of AGN-host galaxies in the AMUSING++ sample (52/635 ∼ 8%) is nearly double that recently observed in a larger IFS-GS, 4% (e.g., Sánchez et al. 2018). This may indicate some bias in the selection of the sample toward AGN sources, which is somewhat expected since some of the subsamples included in this collection comprise only such objects (e.g., CARS).
Interestingly, the elliptical galaxies with extended ionized regions not classified as outflows present a nuclear ionization incompatible with that of retired galaxies (i.e., ionized by old stars). Indeed, they present ionizations that would correspond to weak AGNs or simply by ionization due to shocks. We cannot rule out the presence of an AGN in these galaxies. Some of them show clear evidence of AGN activity since they resent radio jets or central radio sources, as is the case of UGC 09799 (e.g., Morganti et al. 1993) and M87 (e.g., Owen et al. 1989). However, a visual exploration of Figure 19 suggests that the dominant ionization for these objects seems to be more related to shocks: they present filamentary and highly perturbed ionized gas structures. Some authors have already reported that a few of these objects have remnants of a past nuclear activity or recent merging processes or the final end of IGM streams (like cooling flows), which could produce the observed ionization (e.g., Balmaverde et al. 2018).
At this stage, we need to mention that the fractions presented in this section may not be representative of the full population of galaxies at considered redshift range, since they are based on a compilation of data.
5.2.2. Distribution along the SFR–M* Diagram
It is well known that SFGs follow a tight relation when they are plotted in the SFR–M* diagram (in logarithm scale). This relation is known as the star-formation main sequence (SFMS), and it presents a dispersion of σSFMS ∼ 0.25 dex (e.g., Cano-Díaz et al. 2016). It has been widely studied at different redshifts, although the relation at z ∼ 0 is the most frequently explored (e.g., Brinchmann et al. 2004; Noeske et al. 2007; Salim et al. 2007; Speagle et al. 2014). On the other hand, retired galaxies are located well below the SFMS (>2σSFMS), conforming a second trend or cloud covering a range of specific star formation rates (sSFR) broadly corresponding to  ∼ 1 Å (based on the relation between both parameters, e.g., Sánchez et al. 2014; Belfiore et al. 2016). Finally, AGN hosts are usually located in the less-populated region between these two major groups, known as the Green Valley (e.g., Schawinski et al. 2010; Sánchez et al. 2018).
Figure 15 shows the distribution of the integrated SFR along the M* values and color coded by the central values of the  for the AMUSING++ galaxies. The M* was derived using the stellar population decomposition described in Section 3, following the prescriptions extensively described in Sánchez et al. (2016c, 2018). The integrated SFR was derived from the dust corrected Hα luminosity, assuming the Cardelli et al. (1989) extinction law; Rv = 3.1; Hα/Hβ = 2.86 corresponding to case B of recombination, (e.g., Osterbrock 1989), and applying the Kennicutt (1998) relation. In both cases, a Salpeter IMF was assumed (Salpeter 1955). Galaxies with high
  values populate the upper region of this diagram, contrary to galaxies with much lower
  lying well below the SF objects. The SFMS was obtained with SF galaxies with central
  > 6 Å and line ratios below the K01 curve in the BPT diagram. It follows a log-linear relation between the two parameters, with best-fitted parameters from a linear regression to:

with σ = 0.43. This relation is very similar those recently reported (e.g., Cano-Díaz et al. 2016). For galaxies where Hα emission is not associated with SF, the plotted SFR corresponds just to a linear transformation of that luminosity. Thus, the plotted SFR should be considered just as an upper limit to the real SFR (if any). As expected, in the case of retired galaxies (RGs), they are distributed in a cloud well separated from the location traced by the SFGs, as mentioned before.
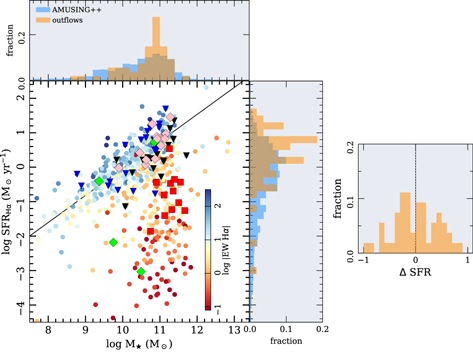
Figure 15. Distribution along the SFR–M* diagram for galaxies in the AMUSING++ compilation and the outflow host galaxies. The SFR was derived from integrated Hα flux. The color code represents the central (3'' × 3'')  extracted for each object. The black straight line represents the best fit for the SF objects. Galaxies hosting outflows are labeled with the same symbols included in Figure 14. Histograms of the respective fraction are shown over each axis. For AMUSING++, the histograms are normalized to the total sample (635 galaxies). In the case of the outflows, the distribution is normalized to the 54 outflows detected (i.e., excluding the extended objects). The rightmost panel shows the relative difference (ΔSFR) between the observed SFR of the outflow sources and the expected SFR given its stellar mass with respect to the SFMS.
Download figure:
Standard image High-resolution imageMost of the galaxies hosting a galactic outflow are located within 2σ of the loci of the SFMS, independently of the central driving mechanism (SF, AGN, SF–AGN). Most AGN-driven outflow galaxies lie in the Green Valley region of this diagram as has been found in several works (e.g., Sánchez et al. 2018). Particularly interesting is PGC 043234 (green diamond in the retired sequence). Although its nuclear ionization is compatible to host a (weak) AGN, it has a central  < 3 Å. This object has been presented recently in Prieto et al. (2016). These authors favor photoionization by a recent AGN to the observed [O iii] filaments in this galaxy. Thus, most galaxies hosting an outflow do actually present active SF, and therefore, the presence of gas, the main ingredient for a galactic wind. It is worth noting that the elliptical galaxies with extended filamentary ionized gas structures lie all below the SFMS, with no evidence of SF activity. This suggests that the nature of ionized gas—in these cases—is most probably external to the object itself, or a remnant of an earlier event.
5.3. Outflows in Diagnostic Diagrams
As outlined earlier, a common characteristic of galactic outflows is the presence of multiple components in the emission lines. The number of components needed to fit an emission line depends on the complexity of the wind and the capacity to resolve them. Typically, when an outflow is observed along the line of sight of a galactic disk, the wider components with larger dispersion are associated with the outflow, while the narrow ones are associated with the disk emission. The latter follows the dynamics traced by the gravitational potential of the object (i.e., it traces the systemic velocity). This was already illustrated in Figure 7. In order to study the properties of the outflows, it is necessary to decouple the different components in the emission lines. This analysis is beyond the scope of the current paper and will be addressed in a forthcoming article.
It is broadly accepted that diagnostic diagrams provide information about the ionizing source in a galaxy or a region within a galaxy. However, their indistinctive use may lead to serious misinterpretations of the physical process occurring across a galaxy. A hint of this was observed in the analysis of Figures 5 and 6, showing that the so-called composite and LINER-like region in the diagrams may be populated by ionization associated with outflows. Moreover, areas well below the usual demarcation lines adopted to select SF regions may be easily populated by shock ionization. Thus, the real origin of the ionization cannot be uncovered by the position in the diagnostic diagrams alone: further information is required.
As described previously, Pipe3D performs a moment analysis to estimate the flux of the emission lines. This means that multi-components in the emission lines are treated equally as single components in the analysis. In the case of outflows, a moment analysis reconstructs the full intensity of the emission lines better than fitting the lines with single Gaussians. In Figure 16, we show the distribution along the BPT for the individual spaxels with detected emission lines in the galaxies with galactic outflows color coded by the corresponding values derived for the asymmetry. A fundamental difference with respect to the values shown in the spatially resolved diagnostic diagrams in Appendix C is that here we select only those spaxels in which all of the emission lines in the diagram have at least an S/N > 4. This selection excludes regions with low signal, most probably removing the diffuse ionized regions that, in general, have low surface brightness (Zhang et al. 2017). However, it avoids including regions where the asymmetries are influenced by the residuals of the continuum modeling and subtraction.
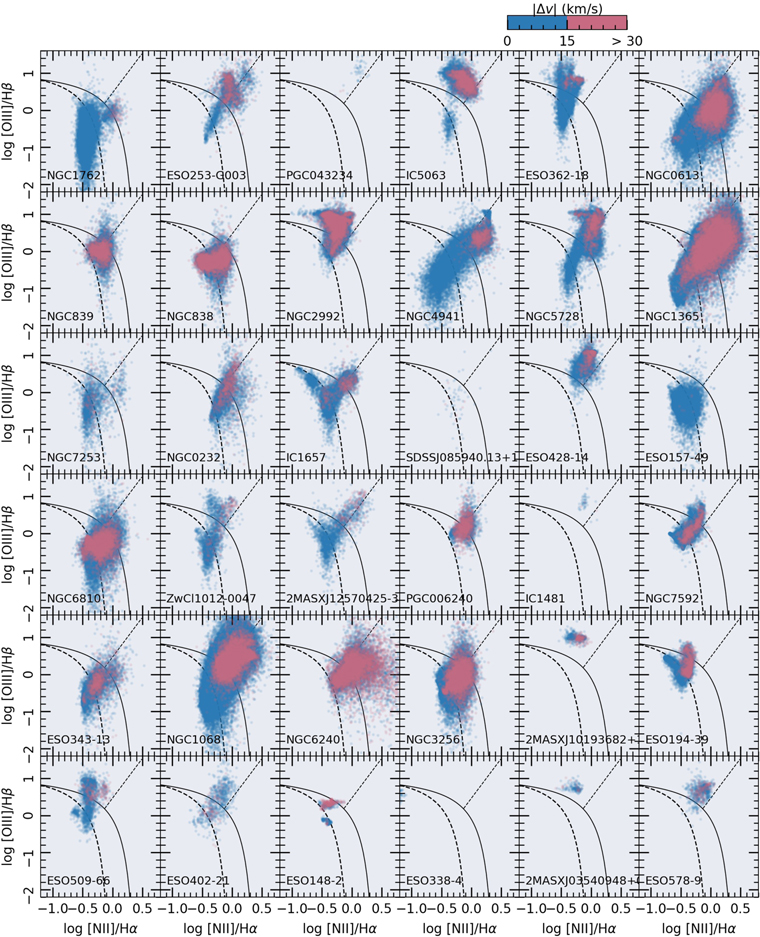
Download figure:
Standard image High-resolution image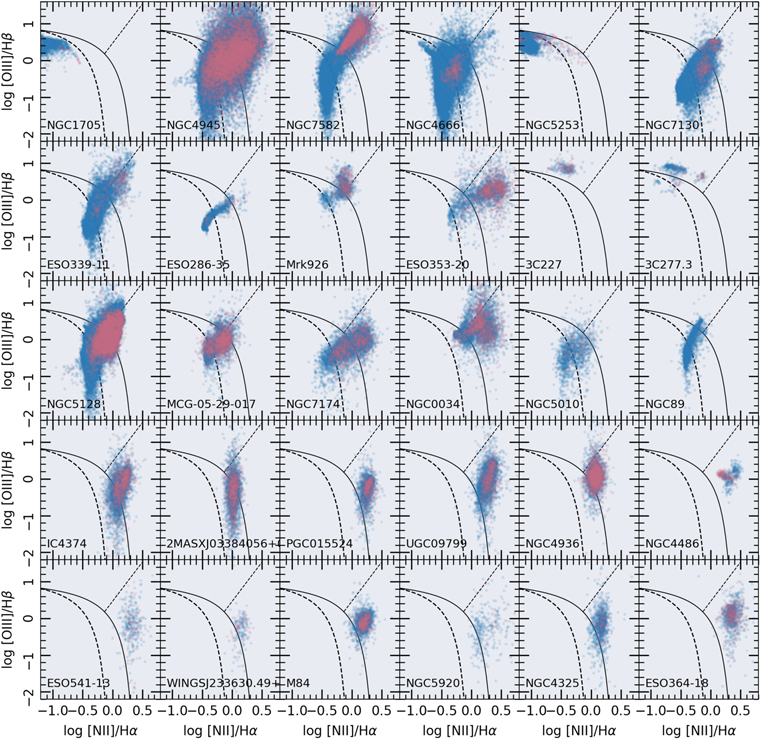
Figure 16. Spatially resolved BPT diagrams for each of the galaxies hosting a galactic outflow and elliptical galaxies with extended emission. We applied an S/N > 4 to all of the emission lines involved in the diagrams. The color code represents the absolute value of the asymmetry ( ) derived at each spaxel. Blue points indicate asymmetry values smaller than 15 km s−1 while red points indicate asymmetry values >30 km s−1.
Download figure:
Standard image High-resolution imageWe include the color coded BPT diagram for NGC 1762 in the first panel of Figure 16 for comparison purposes. It can clearly be seen that the asymmetry is very low (<15 km s−1) for the entire disk of this galaxy, i.e., for the areas dominated by SF ionization. Only in the nuclear regions, where the ionization is due to post-AGBs and maybe tracing the presence of an AGN, the asymmetry rises to values between 15 and 30 km s−1. In contrast, outflow host galaxies present clear asymmetric profiles in regions where the outflow in detected, and are, thus, dominated by shock induced ionization. This can be appreciated in more detail in the spatially resolved diagram for each galaxy in Appendix C. One of the immediate results from this is that the spectroscopically unresolved (so far) multi-components are one of the reasons for shifting the line ratios toward the composite-LINER/AGN regions in the BPT diagram. The flux contribution associated with shocks in the emission lines depends on the shock velocity in combination with the pre-shock density (e.g., Allen et al. 2008). The combination of shocks+SF emission can cover a wide area in the diagnostic diagrams as shown by Alatalo et al. (2016). This is obvious from the distribution of regions with high asymmetries in the BPT diagrams. They span through regions usually associated with ionization by young stars, crossing the so-called composite region and reaching areas usually associated with post-AGB/HOLMES or AGN ionization. On the contrary, spaxels with low asymmetry values lie, in general, in the SF region, below the K01 curve in the BPT diagram.
It is clear from this result that without a detailed exploration of the spatially resolved information together with and analysis of the shape of the profiles, a pure exploration of the BPT (or any other diagnostic diagram) can lead to miss-interpretations on the ionizing source.
6. Discussion and Conclusions
AMUSING++ is the largest compilation of galaxies observed with MUSE so far. The current compilation comprises a total of 635 galaxies, covering the redshift interval 0.0002 < z < 0.15, with a mean value of ∼0.019. This compilation, although not complete, does resemble a sample that is selected by diameter given by the limits 10'' < R25 < 84''. Moreover, for 80% of the objects, we have a complete coverage of the optical extension up to R25, i.e., their isophotal radii are smaller than 45''. The compilation covers all morphological types and widely populates the color–magnitude diagram. Thus, it is well suited to study the spatially resolved properties of galaxies in the nearby universe.
In this paper, we have analyzed the ionized gas content across the FoV of the instrument (1 arcmin2) for all of the galaxies in the sample. For the vast majority of these objects, we could explore the incidence of sub-kiloparsec scale outflows. Indeed, the combination of the high spatial resolution together with the spectral resolution of MUSE provides an opportunity to renew ionization diagnostics, with the addition of spatial information as a new parameter.
We developed a new methodology to detect gas outflows ionized by shocks. It relies on: (i) the visual inspection of the exquisite emission-line images and their lack of association with stellar continuum or AGN; (ii) the search for filamentary and conical/biconical structures in the ionized gas and the location of the line ratios in those structures in the BPT and WHAN diagrams; and (iii) the association of those structures with high-velocity dispersions, velocity perturbations and strong asymmetries.
The search for outflows and objects with extended emission line regions is straightforward when all of this information is combined. We found 54 galaxies with evidence of hosting galactic outflows. From this sample, 19 objects (3% of the total AMUSING++ sample) are certainly SF-driven, and 32 of them present nuclear ionization of AGNs or a combination of AGN-SF. The fraction of bona fide AGNs in the sample, corresponds to 8%. This value is not fully in disagreement with other complete galaxy surveys, although the AMUSING++ sample seems to be biased toward the inclusion of these objects.
Most of the outflows found in the sample seem to be biased toward highly inclined systems, where they are easily detected. However, at this stage, it is not feasible to estimate the possible bias introduced by the inclination given that the original sample is not a complete and statistical representative sample. On the other hand, we find a fraction of outflows in low inclined galaxies, which are generally excluded from these explorations by primary selections (e.g., López-Cobá et al. 2019).
Despite these biases, a comparison of the distribution of galaxies hosting outflows with the main population indicates that these events are found in almost all galaxy types. Outflows are found in a wide range of stellar masses, from  , with a peak around 10.9. Outflows are also present in all morphologies as shown in Table 2, although there seems to be a tendency toward disk-dominated spirals (Sb-Sc). There is also a possible bias toward SFGs, with a peak around
  , irrespective of the mechanisms that drives the outflow. This result is, in many ways, similar to that recently reported by López-Cobá et al. (2019), using a well-defined and statistically representative sample of galaxies at similar redshifts. The main difference is that, in previous studies (Ho et al. 2014; López-Cobá et al. 2019), investigators have used an inclination criteria (high-inclination galaxies) to facilitate the detection of outflows. In our particular case, no inclination criteria was included. Thus, the previous results are here validated and do not seem to be affected by the selection process.
It is worth noting that outflows do not seem to be preferentially found in extreme SFGs (in terms of their location with respect to the SFMS), neither for the AGN-driven nor SF-driven ones (as already noted by López-Cobá et al. 2019). Indeed, outflow galaxies present a deficit (enhancement) of up to a factor with 10 respect to the expected SFR given its stellar mass, which is relative to the SFMS. As noted in Ellison et al. (2018), this relative excess (deficit) is related with an overall increase (decrease) of the radial distribution of the star-formation surface density (ΣSFR). Although it has been pointed out that high values of ΣSFR are needed to drive outflows (e.g., Heckman 2001, 2002), this condition seems not to be the main driver. Therefore, it is not conclusive that the amount of SF defines the presence or absence of outflows in galaxies. Thus, previous explorations of outflows reporting them, preferentially in extreme starbursts (e.g., Heckman et al. 1990; Lehnert & Heckman 1996; Veilleux et al. 2003; Heckman et al. 2015; Rupke 2018), were clearly biased in their conclusion due to their target selection.
It seems that the requirements for the presence of outflow events have more to do with the ability of the considered driving mechanism to inject enough energy to the gas being expelled (or at least elevated) above the plane of the galaxy. Therefore, the ratio between the injected energy and the strength of the gravitational potential is probably more relevant than the absolute amount of energy injected. Now that we have a well-defined sample of galaxies hosting outflows and a proper comparison sample, we can address this exploration, which will be presented in future studies.
In addition to the outflows, among the explored objects, we report a group of galaxies hosting extended filaments and collimated structures of ionized gas with high values of the [N ii]/Hα ratio. However, they do not fulfill all of the requirements for being considered outflows. It is noticeable that all of these galaxies are massive ellipticals ( ), hosting an AGN (weak or strong) in their nucleus, and lie well below the SFMS in the retired galaxies region. As discussed in Appendix B, most of these objects are located in the center of galaxy clusters. The excess of [N ii] and Hα emission in the filaments resemble the cooling flows observed in the dominant cD elliptical galaxies in galaxy clusters (e.g., Heckman et al. 1989; Fabian 1994). As observed in Figure 19, the line ratios of these filaments lie in LINER-like region of the BPT diagrams. Indeed, shocks are the standard explanation for the ionization observed along these filaments (Heckman et al. 1989). Very low
  are dominant in the filaments, which reflects the complex nature of shocks being able to reproduce values similar to the ones produced by ionization by old stars. Although it was not the primarily goal of this study, we will continue our exploration of this sample of galaxies in comparison with those ellipticals not hosting such processes to understand their nature.
In summary, we present here a large compilation of 635 galaxies in the nearby universe observed using the integral-field spectrograph MUSE, the instrument that offers (currently) the best spatial and spectral resolution and the largest FoV. Using this AMUSING++ compilation, we developed a new procedure to select outflows without requiring the pre-selection of highly inclined galaxies. Based on that technique, we find a sample of 54 galaxies from which we are able to explore the nature of outflows and the required conditions to produce them: problems that we will further address in forthcoming studies.
We thank the anonymous referee for her/his useful comments. C.L.C., S.F.S., and J.K.B.B. are grateful for the support of CONACYT grant Nos. CB-285080 and FC-2016-01-1916, and funding from the DGAPA-UNAM IA101217 and PAPIIT: IN103318 projects. C.L.C. acknowledges a CONACYT (Mexico) PhD scholarship. I.C.G. acknowledges support from DGAPA-UNAM grant No. IN113417. L.G. was funded by the European Union's Horizon 2020 research and innovation program under the Marie Skłodowska-Curie grant agreement No. 839090. T.R.L. acknowledges financial support through the grants (AEI/FEDER, UE) AYA2017-89076-P, AYA2016-77237-C3-1-P, and AYA2015-63810-P, as well as by the Ministerio de Ciencia, Innovación y Universidades (MCIU), through the State Budget and by the Consejería de Economía, Industria, Comercio y Conocimiento of the Canary Islands Autonomous Community, through the Regional Budget. T.R.L. is supported by an MCIU Juan de la Cierva—Formación grant (FJCI-2016-30342). Support for J.L.P. is provided in part by FONDECYT through grant No. 1191038 and by the Ministry of Economy, Development, and Tourisms Millennium Science Initiative through grant IC120009, awarded to The Millennium Institute of Astrophysics (MAS).
Based on observations collected at the European Southern Observatory under ESO programs: 0100.A-0607(A), 0100.A-0779(A), 0100.B-0116(A), 0100.B-0573(A), 0100.B-0769(A), 0100.D-0341(A), 0101.A-0168(A), 0101.A-0772(A), 0101.B-0368(B), 0101.B-0603(A), 0101.B-0706(A), 0101.C-0329(C), 0101.C-0329(D), 0101.D-0748(A), 0101.D-0748(B), 0102.B-0048(A), 0103.A-0637(A), 0103.B-0834(B), 094.A-0205(B), 094.A-0859(A), 094.B-0225(A), 094.B-0298(A), 094.B-0321(A), 094.B-0345(A), 094.B-0592(A), 094.B-0592(C), 094.B-0612(A), 094.B-0711(A), 094.B-0733(B), 094.B-0745(A), 094.B-0921(A), 095.A-0159(A), 095.B-0015(A), 095.B-0023(A), 095.B-0042(A), 095.B-0049(A), 095.B-0127(A), 095.B-0295(A), 095.B-0482(A), 095.B-0532(A), 095.B-0624(A), 095.B-0686(A), 095.B-0934(A), 095.D-0091(B), 096.A-0365(A), 096.B-0019(A), 096.B-0054(A), 096.B-0062(A), 096.B-0223(A), 096.B-0230(A), 096.B-0309(A), 096.B-0325(A), 096.B-0449(A), 096.B-0951(A), 096.D-0263(A), 096.D-0786(A), 097.A-0366(A), 097.A-0366(B), 097.A-0987(A), 097.B-0041(A), 097.B-0165(A), 097.B-0313(A), 097.B-0427(A), 097.B-0518(A), 097.B-0640(A), 097.B-0761(A), 097.B-0766(A), 097.B-0776(A), 097.D-0408(A), 097.D-1054(B), 098.A-0364(A), 098.B-0240(A), 098.B-0619(A), 098.C-0484(A), 099.A-0023(A), 099.A-0862(A), 099.A-0870(A), 099.B-0137(A), 099.B-0148(A), 099.B-0193(A), 099.B-0242(A), 099.B-0294(A), 099.B-0384(A), 099.B-0411(A), 099.D-0022(A), 196.B-0578(A), 196.B-0578(B), 196.B-0578(C), 296.B-5054(A), 296.D-5003(A), 60.A-9100(H), 60.A-9194(A), 60.A-9304(A), 60.A-9308(A), 60.A-9310(A), 60.A-9312(A), 60.A-9313(A), 60.A-9314(A), 60.A-9317(A), 60.A-9328(A), 60.A-9332(A), 60.A-9333(A), 60.A-9337(A), 60.A-9339(A) and 60.A-9349(A).
Appendix A: Derivation of Isophotal Parameters
As part of the characterization of the AMUSING++ compilation, we performed an isophotal analysis on all galaxies in the sample. For this purpose, we use Photutils, an Astropy package for detection and photometry extraction of astronomical sources (Bradley et al. 2019). This package mimics the algorithms included in SExtractor (e.g., Bertin & Arnouts 1996). We perform the isophotal analysis on the V-band images produced from the data cubes. Prior to this analysis, we mask the field stars. Then, multiple isophotes are estimated at different galactocentric distances down to a surface brightness of 25 mag arcsec−2 (i.e., at the isophotal radius, R25). The position angle and inclination of the last isophote are adopted for further inclination corrections. The inclination i is defined in terms of the ellipticity,  , as cos i = 1 − . The values of both parameters are listed in Table 3. The effective radius is derived based on the cumulative distribution of fluxes within these isophotes, estimated as the radius at which half of the total light is contained. Figure 17 illustrates this procedure.
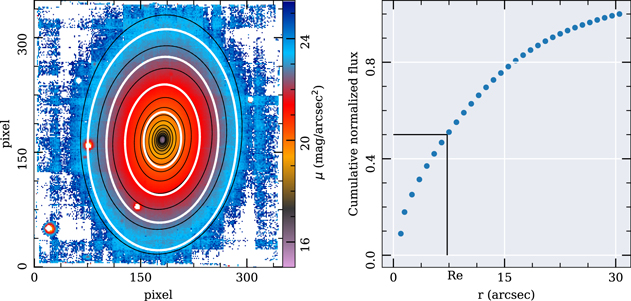
Figure 17. Isophotal analysis applied to the V-band images of all AMUSING++ galaxies to estimate the effective radius (Re), inclination (i) and position angle (PA). Left panel: surface brightness distribution of ESO 197-18. The black elliptical annulii represent isophotes at different radii, with the outermost annulus corresponding to a surface brightness of 25 mag arcsec−2 (R25). White annulus represent 1, 2, 3, and 4 effective radii (from innermost to outermost, respectively). Right panel: cumulative flux distribution along the galactocentric distances of the isophotes shown in the left panel (black solid lines). The effective radius is marked with black straight lines.
Download figure:
Standard image High-resolution imageTable 3. Isophotal Parameters Derived for the AMUSING++ Galaxies
| Index | AMUSING++ | Galaxy | R.A. | Decl. | z | Scale | Hubble | log SFR | log Mass | Incl. | PA | Re | r |

|
|---|---|---|---|---|---|---|---|---|---|---|---|---|---|---|
| id | h:m:s | d:m:s | (kpc/'') | Type | (M⊙ yr−1) | (M⊙) | (deg) | (deg) | ('') | (km s−1) | ||||
| 0 | 2MIG | NGC3546 | 01:10:34.06 | −52:33:23.508 | 0.0248 | 0.5 | E-S0 | −1.2341 | 11.26 | 54.5 | 29.1 | 5.5 | ⋯, −0.14 | ⋯ |
| 1 | 3C029 | UGC595 | 00:57:34.88 | −1:23:27.564 | 0.0451 | 0.888 | E | −1.4966 | 11.45 | 11.3 | 114.7 | 6.3 | 0.05,0.14 | 94.0 |
| 2 | Abell | IC4374 | 14:07:29.8 | −27:01:5.988 | 0.0217 | 0.44 | E-S0 | −0.4368 | 10.91 | 38.2 | 17.9 | 10.3 | 0.04,0.25 | 234.0 |
| 3 | Antennae | ARP244 | 12:01:50.638 | −18:52:10.956 | 0.0056 | 0.114 | None | 0.316 | 10.25 | 70.1 | 91.5 | 7.1 | 0.31,0.04 | 87.0 |
| 4 | ASASSN13an | PGC170294 | 13:45:36.527 | −7:19:32.196 | 0.0243 | 0.49 | Sa | 1.3905 | 10.73 | 27.2 | 138.8 | 3.9 | 0.31,0.3 | 20.0 |
| 5 | ASASSN13bb1 | UGC1395 | 01:55:23.067 | 06:36:24.012 | 0.0172 | 0.35 | Sb | −2.009 | 5.13 | 41.6 | 60.5 | 14.6 | 0.18,0.3 | 57.0 |
Note. The remaining objects are found in the electronic version. AMUSING++ identification (col. 2), galaxy names (col. 3), R.A. (col. 4), decl. (col 5.), redshift derived with the SSP analysis (col. 6), angular scale (col. 7), Hubble type from Hyperleda (col. 8), integrated SFR (col. 9), integrated stellar mass (col. 10), inclination (col. 11), position angle (col. 12), effective radius (col. 13), correlation coefficients between σ and the log [N ii]/Hα ratio for spaxels lying below and above the Kewley et al. (2001) curve (col. 14), W90 of the difference between the gas and stellar kinematics for spaxels lying above the Kewley et al. (2001) curve (col. 15). For those galaxies where the optical diameter is not covered entirely by the FoV of MUSE, the values R25 and Re are estimated by extrapolation up to R25; therefore for those cases, Re should be considered just as an approximated value, as well as their integrated properties such as stellar mass and SFR. Those galaxies are marked with an (*). The position angle is measured from the west.
Only a portion of this table is shown here to demonstrate its form and content. A machine-readable version of the full table is available.
Download table as: DataTypeset image
As mentioned in Section 2, for 20% of the objects, the isophotal radius is larger than the FoV of MUSE. For these cases, R25 was estimated by an extrapolation of the cumulative flux curve. The value of Re in these cases is, therefore, an approximation and should be used with care.
Appendix B: Comments on Individual Outflow Host Galaxies
Here, we address the individual outflow host galaxies found in AMUSING++. The corresponding figures of each galaxy can be found in the electronic version of this article.
ESO 253-G003: This is a merging galaxy classified as a Seyfert 2 (e.g., Bonatto & Pastoriza 1997; Yuan et al. 2010). It presents an extended emission in [O iii]. The information provided by the emission-line image and the diagnostic diagrams show that the extended emission is located in the AGN region. Its nuclear ionization falls in the border of the K01 curves, suggesting that an AGN is responsible for the high [O iii]/Hβ ratio observed across this structure. High-velocity dispersion (>70 km s−1) is observed throughout this structure, which correlates with the [N ii]/Hα ratio.
PGC 043234: This is a post starburst galaxy (z = 0.0205) result of a late merger event (e.g., Prieto et al. 2016). PGC 043234 shows clear fillamentary ionized structures visible mainly in [O iii] emission. This galaxy has been recently studied (using the same data as presented here) by Prieto et al. (2016). They found that the ionized filaments extend to 5 kpc from the nucleus and multiple small structures up to 10 kpc away. The ionization of these filaments falls above the K01 curves in the spatially resolved diagrams. These line ratios could be explained, in principle, by shocks or AGN photoinization. Except for [S ii], which is not detected, the central ionization is consistent with an AGN. Prieto et al. (2016) favor the AGN ionization, given the low-velocity dispersion found along the [O iii] fillaments (σ < 40 km s−1). We also do not detect significant asymmetries in the CCF ( km s−1) that could support the scenario of shock ionization.
IC 5063, NGC 2992, NGC 1365, NGC 1068, and ESO 097-013: These galaxies have been recently analyzed (with MUSE data) as part of the MAGNUM survey (Mingozzi et al. 2019). They all host well-known outflows with conical structures, all of them driven by a central AGN. Our spatially resolved diagnostic diagrams reveal in detail the ionization across the outflowing gas.
ESO 362-18 or IRAS0177: ESO 362-18 is a Syfert 1.5 S0 galaxy at z = 0.0125 (e.g., Bennert et al. 2006). This galaxy presents an extended ionized gas emission outflowing from its nucleus. This structure was first revealed in narrowband images in [O iii] (e.g., Mulchaey et al. 1996; Fraquelli et al. 2000). Recent studies using GMOS-IFS (35 × 5'') revealed the ionization cone of an outflow driven by the central AGN (e.g., Humire et al. 2018).
The nucleus of this galaxy lies above the K01 curves in the spatially resolved diagrams while the ionization at the cone falls in the AGN-driven wind region, confirming the origin of this outflow. We detect asymmetries in the cone,  km s−1, as well as in the nuclear region. The presence of multi-component kinematics in the emission lines was also detected by Humire et al. (2018).
NGC 0613: This is a barred SBbc galaxy at 18.32 Mpc. Evidence of an outflow in this galaxy was first detected in radio waves. NGC 0613 hosts a radio jet in the central region, with an optical counterpart seen in Hα and [O iii] emission (e.g., Hummel et al. 1987). The MUSE data of this object was presented first by the TIMER project. NGC 0613 shows a clear biconical outflow more intense in [N ii] (reddish color in the emission-line image). Its ionization is located in the upper region in the diagnostic diagrams without a clear trend of being an AGN- or SF-driven outflow, possibly both. We detect some asymmetries, with  km s−1 around the nucleus and the cone structure.
The disk is traced by Hα emission coming from H ii regions. Curiously, a significant excess of [N ii] emission in the inter-arm regions is observed. Part of these "[N ii] arms" are dominated by the ionization of old stars and is located in the LINER region in the diagnostic diagrams. This gas seems to lie over the disk, rather than having an extra-planar origin. More studies to confirm the origin of this excess in [N ii] are required.
NGC 838 and NGC 839: These galaxies are part of the Hickson Compact Group 16 (HCG 16 c,d; Hickson et al. 1989). They both present SF-driven outflows with clear biconical structure of ionized gas (e.g., Vogt et al. 2013). NGC 839 was studied before by Rich et al. (2010) using the Wide Field Spectrograph (WiFeS). Hα and [N ii] filaments are observed ouflowing from the north and south of the nucleus. The inner areas are located in the SF region in the diagnostic diagrams. In contrast, the gas in the fillaments is compatible with being ionized by shocks produced by an SF-wind. Asymmetries in the emission lines are found in both ionized cones with values of  , consistent with the presence of multiple kinematic components.
NGC 5728: It is a Seyfert II galaxy that presents two ionization cones produced by a central AGN (e.g., Wilson et al. 1993). MUSE observations of this object have been presented in Durré & Mould (2018, 2019). Our emission-line images reveal two ionized cones extending toward the SE and NW from the optical nucleus. These cones are regions of high excitation reaching values of [O iii]/Hβ ∼ 10 in the inner areas. The cone nebulae is consistent with being ionized by an AGN wind in the spatially resolved maps. We detect strong asymmetries at the edges of the two cones,  km s−1.
NGC 6810: An analysis of the MUSE data of this galaxy has been partially presented in Venturi et al. (2018). NGC 6810 presents a clear conical outflow, observed mainly in Hα. Given the line ratios observed along the ionized gas cone, the origin of this outflow is most probably related to SF processes. The asymmetry map of this galaxy reveals high values at the location of the ionized cone, confirming the presence of multiple kinematic components.
NGC 7253: NGC 7253 (Northern galaxy from the corresponding image in the electronic version) is an interacting galaxy with UGC 11985. The center of NGC 7253 shows a collimated [N ii] structure outflowing from its nucleus. The spatially resolved diagrams place this structure in the shock region, compatible with an SF-driven outflow according to the Sharp & Bland-Hawthorn (2010) demarcations lines.
NGC 0232: The collimated [O iii] structure observed in this galaxy has been recently reported in López-Cobá et al. (2017). The collimated structure falls in the AGN region in the diagnostic diagrams, with clear asymmetries along this structure. The [O iii] jet-like structure is most likely produced by the central AGN.
SDSSJ085940.13+151113.6: This is a highly inclined disk galaxy (i = 75°), located at z = 0.0292 (the scale is 0.6 kpc/arcsec at the distance of this object). The large inclination of this galaxy facilitates the separation between the gas in the disk (mostly Hα emission) with respect to the extra-planar one. An [N ii] enhancement is observed in the nucleus, revealing the presence of a small bi-conic structure. The extension of this structure on both sides of the disk is the order of 65 (∼4 kpc at the distance of this object), and is clearly resolved. Even though just tens spaxels fall in the bi-cones, these are well identified in the spatially resolved diagrams above the K01 curves. The velocity dispersion in the cones reaches 150 km s−1, much larger than the values found in the disk. Asymmetries between 20-50 km s−1 are detected inside the cones, a signature of the presence of multiple components associated with shocks.
ESO 428-14: It is a Seyfert 2 galaxy at z = 0.0056. A collimated ionized gas structure aligned to an inner radio jet was already reported in this galaxy (e.g., Falcke et al. 1998). The MUSE data reveals a very bright [O iii] nucleus, clearly ionized by the central AGN.
UGC 11723: This is an edge-on galaxy located at 70 Mpc (e.g., Mandel et al. 2011). Their disk is dominated by Hα emission, with some filamentary structures in the SW side. A slab of [N ii] emission is distributed at both sides of the disk plane. The [N ii]/Hα line ratio increases at larger extra-planar distances, indicating the existence of an extra source of ionizing photons different to that provided by H ii regions in the disk plane. Although HOLMES can reproduce the observed line ratios, the large  values do not favor this hypothesis. Shocks may be responsible for the enhancement of the [N ii]/Hα ratio. The spatially resolved diagrams of the [N ii] slab are consistent with this kind of ionization, as well as the observed increase in the velocity dispersion.
JO135 and JO204: Also named 2MASXJ 12570425-3022305 and 2dFGRS TGN288Z210, respectively. These are two Jellyfish galaxies located in the A3530 and A957 clusters, respectively. These galaxies have been analyzed with MUSE data as part of the GASP survey (e.g., Poggianti et al. 2019). Both galaxies are classified as Seyfert 2 and host ionization cones produced by central AGN. The ionization cones are observed in the emission-line image as an extended blue nebulae ([O iii] emission). Multiple asymmetries are detected through the cones as well as in regions around its respective nuclei.
PGC 006240: ESA/Hubble images of PGC 006240 show concentric shells that are most probably the product of a merger event in the past. An arc structure on the NW side of the MUSE continuum image is observed. The ionized gas distribution of this galaxy is also complex. Two filaments—one at the NW and other at SE from the nucleus—are observed, together with an arc shape Hα structure (green in the emission-line image) extending to the SW and coming from the nucleus. This arc structure presents low values of the [N ii]/Hα ratio consistent with ionization by H ii regions in the BPT diagram. The nucleus as well as the filaments present ratios consistent with LINER ionization; nevertheless, this latter component is dominated by  > 3 Å and is, therefore, the most compatible with shock ionization.
IC 1481: This galaxy was classified as an outflow candidate in López-Cobá et al. (2019). Unfortunately, a bad sky subtraction in this galaxy prevented us from recovering clean maps of the emission lines. A new analysis of this object is required.
NGC 6240: This galaxy hosts a well-known outflow that is result of a merger (e.g., Müller-Sánchez et al. 2018). NGC 6240 exhibits multiple Hα and [O iii] filaments. The advanced merger stage of these galaxies did not allow us to properly estimate the line velocity at each spaxel. A bad estimation of the velocity gives as result an incorrect identification of the emission lines. Treister et al. (2018) has obtained emission line MUSE maps much better than those reported in this work.
NGC 7592 and ESO 343-13: These systems exhibit galactic outflows result of ongoing interactions. Both systems present biconical gas structures (seen in purple colors in the emission-line images) with line ratios consistent with SF-wind outflows.
NGC 3256, NGC 4666 and NGC 7130: These galaxies present regions where is observed as an excess in [N ii] decoupled from Hα gas distribution. The line ratios associated with this [N ii] emission locates them in regions above the K01 curves and they are characterized with  > 3 Å, and relatively high dispersion >50 km s−1. All of these suggest the idea of SF-driven outflows in these galaxies.
2MASXJ10193682+1933131: This is an elliptical galaxy at z = 0.0648. It present an excess of [O iii] emission at PA = 180. The [N ii]/Hα map together with the velocity dispersion shows enhancements toward the Northern and Southern parts of the nucleus. The central ionization, as well as the strong [O iii] emission, supports the idea of an AGN-wind, at being far above from the K01 curves.
ESO 194-39: This galaxy is in interaction with 6dFGS gJ004705.6-520301. Two [O iii] ionized cones seems to be outflowing from the nucleus of ESO 194-39. As indicated by the blue color of these cones, their ionization is located in the upper region in the spatially resolved diagrams, consistent with being ionized by a central AGN. These ionized filaments are accompanied with an increase in the velocity dispersion (>75 km s−1) as well as the asymmetries (>30 km s−1).
ESO 509-66: This is an interacting system, with its closest companion (6dFGS gJ133440.8-232645) at 10.5 kpc (Koss et al. 2012). ESO 509-66 exhibits an impressive [O iii] ionized cone that resembles that of well-known cone of Circinus. High [O iii]/Hβ ratios are predominant in the cone nebula, which locates it the AGN-driven wind region in the spatially resolved diagnostic diagrams.
ESO 402-21: The high inclination of this galaxy (i = 75°) favors the detection of a biconical outflow evident in [O iii] emission. Extended [O iii] fillaments are observed at both sides of the disk plane of this galaxy. The observed line ratios in the cone nebulae are compatible of with the ionization produced by an AGN. Their location in the BPT diagram falls in the AGN-wind locus.
ESO 338-4: This is a relative low-mass galaxy ( ). This starburst galaxy shows ionized Hα cones result of a recent or ongoing SF. The emission-line image is dominated by [O iii] emission resulting in an excess in the blue color. The ionized gas in this galaxy is entirely produced by young stellar cluster. This is observed in the upper part of the spatially resolved diagrams below the K01 curves, compatible with low-gas metallicities. This galaxy has been previously analyzed with MUSE data in Bik et al. (2015).
2MASXJ03540948+0249307 and ESO 578-9: These two galaxies exhibit ionized [O iii] filaments outflowfing from the nuclear regions. The emission line-image shows the decoupling of the [O iii] gas from the overall distribution of ionized gas traced by the Hα and [N ii] emission. The [O iii] fillaments also shows a spatial decoupling with the continuum emission. An extensive analysis with MUSE data of these galaxies has been performed in Powell et al. (2018) and Husemann et al. (2019), respectively.
NGC 1705: This galaxy has been analyzed with MUSE data in Menacho et al. (2019), the driving mechanism of the observed outflow is by stellar feedback.
NGC 4945: The relatively low redshift of this galaxy (z = 0.0019) makes it so that just a small fraction of their optical extent fits into the FoV of MUSE. The continuum image shows the central region of NGC 4945. The emission-line image reveals an ionized [N ii] cone on top of the Hα distribution tracing the disk. Spaxels belonging to this ionized cone lie in the SF-wind region in the diagnostic diagrams. This galaxy has been partially presented with MUSE data in Venturi et al. (2017).
ESO 339-11 This is an LIRG with a Seyfert 2 nuclei (Yuan et al. 2010). It shows an ionized cone extended in the NW direction. The ionized cone, (seen in pink colors in the emission-line image), is located at the right side from the AGN-SF wind bisector in the diagnostic diagrams. A correlation between the [N ii]/Hα ratio and σ is observed in the cone, indicative that the gas is shocked.
NGC 7582: The [O iii] ionized cone observed in this galaxy was revealed with narrowband images in Storchi-Bergmann & Bonatto (1991). The MUSE emission-line image reveals this ionized cone with bluish colors. Indeed, it is appreciated a second cone attenuated by the dust trough the disk. This second cone is also evident in the velocity dispersion map, with velocities larger than 100 km s−1. The correlation between [N ii]/Hα ratio and σ is observed only in the cone nebulae. Spaxels belonging the cone lie in the AGN-wind region traced by the Sharp & Bland-Hawthorn (2010) bisector. The conical [O iii] outflow is clearly present in the Hα velocity map, producing clear deviation from the regular rotation pattern.
ESO 286-35: ESO 286-35 is a ULIRG ( ; e.g., Tateuchi et al. 2015) classified as Sb galaxy at z = 0.07. It presents highly disturbed ionized gas with Hα and [N ii] filaments extending to the NW and SE direction. The [N ii] filaments (reddish colors in the emission-line image) lie all above the K01 curves and in the SF-wind region according to the (Sharp & Bland-Hawthorn 2010) demarcation.
HE 2302-0857 or Mrk 926: This galaxy presents an ionized cone visible in [O iii] emission. Their bright nucleus is located in the AGN region in the diagnostic diagrams suggesting an AGN as responsible of the observed cone. The nucleus shows higher-velocity dispersion (σnucleus > 100 km s−1) than found in the cone nebula (![${\sigma }_{[{\rm{O}}{\rm{III}}]\mathrm{cone}}\lt 80$](https://content.cld.iop.org/journals/1538-3881/159/4/167/revision1/ajab7848ieqn59.gif) km s−1).
km s−1).
ESO 353-20: This is an LIRG ( ; e.g., Lu et al. 2017) at z = 0.0161. The emission-line image reveals two ionized cones in [N ii] emission at both sides of the galaxy disk. Spaxels belonging to these cones (pink colors), lie completely above the K01 curves and at the SF-wind region in the spatially resolved diagrams. Both the [N ii]/Hα ratio as well as the velocity dispersion shows a positive correlation in the cone nebulae. Asymmetries >50 km s−1 are also observed, indicative of the presence of multi-components in the emission lines associated most probably to shocked gas.
3C 227: This is a powerful radio galaxy (Black et al. 1992) at z = 0.085 that exhibit extended [O iii] emission at large distances, up to 20 kpc from the bright nucleus. This extended gas was reported in (Prieto et al. 1993) through the use of narrowband images at [O iii] and Hα + [N ii]. The MUSE emission-line image reveals a detailed picture of the [O iii] filaments. Its high ionization ([O iii]/Hβ ∼ 10) points to the central AGN as responsible of the ionization. Nevertheless, pure photoionization by the AGN could not explain the relative constant high values of the [O iii]/Hβ ratio at kiloparsec scales. The Hα kinematics shows that the gas is more or less ordered, with velocities ranging from ±320 km s−1.
3C 277.3: Similar to 3C 227, 3C 277.3 shows [O iii] blobs but connected with Hα filaments (see the emission-line image). Past integral-field studies of this object has been made using the INTEGRAL spectrograph (e.g., Solórzano-Iñarrea & Tadhunter 2003), but with a more limited FoV (146 × 113), even so a blob of [O iii] and Hα are clearly observed to the south of the nucleus. The wide FoV of MUSE reveals in the emission-line image three major [O iii] blobs, two at the SE and one to the NW, the three almost aligned in the same PA. The [O iii] blobs shows high values of the [O iii]/Hβ ratio being well above the K01 curves. The Hα kinematics is more or less ordered, with velocities ranging from ±330 km s−1.
NGC 5920: NGC 5920 is the brightest galaxy from the MKW3s group. Past integral-field studies of this object with GMOS (FoV 5'' × 7'') has revealed an elongated Hα + [N ii] structure close to the nucleus (e.g., Edwards et al. 2009). The MUSE emission-line image reveals two elongated structures, one directly connected to the nucleus of NGC 5920, and the other structure to the south that seems to be spatially disconnected from the previous. The brightest Hα spot in the southern structure is located 6'' far from the optical nucleus of the closest galaxy companion, NFP J152152.3+074218 (15h21m52 27, +07d42m177). The ionized gas kinematics of both structures do not show a regular rotation pattern.
MCG-05-29-017: This is an interacting system with its closest companion at the Northern, ESO 440-58, separated by 118 (scale 0.469 kpc/''). MCG-05-29-017 is an LIRG ( ) Monreal-Ibero et al. (2010). VLT-VIMOS observations of this object is presented in Monreal-Ibero et al. (2010). The emission-line image shows [N ii] fillaments emanating from the central region. These filaments present a higher ionization than the gas distributed across the galaxy disk. This is more clear when it is observed the spatially resolved diagrams, where the separation of colors (green to reddish) indicated the different ionization condition in the gas. Fillaments are located above the K01 curves. The increase in the velocity dispersion (>60 km s−1) and the high asymmetry values (>50 km s−1) in the filaments reveal the presence of shocked gas.
NGC 7174: It belongs to the HCG90 (Hickson et al. 1989). The continuum image reveals a tidal tail in NGC 7174 probably due by the interaction with it companions (NGC 7176, NGC 7174). The emission-line image shows filaments of ionized gas, [N ii]mostly, at both sides of the disk plane. This gas is consistent with being ionized by shocks given its location in the spatially resolved diagrams and its high-velocity dispersion (50–100 km s−1). It is not conclusive that the observed filaments are related to an SF-outflow event or are products of the tidal forces.
NGC 4325: It is an elliptical galaxy ( ) at z = 0.0255. Hα images reveals radial filaments McDonald et al. (2011). Integral-field studies of the central region are presented in Hamer et al. (2016). The MUSE emission-line image reveals extended [N ii] filaments. The filamentary structure rule out HOLMES as responsible of the observed ionization, even though it presents
  < 3 Å. Shocks seems to be the most likely explanation to the observed line ratios.
NGC 0034: It is an LIRG result of a past merger event, the continuum image reveals a tidal tail. IR observation suggests it presents a central starburst (e.g., Esquej et al. 2012). A strong neutral outflow has been detected in this object with outflow velocities (blueshifted) > 1000 km s−1 (e.g., Schweizer & Seitzer 2007). A nuclear cone nebular and arc shape structure is observed in the MUSE emission-line image (most prominent in [N ii]). This gas is consistent with being ionized by shock. It can be the optical counterpart of the previously detected neutral outflow.
NGC 5010: This is an edge-on galaxy that exhibits what is seems a biconical outflow. The extra-planar ionized gas (observed in red colors in the corresponding figure) present  > 3 Å. The low values of the
  rule out the possible interpretation of a extra-planar diffuse ionized gas. A correlation between σ and the [N ii]/Hα ratio is observed in this region, supporting the idea of shock ionization.
ESO364-18: E This elliptical galaxies shows extended [N ii] filaments with low values of the  (<3 Å). Although the filaments are located in the shock region in the diagnostic diagrams, ionization by HOLMES is not totally ruled out. The filaments present a disordered kinematic and high-velocity dispersion (>50 km s−1). These high vales in σ could support the the scenario of shocked gas.
NGC 89: This is a spiral galaxy classified as S0-a at z = 0.011. It shows a bright Hα nucleus, with collimated ionized gas filaments outflowing from its central region (reddish colors in the corresponding figure). Its nucleus shows a composite ionization SF-AGN.
IC 4374: This is an elliptical galaxy at z = 0.0217. It is the brightest galaxy from the A3581 cluster and is classified as a Fanaroff-Riley I radio galaxy. Multiwavelength studies of this object have been performed (e.g., Johnstone et al. 2005; Farage et al. 2012; Canning et al. 2013; Olivares et al. 2019). IC 4374 shows two radio lobes (at 1.4 GHz) extending to the east and west from its nucleus with size ∼4.6 kpc (Farage et al. 2012). These radio lobes coincide spatially with two cavities in X-ray images, which support the idea that a radio jet displaces the hot gas as it expands over the intracluster medium (Johnstone et al. 2005). In the optical, it presents fillamentary ionized emission (Farage et al. 2012). These filaments, mainly observed in Hα and [N ii], seem to emanate from the nucleus, and they are apparently coincident with the previously detected X-ray bubbles (e.g., Canning et al. 2013). The MUSE emission-line image reveals, with unprecedented detail, the fillamentary structure around IC 4374. A clear arc-shaped structure is observed extending to the NE from the optical nucleus, and a small fillament originated from the nucleus and toward the north is appreciated. Filaments with low S/Ns are observed at the North and West sides.
Is not obvious what the ionization source across these filaments is. The spatial diagnostic diagrams point toward the ionization being LINER-like. This seems to be true for the spaxels close the nucleus where low  are found. Nevertheless, along the filaments, the ionization is not dominated by old stars. Shock ionization can reproduce the observed line ratios. The mechanization driving the gas cannot be due to SF-driven winds, nor AGN-winds with the LINER assumption. The interaction of the radio jet with the ISM can produce shocks that explain the observed ratios. The Hα velocity map reveals quite complex kinematics in the filaments, without a clear rotation pattern. The asymmetries map reveals important changes in the
  map (<50 km s−1), which could indicate the presence of multi-components along the filaments.
NGC 4486: The well-known elliptical galaxy M87 shows ionized gas filaments, detected before in narrowband filters around the Hα line (e.g., Jarvis 1990; Sparks et al. 1993; Gavazzi et al. 2000). As the spatially resolved diagnostic diagrams show, the Hα + [N ii] filaments present line ratios well above the K01 curves. Interestingly, even though the  in the filaments is lower than 3 Å, and therefore should classified as HOLMES ionization, given the large separation to the nucleus of M87 (up to 15 kpc, Gavazzi et al. 2000), post-AGB stars being responsible for the low equivalent widths is unlikely. Shock ionization is a plausible explanation to the observed ratios. This suggests that in the absence of any other ionization source, shocks can present
  < 3 Å. A complex kinematics is observed along the filaments, without a clear patter of regular rotation. No signs of double components are observed.
NGC 4936: NGC 4936 is an elliptical galaxy surrounded by fillamentary ionized gas, mainly detected in [N ii]. Its nucleus as well as the gas in the filaments fall in the LINER region of the diagnostic diagrams and is characterized by having low values of  . The Hα kinematics show a regular rotation pattern, with no clear deviation in the asymmetries.
NGC 4941: Using the GMOS-IFU, Barbosa et al. (2009) detected a compact outflow associated with a radio jet. This outflow is detected in the emission-line image as pink structure, closely following a spiral arm. A velocity dispersion larger than 50 km s−1 is predominant over this structure. The high values of the [O iii]/Hβ ratio throughout this structure position it in the AGN region in the diagnostic diagrams, suggesting that the latter is responsible for the observed line ratios.
PGC 013424: PGC 013424 is the brightest galaxy from the 2A 0335+096 galaxy cluster. It is a massive elliptical galaxy M⋆ = 1011.3 M☉. Ionized gas filaments around PGC 013424 were first revealed with narrowband Hα and [N ii] images (e.g., Donahue et al. 2007). Integral-field studies of this object have been made to study the ionized gas component (e.g., Farage et al. 2012). The MUSE emission-line image reveals extended filaments of [N ii] with null contribution of HOLMES in its ionization. Therefore, a suitable explanation can be shocks.
PGC 015524: This is a massive elliptical galaxy (M⋆ = 1011.3 M☉) and is the brightest galaxy in the A946 cluster (e.g., Lin & Mohr 2004). It presents multiple filaments of [N ii] and Hα emission. The line-of-sight Hα velocity does not allow us to reveal if these filaments are being ejected from the nucleus or are in-falling filaments of gas. Its ionization is LINER-like, although shocks can also reproduce the observed ratios.
UGC 09799: UGC 09799 is a radio galaxy located at the center of the Abell cluster A2052. This galaxy presents arc-shaped filaments that are dominated by [N ii] emission. This galaxy has been studied in detail by Balmaverde et al. (2018). They found that the filaments are the result of the expansion of the radio lobes produced by the central AGN. The nucleus as well as the filaments fall in the LINER-like region in the diagnostic diagrams. The ionization in the nucleus can be explained with HOLMES; meanwhile, shocks can reproduce the observed ratios in the filaments.
Appendix C: Outflows in AMUSING++
In this section, the spatially resolved diagrams and kinematic maps for the outflows detected in AMUSING++ are shown. In Figure 18 we present four examples of outflows driven by different mechanism: AGN-driven, SF-driven, stellar feedback, and merger-driven outflows. The rest of the maps for the outflow host galaxies are accessible via the electronic version of this paper. Galaxies with extended fillaments, but not classified as outflows, are shown in Figure 19.

Download figure:
Standard image High-resolution image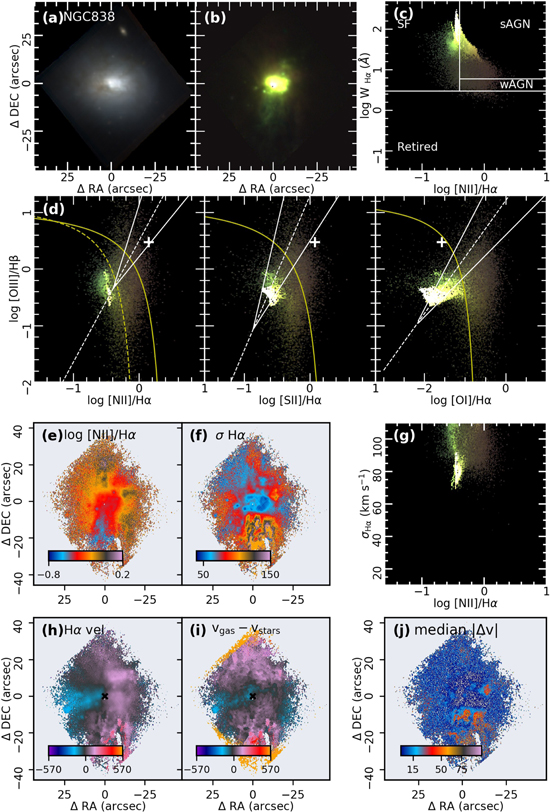
Download figure:
Standard image High-resolution image
Download figure:
Standard image High-resolution image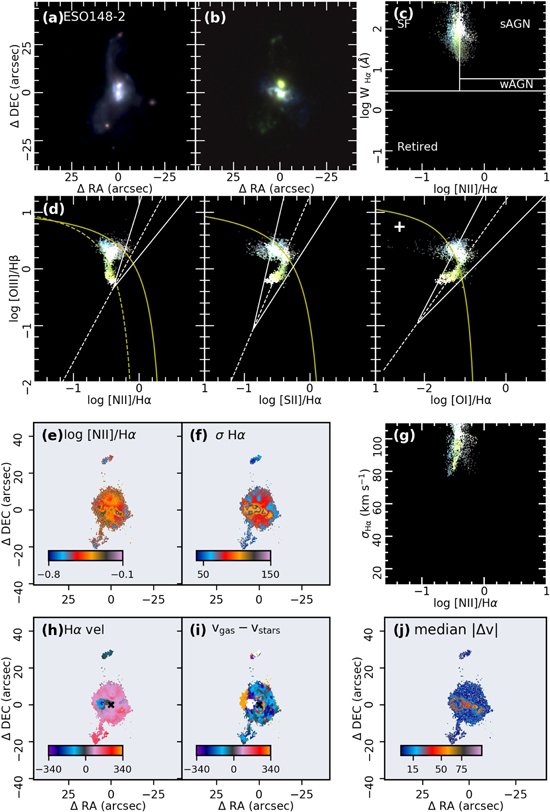
Figure 18.
(1) Galactic outflows found in the AMUSING++ compilation. (a) Reconstructed continuum image (red: i-band, green: r-band and blue: g-band); (b) RGB emission-line image (red: [N ii], green: Hα and blue: [O iii]); (c) WHAN diagram color coded with the emission-line image from panel (b); (d) Spatially resolved diagnostic diagrams color coded with the emission-line image from panel (b). Demarcation lines have the same meaning that those presented in Figure 6; (e) [N ii]/Hα line ratio map with a cut in the signal to noise in both emission lines, S/N > 4. (f) Velocity dispersion map estimated from the emission line fitting analysis; (g) Spatially resolved σ vs. log [N ii]/Hα diagram; (h) Hα velocity map; (i) Stellar velocity derived with the SSP analysis; (j) 2D map of the absolute value of the asymmetries ( ). The outflow in this galaxy is associated with an AGN-driven wind. Three other examples follow but the full set of 54 galactic outflows are in the figure set. (2) The outflow in this galaxy is associated with an SF-driven wind. (3) The outflow in this galaxy is associated with stellar feedback. (4) The outflow in this galaxy is merger-driven. (The complete figure set (54 images) is available.)
Download figure:
Standard image High-resolution image
Figure 19.
Elliptical galaxies with extended emission that do not fulfill the outflow requirements. The remaining 10 objects are available in the figure set. (The complete figure set (10 images) is available.)
Download figure:
Standard image High-resolution imageAppendix D: Spatially Resolved Diagrams for AMUSING++ Galaxies
In this section, the spatially resolved diagrams and kinematic maps for all of the AMUSING++ galaxies are shown. As an example, we show NGC 2466 in Figure 20. The remaining maps of the AMUSING++ galaxies are accessible via the following web page: http://ifs.astroscu.unam.mx/AMUSING++/.

Figure 20. Spatially resolved diagrams for the AMUSING++ galaxies. (a) Reconstructed continuum image (red: i-band, green: r-band and blue: g-band); (b) RGB emission-line image (red: [N ii], green: Hα and blue: [O iii]); (c) WHAN diagram color coded with the emission-line image from panel (b); (d) Spatially resolved diagnostic diagrams color coded with the emission-line image from panel (b). Demarcation lines have the same meaning that those presented in Figure 6; (e) [N ii]/Hα line ratio map with a cut in the signal to noise in both emission lines, S/N > 4. (f) Velocity dispersion map estimated from the emission line fitting analysis; (g) Spatially resolved σ vs. log [N ii]/Hα diagram; (h) Hα velocity map; (i) Stellar velocity derived with the SSP analysis; (j) 2D map of the absolute value of the asymmetries ( ). The remaining galaxies of the AMUSING++ compilation can be found in the web page: http://ifs.astroscu.unam.mx/AMUSING++/.
Download figure:
Standard image High-resolution image
Footnotes
- 10
- 11
The g-band is only partially covered with MUSE. We took the covered part of the band to construct the RGB continuum image.