


Abstract
Combining all available photometric data from various surveys and literature with our observations, we present 10 sets of light curves for the eclipsing binary V0599 Aur covering a timescale of 20 yr. During the last two decades, the O'Connell effect continuously varied and went through at least two flips between positive and negative effects. The photometric solutions from our two sets of multicolored light curves show that V0599 Aur is a W-type shallow contact binary with an active spot on the secondary. Its absolute parameters are determined by combining the Gaia distance with the photometric solutions. The period investigation reveals a secular decrease and a cyclic variation in its orbital period. The former mainly originates from the mass transfer from the more massive secondary to the less massive primary. The latter can be preferentially explained as a result of cyclic magnetic activity of the secondary, with three observational supports: (1) the existence and evolution of an active spot suggested by the long-term photometry, (2) periodic variation in both the O'Connell effect and relative luminosity, and (3) weak correlations between O'Connell effect/relative luminosity changes and cyclic period variation. Together with the cyclic period variation and its theoretical reasonability by Applegate's mechanism, we suggest that the secondary of V0599 Aur is a solar-type magnetic-activity star with an approximately 11 yr active cycle. Furthermore, by combining the secular period decrease with the Roche-lobe model, we infer that V0599 Aur is evolving from the marginal contact state controlled by thermal relaxation oscillation theory to the overcontact state.
Export citation and abstract BibTeX RIS
1. Introduction
The W UMa–type eclipsing binaries are binary systems consisting of two dwarfs with spectral types ranging from F to K (Rucinski 1993). Their orbital periods are generally shorter than 0.7 day (Hilditch 2001). The two components of this type of binary system show strong tidal interaction and are wrapped by a common convective envelope, giving the appearance of a peanut or dumbbell. Because of the tightness, the eclipses are geometrically more probable, yielding continuous luminosity variations. Thus, it is not possible to specify the exact times of contact from their light curves. Additionally, the depths of the primary and secondary eclipses are almost equal or differ insignificantly, which implies that two components have almost equal surface temperatures. With this type of eclipsing binary system, the photometric and orbital period studies can greatly enhance our understanding of the formation and evolution of close binaries. Moreover, they are important resources for testing stellar evolutionary theories and studying many astrophysical phenomena, such as the thermal relaxation oscillation (TRO) theory (Lucy 1976), the spiraling and coalescing mechanism (Counselman 1973; Hut 1980; Han et al. 2002; Andronov et al. 2006; Qian et al. 2006), the O'Connell effect (O'Connell 1951), the mass and energy exchange between the two components of a binary system (Shu & Lubow 1981), and angular momentum loss (Li et al. 2004). In particular, some objects among these systems are located at special stages of evolution and provide unique tests for several evolutionary theories. For example, the near-contact binary system, an edge case between a detached binary and a contact one (Shaw 1994; Zhu et al. 2010), provides an excellent way to check TRO theory. Meanwhile, the low mass ratio and deep-contact binaries that are recognized to be at the end of binary evolution may spiral in toward each other and finally coalesce into a rapidly rotating single star (Counselman 1973; Hut 1980). The best-studied case for the coalescence of binary systems is V1039 Sco (Tylenda et al. 2011), which provides the first direct evidence of the viability of the binary connection with red nova events. Thus, they are important objects for understanding the coalescing scenario of binary systems and the formation of some blue stragglers. However, many fundamental theoretical and observational issues are not well understood and thus remain unresolved.
On morphological grounds, W UMa–type binaries can be divided into two subclasses: A and W types (Binnendijk 1970). In the A-type systems, the more massive component has the higher surface temperature, whereas in the W-type systems, the less massive component has the higher surface temperature. Observationally, it has been found that the W-type systems tend to have larger mass ratios, shorter periods (p ≲ 0.4 day; Smith 1984), and later spectral types (G and K spectral type) than the A-type systems (Rucinski 1973, 1974). Furthermore, some W UMa–type binaries can alter their subtypes between A and W within only a few years. The existence of W-subtype contact binaries contradicts Lucy's models (Lucy 1968a, 1968b), where the gravity-darkening law predicts that the local temperature is proportional to the local gravity. Thus, the secondary component with the lower surface gravity should have a lower surface temperature if the whole system is engulfed in a common envelope. The A-subtype systems more or less follow this theoretical prediction. Among the efforts made to explain the contradiction of W-subtype systems, some accepted theories include the long-lived dark spots (or belts) hypothesis (Mullan 1975) and the lateral dissipative luminosity model (Hazlehurst 1985). In addition, as mentioned by Kalimeris et al. (1994), the Applegate mechanism (Applegate 1992) is the principal way for a contact binary to produce W-type light curves when the magnetic-activity cycle forces the temperature of the less massive component to increase or the more massive component to decrease.
Many W UMa–type binaries exhibit asymmetry in the two out-of-eclipse maxima of their light curves, which is known as the O'Connell effect. It has been recognized for more than a century and called "one of the celebrated difficult problems in the field of close binary systems" (Liu & Yang 2003). Several theoretical models have been proposed to interpret this effect: asymmetrically distributed stellar magnetic-activity spots (Binnendijk 1960), clouds of circumstellar dust and gas (Liu & Yang 2003), an impacting spot caused by a mass-transferring gas stream (Zhai & Fang 1995; Hilditch et al. 1997; Zhang & Zhang 2003; Zhu et al. 2010; Hu et al. 2019), and asymmetric circumfluence due to Coriolis forces (Zhou & Leung 1990). Among these, the magnetic-activity spot is the most common explanation for the O'Connell effect. Especially for the W-subtype systems, the magnetic activity could be much more intensive because of their later spectral type. However, for the majority of binary systems, this model still has not conclusively explained the O'Connell effect, because it is very difficult to determine the magnetic-activity origin of the O'Connell effect from only short-term photometric observations. Just like sunspots, starspots can periodically erupt with a typical period of several years or decades, which can naturally lead to a cyclic variation in the O'Connell effect of a binary system. According to the theory of Applegate (1992), the cyclic magnetic activity of a binary system may induce a cyclic variation in its orbital period via the structural variations yielded by magnetic activity and the tidal spin–orbit coupling. In principle, many other observable effects, such as the periodic changes in the maximum brightness and color of the binary systems (see also Applegate 1992), could also be produced by the cyclic magnetic activity. With the theoretical expectations, the cyclic variations in these predictable effects may be the most plausible evidence for the cyclic magnetic activity of the binary. However, the identification of cyclic variation in both the O'Connell effect and other observable ones requires long-term photometric observations with a timescale covering at least one magnetic-activity cycle. In this paper, with the benefit of several surveys and our new observations, we present a long-term photometry and orbital period investigation of the W UMa–type eclipsing binary V0599 Aur to attack its underlying magnetic-activity cycle. Also, we discuss its evolutionary state by combining the TRO theory and the Roche-lobe model.
The variable nature of V0599 Aur (=GSC 02393–00680) was first discovered by the Northern Sky Variability Survey (NSVS; Woźniak et al. 2004) in 1999. According to the International Variable Star Index, the V-band magnitude changes in the range of 12.0–12.35 mag. The J − H and B − V color indices are determined as 0.32 and 0.72, respectively, from the AAVSO Photometric All Sky Survey (APASS) DR9 (Skrutskie et al. 2006) and the point-source catalog of the Two Micron All Sky Survey (Henden et al. 2016). The first ground-based and single-target observations for this system were almost simultaneously made by Blättle & Diethelm (2006) and Martignoni (2006), who confirmed that it is an eclipsing binary. Meanwhile, they determined 10 and 15 times of minimum light and modified its orbital period as 0.316535 day. Liu et al. (2010) reobserved this system in the V and I bands and found a clear asymmetry (i.e., O'Connell effect) in their light curves. The photometric solutions reveal that V0599 Aur is a W-type shallow contact binary with an active spot on the surface of the secondary. In addition, they investigated its orbital period based on 31 light-minimum times covering a short timescale of about 3 yr and revealed a cyclic period variation with a period of 1.92 yr. However, it is uncertain whether this low-amplitude and short-period oscillation originates from the cyclic magnetic activity or the light-time effect of a tertiary component. Moreover, the cyclic period variation is still suspect because its amplitude (0.003 day) is so low, even lower than the errors of those observed light-minimum times. During the last decade, many light-minimum times have been continuously reported. Also, the photometric and spectrometric data for this binary system are gradually accumulated from various survey projects, such as the Wide Angle Search for Planets (WASP; Butters et al. 2010), the All-Sky Automated Survey for SuperNovae (ASAS-SN; Shappee et al. 2014; Jayasinghe et al. 2019), and the Gaia mission (Gaia Collaboration et al. 2016, 2018). In particular, with Gaia observations, the astrometric parallax (=3.356(±0.042) mas) for V0599 Aur was derived by Luri et al. (2018), enabling high-precision determination of its absolute parameters. All of this information offers a new opportunity to study the underlying orbital period variation and evolutionary state of this binary system.
2. CCD Photometric Observations and Variation of Light Curves
Using the 85 cm reflecting telescope at the Xinglong Station of the National Astronomical Observatory of China, we made two multiband photometric observations of the eclipsing binary V0599 Aur on 2018 November 22 and 2019 December 19. The telescope was equipped with a Cassegrain-focus multicolor CCD photometer. For our observations, Johnson–Cousins BVR filters and an Andor DZ936 PI2048 CCD photometric system were adopted. On those two nights, we obtained a total of 614 frames of images and reduced them using the aperture photometry package from the IRAF3 software library. Two stars in the field of view, TYC 2393-594-1 and TYC 2393-502-1, were chosen as the comparison and check stars, respectively. The available information on their coordinates and magnitudes from the SIMBAD database are listed in Table 1. Photometric data are presented in the form of differential magnitudes between the target star and the comparison one. In addition, the reduced results show that the difference between the magnitude of the check star and that of the comparison star is constant within a probable error (the estimated error based on Poisson statistics) of ±0.003 mag. Extinction correction is not made, as the comparison star is very close to the target star. The orbital period of 0.3153591 day corrected by Liu et al. (2010) was used to phase the light curves. The Heliocentric Julian Dates (HJD) and the corresponding phases and differential magnitudes are tabulated in Tables 2 and 3. The observed light curves are plotted in Figure 1 and show a typical EW-type (W UMa-type Eclipsing variables) luminosity variation, implying a contact or near-contact geometrical configuration for V0599 Aur. Figure 1 shows that the light curves obtained on 2018 November 22 show a weak and negative O'Connell effect, while the light curves obtained on 2019 December 19 exhibit an obvious and positive O'Connell effect. This suggests that both components, or at least one component, of V0599 Aur exhibit magnetic activity, since such significant variation within 1 yr cannot be produced by continuous mass transfer, asymmetric circumfluence due to Coriolis forces, or clouds of circumstellar dust and gas.
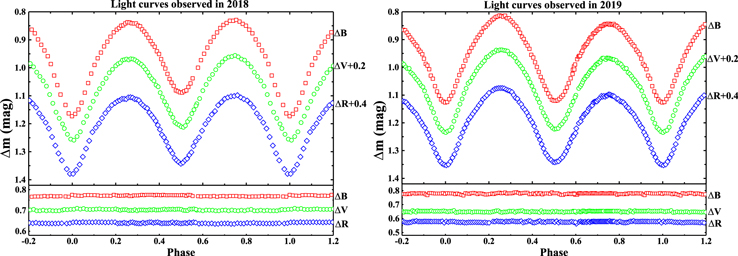
Figure 1. Two sets of new CCD photometric light curves in the B, V, and R bands of V0599 Aur obtained in 2018 (left) and 2019 (right). The corresponding magnitude differences between the comparison and the check star are shown at the bottom.
Download figure:
Standard image High-resolution imageTable 1. Parameters of Target Star, Comparison Star, and Check Star
| Object | Name | α2000 | δ2000 | B (mag) | V (mag) | Gaia Parallaxes (mas) |
|---|---|---|---|---|---|---|
| Target | V0599 Aur | 05h08m46 796 796 |
32°02'08 525 525 |
12.88(8) | 12.16(7) | 3.356(42) |
| Comparison | TYC 2393-594-1 | 05h08m56468 |
32°04'20964 |
12.00(13) | 11.47(11) | 2.171(56) |
| Check | TYC 2393-502-1 | 05h08m38067 |
32°01'58230 |
11.17(6) | 10.51(5) | 6.712(40) |
Download table as: ASCIITypeset image
Table 2. BVR-band Photometric Data of V0599 Aur Obtained in 2018
| B Band | V Band | R Band | ||||||
|---|---|---|---|---|---|---|---|---|
| JD(Hel.) | Phase | Δm | JD(Hel.) | Phase | Δm | JD(Hel.) | Phase | Δm |
| 2,458,444.1290 | 0.578 | 1.000 | 2,458,444.1274 | 0.573 | 0.929 | 2,458,444.1304 | 0.582 | 0.849 |
| 2,458,444.1334 | 0.592 | 0.977 | 2,458,444.1315 | 0.586 | 0.910 | 2,458,444.1350 | 0.597 | 0.825 |
| 2,458,444.1381 | 0.607 | 0.955 | 2,458,444.1362 | 0.601 | 0.882 | 2,458,444.1397 | 0.612 | 0.801 |
| 2,458,444.1427 | 0.621 | 0.934 | 2,458,444.1409 | 0.615 | 0.860 | 2,458,444.1444 | 0.627 | 0.785 |
| 2,458,444.1474 | 0.636 | 0.915 | 2,458,444.1456 | 0.630 | 0.840 | 2,458,444.1491 | 0.641 | 0.767 |
| ⋯ | ⋯ | ⋯ | ⋯ | ⋯ | ⋯ | ⋯ | ⋯ | ⋯ |
| 2,458,444.4348 | 0.544 | 1.056 | 2,458,444.4305 | 0.530 | 0.992 | 2,458,444.4359 | 0.547 | 0.902 |
| 2,458,444.4378 | 0.553 | 1.038 | 2,458,444.4335 | 0.540 | 0.983 | 2,458,444.4390 | 0.557 | 0.880 |
| 2,458,444.4366 | 0.550 | 0.964 | 2,458,444.4421 | 0.567 | 0.863 | |||
| 2,458,444.4397 | 0.559 | 0.950 | ||||||
| 2,458,444.4427 | 0.569 | 0.936 | ||||||
Only a portion of this table is shown here to demonstrate its form and content. A machine-readable version of the full table is available.
Download table as: DataTypeset image
Table 3. BVR-band Photometric Data of V0599 Aur Obtained in 2019
| B Band | V Band | R Band | ||||||
|---|---|---|---|---|---|---|---|---|
| JD(Hel.) | Phase | Δm | JD(Hel.) | Phase | Δm | JD(Hel.) | Phase | Δm |
| 2,458,835.9985 | 0.587 | 1.009 | 2,458,835.9991 | 0.588 | 0.923 | 2,458,835.9995 | 0.589 | 0.844 |
| 2,458,836.0001 | 0.592 | 0.997 | 2,458,836.0030 | 0.600 | 0.901 | 2,458,836.0036 | 0.602 | 0.820 |
| 2,458,836.0018 | 0.597 | 0.990 | 2,458,836.0071 | 0.613 | 0.876 | 2,458,836.0074 | 0.614 | 0.801 |
| 2,458,836.0047 | 0.606 | 0.971 | 2,458,836.0096 | 0.621 | 0.869 | 2,458,836.0100 | 0.623 | 0.795 |
| 2,458,836.0066 | 0.612 | 0.962 | 2,458,836.0113 | 0.627 | 0.862 | 2,458,836.0117 | 0.628 | 0.782 |
| 2,458,836.0079 | 0.617 | 0.959 | 2,458,836.0129 | 0.632 | 0.854 | 2,458,836.0134 | 0.633 | 0.779 |
| ⋯ | ⋯ | ⋯ | ⋯ | ⋯ | ⋯ | ⋯ | ⋯ | ⋯ |
| 2,458,836.3036 | 0.551 | 1.087 | 2,458,836.3183 | 0.597 | 0.908 | 2,458,836.3189 | 0.598 | 0.837 |
| 2,458,836.3063 | 0.559 | 1.073 | ||||||
| 2,458,836.3090 | 0.568 | 1.057 | ||||||
| 2,458,836.3117 | 0.576 | 1.040 | ||||||
| 2,458,836.3145 | 0.585 | 1.024 | ||||||
| 2,458,836.3172 | 0.594 | 1.008 | ||||||
Only a portion of this table is shown here to demonstrate its form and content. A machine-readable version of the full table is available.
Download table as: DataTypeset image
In order to confirm the variations of the O'Connell effect more firmly, we also performed a detailed search for all available light curves and collected a total of 10 sets of light curves since its discovery (see Figure 2). During the NSVS, V0599 Aur was observed 209 times in 1 full yr4 (Woźniak et al. 2004). After removing one point obtained in a different observing season, a light curve without any filters was then constructed from the remaining 208 data points, shown in Figure 2(a). However, the data show large scatter with a standard deviation of 0.032 mag, and thus it is unclear whether the light curve shows the O'Connell effect or not. From the WASP archive5 (Butters et al. 2010), 5800 effective data points for V0599 Aur were extracted that cover three observing seasons from 2004 to 2008. With more than 1500 data points in each season, we thus divided these observations into three average light curves according to the observing seasons. In Figures 2(b)–(d), these light curves show a clear transition of the O'Connell effect from negative to positive. Liu et al. (2010) observed the system on 2008 January 6 with the 1 m reflecting telescope at Yunnan Observatory in China. They presented the complete R- and I-band light curves where the primary maximum is obviously higher than the secondary maximum (i.e., the O'Connell effect is positive). In the ASAS-SN (Shappee et al. 2014; Jayasinghe et al. 2019), we found that V0599 Aur had been observed in three full observing seasons from 2015 to 2017. Thus, we extracted three V-band light curves from the ASAS-SN variable stars database.6 In Figures 2(f)–(h), the changes of the O'Connell effect can be found by visual inspection in spite of the large scatter (the standard deviation is about 0.02 mag) in the light curves. In 2018 and 2019, we performed the follow-up observations in the BVR bands and obtained two sets of multiband light curves, which are also displayed in Figures 2(i) and (j). Once again, a clear transition of the O'Connell effect from negative to positive was found. From 1999 to 2019, 10 sets of light curves covering 20 yr have been presented, and at least two transitions of the O'Connell effect in those light curves have been visually identified. Additionally, the light curves show a small and irregular change of the magnitude differences between the primary and secondary minima. Due to the short timescale relative to that of stellar evolution, such a change should not be rooted in the change of surface temperatures of the two components but rather attributed to spot activity on the surface of the component.
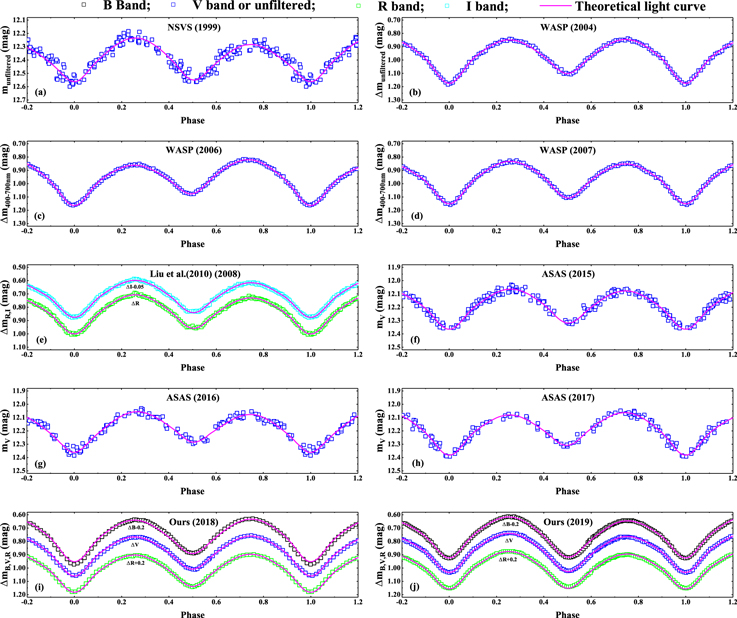
Figure 2. The 10 sets of light curves of V0599 Aur obtained by NSVS (a), WASP (b)–(d), Liu et al. (2010) (e), ASAS-SN (f)–(h), and us (i) and (j). The solid lines denote the corresponding theoretical light curves that are calculated from the photometric solutions listed in Tables 4 and 5.
Download figure:
Standard image High-resolution image3. Photometric Solutions with W-D Code
We employed the 2015 version of the Wilson–Devinney (W-D) code (Wilson & Devinney 1971; Wilson 1979, 1990; Wilson & Van Hamme 2014) to separately analyze the two sets of multiband light curves of V0599 Aur we obtained. The initial mass ratio was set to be q = 1.610, which was determined by Liu et al. (2010) with a q-search method. Using the two color indices of  (Skrutskie et al. 2006) and
  (Henden et al. 2016), we estimated the temperature of the primary component of V0599 Aur as T1 = 5530 K by using the corrected calibration7
(Pecaut & Mamajek 2013). In view of the common convective envelope of the W UMa–type contact binary, the gravity-darkening coefficients were set to g1 = g2 = 0.32 (Lucy 1967), and the bolometric albedos were given as A1 = A2 = 0.5 (Rucinski 1969) for the two components. The nonlinear limb-darkening law with the square-root form was adopted, and the bolometric and monochromatic coefficients for the components were taken from the table of Van Hamme (1993). The W-D code was then run to adjust the following parameters: the inclination i, temperature of the secondary component T2, mass ratio q, and dimensionless surface potentials of the primary star Ω1 = Ω2 (mode 3 for contact configuration).
(Henden et al. 2016), we estimated the temperature of the primary component of V0599 Aur as T1 = 5530 K by using the corrected calibration7
(Pecaut & Mamajek 2013). In view of the common convective envelope of the W UMa–type contact binary, the gravity-darkening coefficients were set to g1 = g2 = 0.32 (Lucy 1967), and the bolometric albedos were given as A1 = A2 = 0.5 (Rucinski 1969) for the two components. The nonlinear limb-darkening law with the square-root form was adopted, and the bolometric and monochromatic coefficients for the components were taken from the table of Van Hamme (1993). The W-D code was then run to adjust the following parameters: the inclination i, temperature of the secondary component T2, mass ratio q, and dimensionless surface potentials of the primary star Ω1 = Ω2 (mode 3 for contact configuration).
Because both sets of light curves show a significant asymmetry (i.e., the O'Connell effect), we added a spot on either the primary or the secondary star. After the code was run with sufficient iterations, we obtained two best converging solutions for the two sets of light curves (see the second and third columns of Table 4). With these photometric solutions, theoretical light curves were calculated and plotted in Figure 3. Interestingly, although the two photometric solutions are determined separately from two sets of multiband light curves, they are very close to each other, except for the spot parameters. Moreover, the photometric elements are in good agreement with those of Liu et al. (2010). This suggests that the solutions should be reliable and the changes of the light curves are indeed attributable to the spot activity. Thus, we calculate the average elements for all parameters except for the spot ones as a final photometric solution (see the fourth column of Table 4), which will be adopted in the following analysis. In addition, both photometric solutions suggest that the active spot appears on the surface of the secondary component. This implies that the secondary component of V0599 Aur is a magnetic-activity star. From the photometric solutions, we can conclude that V0599 Aur is a shallow contact binary with a contacting degree of f = 4.3%. The derived mass ratio, q = 1.61, indicates that the less massive component with a higher surface temperature is eclipsed at the primary (deeper) minimum; i.e., V0599 Aur is a W-subtype contact binary.
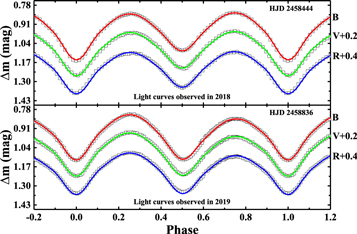
Figure 3. Two sets of new CCD photometric light curves of V0599 Aur obtained in 2018 (upper panel) and 2019 (lower panel). The solid lines denote the theoretical light curves calculated from the photometric solutions in the second and third columns of Table 4.
Download figure:
Standard image High-resolution imageTable 4. Photometric Solutions for V0599 Aur from Our New Observed Light Curves
| Parameter | 2018 Data | 2019 Data | Mean Value |
|---|---|---|---|
| i (deg) | 59.73(7) | 60.90(8) | 60.32 |

|
0.32 | 0.32 | 0.32 |
| A1 = A2 | 0.50 | 0.50 | 0.50 |

|
4.665(2) | 4.669(2) | 4.667 |

|
3.9(6)% | 4.7(6)% | 4.3% |
| T1 (K) | 5530 | 5530 | 5530 |
| T2 (K) | 5111(7) | 5348(13) | 5230 |
| q = m2/m1 | 1.609(1) | 1.615(1) | 1.612 |

|
0.5095(23) | 0.4384(38) | 0.4740 |

|
0.4870(18) | 0.4294(30) | 0.4582 |

|
0.4695(14) | 0.4225(24) | 0.4460 |
| r1 (pole) | 0.3195(2) | 0.3197(2) | 0.3196 |
| r1 (side) | 0.3344(2) | 0.3346(2) | 0.3345 |
| r1 (back) | 0.3681(3) | 0.3686(4) | 0.3684 |
| r2 (pole) | 0.3989(2) | 0.3990(2) | 0.3990 |
| r2 (side) | 0.4224(2) | 0.4226(3) | 0.4225 |
| r2 (back) | 0.4526(3) | 0.4527(4) | 0.4527 |
| ϕ (deg) | 94.7(3.0) | 90.0(1.0) | ⋯ |
| θ (deg) | 259.0(3.9) | 315.3(1.4) | ⋯ |
| γ (deg) | 17.3(1.9) | 65.6(2.0) | ⋯ |
| Ts/Tph | 1.03(0.01) | 0.98(0.01) | ⋯ |
| χ2 | 0.0225 | 0.0345 | ⋯ |
Download table as: ASCIITypeset image
In order to check the photometric elements and derive the spot evolution, we also applied the W-D code to analyze the remaining eight sets of light curves gathered from surveys and the literature. Because our observations are in multiple bands (B, V, and R) and the light curves show very small scatter, the averaged photometric solutions derived from our two sets of light curves were adopted as the initial input parameters. Interestingly, all solutions can well converge into a stable one. Moreover, we tried all possible single-spot models (cool or hot spot on the primary or secondary) and found that the best converging solutions firmly determined a hot or cool spot on the more massive secondary, which again strongly suggests that the secondary of V0599 Aur is a magnetic-activity star. The theoretical light curves are shown in Figure 2. Table 5 lists the eight photometric solutions derived from the eight sets of light curves. Figure 4 shows the evolution of the spots on the more massive secondary. However, it should be noted that there exist certain differences among the photometric elements derived from different sets of light curves. We think that these converging solutions will be only approximately right due to the intrinsic correlation between many relative parameters. In addition, the spotted area in the bottom right panel of Figure 4 is huge and significantly different from all other spotted areas. In our photometric studies, we adopted the single-spot model to account for the significant light-curve asymmetry. Perhaps the real situation could be more intricate, since several spots (rather than a single spot) could exist on the system.
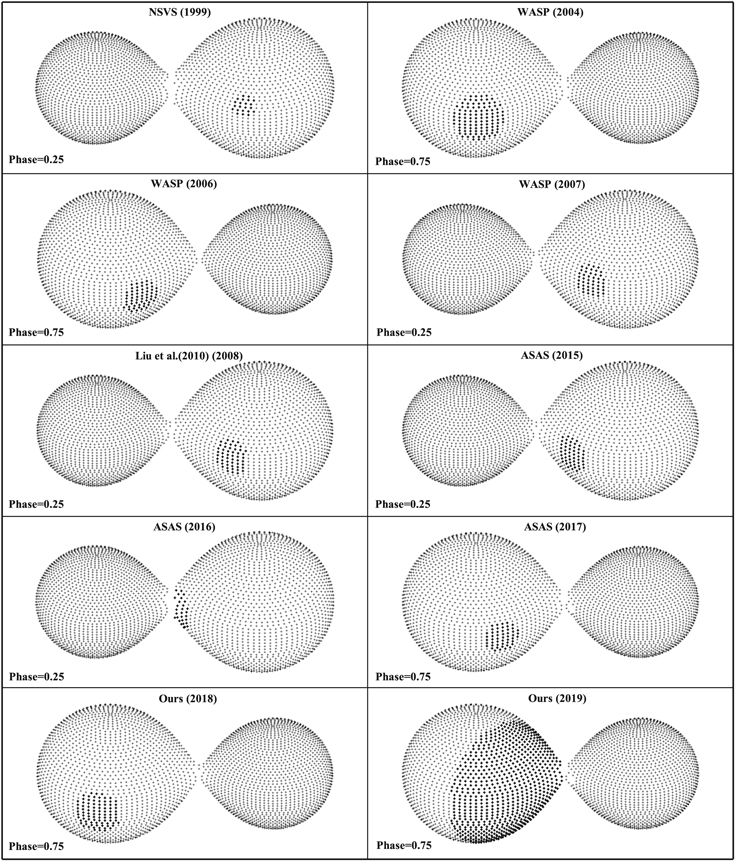
Figure 4. Geometrical structures of the shallow contact binary V0599 Aur with an active spot on its secondary component. The spot evolution implies that the secondary of V0599 Aur has solar-type magnetic activity.
Download figure:
Standard image High-resolution imageTable 5. Photometric Solutions for Eight Sets of Light Curves from Surveys and Literature
| Parameter | NSVS 1999 | WASP 2004 | WASP 2006 | WASP 2007 | Liu 2008 | ASAS 2015 | ASAS 2016 | ASAS 2017 |
|---|---|---|---|---|---|---|---|---|
| i (deg) | 60.29(95) | 60.81(26) | 60.06(25) | 61.38(24) | 59.57(13) | 60.28(60) | 57.05(66) | 59.31(61) |
| g1 = g2 | 0.32 | 0.32 | 0.32 | 0.32 | 0.32 | 0.32 | 0.32 | 0.32 |

|
0.50 | 0.50 | 0.50 | 0.50 | 0.50 | 0.50 | 0.50 | 0.50 |
| Ω1 = Ω2 | 4.627(25) | 4.661(7) | 4.694(6) | 4.680(6) | 4.668(3) | 4.669(13) | 4.629(16) | 4.666(17) |

|
6.6(4.8)% | 5.6(2.5)% | 2.2(2.1)% | 3.6(2.3)% | 6.9(4.1)% | 4.2(4.3)% | 5.0(4.8)% | 3.5(5.3)% |
| T1 (K) | 5530 | 5530 | 5530 | 5530 | 5530 | 5530 | 5530 | 5530 |
 (K) (K) |
5577(140) | 5015(29) | 4953(23) | 5306(23) | 5220(16) | 5282(65) | 4922(122) | 4975(76) |
| q = m2/m1 | 1.59(3) | 1.61(1) | 1.62(1) | 1.62(1) | 1.62(1) | 1.61(2) | 1.59(3) | 1.61(3) |

|
0.3844(299) | 0.5115(77) | 0.5267(66) | 0.4390(53) | ⋯ | ⋯ | ⋯ | ⋯ |

|
⋯ | ⋯ | ⋯ | ⋯ | ⋯ | 0.4449(154) | 0.5376(347) | 0.5218(216) |

|
⋯ | ⋯ | ⋯ | ⋯ | 0.4471(33) | ⋯ | ⋯ | ⋯ |

|
⋯ | ⋯ | ⋯ | ⋯ | 0.4367(26) | ⋯ | ⋯ | ⋯ |
 (pole) (pole) |
0.3231(25) | 0.3199(7) | 0.3171(6) | 0.3181(6) | 0.3193(3) | 0.3208(12) | 0.3235(16) | 0.3194(16) |
| r1 (side) | 0.3387(30) | 0.3349(8) | 0.3315(7) | 0.3327(7) | 0.3342(3) | 0.3359(15) | 0.3392(19) | 0.3342(20) |
| r1 (back) | 0.3746(46) | 0.3689(13) | 0.3638(10) | 0.3655(11) | 0.3678(5) | 0.3704(23) | 0.3754(29) | 0.3679(29) |
| r2 (pole) | 0.4024(24) | 0.3991(7) | 0.3960(6) | 0.3974(6) | 0.3984(3) | 0.3984(12) | 0.4023(15) | 0.3986(16) |
| r2 (side) | 0.4270(31) | 0.4227(9) | 0.4188(7) | 0.4205(8) | 0.4219(3) | 0.4218(15) | 0.4267(20) | 0.4221(20) |
| r2 (back) | 0.4587(42) | 0.4530(12) | 0.4478(10) | 0.4500(10) | 0.4519(5) | 0.4518(20) | 0.4584(27) | 0.4522(27) |
| ϕ (deg) | 75.8(6.3) | 87.3(3.9) | 96.3(6.2) | 83.6(4.8) | 82.3(6.2) | 90.1(7.4) | 90.4(5.6) | 91.3(6.3) |
| θ (deg) | 76.6(8.0) | 272.5(4.5) | 296.6(3.9) | 59.3(1.7) | 65.6(2.9) | 40.9(1.9) | 8.6(0.9) | 292.2(3.4) |
| γ (deg) | 7.6(2.2) | 19.0(1.6) | 13.9(1.0) | 12.4(1.3) | 12.0(0.6) | 12.9(1.5) | 12.7(1.3) | 12.7(1.7) |
| Ts/Tph | 1.58(0.10) | 1.01(0.01) | 1.26(0.01) | 1.13(0.02) | 1.19(0.03) | 1.12(0.02) | 1.26(0.03) | 1.14(0.02) |

|
0.1213 | 0.0756 | 0.0547 | 0.0596 | 0.0747 | 0.0689 | 0.0632 | 0.0656 |
Download table as: ASCIITypeset image
4. Orbital Period Investigation
The orbital period change of the eclipsing binary is generally investigated by using the O − C diagram, constructed from the differences between the observed (O) times of light minimum and the calculated (C) ones. For V0599 Aur, we have collected a total of 59 times of minimum light (see Table 6). Among them, seven times of minimum light and their uncertainties were derived from three surveys' observations using the method of Borkovits et al. (2015), while from our observations, four times and their uncertainties were determined using the method of Kwee & van Woerden (1956). The remaining 48 times and their uncertainties were collected from the literature. Based on the linear ephemeris derived by Liu et al. (2010), the O − C curve was then obtained and shown in Figure 5. By assigning the reciprocals of the normalized square errors as their weights and using the weighted least-squares method, we derived a quadratic ephemeris with an attached sinusoidal variation,
which is plotted as a solid line in the top panel of Figure 5. The quadratic term reveals a secular period decrease at the rate of  days yr–1. The sinusoidal term implies a cyclic period change with an amplitude of A = 0.0051 day and a period of
  , which is more clearly demonstrated in the middle panel of Figure 5. The residuals with respect to Equation (1) are shown in the bottom panel of Figure 5, where any significant changes cannot be traced, although the scatter of those residuals is relatively large (up to 0.006 day) for CCD data. Perhaps those residuals are attributable to the effect of asymmetry and variation of the light curve due to starspot activity on the components of this system (Kalimeris et al. 2002).
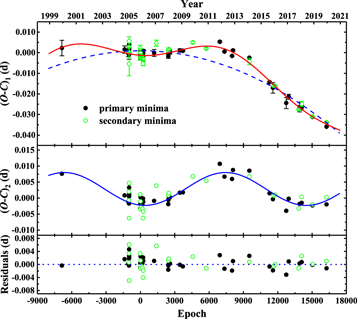
Figure 5. Top:  diagram of V0599 Aur calculated from the linear ephemeris. The solid line represents the fitting curve corresponding to Equation (1), which refers to a combination of the secular period decrease and cyclic period variation. The dashed line denotes the quadratic part of Equation (1). Middle:
  curve based on the quadratic term of Equation (1). The solid line denotes the fitting curve with a sinusoidal function in Equation (1). Bottom: final residuals and their linear fitting curve (dashed line).
Download figure:
Standard image High-resolution imageTable 6. Times of Light Minimum of V0599 Aur
| JD(Hel.) | Filtera | Error | Type | References | JD(Hel.) | Filtera | Error | Type | References | |
|---|---|---|---|---|---|---|---|---|---|---|
| 2,451,515.95803 | o | 0.00379 | I | 1 | 2,454,462.11480 | RI | 0.00100 | II | 5 | |
| 2,453,249.30794 | o | 0.00179 | I | 1 | 2,454,462.27160 | RI | 0.00100 | I | 5 | |
| 2,453,354.39600 | V | 0.00150 | I | 2 | 2,454,472.08460 | RI | 0.00030 | I | 5 | |
| 2,453,370.38150 | V | 0.00250 | II | 2 | 2,454,472.24460 | RI | 0.00040 | II | 5 | |
| 2,453,373.38980 | V | 0.00220 | I | 2 | 2,454,504.37160 | V | 0.00110 | I | 6 | |
| 2,453,374.33720 | B | 0.00230 | I | 2 | 2,454,777.85940 | V | 0.00080 | I | 7 | |
| 2,453,374.49920 | B | 0.00180 | II | 2 | 2,454,862.69090 | V | 0.00040 | I | 8 | |
| 2,453,375.28910 | B | 0.00200 | I | 2 | 2,455,137.92290 | V | 0.00060 | II | 9 | |
| 2,453,375.44050 | B | 0.00570 | II | 2 | 2,455,508.90000 | V | 0.00040 | II | 10 | |
| 2,453,376.24140 | V | 0.00180 | I | 2 | 2,455,882.89050 | V | 0.00050 | I | 11 | |
| 2,453,377.35070 | R | 0.00220 | II | 2 | 2,456,012.34890 | −U-I | 0.00030 | I | 12 | |
| 2,453,377.50550 | R | 0.00220 | I | 2 | 2,456,221.89360 | c | 0.00030 | I | 13 | |
| 2,453,683.43750 | o | 0.00150 | II | 3 | 2,456,246.90260 | V | 0.00050 | I | 14 | |
| 2,453,683.59130 | o | 0.00110 | I | 3 | 2,456,701.28450 | −I | 0.00160 | II | 15 | |
| 2,453,686.44160 | o | 0.00170 | I | 3 | 2,456,701.44460 | −I | 0.00030 | I | 15 | |
| 2,453,686.59830 | o | 0.00080 | II | 3 | 2,457,258.53592 | c | 0.00050 | I | 16 | |
| 2,453,694.35710 | o | 0.00070 | I | 3 | 2,457,351.91127 | V | 0.00258 | I | 1 | |
| 2,453,694.51410 | o | 0.00200 | II | 3 | 2,457,373.59485 | c | 0.00050 | II | 17 | |
| 2,453,694.67020 | o | 0.00030 | I | 3 | 2,457,415.69400 | V | 0.00040 | II | 18 | |
| 2,453,705.43300 | o | 0.00100 | I | 3 | 2,457,721.61784 | V | 0.00272 | I | 1 | |
| 2,453,705.59130 | o | 0.00100 | II | 3 | 2,457,789.04300 | V | 0.00120 | I | 19 | |
| 2,453,741.35910 | o | 0.00120 | II | 3 | 2,458,066.79710 | c | 0.00030 | II | 20 | |
| 2,453,741.51880 | o | 0.00090 | I | 3 | 2,458,088.16449 | V | 0.00237 | I | 1 | |
| 2,453,760.34830 | o | 0.00100 | II | 3 | 2,458,145.93380 | V | 0.00120 | II | 21 | |
| 2,453,760.51270 | o | 0.00090 | I | 3 | 2,458,146.09020 | V | 0.00120 | I | 21 | |
| 2,453,768.26380 | o | 0.00070 | II | 3 | 2,458,444.26262 | BVR | 0.00026 | I | 1 | |
| 2,453,768.42510 | o | 0.00160 | I | 3 | 2,458,444.42112 | BVR | 0.00018 | II | 1 | |
| 2,454,069.13432 | o | 0.00167 | I | 1 | 2,458,836.12927 | BVR | 0.00010 | I | 1 | |
| 2,454,130.38870 | o | 0.00150 | II | 4 | 2,458,836.28974 | BVR | 0.00009 | II | 1 | |
| 2,454,458.47186 | o | 0.00102 | I | 1 | ⋯ | ⋯ | ⋯ | ⋯ | ⋯ |
Note.
ao: without filter; B: B filter; V: V filter; R: R filter; I: I filter; –U-I: U and IR cutoff filters; c: clear filter; –I: IR cutoff filter; RI: R and I filters; BVR: B, V, and R filters.References. (1) This paper; (2) Martignoni (2006); (3) Diethelm (2006); (4) Diethelm (2007); (5) Liu et al. (2010); (6) Diethelm (2008); (7) Diethelm (2009); (8) Diethelm (2009); (9) Diethelm (2010); (10) Diethelm (2011); (11) Diethelm (2012); (12) Hübscher & Lehmann (2013); (13) Nelson (2013); (14) Diethelm (2013); (15) Hübscher & Lehmann (2015); (16) Juryšek et al. (2017); (17) Nelson (2016); (18) Samolyk (2019); (19) Nagai (2018); (20) Nelson (2018); (21) Nagai (2019).
Download table as: ASCIITypeset image
5. Physical Origins of Orbital Period Variations
The orbital period investigation of V0599 Aur in the previous section revealed that its orbital period is undergoing a secular decrease and a cyclic variation. Due to the contact configuration and magnetic-activity implications suggested by the long-term photometry, the secular period decrease may be caused by mass transfer and/or angular momentum loss due to magnetic braking. Mass loss due to stellar wind may also be responsible for the long-term period decrease. However, a typical mass-loss rate due to stellar wind is about 10−10 M⊙ yr−1 for active dwarf stars (Mullan et al. 1992) or lower than this value (Lim & White 1996). Thus, the orbital period decrease rate yielded by stellar wind mass loss ( days yr−1) is 2–3 orders of magnitude smaller than the observed values (
 days yr−1), so the contribution of stellar wind mass loss is negligible. For the cyclic period variation, there are at least three possible physical origins: cyclic magnetic activity, a light-time effect due to a tertiary companion, and apsidal motion. Among these possibilities, apsidal motion does not explain the cyclic period change of V0599 Aur, since both its primary and secondary times of minimum light follow the same general trend of O − C variation. In the following subsections, the possible mechanisms, i.e., mass transfer, angular momentum loss due to magnetic braking, the light-time effect of a third body, and cyclic magnetic activity, will be discussed in detail based on the results of orbital period change and photometric studies.
In order to discuss the physical origins of orbital period changes and the evolutionary state of V0599 Aur, its absolute elements are needed. Due to the absence of spectroscopic observations, the absolute physical parameters are usually estimated by combining the photometric elements with the empirical relations (Qian 2003; Dimitrov & Kjurkchieva 2015; Kjurkchieva et al. 2018). Nowadays, the Gaia mission (Gaia Collaboration et al. 2016, 2018) has provided unprecedented parallax measurements of over 1 billion stars that allow us to accurately estimate the absolute parameters for many eclipsing binaries. With the Gaia distances estimated by Bailer-Jones et al. (2018) and the light-curve solutions, Kjurkchieva et al. (2019b) developed a standard procedure to determine the absolute parameters of eclipsing binaries that has been applied for many binary samples (Kjurkchieva & Ibryamov 2019; Kjurkchieva et al. 2019a, 2019c, 2020a, 2020b). Here we employed this procedure to determine the absolute parameters of V0599 Aur by combining our photometric solutions and Gaia distance (Bailer-Jones et al. 2018). For this aim, we first measured the V magnitude at the quadratures of our light curves, and then it was dereddened by taking into account both the atmospheric and interstellar extinctions. The atmospheric extinction was made by applying the nightly extinction coefficients determined from the observations of the comparison star. The interstellar extinction was taken into account by the galactic interstellar extinction model (Arenou et al. 1992) according to the Gaia distance and galactic coordinates of the target star. With the formula of distance modulus, the absolute magnitude MV was calculated according to the corrected V magnitude. Finally, by using the standard procedure described in Kjurkchieva et al. (2019b), the bolometric absolute magnitude Mbol and the other absolute parameters were calculated and compiled in Table 7.
Table 7. Absolute Physical Parameters of V0599 Aur
| Parameter | Primary | Secondary | Unit |
|---|---|---|---|
| d | 295.5(±3.7) | pc | |
| Mbol | 4.55(±0.10) | mag | |
| Ltot | 1.20(±0.09) | L⊙ | |
| L | 0.54(±0.04) | 0.66(±0.05) | L⊙ |
| R | 0.80(±0.03) | 0.99(±0.04) | R⊙ |
| A | 2.35(±0.05) | R⊙ | |
| M | 0.66(±0.04) | 1.07(±0.04) |

|
Download table as: ASCIITypeset image
5.1. Secular Period Decrease
For a binary system with a circular orbit and constant total mass, the orbital evolution will be dominated by

where ![$J=2\pi {A}^{2}{M}_{1}{M}_{2}/[({M}_{1}+{M}_{2})P]$](https://content.cld.iop.org/journals/1538-3881/160/2/62/revision1/ajab99c4ieqn25.gif) denotes the orbital angular momentum of a binary system. As can be seen from Equation (2), both mass transfer and angular momentum loss can be responsible for the secular period decrease of V0599 Aur. Based on the standard magnetic braking model (Weber & Davis 1967), Guinan & Bradstreet (1988) estimated the rate of decrease of the orbital period yielded by angular momentum loss due to magnetic braking as
denotes the orbital angular momentum of a binary system. As can be seen from Equation (2), both mass transfer and angular momentum loss can be responsible for the secular period decrease of V0599 Aur. Based on the standard magnetic braking model (Weber & Davis 1967), Guinan & Bradstreet (1988) estimated the rate of decrease of the orbital period yielded by angular momentum loss due to magnetic braking as

where the gyration constant k2 is usually set to 0.1 for cool main-sequence stars. By inserting the physical parameters into Equation (3), we obtained a period decrease rate of  days yr−1. It is equal to about one-tenth of the observed period decrease rate (
 days yr−1), which implies that the angular momentum loss due to magnetic braking is not enough to yield the observed period decrease of V0599 Aur.
Regarding the mass-transfer explanation, the matter should be transferred from the more massive secondary to the less massive primary because of the observed period decrease. After subtracting the period decrease rate yielded by angular momentum loss, the remaining part of the observed period decrease can be yielded only by mass transfer. Using Equation (2), the mass-transfer rate may be written as

According to the period decrease rate caused by mass transfer ( days yr−1), the corresponding mass-transfer rate
 is determined. If the observed period decrease is fully yielded by conservative mass transfer (i.e.,
  days yr−1), the mass-transfer rate from the secondary to the primary is required to reach
 . Our calculations suggest that the mass-transfer rate is in the range of
 ![$[-5.0\sim -5.8]\times {10}^{-7}$](https://content.cld.iop.org/journals/1538-3881/160/2/62/revision1/ajab99c4ieqn34.gif) M⊙ yr−1. If the secondary component transfers its matter to the primary component on a thermal (Kelvin–Helmholtz) timescale, i.e.,
M⊙ yr−1. If the secondary component transfers its matter to the primary component on a thermal (Kelvin–Helmholtz) timescale, i.e.,  (Paczyński 1971), the mass-transfer rate on the thermal timescale,
 , can be approximately estimated. Significantly, it is smaller than the mass-transfer rates derived from Equation (4), which implies that the conservative mass transfer from the secondary to the primary is sufficient to yield the observed period increase. In view of the facts mentioned above, the mass transfer from the secondary component to the primary one should be chiefly responsible for the observed period decrease of V0599 Aur.
5.2. Cyclic Period Variation
5.2.1. Cyclic Magnetic Activity
Both the photometric results and the variation of the O'Connell effect strongly suggest the presence of the active spot in V0599 Aur. This evolution of starspots on the surface of the constituent stars in short-period binaries, especially contact binaries, could affect the measurements of eclipse times and thus mimic changes in the orbital period (Csizmadia et al. 2004). In order to examine this probability, we estimated the amplitude (∼300 s) of the eclipse timing variation for V0599 Aur according to the theoretical formula derived by Pribulla et al. (2012). It is in good agreement with the typical amplitudes of 200–300 s that were observed for the Kepler contact binaries (Tran et al. 2013). However, the amplitude of 0.0051 day (∼440 s) in the observed  variations for V0599 Aur is significantly larger than the typical amplitude of ∼300 s possibly caused by the active spot. Moreover, the presence of the spot could usually produce either an anticorrelation between the primary and secondary eclipse timing variations or random-walk variations for the contact binary (Tran et al. 2013). Additionally, the timescale of 11.84 yr on the observed
  variations of V0599 Aur is significantly longer than the typical timescale of a few hundred days (200–500 days; Tran et al. 2013) caused by the spot evolution. Generally, the low-amplitude and high-frequency disturbances for the eclipse times are explained by the migrating starspots (Kalimeris et al. 2002), whereas the long periodic oscillations with a timescale from several years to decades are interpreted as indirect evidence of solar-like magnetic cycles (e.g., Qian 2003; Awadalla et al. 2004; Qian et al. 2007). Thus, the cyclic magnetic activity should be considered as a preferred cause to yield the observed cyclic period variation of V0599 Aur. The theoretical model formulating this mechanism was proposed by Applegate (1992) and promoted by Lanza et al. (1998) and Lanza & Rodonò (2002). According to Applegate's model, strong magnetic activities under the surfaces of the components can provide an underlying force to indirectly drive period changes. Due to a changing magnetic field distribution, the angular momentum distribution of the binary system will be continually adjusted, resulting in changes of the gravitational quadrupole moment. Such changes in the gravitational quadrupole moment can naturally yield an oblateness perturbation of the components and changes of radial differential rotation. Finally, the orbital period of the binary system will be continuously modulated via the gravitational coupling between the orbit and deformation of the active component. In the case of conservative angular momentum, when the gravitational quadrupole momentum increases, the component moves closer to its orbit, and its velocity will become faster under a stronger gravitational force; thus, the orbital period decreases. Otherwise, the orbital period increases.
By inserting the modulation period and amplitude obtained from the cyclic period variation, together with the absolute physical parameters, into theoretical formulas derived by Applegate (1992), we calculated the model parameters needed to yield the observed cyclic variation in the orbital period of V0599 Aur. These parameters are listed in Table 8, where ΔP, ΔQ, ΔJ, ΔΩ/Ω, ΔE,  , and B represent the amplitude of orbital period modulation, variation of quadruple moment, angular momentum transfer, variation of angular velocity, required energy, luminosity variation, and magnetic field, respectively. In our calculations, the mass of the convective shell is assumed to be one-tenth of the mass of the active star, i.e.,
  . Although our photometric results strongly suggest that the more massive secondary of V0599 Aur contained the active spot and thus could be a solar-type magnetic-activity star, we could not exclude the existence of magnetic activity in its primary component, because the primary component also satisfies the condition to generate magnetic activity. Therefore, our calculations have been applied to both the primary and secondary components of V0599 Aur. Additionally, Applegate's mechanism typically requires those model parameters at the specific levels that are also given in the fourth column of Table 8 as a reference. From the results listed in Table 8, we note that the required energy of the primary is significantly higher than the typical values required by Applegate's theory.
Table 8. Model Parameters for Magnetic Activity of V0599 Aur
| Parameter | Primary | Secondary | Typical Value | Unit |
|---|---|---|---|---|
| ΔP | 2.31(±0.28) × 10−6 | 10−5–10−6 | days | |

|
|
10−5–10−6 | ⋯ | |
| ΔQ | 2.89(±0.35) × 1049 | 4.62(±0.56) × 1049 | 1049 |

|
| ΔJ | 1.95(±0.24) × 1047 | 2.56(±0.31) × 1047 | 1046–1047 |

|
| ΔΩ/Ω | 2.06(±0.25) × 10−3 | 1.09(±0.13) × 10−3 | 0.01 | ⋯ |
| ΔE | 2.76(±0.12) × 1041 | 1.93(±0.08) × 1041 | ⋯ | erg |

|
1.10(±0.36) | 0.62(±0.19) | ∼0.1 | ⋯ |
| B | 7.47(±0.32) × 103 | 6.16(±0.28) × 103 | 103–104 | G |
Download table as: ASCIITypeset image
Meanwhile, because the required energy is determined by the luminosity variation, the luminosity variation of the primary naturally exceeds the corresponding requirement of the mechanism. This implies that the observed cyclic period variation of V0599 Aur cannot be explained by the cyclic magnetic activity of the primary but should be caused by that of its secondary. However, the energy requirement is very sensitive to the shell mass. In order to further examine whether or not the cyclic magnetic activities of both the primary and secondary could be sufficient to yield the observed cyclic period variation of V0599 Aur, we also carefully calculated both the required energies by changing the shell mass and available energy provided by the active star (see Brinkworth et al. 2006 for details), as shown in Figure 6. Obviously, the required energy for the primary star is always higher than the available energy provided by it, while for the secondary star, the required energy may be lower than the available energy when the shell mass is within the range  to
to  . From this perspective, the primary star of V0599 Aur is not capable of generating enough energy to drive Applegate's process, but the secondary may be. Thus, the observed cyclic variation in the orbital period of V0599 Aur should be caused by the cyclic magnetic activity of the secondary, instead of that of the primary. This is also in good agreement with our photometric results, which show that the secondary component of V0599 Aur is a magnetic-activity star.
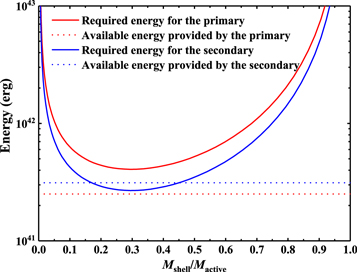
Figure 6. Required energies for the primary (red solid line) and secondary (blue solid line) to drive Applegate's process for yielding the observed cyclic period changes of V0599 Aur as a function of mass ratio between shell mass and total mass of the active star. The dashed lines represent the available energies provided by the primary (red dashed line) and secondary (blue dashed line) star.
Download figure:
Standard image High-resolution imageAccording to Applegate's theory, cyclic magnetic activity in a binary system may cause the cyclic variations in its orbital periods. Thus, a correlation between magnetic activity and orbital period change might be excepted. If the light-curve asymmetry is completely caused by active spots, the O'Connell effect will be a good indicator of magnetic activity. Theoretically, the period of cyclic period change should be the same as that of O'Connell effect variation. For V0599 Aur, those observed light curves compiled in the previous section cover a 20 yr time region that can allow us to trace this underlying correlation and cyclic magnetic activity. Of course, if an unequivocal correlation could indeed be detected, it would also be a piece of direct and strong evidence for the magnetic-activity explanation of the cyclic period variation.
In order to quantify the light-curve asymmetry (the O'Connell effect), we first employed a conventional measurement, i.e., the magnitude difference between the primary and secondary maxima in the light curves,

where m(maxI) and m(maxII) denote the peak magnitudes after the primary (deeper) eclipse and second (shallower) eclipse, respectively. It has been widely used to measure the quality of the light-curve asymmetry and can be generally calculated by fitting curves to the regions around the maxima or by visual inspection. When the primary maximum is higher (brighter) than the second maximum, Δm is larger than zero, implying a positive O'Connell effect. Otherwise, the O'Connell effect is negative. Beyond the simple and conventional Δm measurement, another alternative one, called the O'Connell effect ratio (OER), was also proposed by McCartney (1997). It is the ratio of the areas beneath the two maxima of a phased light curve. In the numerical scheme, a phased light curve is first divided by phase into n equally wide bins, with n chosen to sufficiently sample the light curve. Then, the mean magnitude in each bin is calculated and normalized by subtracting the mean magnitude in the bin around the primary minimum. The OER is finally calculated according to the definition

where mk denotes the mean magnitude in the kth bin. Obviously, the OER is helpful for detecting asymmetries in the out-of-eclipse regions of a light curve that may not be readily found by the conventional Δm measurement. Although it has not been widely applied in the literature, it has proven to be more valuable than the simple Δm measurement in tracking changes in light-curve asymmetry in a single system over time and comparing the asymmetries for many systems (McCartney 1997).
Based on the 10 collected sets of light curves, we calculated both Δm and OER and compiled them in Table 9. Actually, we should adopt a uniform band to investigate the long-term variation of the O'Connell effect in spite of the weak correlation between it and optical wavelengths (Davidge & Milone 1984). However, for the observations of NSVS and WASP, no filter (NSVS and WASP before 2006) or a broadband filter with a bandpass from 400 to 700 nm (WASP after 2006) was installed on the telescopes. The light curves of Liu et al. (2010) are in the R and I bands. Thus, we had to adopt the light curves under a different optical bandpass to estimate the O'Connell effect. In order to reduce the effects yielded by different bandpass, we chose the V-band light curves for our new observations and the R-band one for the observations of Liu et al. (2010) because these bands are closet to the middle wavelength (also the most sensitive for CCD) of the broad optical band from 400 to 1000 nm. Figure 7 shows a plot of the measurements of the O'Connell effect versus the corresponding  in the orbital period variations. The Pearson correlation coefficients were then calculated to be r = 0.664 for the Δm measurement and r = 0.537 for the OER one, which suggests a weak and positive correlation between the O'Connell effect and cyclic period variation. This implies that the cyclic variation in the orbital period of V0599 Aur can indeed be responsible for the cyclic magnetic activity. Additionally, if the cyclic period variation is caused by the cyclic magnetic activity, the variation of the O'Connell effect should be periodic, with the same period of the cyclic variation in its orbital period. To find any periodic variation in the O'Connell effect, we separately fitted Δm and OER with a sinusoidal function,

aiming to extract the periodicity in the O'Connell effect variation of V0599 Aur. With the least-squares method, the fitting results and the corresponding curves are shown in Figure 8. Clearly, Figure 8 represents the good sinusoidal variations for both Δm and the OER, which indicates that a long-term and periodic variation of the O'Connell effect does indeed exist for V0599 Aur to correspond to its cyclic magnetic activity. Moreover, the periods obtained from the two measures of the O'Connell effect ( and
and  yr) are almost in agreement with the period (Pmod = 11.84 yr) of cyclic period variation. These facts strongly suggest that V0599 Aur exhibits cyclic magnetic activity with a period of about 11 yr that yields the observed periodic variation in its orbital period.
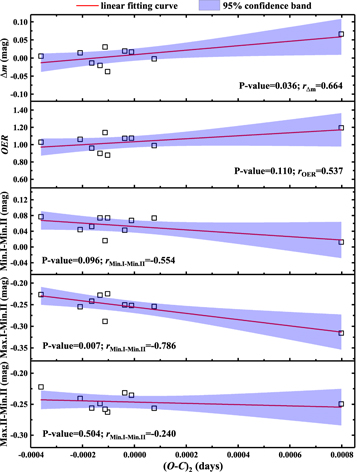
Figure 7. Correlations between the O'Connell effect measures (Δm and OER) and the relative luminosity (Min.I-Min.II, Max.I-Min.II, and Max.II-Min.II) and  values. Pearson's correlation coefficients and P values are calculated to quantify these correlations.
Download figure:
Standard image High-resolution image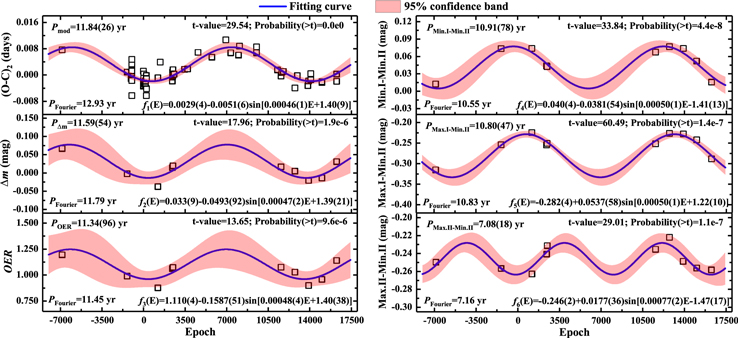
Figure 8. Possible periodic variations for  , Δm, OER, and the relative luminosity (Min.I-Min.II, Max.I-Min.II, and Max.II-Min.II). The solid lines represent the sinusoidal fit with Equation (7). The results of the T test for the fitting parameter ω of Equation (7) are given in the top right corner of each panel to show the reliability of the periodicity. The periods PFourier determined from Fourier analysis are presented in the bottom left corner of each panel.
Download figure:
Standard image High-resolution imageTable 9. Measurements of the O'Connell Effect in the Light Curves of V0599 Aur
| Observation | Year | Mean HJDa | Mean Epochb | Band | Δm (mag) | OER | Min.I-Min.II | Max.I-Min.II | Max.II-Min.II |
|---|---|---|---|---|---|---|---|---|---|
| NSVS | 1999 | 2,451,515 | −6857 | Unfiltered | 0.0661 | 1.1923 | 0.0122 | −0.3158 | −0.2497 |
| 2004 | 2,453,249 | −1381 | Unfiltered | −0.0024 | 0.9884 | 0.0733 | −0.2543 | −0.2567 | |
| WASP | 2006 | 2,454,069 | 1209 | 400–700 nm | −0.0379 | 0.8763 | 0.0738 | −0.2249 | −0.2628 |
| 2007 | 2,454,458 | 2439 | 400–700 nm | 0.0141 | 1.0610 | 0.0437 | −0.2549 | −0.2408 | |
| Liu et al. | 2008 | 2,454,472 | 2482 | R | 0.0193 | 1.0716 | 0.0424 | −0.2508 | −0.2315 |
| 2008 | 2,454,472 | 2482 | I | 0.0245 | 1.0907 | 0.0351 | −0.2421 | −0.2176 | |
| 2015 | 2,457,351 | 11580 | V | 0.0165 | 1.0741 | 0.0671 | −0.2520 | −0.2355 | |
| ASAS | 2016 | 2,457,721 | 12748 | V | 0.0048 | 1.0273 | 0.0766 | −0.2268 | −0.2220 |
| 2017 | 2,458,088 | 13906 | V | −0.0208 | 0.8989 | 0.0736 | −0.2282 | −0.2490 | |
| 2018 | 2,458,444 | 15031 | B | −0.0134 | 0.9685 | 0.0609 | −0.2511 | −0.2645 | |
| This paper | 2018 | 2,458,444 | 15031 | V | −0.0141 | 0.9573 | 0.0519 | −0.2423 | −0.2564 |
| 2018 | 2,458,444 | 15031 | R | −0.0113 | 0.9927 | 0.0437 | −0.2363 | −0.2476 | |
| 2019 | 2,458,836 | 16269 | B | 0.0332 | 1.1567 | 0.0152 | −0.3039 | −0.2707 | |
| This paper | 2019 | 2,458,836 | 16269 | V | 0.0303 | 1.1379 | 0.0157 | −0.2886 | −0.2583 |
| 2019 | 2,458,836 | 16269 | R | 0.0291 | 1.1174 | 0.0154 | −0.2774 | −0.2483 |
Notes.
aMean HJD denotes the average value of HJD of the observational data points for the corresponding light curve. bMean epoch was calculated based on the corrected linear ephemeris in Equation (1).Download table as: ASCIITypeset image
In theory, besides the cyclic variation in both orbital period and O'Connell effect, Applegate's mechanism could cause periodic changes of the maximum luminosity (out-of-eclipse brightness) and color of the systems. These observable effects, which can also provide a critical test for the variability of Applegate's mechanism, must be pursued (see, for example, Kalimeris et al. 1994 for the case of AB And). For this aim, we examined the light and color variations of V0599 Aur in those 10 sets of light curves. However, it is really impossible to trace the color variation of V0599 Aur from only three sets of available multiple-band light curves. When digging for the long time variations of the maximum luminosity, we need a supposed constant luminosity that can be used as a reference (Kim et al. 1997). According to our photometric analysis, the active spot firmly exists on the surface of the secondary component of V0599 Aur. The luminosity of the system at 0.5 phase (Min.II) comes mainly from the primary's hemisphere, together with some uneclipsed portion of the secondary star. Thus, the luminosity for Min.II would be more stable than those of other phases and considered as a baseline luminosity. The magnitude differences between three characteristic phases (i.e., 0.0, 0.25, and 0.75 phases) and the referred phase (0.5 phase) were then calculated for the 10 sets of light curves and compiled in the last three columns of Table 9. Although these magnitude differences are not a direct measurement of the global bolometric luminosity, their variations could, more or less, reflect the luminosity changes of the components. The possible correlations between them and the  values were measured and presented in Figure 7, where the underlying negative correlations (r = −0.554 for Min.I-Min.II, r = −0.786 for Max.I-Min.II, and r = −0.240 for Min.I-Min.II) were found. Meanwhile, to find any periodic variation, the magnitude differences are also separately fitted by using the prior equation (i.e., Equation (7)). In Figure 8, the apparent sinusoidal variations for the magnitude differences between the characteristic phases and the referred phase can been seen. This implies that the maximum luminosity of V0599 Aur seems to vary in a more or less sinusoidal way. However, the period for the sinusoidal variation of (Max.II-Min.II) is significantly smaller than those of all other cases. Perhaps, because of the low amplitude, it is a spurious quasi-periodic oscillation yielded by the pseudorandom errors of observations. Of course, it also is possible that the active spots suddenly disappear at the hemisphere observed at the 0.75 phase. According to Applegate's theory, if either of the components in V0599 Aur is magnetically active, changes to the mean bolometric luminosity occur globally, in response to the magnetic cycle. Thus, when the photospheric inhomogeneities do not exist, the luminosity variations should be perfectly sinusoidal. Of course, the sinusoidal variation in both the O'Connell effect and these magnitude differences might be spurious due to the insufficient and noisy observational data. Based on the bootstrap sample, we performed a simple T test for the fitting parameter ω (used to determine the period of sinusoidal variation) that is shown in Figure 8. It is plausible that the periodic variations in both the O'Connell effect and these magnitude differences might exist in response to the cyclic magnetic activity. Additionally, the Fourier analysis was performed by using the software package PERIOD04 (Lenz & Breger 2005). The periods determined from the Fourier analysis are almost consistent with the results from the sinusoidal fits.
5.2.2. Light-time Effect of the Third Body
If there exists a tertiary companion orbiting the binary system, the observed eclipse times of this binary system can also vary periodically due to the light-time effect of the tertiary companion (Irwin 1952). For V0599 Aur, we can assume that the third body is moving in a circular orbit because of the good sinusoidal fitting for (O − C)2 values. By inserting the amplitude and period of cyclic period variation into the well-known mass function
where  , we determined the mass function for the third body,
  M⊙. The mass and orbital radius of the third body for several typical orbital inclinations were then calculated and are listed in Table 10. When the orbital inclination of the third body is equal to 90°, the minimum mass of the third body is
  M⊙. If the third body moves in a coplanar orbit with the binary system V0599 Aur (i.e.,
  ), its mass is M3 = 0.31(±0.04) M⊙. In other words, the mass of the third body is at least one-third of the mass of the primary component of V0599 Aur and may be equal to half of the primary's mass when their orbits are in the same plane. Thus, the third body may be a subdwarf, and its spectrum or small light contribution to the light curves may be expected. However, according to the photometric solutions derived by both us and Liu et al. (2010), no significant third light can be detected in all of those light curves. Of course, detecting third light in the light curves of contact binaries is exceedingly difficult, even unreal. This is clear from the comparison of the light-curve solution of the Hipparcos light curves (Selam 2004) and the later spectroscopic studies by Rucinski et al. (2005, 2008) and Pribulla et al. (2006) based on the David Dunlap Observatory spectroscopy, which often lead to completely different mass ratios. The most direct method to manifest the existence of a tertiary companion is to detect either the transiting circumbinary events or γ-velocity variation of the binary system. However, the additional eclipses are generally rare or difficult to find due to the fairly strict requirements for both the presence of a transiting circumbinary event and observation methods (Klagyivik et al. 2017), while the spectroscopic observations are so far absent for V0599 Aur. Additionally, based on the orbital dynamics of the three-body system, the third body may lead to orbital plane precession of the inner binary, so that the eclipsing depth and orbital inclination of the binary can slightly change on a long timescale. For V0599 Aur, the slight variation in the eclipsing depth cannot be identified due to the disturbance of the O'Connell effect in its light curves, while the orbital inclinations derived from long-term photometry (see the photometric solutions in Tables 3 and 4) seem to be constant in the last two decades. This seems to confirm the absence of the third body.
Table 10. Mass and Orbital Parameters of the Third Body Orbiting the Binary System V0599 Aur
| Parameter | Value | Unit |
|---|---|---|
| A | 0.0051(±0.0006) | day |
| P3 | 11.84(±0.06) | yr |

|

|
M⊙ |

|

|
M⊙ |

|

|
M⊙ |

|

|
M⊙ |

|

|
M⊙ |

|

|
au |

|

|
au |

|

|
au |

|

|
au |
Download table as: ASCIITypeset image
6. Discussions and Conclusion
From the photometric results and orbital period investigation, V0599 Aur is a shallow contact binary with a very low contact degree (f = 4.3%) that exhibits a secular period decrease, as well as a cyclic period oscillation. For the secular period decrease, the angular momentum loss due to magnetic braking can contribute only about one-tenth of the decrease rate, while the stellar wind mass loss has almost no contribution. Therefore, mass transfer must be mainly responsible for the secular period decrease of V0599 Aur. When the material of the secondary is transferred to the primary, the mass ratio will gradually decrease. According to the quantitative relations between the Roche-lobe radius and the mass ratio derived by Hu et al. (2019),

the Roche-lobe radii of both the primary and secondary components will gradually decrease with the decrease of the mass ratio (see Figure 9). Figure 9 also shows that the absolute radii for both components are larger than the zero-age main-sequence (ZAMS) radius of the same-mass single star but significantly smaller than the corresponding terminal-age main-sequence (TAMS) radius, which implies that the two components of V0599 Aur should be within the main-sequence band. The normal evolution of the star will yield a slight expansion so that the radii of both the primary and secondary will grow larger than their corresponding critical Roche-lobe radii. Additionally, according to Kepler's third law, the semimajor axis will continuously decrease with the decrease of orbital period. All of these facts indicate that the shallow contact binary V0599 Aur is evolving away from the detached stage and toward the overcontact stage. However, according to the TRO theory, some contact binaries, especially shallow contact binaries, should be just at the rare stage dominated by TRO theory. They will undergo a periodic TRO around a state of marginal contact and then finally evolve into an overcontact state. Thus, the contact configuration of V0599 Aur may also be broken in the future. In view of the short orbital period (0.31653595 day) and almost equal temperatures of two components, it is very possible that V0599 Aur has ended the process of TRO and is evolving toward an overcontact stage. However, it will be difficult to confirm this issue on a timescale of several decades. Also, the absolute elements here were estimated roughly from photometric analysis, so there is a significant uncertainty for those results due to the lack of precision spectroscopy.
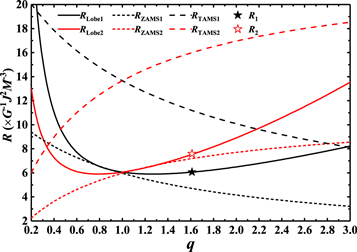
Figure 9. Critical Roche-lobe (solid lines), ZAMS (short dashed lines), and TAMS (long dashed lines) radii are plotted as a function of mass ratio. The open and filled stars refer to the radii of the primary and secondary components of V0599 Aur. The radii of ZAMS and TAMS stars with the same masses as two components of V0599 Aur are calculated using the mass–radius relation obtained by Demircan & Kahraman (1991).
Download figure:
Standard image High-resolution image
Benefiting from the long-term photometric observations of V0599 Aur, we found that both the O'Connell effect and the relative luminosity exhibit a plausible periodic variation. Moreover, the periods for these periodic variations are very close to that of cyclic period change and may even be equal to it within an allowable error range. Also, we detected some weak correlations between the relative luminosity variations and the cyclic period change. Combining those observational facts with photometric results, we inferred that the secondary of V0599 Aur is a solar-type active star with a magnetic-activity cycle of about 11.8 yr. Although the correlation may be expected by Applegate's theory, it should not be considered as strong evidence to support the magnetodynamic explanation for the cyclic period variation of V0599 Aur, because it may be weakened by both the symmetrical distribution of active spots and insufficient/noisy observational data. Also, an alternative mechanism to yield the cyclic variation in its eclipse times, namely the light-time effect of a third body, still cannot be excluded. In general, it would be quite difficult, even impossible, using only the (O − C) diagram, to determine which mechanism would be more appropriate to interpret cyclic period variations. In order to resolve the issue more firmly, we should search for additional evidence for cyclic magnetic activity (such as cyclic effects in the characteristic spectral lines, maculation effects in the continuous photometry, or flare incidents and other X-ray data) or the third body (such as any third light in photometry, a third-body spectrum in the overall spectrum, additional eclipses in a few rare cases, variations of light-curve amplitude due to orbital plane precession, and variations of the radial velocity of the mass center of the binary system) in the future.
In many binary systems (typical examples including CG Cyg (Kozhevnikova et al. 2012), YY Eri (Kim et al. 1997), BH Vir (Xiang et al. 2007), DV Psc (Pi et al. 2014), NSVS 02502726 (Zhang et al. 2014), AD Cnc (Qian et al. 2007), SW Lac, CN And, and V0502 Oph (Koju & Beaky 2015)), the O'Connell effect has been observed to significantly vary over many decades, but an excellent periodicity and correlation between the O'Connell effect and orbital period change, like V0599 Aur, has been very rarely detected. For example, Koju & Beaky (2015) attempted to determine the correlation for three binary systems (SW Lac, CN And, and V502 Oph) with both a variable O'Connell effect and a variable orbital period, but they did not find any significant correlation between variations in their orbital periods and O'Connell effects. Perhaps the greatest impediment to detecting the long-term variations of the O'Connell effect in eclipsing binaries is irregular and discontinuous observation, where the obtained light curves do not distribute uniformly over a long enough timescale. To the best of our knowledge, the excellent periodicity for the O'Connell effect and the correlation between it and orbital period change are detected for the first time. We think that, among those binary systems with a variable O'Connell effect, V0599 Aur is a unique and good sample for identifying cyclic magnetic activity from the O'Connell effect variation. However, the light curves obtained from several surveys (NSVS and ASAS-SN) show a large scatter, and thus their O'Connell effect cannot be measured precisely. Moreover, several sets of light curves (WASP) phased from the normal data points might not reveal the real light variations of V0599 Aur because its light curves can change even day by day. Thus, in order to firmly confirm the cyclic magnetic activity of V0599 Aur, it will be necessary to perform continuous and high-precision photometric observations in the future.
We would like to thank the anonymous reviewer for helpful comments. This work is supported by the Joint Research Funds in Astronomy (U1931115, U1731110, and U1731106) under cooperative agreement between the National Natural Science Foundation of China and the Chinese Academy of Sciences. We acknowledge the support of the staff of the Xinglong 85 cm telescope. J.F.Z. is thankful for the support from the National Natural Science Foundation of China (grant Nos. 11973035 and 11703020). This work was partially supported by the Open Project Program of the Key Laboratory of Optical Astronomy, National Astronomical Observatories, Chinese Academy of Sciences.
This work has made use of data from the European Space Agency (ESA) mission Gaia,8 processed by the Gaia Data Processing and Analysis Consortium (DPAC9 ). Funding for the DPAC has been provided by national institutions, in particular the institutions participating in the Gaia Multilateral Agreement. Additionally, this article uses data from three surveys: (1) the Northern Sky Variability Survey (Woźniak et al. 2004), whose data were collected by the first-generation Robotic Optical Transient Search Experiment; (2) the Wide Angle Search for Planets, where the data we used are from the DR1 of the WASP data (Butters et al. 2010) as provided by the WASP consortium and the computing and storage facilities at the CERIT Scientific Cloud, reg. no. CZ.1.05/3.2.00/08.0144, which is operated by Masaryk University, Czech Republic; and (3) the All-Sky Automated Survey for SuperNovae (Shappee et al. 2014; Jayasinghe et al. 2019), which consists of two telescopes on a common mount and is hosted by the Las Cumbres Observatory Global Telescope Network in the Faulkes Telescope North enclosure on Mount Haleakala, Hawaii. Finally, this article uses color-index data from the Two Micron All Sky Survey (Skrutskie et al. 2006), a joint project of the University of Massachusetts and the Infrared Processing and Analysis Center/California Institute of Technology, funded by the National Aeronautics and Space Administration and the National Science Foundation, and the AAVSO Photometric All Sky Survey (Henden et al. 2016), which was funded by the Robert Martin Ayers Sciences Fund to perform a wide-field, all-sky photometric survey.
Footnotes
- 3
IRAF is distributed by the National Optical Astronomy Observatory (NOAO), which is operated by the Association of the Universities for Research in Astronomy, Inc., under cooperative agreement with the National Science Foundation (NSF; http://iraf.noao.edu/).
- 4
- 5
- 6
- 7
- 8
- 9