


Abstract
Dense gas is important for galaxy evolution and star formation. Optically thin dense-gas tracers, such as isotopologues of HCN, HCO+, etc., are very helpful in diagnosing the excitation conditions of dense molecular gas. However, previous studies of optically thin dense-gas tracers mostly focused on the average properties of galaxies as a whole, due to limited sensitivity and angular resolution. M82, a nearby prototype starburst galaxy, offers a unique case for spatially resolved studies with single-dish telescopes. With the IRAM 30 m telescope, we observed the J = 1 → 0 transition of H13CN, HC15N, H13CO+, HN13C, H15NC, and SiO J = 2 → 1, HC3N J = 10 → 9, and H2CO J = 2 → 1 toward five positions along the major axis of M82. The intensity ratios of I(HCN)/I(H13CN) and I(HCO+)/I(H13CO+) show a significant spatial variation along the major axis, with lower values in the central region than those on the disk, indicating higher optical depths in the central region. The optical depths of HCO+ lines are found to be systematically higher than those of HCN lines at all positions. Furthermore, we find that the 14N/15N ratios have an increasing gradient from the center to the outer disk.
Export citation and abstract BibTeX RIS

Original content from this work may be used under the terms of the Creative Commons Attribution 4.0 licence. Any further distribution of this work must maintain attribution to the author(s) and the title of the work, journal citation and DOI.
1. Introduction
Observations show that star formation activities are closely connected with dense molecular gas both in the Milky Way and in other galaxies (Heiderman et al. 2010; Lada et al. 2010, 2012). The dense molecular gas is directly involved in star formation activities, and it can be probed with molecular lines with critical densities (ncrit) greater than 104 cm−3, such as multi-J transitions of HCN and HCO+ (Lada 1992; Kohno et al. 1999; Kennicutt & Evans 2012). With observations of HCN J = 1 → 0 toward 65 galaxies, Gao & Solomon (2004) found a tight linear correlation between the luminosities of HCN J = 1 → 0 and total infrared emission. However, most dense-gas tracers are normally optically thick both in Galactic giant molecular clouds (GMCs) and in external galaxies (Wang et al. 2014; Meier et al. 2015; Jiménez-Donaire et al. 2017; Li et al. 2017, 2020). Therefore, there is a large uncertainty in estimating the mass of dense gas from a single transition line of a molecule with a high dipole moment, which is similar to the issue of the CO-to-H2 conversion factors (Narayanan et al. 2012; Bolatto et al. 2013).
Optically thin dense-gas tracers, such as the isotopologues of HCN and HCO+, could help to better reveal the properties of dense gas in galaxies, such as volume density, temperature, and excitation conditions. One can determine optical depths of dense-gas tracers using their isotopologue line ratios (Henkel et al. 1998; Martín et al. 2010; Wang et al. 2014; Li et al. 2020). Because of their low abundances, the lines of isotopologue are mostly optically thin, and thus they can be used to accurately determine the properties of dense molecular gas and help study dense gas–star formation relations in different galaxies (Li et al. 2020).
In most galaxies, however, isotopologue lines of dense-gas tracers are too faint to be detected. Only a few detections of such lines have been reported in nearby galaxies (Henkel et al. 1998; Wang et al. 2014, 2016; Tunnard et al. 2015; Li et al. 2020), which either are limited within just the central regions of galaxies or take the global properties of galaxies as a whole (Wang et al. 2014; Li et al. 2020).
Toward one of the nearest starburst galaxies, M82, Li et al. (2020) observed multi-J HCN lines in the central region. Intriguingly, they found that the line profiles of H13CN J = 1 → 0 and J = 3 → 2 are not consistent with each other. The J = 1 → 0 and J = 3 → 2 transitions of H13CN are dominated by redshifted and the blueshifted velocity components, respectively. Because H13CN J = 3 → 2 has a higher upper energy level and a higher critical density than H13CN J = 1 → 0, such a difference may indicate velocity-dependent excitation conditions, isotope abundance variations, or exotic radiative transfer processes. It is natural to ask the following questions: How much would the properties of dense gas vary at different locations and for different velocity components of a galaxy? How would the isotopologue abundances of dense gas change along the galactic disk? What physical mechanisms would regulate the properties of dense gas on galactic scales?
The best way to address these questions is to obtain spatially resolved measurements of dense gas isotopologues, with deep integration. In this paper, we present new IRAM 30 m observations of the 13C and 15N isotopologues of HCN, HCO+, and HNC, along the major axis of M82. We describe observations and data reduction in Section 2. The new spectra, their intensities, optical depths, and abundance ratios are presented in Section 3. Section 4 discusses possible mechanisms that may dominate or bias these line ratios. Final conclusions are summarized in Section 5.
2. Observations and Data Reduction
Observations were performed with the IRAM 30 m telescope, at Pico Veleta, Spain during February 2019 (Project number: 186-18, PI: Feng Gao). A total of four different pointings were used to sample the off-center region along the major axis of M82, with a typical pointing offset of 15''. We list these pointing positions in Table 1. Figure 1 shows the observed four off-center positions overlaid on the velocity-integrated flux (moment 0) map of HCN (Salas et al. 2014), where positions 1 and 2 are located on the southwestern side of M82 while positions 4 and 5 are located on the northeastern side (Aladro et al. 2011a).
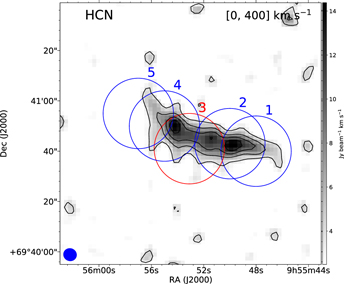
Figure 1. Velocity-integrated intensity (moment 0) maps of HCN J = 1 → 0 emission from Salas et al. (2014) using CARMA. The synthesis beam of CARMA data has an FWHM of ∼6'', which is shown in the lower left corner. IRAM 30 m beam (29'') coverage is shown in blue (off-center) and red (central position; Li et al. 2020) circles. The contours range from 3σ to 6σ, with a 1σ level of 2.5 K km s−1.
Download figure:
Standard image High-resolution imageTable 1. Observed Positions along the Major Axis of M82
| Position | R.A. | Decl. | RGC |
|---|---|---|---|
| (J2000) | (J2000) | (kpc) | |
| 1 | 09:55:48 | 69:40:40 | 0.45 |
| 2 | 09:55:50 | 69:40:43 | 0.28 |
| 3 (center) | 09:55:53.1 | 69:40:41 | 0 |
| 4 | 09:55:55 | 69:40:50 | 0.23 |
| 5 | 09:55:57 | 69:40:55 | 0.42 |
Note. Positions 1 and 2 are located in the SW lobe, and positions 4 and 5 in the NE lobe. RGC is the distance from the galactic centre.
Download table as: ASCIITypeset image
The Eight Mixer Receiver (EMIR) with dual polarization and the Fourier Transform Spectrometers (FTS) backend with an 8 GHz frequency coverage for each band and a 195 kHz spectral resolution were used. EMIR was configured to the mutual observing mode for both E-90 (at 3 mm) and E-150 (at 2 mm) receivers. To verify that the signal is from the sky frequency rather than radio-frequency interference (RFI) from the Earth or from the backend, two different local oscillator (LO) tuning setups were used during the observations (see Table 2).
Table 2. The Basic Properties of These Five Positions
| Position | Observing Dates | ton source |

|

| LO (3 mm) | LO (2 mm) a |
|---|---|---|---|---|---|---|
| YYYY-MMM-DD | (min) | (K) | (K) | (GHz) | (GHz) | |
| Position 1 | 2019-Feb-06 | 47 | 83 | 120 | 86.34 | 146.97 |
| 2019-Feb-07 | 20 | 93 | 130 | 86.29 | 146.92 | |
| 2019-Feb-10 | 48 | 110 | ⋯ | 86.15 | ⋯ | |
| Position 2 | 2019-Feb-06 | 26 | 93 | 120 | 86.34 | 146.97 |
| 2019-Feb-07 | 25 | 94 | 127 | 86.29 | 146.92 | |
| 2019-Feb-08 | 39 | 105 | ⋯ | 86.24 | ⋯ | |
| 2019-Feb-09 | 26 | 106 | ⋯ | 86.19 | ⋯ | |
| Position 4 | 2019-Feb-06 | 22 | 96 | 134 | 86.34 | 146.97 |
| 2019-Feb-07 | 25 | 90 | 121 | 86.29 | 146.92 | |
| 2019-Feb-08 | 45 | 109 | ⋯ | 86.24 | ⋯ | |
| 2019-Feb-09 | 26 | 104 | ⋯ | 86.19 | ⋯ | |
| Position 5 | 2019-Feb-06 | 16 | 101 | 142 | 86.34 | 146.97 |
| 2019-Feb-07 | 35 | 92 | 125 | 86.29 | 146.92 | |
| 2019-Feb-10 | 38 | 116 | ⋯ | 86.15 | ⋯ |
Note.
a Tuning frequencies of the local oscillator during the observations.Download table as: ASCIITypeset image
All observations were performed with the wobbler switching mode, which has a beam throw distance of ±60'' and a switching frequency of 0.5 Hz. Telescope pointing was checked every two hours with nearby strong quasi-stellar objects, while focus was checked at the beginning of each observation.
The beam sizes of the IRAM 30 m telescope are approximately 29'' and 16'' at 87 GHz and 145 GHz, respectively. Typical system temperature are ≤100 K and ∼120 K at 3 and 2 mm bands, respectively. The antenna temperature ( ) is converted to the main beam temperature (Tmb) using
  , where the forward efficiencies (Feff) are 0.95 and 0.93 and the beam efficiencies (Beff) are 0.81 and 0.74 at 3 and 2 mm bands, respectively. Each spectrum was read out every 2 minutes. The on-source time ranges from 3.5 to 4 hours toward each position.
We adopt GILDAS/CLASS 8 (Pety 2005, GILDAS Team 2013) to reduce all spectral data in the following order: First, we check all spectra by eye and remove questionable ones. Second, for each position we average all reliable spectra into one spectrum. We then fit a first-order polynomial baseline and subtract it from the averaged spectrum. Last, the baseline-subtracted spectra are smoothed to a velocity resolution of ∼35 km s−1.
3. Results
From the calibrated spectral data, we identify different transitions at each pointing position according to their rest frequencies, which are listed in Table 3. Figures 2–4 present spectra of H13CN J = 1−0, HC15N J = 1−0, H13CO+ J = 1−0, HN13C J = 1−0, H15NC J = 1−0, and HC3N J = 10–9 covered by the 3 mm band, while H2CO J = 2–1 is covered by the 2 mm band. The intensities of all spectra are plotted on the Tmb scale. For comparison, spectra of the major isotopologues of HCN J = 1−0, HCO+ J = 1−0, or HNC J = 1−0 are overlaid.
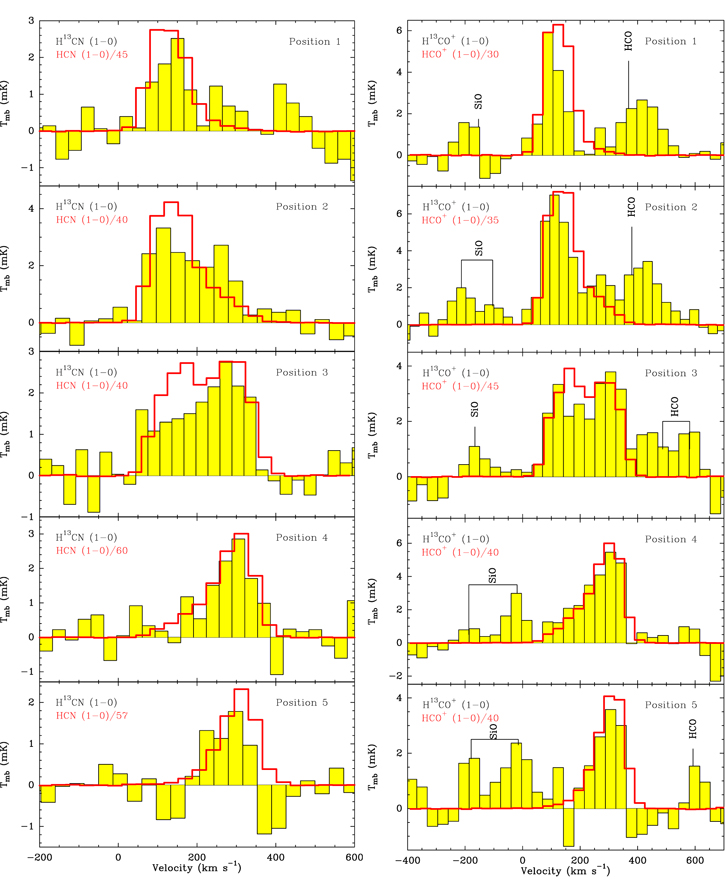
Figure 2. H13CN J = 1−0 (left) and H13CO+ J = 1−0 (right) spectra (black histograms filled in yellow) measured at five positions along the major axis of M82. The HCN and HCO+ J = 1−0 spectra are overlaid as red lines, after being normalized to roughly the same peak intensities as the isotopic lines. The velocity resolution is ∼35 km s−1 for all spectra. The right panel has a slightly larger velocity range to present the SiO and HCO spectra.
Download figure:
Standard image High-resolution imageTable 3. Integrated Intensities at All Positions
| I (K km s−1) | |||||||||
|---|---|---|---|---|---|---|---|---|---|
| Line | νrest | Position 1 | Position 2 | Position 3 | Position 4 | Position 5 | |||
| (GHz) | Blueshifted | Blueshifted | Redshifted | Blueshifted | Redshifted | Blueshifted | Redshifted | Redshifted | |
| HC15N 1–0 | 86.055 | 0.08 ± 0.025 | 0.29 ± 0.04 | <0.11 | 0.29 ± 0.02 | 0.24 ± 0.02 | ⋯ | <0.08 | <0.08 |
| H13CN 1–0 | 86.340 | 0.23 ± 0.05 | 0.38 ± 0.04 | 0.27 ± 0.04 | 0.21 ± 0.04 | 0.33 ± 0.04 | <0.15 | 0.30 ± 0.05 | 0.14 ± 0.02 |
| SiO 2–1 | 86.847 | <0.20 | <0.12 | ⋯ | 0.17 ± 0.04 | 0.25 ± 0.04 | ⋯ | 0.25 ± 0.07 | 0.29 ± 0.07 |
| H13CO+ 1–0 | 86.754 | 0.53 ± 0.07 | 0.80 ± 0.04 | 0.12 | 0.50 ± 0.04 | 0.71 ± 0.04 | 0.26 ± 0.07 | 0.68 ± 0.07 | 0.36 ± 0.07 |
| HCO 1–0 | 86.670 | 0.45 ± 0.07 | 0.46 ± 0.04 | ⋯ | 0.27 ± 0.04 | 0.34 ± 0.04 | ⋯ | ⋯ | <0.20 |
| HN13C 1–0 | 87.091 | <0.10 | <0.12 | ⋯ | <0.08 | 0.13 ± 0.03 | ⋯ | 0.15 ± 0.05 | 0.16 ± 0.05 |
| HCN 1–0 | 88.632 | 14.46 ± 0.26 | 19.63 ± 0.04 | 6.04 ± 0.04 | 11.57 ± 0.04 | 15.47 ± 0.04 | 3.71 ± 0.03 | 21.09 ± 0.03 | 14.26 ± 0.06 |
| H15NC 1–0 | 88.866 | <0.09 | <0.12 | ⋯ | ⋯ | <0.15 | ⋯ | <0.10 | <0.18 |
| HCO+ 1–0 | 89.189 | 22.29 ± 0.04 | 30.23 ± 0.04 | 8.14 ± 0.04 | 18.16 ± 0.05 | 22.64 ± 0.05 | 6.18 ± 0.04 | 29.89 ± 0.04 | 19.69 ± 0.05 |
| HNC 1–0 | 90.663 | 6.60 ± 0.03 | 9.67 ± 0.05 | 2.45 ± 0.05 | 6.00 ± 0.05 | 7.13 ± 0.05 | 1.74 ± 0.03 | 9.68 ± 0.03 | 5.82 ± 0.05 |
| HC3N 10–9 | 90.979 | 0.64 ± 0.03 | 1.19 ± 0.04 | 0.40 ± 0.04 | 0.65 ± 0.03 | 1.06 ± 0.03 | 0.11 ± 0.03 | 1.14 ± 0.03 | 0.61 ± 0.04 |
| H2CO 2−1 | 145.603 | 1.73 ± 0.06 | 2.86 ± 0.08 | ⋯ | 0.67 ± 0.07 | 2.35 ± 0.07 | 0.17 ± 0.05 | 3.22 ± 0.05 | 1.40 ± 0.06 |
Note. Velocity-integrated intensities are calculated with fixed velocity ranges of 0–200 km s−1 and 200–400 km s−1 for the blueshifted and redshifted components, respectively. Errors on the velocity-integrated intensities are calculated with Σ(I) =  , where
  is the rms noise level obtained from the line-free channels at the corresponding velocity resolution, δv is the velocity resolution (36 km s−1), and ΔV is the line width (200 km s−1).
Download table as: ASCIITypeset image
Most spectra, especially those from main isotopologues, at position 3 (hereafter P3; the central position) show two velocity components, which has also been seen in Salas et al. (2014) and Li et al. (2020). Only a single velocity component can be identified from the line profiles at all four off-center positions. Among them, positions 1 and 2 (hereafter P1 and P2; on the southwest side) are dominated by the blueshifted velocity component, while positions 4 and 5 (hereafter P4 and P5; on the northeast side) are dominated by the redshifted velocity component.
3.1. Detected Lines
As shown in Li et al. (2020), the spectra at P3 can be fitted with two-component Gaussian profiles. However, the velocity difference between the two components may not be the same at all five positions, and the outcome of the two-component Gaussian fitting strongly depends on the data quality. Therefore, we calculate the velocity-integrated intensities of all molecular lines in two fixed velocity ranges, i.e., 0–200 km s−1 and 200–400 km s−1, for the blueshifted and the redshifted components, respectively. Table 3 presents the velocity-integrated intensities at all positions. For P1 and P5, only the major velocity component is considered, because of the weakness of the minor component. Although some lines show emission line features on ∼2σ levels, we only adopt 3σ at their upper limits. In the following, we present properties of each isotopologue line.
- 1.H13CN J = 1 → 0, HN13C J = 1 → 0, and H15NC J = 1 → 0. We present the line profile of H13CN J =1−0 in the left panel of Figure 2. H13CN J = 1 → 0 is detected at all five positions. Two velocity components are detected at the three central positions, P2, P3, and P4. At P4, the blueshifted component shows only a weak feature at ∼2σ level. Therefore, we present 3σ upper limits for it in Table 3. HN13C J = 1−0 is detected at P3, P4, and P5, as shown in the middle panel of Figure 3. The northeast (NE) side shows stronger HN13C emission than the southwest (SW) side. H15NC J = 1−0 is not detected at any position, which is shown in the right panel of Figure 3. So, we show 3σ upper limits of the velocity-integrated intensities in Table 3.
- 2.HC15N J = 1 → 0. We present the line profile of HC15N J = 1−0 in the left panel of Figure 3. HC15N J = 1 → 0 is blended with SO J = 2–1, with only a 200 km s−1 offset in velocity. This line blending effect is mostly severe at P3, where the SO J = 2–1 peak is at the same level as HC15N J = 1 → 0 (see Figure 3). At all four other positions, however, HC15N J = 1−0 emission seems not to be heavily polluted by the SO J = 2–1 emission, possibly because the SO emission is only enhanced in the central shocked region (Pineau des Forets et al. 1993; Aladro et al. 2011a). Therefore, we use the HCN line profile at P3 as a template and fit the SO profile at the same position, then remove the fitted SO contribution. We then use the residual to derive the integrated intensity of HC15N at P3. For P4 and P5, we estimate 3σ upper limits for the velocity-integrated intensities. Compared with the spatial variation of H13NC J = 1−0, HC15N J = 1 → 0 show a contrary trend along the major axis.
- 3.H13CO+ J = 1 → 0, HCO J = 1 → 0 and SiO J = 2 → 1. As shown in the right panel of Figure 2, H13CO+ J =1−0 is detected at all five positions. HCO J = 1−0 and H13CO+ J = 1−0 have a velocity offset of 294 km s−1, therefore they show a weak blending at P2 and P3. The HCO J = 1−0 line is well detected on the SW side, while on the NE side it was only marginally detected at P5. SiO J = 2–1 seems not to be blended with H13CO+ J = 1−0. SiO J = 2–1 is stronger on the NE side than on the SW side, where we only obtain 3σ upper limits at P1 and P2. This asymmetric distribution of SiO indicates a fast shock on the NE side, possibly driven by outflow (Gibb & Hoare 2007; Gusdorf et al. 2008; López-Sepulcre et al. 2011).
- 4.HC3N J = 10 → 9. We present the line profile of HC3N J = 10–9 in the left panel of Figure 4. Being optically thin in most galactic environments (Morris et al. 1976), HC3N 10–9 is detected at all positions. This line is stronger than the isotopologue lines of other dense-gas tracers at the same position. The line profile of HC3N is similar to that of HCN J = 1 → 0 at each position. The velocity-integrated intensity of HC3N J = 10–9 at P2 is consistent with that reported by Aladro et al. (2015).
- 5.H2CO J = 2(0, 2)–1(0, 1). We present the line profile of H2CO J = 2(0, 2)–1(0, 1) in the middle panel of Figure 4. Most of the emission feature around 145.603 GHz seems to be from H2CO J = 2(0, 2)–1(0, 1), whose frequency fits the line profile very well. However, HC3N J = 16–15 might also contribute part of the flux to the redshift emission feature.
- 6.HCN, HCO+, and HNC J = 1−0. HCN, HCO+, and HNC J = 1−0 are all detected with high signal-to-noise levels at all five positions. Their line profiles agree well with each other at the same positions (see Figure 4). All these lines show double-peak profiles at the central position, which is not always seen in those weak isotopologue lines.
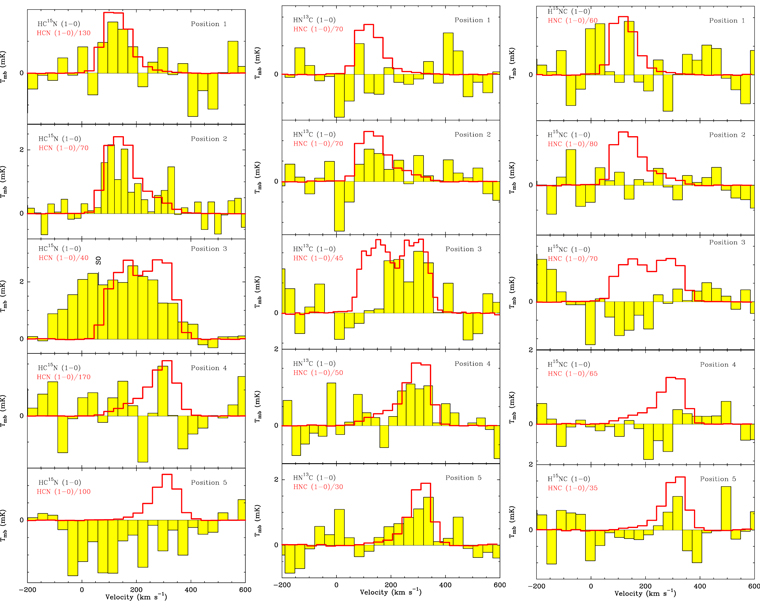
Figure 3. HC15N J = 1−0 (left), HN13C J = 1−0 (middle), and H15NC J = 1−0 (right) spectra (black histograms filled in yellow) measured at five positions along the major axis of M82. The HCN and HNC J = 1−0 spectra are overlaid as red lines, after being normalized to roughly the same peak intensities as the isotopic lines. The velocity resolution is ∼35 km s−1 for all spectra.
Download figure:
Standard image High-resolution image
Figure 4. HC3N J = 10–9 (left) and H2CO 2−1 (middle) spectra, shown as black histograms filled in yellow, measured at five positions along the major axis of M82. The HCN, HCO+, and HNC J = 1−0 spectra are overlaid with black, red, and blue lines, respectively. They are normalized to roughly the same peak intensities. The velocity resolution is ∼35 km s−1 for all spectra.
Download figure:
Standard image High-resolution image3.2. Line Intensity Ratios
With all measured velocity-integrated intensities, we obtained line intensity ratios between the main and rare isotopologue lines of HCN, HCO+, and HNC at each position, and we list the results in Table 4. At the central position (P3), we calculated ratios obtained from three velocity-integrated intensities, i.e., blueshifted, redshifted, and total velocity components of these lines.
Table 4. Intensity Ratios of the Isotopologues of HCN, HNC, and HCO+
| Position |

|

|

|

|

|

|

|
|---|---|---|---|---|---|---|---|
| J = 1−0 | 1–0 | 1–0 | 1–0 | 1–0 | 1–0 | 1–0/10–9 | |
| 1 | 63 ± 14 | 180 ± 68 | 42 ± 6 | >66 | 2.89 ± 1.25 | 2.30 ± 1.25 | 0.36 ± 0.08 |
| 2 | 52 ± 5 | 68 ± 9 | 38 ± 2 | >81 | 1.31 ± 0.23 | 2.10 ± 0.23 | 0.32 ± 0.04 |
| 3 a | 55 ± 11 | 40 ± 3 | 36 ± 3 | >75 | 0.72 ± 0.15 | 2.38 ± 0.15 | 0.32 ± 0.06 |
| 3 b | 46 ± 6 | 64 ± 5 | 32 ± 2 | 55 ± 13 | 1.37 ± 0.20 | 2.15 ± 0.20 | 0.31 ± 0.04 |
| 3total | 51 ± 6 | 52 ± 3 | 34 ± 2 | >65 | 1.02 ± 0.13 | 2.24 ± 0.13 | 0.32 ± 0.02 |
| 4 | 70 ± 12 | >264 | 44 ± 5 | 65 ± 22 | >3.75 | 2.26 ± 0.44 | 0.26 ± 0.04 |
| 5 | 101 ± 15 | >178 | 55 ± 11 | 36 ± 11 | >1.75 | 2.57 ± 0.62 | 0.23 ± 0.04 |
Notes. To keep uniformity, we only calculate the intensity ratio of one velocity component.
a The ratios of the blueshifted emission are estimated for positions 1 and 2. b For positions 3, 4, and 5, the redshifted emission is used to calculate the ratios.Download table as: ASCIITypeset image
As shown in Table 4, the ratios I(H13CO+)/I(H13CN) and I(H13CN/I(HC3N) seem similar at all positions, with a variation of ∼20%–30%. However, most other intensity ratios show a significant spatial variation, which can reach a factor of 4–5 (see Figure 5). The spatial variations of the ratios I(HCN)/I(H13CN), I(HCO+)/I(H13CO+), and I(HCN)/I(HC15N) follow a similar trend, with higher values on the NE side than on the SW side. These ratios in the central region are lower than those on the disk. These trends are consistent with what has been found in I(12CO)/I(13CO) J = 1−0 (Kikumoto et al. 1998). However, the I(HNC)/I(HN13C) intensity ratios show an opposite trend along the major axis to the others.

Figure 5. Isotopic ratios as a function of position. These isotopic ratios are I(HCN)/I(H13CN), I(HCN)/I(HC15N), I(HCO+)/I(H13CO+), and I(HNC)/I(HN13C).
Download figure:
Standard image High-resolution image3.3. Optical Depths of the Main Isotopologue Lines
Under the assumptions of local thermal equilibrium, uniform gas excitation, and constant isotopic abundance ratios, and neglecting radiative transfer by the cosmic microwave background, we can derive optical depths of the main isotopic lines. We adopt the same method as reported in Li et al. (2020), in which the line ratio R and the optical depth for a specific isotopologue line τ are related as  .
.
Due to the large uncertainty on the absolute abundance ratio of isotopes in external galaxies, we adopt various 12C/13C and 14N/15N abundance ratios reported in the literature: 12C/13C = 89 (the solar system, Clayton & Nittler 2004) and 200 (ultraluminous infrared galaxies, or ULIRGs, Romano et al. 2017), and 14N/15N = 100 (nearby starburst galaxies, Chin et al. 1999), 200 (Galactic massive star-forming regions, Li et al. 2017), and 290 (the solar neighborhood at Rgc ∼ 7.9 kpc, Adande & Ziurys 2012). Table 5 shows the derived optical depths of HCN, HCO+, and HNC J = 1 → 0.
Table 5. Optical Depths for HCN, HNC, and HCO+
| Position | τ(HCN) a (1–0) | τ(HNC) b (1–0) | τ(HCO+) c (1–0) | τ(HCN) d (1–0) | |||||
|---|---|---|---|---|---|---|---|---|---|
| 89 e | 200 e | 89 | 200 | 89 | 200 | 100 f | 200 f | 290 f | |
| 1 | 0.75 ± 0.52 | 3.05 ± 0.82 | <0.64 | <2.88 | 1.78 ± 0.38 | 4.78 ± 0.68 | ⋯ | 0.22 ± 0.01 | 1.05 ± 0.13 |
| 2 | 1.21 ± 0.27 | 3.79 ± 0.44 | <0.19 | <2.21 | 2.07 ± 0.15 | 5.31 ± 0.28 | 0.84 ± 0.39 | 2.77 ± 2.18 | 4.23 ± 1.40 |
| 3a | 1.07 ± 0.48 | 3.57 ± 0.79 | <0.36 | <2.45 | 2.24 ± 0.26 | 5.61 ± 0.75 | 2.27 ± 1.40 | 5.03 ± 3.10 | 7.34 ± 2.28 |
| 3b | 1.52 ± 0.34 | 4.34 ± 0.58 | 1.07 ± 0.02 | 3.57 ± 0.03 | 2.62 ± 0.18 | 6.34 ± 0.56 | 0.98 ± 0.45 | 2.99 ± 2.27 | 4.51 ± 1.50 |
| 3total | 1.26 ± 0.19 | 3.88 ± 0.47 | <0.75 | <3.05 | 2.41 ± 0.15 | 5.95 ± 0.31 | 1.51 ± 1.21 | 3.80 ± 2.61 | 5.61 ± 1.82 |
| 4 | 0.51 ± 0.38 | 2.68 ± 0.58 | 0.67 ± 0.81 | 2.93 ± 1.3 | 1.65 ± 0.28 | 4.55 ± 0.5 | ⋯ | ⋯ | <0.19 |
| 5 | ⋯ | 1.58 ± 0.40 | 2.24 ± 0.03 | 5.61 ± 0.05 | 1.07 ± 0.49 | 3.57 ± 0.8 | ⋯ | <0.24 | <1.07 |
| Mean | 1.11 ± 1.51 | 3.64 ± 2.64 | <0.75 | <3.05 | 1.78 ± 0.98 | 4.78 ± 1.79 | <1.11 | <0.9 | <2.12 |
| Whole | 1.16 ± 0.15 | 3.72 ± 0.24 | <0.64 | <2.88 | 1.92 ± 0.11 | 4.03 ± 0.21 | <1.87 | <1.9 | <3.05 |
Notes.
a The optical depth of HCN is calculated from the ratio of HCN/H13CN. b The optical depth of HNC J = 1−0 is calculated from the ratio of HNC/HN13C J = 1−0. c The optical depth of HCO+ 1–0 is calculated from the ratio of HCO+/H13CO+ 1–0. d The optical depth of HCN is calculated from the ratio of HCN/HC15N. e Abundance ratios of 12C/13C: 89 (solar system, Clayton & Nittler 2004) and 200 (ULIRGs, Romano et al. 2017). f Abundance ratios of 14N/15N: 100 (nearby starburst galaxies, Chin et al. 1999), 200 (Galactic massive star-forming regions, Li et al. 2017), and 290 (local interstellar medium, Adande & Ziurys 2012).Download table as: ASCIITypeset image
The optical depths of HCN J = 1−0 and HCO+
J = 1−0 only have a slight variation along the major axis of M82, with higher optical depths in the central region than on the two sides of the disk. The observed I(HCN)/I(H13CN) J = 1−0 line ratio could exceed the assumed 12C/13C abundance ratio occasionally, meaning that the actual 12C/13C ratio should be even higher. Therefore, the optical depths calculated with 12C/13C = 89 are the lower limits, making  at most positions. This also applies to
  calculated with the assumptions of various 14N/15N abundance ratios. Due to limited sensitivity, we can only obtain optical depths of HNC J = 1−0 at three positions.
3.4. Constraints on 12C/13C and 14N/15N Abundance Ratios
To obtain optical depths accurately, one should also consider the possible radial gradient of the 12C/13C abundance ratio, which increases radially in our Milky Way. This is currently not possible due to the lack of abundance measurements. However, our newly measured line ratios between the isotopologues can still be used to set tight constraints on the abundance ratios. The observed HCN/H13CN line ratio reaches 101 ± 15, which is higher than the 12C/13C abundance ratio in the solar neighborhood (∼89). But it is consistent with the values measured in the outer Galactic disk regions (Milam et al. 2005).
With the double isotope method (Adande & Ziurys 2012), the 14N/15N ratio can be calculated using the line ratio I(H13CN)/I(HC15N) and the 12C/13C abundance ratio, from 14N/15N = I(H13CN)/I(HC15N) × 12C/13C. Assuming 12C/13C = 89 on the SW side and at the center, average values of 14N/15N ratios are 186 ± 113 and 91 ± 11, respectively. On the other hand, on the NE side, adopting 12C/13C = 89, the lower limits of 14N/15N ratios range from 156 to 334.
4. Discussion
4.1. Comparison with Data in the Literature
Table 6 summarizes literature measurements of I(HCN)/I(H13CN) J = 1−0, I(HCO+)/I(H13CO+) J = 1−0, and I(HNC)/I(HN13C) J = 1−0 from nearby galaxies, including starburst galaxies, ULIRGs, and galaxies dominated by an active galactic nucleus (AGN). All these ratios in M82 are higher than those found in the literature, except for M83.
Table 6. Integrated Intensity Ratios from the Literature
| Galaxy |

|

|

| Type | Reference |
|---|---|---|---|---|---|
| 1–0 | 1–0 | 1–0 | |||
| NGC 3079 | 10 ± 5 | 7 ± 2 | >28 | SB/AGN | 1 |
| Mrk 231 | 16 ± 5 | 12 ± 5 | >7 | SB | 1 |
| NGC 4418 | 8 ± 3 | ⋯ | ⋯ | SB/AGN | 2 |
| NGC 1068 | 16 ± 1 | 20 ± 1 | 38 ± 6 | AGN | 3 |
| NGC 3351 | 21 ± 3 | >17 | ⋯ | SB(r)b | 4 |
| NGC 3627 | 7 ± 1 | >12 | ⋯ | SB/AGN | 4 |
| NGC 253 | 17 ± 1 | 24 ± 2 | ⋯ | SB | 4 |
| M83 | 41 ± 7 | 44 ± 13 | ⋯ | SAB(s)c | 5 |
| NGC 5194 | 27 ± 18 | 34 ± 29 | >16 | SB/AGN | 6 |
| M82 | (46 ± 6)−(101 ± 15) | (32 ± 2)−(55 ± 11) | (36 ± 11)−(65 ± 22) | SB | this work |
Notes.
References. (1) Li et al. (2020), (2) Costagliola et al. (2011), (3) Wang et al. (2014), (4) Jiménez-Donaire et al. (2017), (5) Aladro et al. (2015), (6) Watanabe et al. (2014), (7) Muller et al. (2011).
Download table as: ASCIITypeset image
Previous observations of dense-gas tracers have shown that they are mostly optically thick in both Galactic GMCs and external galaxies (Wang et al. 2014; Meier et al. 2015; Jiménez-Donaire et al. 2017; Li et al. 2017, 2020). If we assume that the abundance ratio of 12C/13C is 40, which is obtained as the average condition of nearby galaxies (Henkel et al. 1994, 2010), the HCN, HCO+, and HNC lines of M82 would be optically thin.
At all five positions in M82, ratios of I(H13CN)/I(H13CO+) J = 1−0 are lower than those of I(HCN)/I(HCO+) J = 1−0. Similar results for the J = 2–1 transition were also reported by Aladro et al. (2011a) at P2, where the I(H13CN)/I(H13CO+) J = 2–1 ratio is lower than I(HCN)/I(HCO+) J = 2–1. This indicates that HCN lines should have lower optical depths than HCO+ lines.
4.2. Optical Depths
Given the high intensity ratios of I(HCN)/I(H13CN) J = 1−0 in a range from 51 ± 6 to 101 ± 15 at all five positions, a 12C/13C abundance ratio of 40 (Henkel et al. 1998) cannot be valid. Kikumoto et al. (1998) and Tan et al. (2011) also found similar results, and they adopted a 12C/13C abundance ratio of 60. No matter which 12C/13C abundance ratio is adopted, 12C-bearing dense-gas tracer lines need to have at least moderate optical depths.
The optical depths of dense-gas tracers may be decreased by the feedback of supernova explosions in M82, which has been found in previous studies (Allen & Kronberg 1998; Mattila & Meikle 2001). Such supernova feedback strongly affects the molecular gas environments, which can be seen from strong SiO emission (see Figure 2), a high H2 1–0 S(1)/Brγ ratio, and a high ratio of I(12CO)/I(13CO) (Mouri et al. 1989; Lester et al. 1990). Therefore, the 12C-bearing molecular lines would be expected to be more optically thin, because the shock conditions could broaden the lines, which have an increased escape probability in radiative transfer. Such effects have been seen in Galactic supernova remnants that are interacting with molecular clouds (e.g., Zhang et al. 2010),
To mimic spatially unresolved galaxies, we further derive the weighted mean optical depths of dense-gas tracers in M82 by averaging optical depths over all positions, weighted with their line fluxes (see Table 5 marked as "Mean"). The unweighted mean optical depth, which was obtained directly from the total flux ratios, is also listed in the same table (marked as "Whole"). Both "Mean" and "Whole" optical depths agree well with those obtained on the disk, within the error bars. Thus, for galaxies without spatially resolved information, optical depths of dense-gas tracers obtained from a whole galaxy could generally represent average conditions on the disk.
4.3. The 12C/13C Abundance Ratio
The two isotopes of carbon, 12C and 13C, have different mechanisms of nucleosynthesis. The main isotope, 12C, could be partly produced by the triple-α reaction in massive stars (>8 M⊙, Wilson & Matteucci 1992; Nomoto et al. 2013), and partly by lower-mass stars. Therefore, 12C can increase quickly after the starburst starts, due to the short lifetime of massive stars. Most 13C, on the other hand, is formed in low- and intermediate-mass stars (<8 M⊙), which means that most 13C should be released to the interstellar medium (ISM) on much longer timescales than that of 12C (Wilson & Matteucci 1992; Hughes et al. 2008).
As a result, the 12C/13C abundance ratio could represent the star formation history (Wilson & Rood 1994; Henkel et al. 2010)—high ratios for long-term starbursts (a few hundred million years) and low ratios for young starbursts (tens of millions of years), before the low-mass stars start to release 13C.
Given the relatively short starburst timescale of M82 (∼5 × 10⁷ yr, Konstantopoulos et al. 2009), the majority of the newly born low-mass stars are still alive. So, the 12C/13C ratio can be enhanced in the central regions, where starburst is more intense than in the outer disk. Therefore, the current starbursts generate the trend of 12C/13C to decrease from the center to the outskirt along the major axis of M82.
However, the observed 12C/13C ratios are not only contributed by the current starburst event that has lasted for only ∼5 × 10⁷ yr, but also are produced and accumulated from the whole star formation history until now. A single episode of short starburst is not able to change the observed 12C/13C abundance ratios. Besides, Galactic chemical evolution models predict that the 12C/13C ratio would vary by a factor of two, even if a strong starburst were to produce half of the stellar mass in a secular evolving galaxy (Romano et al. 2017). Therefore, even if the current starburst could slightly enhance the 12C/13C abundance ratio on a short timescale in the central region, it would not change the increasing 12C/13C gradient in M82 from the center to the outskirts, similar to the Milky Way.
4.4. The 14N/15N Abundance Ratio
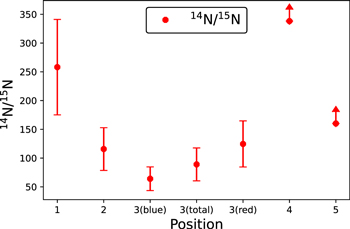
In external galaxies, the 14N/15N abundance ratio has been measured in a range from ∼100 to ∼450 (Henkel et al. 1998, 2018; Adande & Ziurys 2012; Wang et al. 2014, 2016 ). This ratio measured in two starbursts, NGC 4945 (∼200–400, Henkel et al. 2018) and ULIRG Arp 220 (440+140 −82, Wang et al. 2014), is higher than found in M82 (∼80–250, see Figure 6). In our Milky Way, the 14N/15N ratio is distributed in a large range (100–600, Li et al. 2017), with a possible positive gradient from the center to the outskirts (Chen et al. 2021).
Figure 6. The abundance ratio of 14N/15N as a function of position.
Download figure:
Standard image High-resolution image
Figure 6 shows estimated 14N/15N ratios as a function of galactocentric distance. If we adopt an assumption of a constant 12C/13C abundance ratio of 89, 14N/15N abundance ratios tend to increase with galactocentric distance, which is consistent with the 14N/15N gradient found in the Milky Way (Dahmen et al. 1995; Romano & Matteucci 2003; Adande & Ziurys 2012; Romano et al. 2017; Chen et al. 2021).
On the other hand, the 12C/13C abundance ratio shows an increasing gradient from the center to the outer disk in the Milky Way (Wilson & Rood 1994; Savage et al. 2002; Milam et al. 2005; Yan et al. 2019). If we adopt a similar positive 12C/13C abundance gradient in M82, which is consistent with the prediction in Section 4.3, the 14N/15N abundance ratio would show an even stronger gradient, with lower values in the center and higher values on the disk.
4.5. Astrochemical Effects
Selective photodissociation prefers to destroy 13C- and 15C-bearing molecules, which would increase 12C/13C and 14N/15N abundance ratios in high UV fields (Wilson & Matteucci 1992; Savage et al. 2002). However, the inner region of M82 has lower I(HCO+)/I(H13CO+) and I(HCN)/I(HC15N) line values, indicating that photodissociation does not play a key role.
Isotope fractionation, which could enhance H13CO+/HCO+ and HC15N/HCN ratios, is only effective at a very low temperature (Smith & Adams 1980; Woods & Willacy 2009; Röllig & Ossenkopf 2013; Loison et al. 2019). In M82, the temperature is relatively high, especially in the center. However, both I(HCO+)/I(H13CO+) and I(HCN)/I(HC15N) ratios increase in the off-center regions, meaning that the fractionation effect does not play a key role either.
5. Summary
In this paper we present results from IRAM 30 m telescope observations along the major axis of M82 in the 2 mm band and 3 mm band. Four positions are selected to measure the isotopic lines of HCN, HCO+, and HNC. The spatial distributions of these optically thin dense-gas tracers are obtained, including H13CN, H13CO+, HC15N, HN13C, and H15NC 1–0. A few other species—SiO J = 2–1, HCO J = 1−0, H2CO J = 2–1, and HC3N J = 10–9—are also detected. We obtain the following results.
- (1)H13CN J = 1−0, H13CO+ J = 1−0, HC3N J = 10–9, and H2CO J = 2–1 are detected at all four positions along the major axis of M82. Spectral lines of the transition HC15N J = 1−0 are not detected on the NE side and HN13C J = 1−0 emissions are not detected on the SW side. We did not obtain any detection of H15NC J = 1−0 at any position. For the tentative detection of the isotopic lines, the 3σ upper limits are presented.
- (2)For spectral line intensity ratios, I(HCN)/I(H13CN) J = 1−0, I(HCO+)/I(H13CO+) J = 1−0, and I(HCN)/I(HC15N) J = 1−0 show a large spatial variation along the major axis of M82, which is higher on the NE side than on the SW side, and the value in the central region is lower than that on the disk. However, the I(HNC)/I(HN13C) ratio seems to show an opposite trend along the major axis.
- (3)The optical depths of HCN J = 1−0 and HCO+ J = 1−0 only have a slight variation along the major axis of M82, with higher optical depth in the central region than on the two sides of the disk. Due to limited sensitivity, we can only obtain optical depths of HNC J = 1−0 at three positions, and thus we could not summarize any trend for its optical depth variation.
- (4)Our measured line ratios between the isotopologues set a lower limit for the abundance ratio of 12C/13C. Using the double isotope method and I(H13CN)/I(HC15N) ratio, the derived 14N/15N abundance ratios have an increasing gradient from the center to the outer disk.
This work is supported by the National Natural Science Foundation of China grant (12041305, 12173016, 12173067, and 12103024), and the fellowship of China Postdoctoral Science Foundation 2021M691531. We would like to thank P. Salas et al. for providing their data for Figure 1. We are grateful to the staff of IRAM 30 m telescope for their kind help and support during our observations. This study is based on observations carried out under project number 186-18 (PI: Feng Gao) with the IRAM 30 m telescope. IRAM is supported by INSU/CNRS (France), MPG (Germany), and IGN (Spain). We acknowledge the Program for Innovative Talents, Entrepreneur in Jiangsu. We acknowledge the science research grants from the China Manned Space Project with NO.CMS-CSST-2021-A08. This work also benefited from the International Space Science Institute (ISSI/ISSI-BJ) in Bern and Beijing, thanks to the funding of the team "Chemical abundances in the ISM: the litmus test of stellar IMF variations in galaxies across cosmic time" (Principal Investigators D.R. and Z-Y.Z.).
Appendix: Other Lines: SiO J = 2–1, HCO J = 1−0, H2CO J = 2–1, and HC3N J = 10–9
Apart from the isotopic lines, we also detected a few unique molecular lines, such as SiO J = 2 → 1, HCO J = 1 → 0, H2CO J = →1, and HC3N J = 10 → 9. These lines offer an excellent opportunity to reveal physical conditions of the ISM of M82.
A.1. SiO J = 2–1
SiO, as the shock tracer (Usero et al. 2006), is detected in both the central region and on the NE side, while only 3σ upper limits are obtained on the SW side. Such a result indicates that the shock on the NE side is stronger than that on the SW side. This is consistent with García-Burillo et al. (2001), who found extended off-nuclear SiO J = 2–1 emission on the NE side, indicating a strong molecular shock on large scales. On the other hand, Lester et al. (1990) and Mouri et al. (1989) found a higher ratio of H2 1–0 S(1)/Brγ on the NE side than on the SW side, consistent with the scenario that the NE shock is stronger. However, the line widths of HCN, HCO+, and HNC do not show obvious differences on both sides, indicating that the shocks may not heavily broaden the line width and influence the global properties of dense gas.
A.2. HCO J = 1−0
As shown in the right panel of Figure 2, HCO J = 1−0, as a good tracer of photodissociation regions (PDRs) (García-Burillo et al. 2002; Gerin et al. 2009; Martín et al. 2009), is stronger on the SW side than on the NE side. In addition, García-Burillo et al. (2002) also found a giant PDR of ∼650 pc size in M82 with HCO 1–0 mapping observations, using the IRAM Plateau de Bure Interferometer. The result suggests that the chemistry of the SW molecular side is dominated by the PDR, which shows typical features of an evolved starburst (Fuente et al. 2008; Aladro et al. 2011a).
A.3. H2CO J = 2–1
With a high critical density of 2.5 × 105 cm−3 (Shirley 2015), the H2CO J = 2–1 transition can also trace dense gas (Bayet et al. 2008), which traces the high-excitation component of the molecular gas in M82 very well (Mühle et al. 2007). The H2CO 2−1 emission on the SW side is stronger than that on the NE side, indicating higher excitation conditions on the SW side. Such a difference may be caused by the asymmetric outflow (Shopbell & Bland-Hawthorn 1998), which may also impact the NE disk (Seaquist & Clark 2001; Veilleux et al. 2009).
A.4. HC3N J = 10–9
As a tracer of warm and dense gas (Tanaka et al. 2018), HC3N can be easily destroyed by UV radiation and cosmic rays (Costagliola & Aalto 2010; Rico-Villas et al. 2020). Therefore, HC3N is mainly excited by collision. HC3N lines are bright enough to be detected in the local galaxies NGC 4418, NGC 253, IC 342, NGC 6240, and so on (Aladro et al. 2011b; Costagliola et al. 2011; Li et al. 2019). These detections all indicate that the optical depth of HC3N is very small (τ ≪ 1) in most cases, because it has many energy populations.
Assuming similar excitation temperature, the abundance ratio of I(H13CN)/I(HC3N) can be estimated from its intensity ratio. This ratio does not show a large variation among different positions, indicating that the distributions of H13CN and HC3N might be uniform along the major axis. The results also imply either that the HC3N emission is spatially separated from PDRs or that the PDRs might be weak, because UV photons from PDRs can dissociate HC3N.