


Abstract
We report the detection of class I methanol maser at the 36.2 GHz transition toward the nearby starburst galaxy Maffei 2 with the Karl G. Jansky Very Large Array. Observations of the 36.2 GHz transition at two epochs separated by ∼4 yr show consistencies in both the spatial distribution and flux density of the methanol emission in this transition. Similar to the detections in other nearby starbursts the class I methanol masers sites are offset by a few hundred pc from the center of the galaxy and appear to be associated with the bar edges of Maffei 2. Narrow spectral features with line widths of a few km s−1 are detected, supporting the hypothesis that they are masing. Compared to other nearby galaxies with the detections in the 36.2 GHz methanol maser transition, the maser detected in Maffei 2 has about an order of magnitude higher isotropic luminosity, and thus represents the first confirmed detection of class I methanol megamasers. The spatial distribution of the 36.2 GHz maser spot clusters may trace the rotational gas flow of the galactic bar, providing direct evidence that the class I methanol maser is related to shocks induced by galactic bar rotation. A tentative detection in the 6.7 GHz class II methanol maser (at a 5σ level) is also reported. This is comparable in luminosity to some of the 6.7 GHz maser sources detected in Galactic star-forming regions. The 6.7 GHz methanol emission appears to be associated with star formation activity in a smaller volume, rather than related to the larger-scale galactic activities.
Export citation and abstract BibTeX RIS

Original content from this work may be used under the terms of the Creative Commons Attribution 4.0 licence. Any further distribution of this work must maintain attribution to the author(s) and the title of the work, journal citation and DOI.
1. Introduction
Methanol masers are an important probe of star-forming regions and are very common in our Galaxy (more than 1000 sites found to date; e.g., Green et al. 2009; Chen et al. 2011, 2014; Yang et al. 2017, 2019). Methanol has a rich microwave spectrum and more than 40 different methanol transitions have been observed to show maser emission (Cragg et al. 2005; Breen et al. 2019; Brogan et al. 2019). The methanol maser transitions are empirically divided into two classes, known as class I and class II (Menten 1991). For Class II masers, infrared radiation is required (e.g., Sobolev et al. 1997; Cragg et al. 2005), hence they are found close to (within 1'' of) high-mass protostars (Ellingsen 2006; Caswell et al. 2010). Class I methanol masers are collisionally pumped (Cragg et al. 1992; Leurini et al. 2016), and are commonly distributed over much larger spatial scales (0.1–1 pc) around the exciting sources (e.g., Kurtz et al. 2004; Cyganowski et al. 2009; McCarthy et al. 2018b). The locations showing class I maser emission are associated with mild shocks driven into molecular clouds by high- or low-mass protostar outflows or expanding H ii regions (e.g., Voronkov et al. 2010; Chen et al. 2011). In addition, the class I methanol masers can also occur in larger-scale regions, such as supernova remnants (Pihlström et al. 2011, 2014) and the Galactic center (Yusef-Zadeh et al.2013).
Although a number of surveys for methanol masers in external galaxies have been made (e.g., Norris et al. 1987; Ellingsen et al. 1994; Phillips et al. 1998; Darling et al. 2003; Green et al. 2008; Sjouwerman et al. 2010; Chen et al. 2016; McCarthy et al. 2020), in contrast to the abundant methanol masers in our Galaxy, only two galaxies in Local Group, the Large Magellanic Cloud (LMC) and M31, have detected methanol maser emission from the 51 → 60 A+ (6.7 GHz) or 20 → 3−1 E 12.2 GHz class II transitions associated with star-forming regions therein (Green et al. 2008; Ellingsen et al. 2010; Sjouwerman et al. 2010). And only four galaxies NGC 253, NGC 4945, NGC 6946, and IC 342 have confirmed detections in the 4−1 → 30 E (36.2 GHz) class I methanol maser transition from interferometric measurements (Ellingsen et al. 2014; Gorski et al. 2017, 2018; McCarthy et al. 2017, 2018a; Chen et al. 2018). Arp 220 was suggested to have a tentative interferometric detection of a 36.2 GHz methanol megamaser (Chen et al. 2015), however, subsequent observations have not been able to confirm this. In addition, one galaxy, Maffei 2 has a reported 36.2 GHz maser candidate from single-dish observations (Humire et al. 2020). In addition to the 36.2 GHz transition, the 44 and 84.5 GHz class I transitions have been detected in NGC 253 (Ellingsen et al. 2017; McCarthy et al. 2018a). At present the mechanism for the production of extragalactic class I methanol masers is still a matter of debate. Chen et al. (2015, 2016) suggest that the shocked gas produced by galactic outflows may play an important role in the maser excitation. However, in NGC 253, Ellingsen et al. (2017) point out that the class I masers are excited at locations associated with the galactic bar shocks. Detections of additional sources and multiple transitions are necessary to investigate the origin of methanol masers in external galaxies. In this paper, we report the detection of both class I (36.2 GHz) and class II (6.7 GHz) methanol maser emission toward the nearby starburst galaxy (Maffei 2), which is located at a distance of 5.7 Mpc (Anand et al. 2019).
2. Observation and Data Reduction
The observations of the 4−1 → 30 E class I transition of methanol (rest frequency 36.169265 GHz) toward Maffei 2 were made at two epochs (2015 October 31 and 2019 November 24) with the Very Large Array (VLA) in the D-array configuration. One 128 MHz band with 4096 channels and one 64 MHz band with 512 channels were used to cover the 36.2 GHz methanol transition, corresponding to channel widths of ∼0.25 km s−1 and ∼1 km s−1 for the first and second epoch observations, respectively. Frequent observations of the quasars J0244+6228 and J0228+6721 were used to calibrate the time-dependent antenna gains for each epoch of observations. 3C84 and 3C147 were observed to calibrate the bandpass response and flux density for the first and second epoch observations, respectively. A total on-source time of ∼10 minutes and ∼1 hr for Maffei 2 was achieved for the first and second epochs.
The VLA observations of the 51 → 60 A+ class II methanol transition (6.6675192 GHz) toward Maffei 2 were performed with the VLA in the B-array configuration. Four block observations each of two hours were made on 2017 December 31 and 2018 January 3, 4, and 7. We combined the data from the four blocks of observations to produce the final image. A total on-source time of ∼5 hr was achieved for the 6.7 GHz methanol transition. The 6.7 GHz methanol line was recorded using a 32 MHz band, with 2048 spectral channels (corresponding to a channel spacing of 15.625 KHz, or a velocity spacing of 0.7 km s−1 at 6.7 GHz). The time-dependent antenna gains were calibrated with frequent observations of the quasar J0306+6243. 3C48 was observed as the amplitude and bandpass calibrator.
The standard VLA Calibration Pipeline with the Common Astronomy Software Applications package was used to reduce the visibility data of the three VLA observations. The imaging analysis was carried out in miriad. Self-calibration of the data using continuum emission from Maffei 2 was undertaken prior to continuum subtraction. The resulting synthesized beam sizes were 3 42 × 232 (with a position angle of 67
 6 northwest) and 398 × 208 (with a position angle of − 788 northwest) for the VLA D-array observations of the 36.2 GHz transition at the first and second epochs, respectively. A beam with a size of 131 × 129 was achieved for the VLA B-array observations of the 6.7 GHz transition. The typical rms noise in a single spectral channel was 8 mJy beam−1 (31.25 kHz channel width) and 2 mJy beam−1 (125 kHz channel width) for the 36.2 GHz transition observations in the first and second epochs, respectively, and was 0.33 mJy beam−1 (15.625 KHz channel width) for the 6.7 GHz observations. In order to optimize the signal-to-noise ratio (S/N) for the detection of narrow line features, we imaged both the 36.2 and 6.7 GHz methanol line data at a range of different spectral resolutions (see Section 3).
3. Results
3.1. 36.2 GHz Class I Methanol Transition Detections
Figure 1 (center panel) shows the overall distribution of the detected 36.2 GHz methanol and continuum emission in the central regions of Maffei 2 from the VLA D-array observations. The 36.2 GHz methanol line data were imaged at a spectral resolution of ∼0.5 km s−1 (i.e., combining two adjacent spectral channels) for the first epoch and at a spectral resolution of ∼1 km s−1 (i.e., without smoothing the spectral channels) for the second epoch. The continuum emission was estimated by combining the line-free channels across three 128 MHz bands covering the frequency range 36.4–36.8 GHz in the second epoch observations. The continuum emission has a peak flux density of ∼4.5 mJy beam−1 and traces the center of the galactic bar of Maffei 2. For comparison, we present the large-scale structure (2') of Maffei 2 traced by the infrared WISE three-color image in the left panel of Figure 1. No variation in the flux density nor structure of the continuum emission was detected between the two epochs.

Figure 1. The 36.2 GHz class I methanol maser emission detected in Maffei 2 from the VLA D-array observations at two epochs. Left panel: the large-scale galaxy structure traced by the three-color WISE image composite with 12.0 μm in red, 4.6 μm in green, and 3.4 μm in blue. The box represents the zoomed-in region shown in the middle panel. Middle panel: the integrated 36 GHz continuum emission (background; with a peak of 4.5 mJy beam−1), and the integrated methanol emission from the 36.2 GHz transition detected in epoch 1 (green contours) and epoch 2 (white contours). The contour levels for both epochs start at 0.06 Jy beam−1 km s−1 (corresponding to 3σ and 4σ for epochs 1 and 2, respectively), and have increments of 0.06 Jy beam−1 km s−1. The white cross and circle represent the targeted position and FWHM of the beam for the single-dish observations with the 100 m telescope at Effelsberg (see Humire et al. 2020). Right panel: the corresponding 36.2 GHz methanol spectra extracted from the four methanol peak positions for epoch 1 (black) and epoch 2 (red). (A color version of this figure is available in the online journal.)
Download figure:
Standard image High-resolution imageThe 36.2 GHz methanol emission detected at the two epochs shows a consistent spatial distribution. They are not detected toward the center of the galaxy, which is consistent with observations of the 36.2 GHz transition in other galaxies, e.g., NGC 253 (Ellingsen et al. 2014, 2017; Chen et al. 2018) and NGC 4945 (McCarthy et al. 2017, 2018a). The sites of methanol emission (>5σ) are concentrated toward four regions, which we have labeled A–D. The emission regions are observed to be offset by 5''–20'' from the galactic center as traced by the continuum emission, and closely associated with the bar edges in Maffei 2 that lie northeast (NE) to southwest (SW). These angular offsets correspond to linear projected separations of 140–550 pc at an assumed distance of 5.7 Mpc. The corresponding spectra at the peak position of each component detected at the two observation epochs are presented in the right panels of Figure 1. It can be clearly seen that the spectral profile and flux density of each component are nearly the same at the two epochs, with the exception of component B (which we discuss further in Section 4.3). The parameters of the four main methanol components are summarized in Table 1. The peak flux densities of the four main components range between 15 and 48 mJy beam−1. The integrated intensity of the observed methanol emission corresponds to isotropic luminosities of 0.3–0.6 L⊙.
Table 1. Summary of the Methanol Maser Components in Maffei 2 from the VLA Observations
| Arrasy | Label | α | δ | vLSR | vRange | P | S | L | Obs. Date |
|---|---|---|---|---|---|---|---|---|---|
| (J2000) | (J2000) | (km s−1) | (km s−1) | (mJy beam−1) | (mJy beam−1 km s−1) | (L⊙) | |||
| (1) | (2) | (3) | (4) | (5) | (6) | (7) | (8) | (9) | (10) |
| 36.2 GHz class I methanol | |||||||||
| JVLA D | A | 02:41:55.472 | 59:36:25.17 | −106.1 | −114.2–−98.7 | 47.8(5.1) | 366(29) | 0.45(0.04) | E1 |
| −106.0 | −112.8–−98.8 | 47.7(2.2) | 354(18) | 0.43(0.02) | E2 | ||||
| B | 02:41:55.199 | 59:36:21.94 | −105.6 | −120.6–−40.3 | 14.9(5.1) | 325(32) | 0.40(0.04) | E1 | |
| −89.4 | −129.8–−40.7 | 10.9(2.2) | 259(21) | 0.32(0.03) | E2 | ||||
| C | 02:41:54.905 | 59:36:10.13 | −8.2 | −33.6–17.2 | 26.4(5.1) | 413(25) | 0.51(0.03) | E1 | |
| −7.5 | −31.4–21.5 | 27.9(2.2) | 463(16) | 0.57(0.02) | E2 | ||||
| D | 02:41:53.851 | 59:35:58.20 | 22.4 | 5.3–52.9 | 26.8(5.1) | 454(25) | 0.56(0.03) | E1 | |
| 21.5 | 4.9–49.5 | 21.5(2.2) | 417(15) | 0.51(0.02) | E2 | ||||
| 6.7 GHz class II methanol | |||||||||
| JVLA B | E | 02:41:57.215 | 59:36:19.33 | −60 | −104.0–44.0 | 0.7 | 36(4) | 0.008(0.001) | E3 |
Note. Column (1): VLA array configurations; Column (2): the label for the main methanol components detected by the VLA observations; Columns (3) and (4): the location of the peak of each methanol component in R.A) and decl.; Columns (5)–(9): the LSR peak velocity vLSR, the velocity range vRange, the peak flux density P, the velocity integrated intensity S of each methanol component, and the corresponding isotropic luminosity of each component; Column (10): observing date, E1 (2015 October 31), E2 (2019 November 24), and E3 (a combination of data on 2017 December 31 and 2018 January 3, 4, and 7).
Download table as: ASCIITypeset image
The strongest emission from the 36.2 GHz methanol transition was detected toward component A, and it has a narrower line width with a velocity span of ∼15 km s−1. In contrast, the other three components have line width with velocity spans of 40–80 km s−1. Component A actually consists of two narrower spectral features with full width at half maximum (FWHM) of ∼3 km s−1 peaking at LSR velocities of −110 and −106 km s−1. We have used the LSR velocity frame to facilitate the comparison of our results with those reported by Humire et al. (2020) with the Effelsberg telescope. It should be noted that some narrow spectral features with FWHM line widths of a few km s−1 are also present toward the broader line profiles of components B, C, and D. Therefore these broad line profiles contain some contributions from a blend of narrower spectral features. These narrow line features suggest that the detected 36.2 GHz methanol emission in the central zone of Maffei 2 is due to maser emission. The broader line profiles for regions B, C, and D have FWHM of 37, 18, and 24 km s−1, respectively, determined from Gaussian fits to the components. However, even these are significantly narrower than the 55–70 km s−1 FWHM detected for thermal CH3OH (2–1) emission in the corresponding regions (labeled as components D, F, and G; Meier & Turner 2012). This provides further evidence supporting that the 36.2 GHz emission is due to masing.
3.2. 6.7 GHz Class II Methanol Transition Detection
Using the data collected during the VLA B-array observations, we imaged the line emission of the 6.7 GHz methanol transition at a velocity resolution of 4 km s−1. The integrated intensity map of the 6.7 GHz line in the LSR velocity range of −150–100 km s−1 is shown in the upper panel of Figure 2. It can be seen that the 6.7 GHz line emission is very weak, and represents only a tentative detection (∼5 σrms) of emission toward a single region (labeled E in Figure 2, upper panel). In the lower panel of Figure 2, we show the 6.7 GHz spectrum extracted toward the peak position of region E. The spectrum has a peak of 0.7 mJy beam−1 at an LSR velocity of ∼−60 km s−1. The spatial distribution of the detected 6.7 GHz methanol emission is significantly different from that of the 36.2 GHz transition and is mainly located in the region around the galactic bulge traced by the 2MASS data (shown as the background in Figure 2, upper panel). The 6.7 GHz emission is observed to be offset by ∼15'' from the galactic center, corresponding to a linear projected separation of ∼500 pc. While the 6.7 GHz spectrum shows a similar velocity range of −100 to 50 km s−1 to that of the 36.2 GHz transition, suggesting that the detection is consistent with the overall kinematics in this galaxy and thus is plausible. The measured luminosity of the 6.7 GHz transition is 0.01 L⊙, which is two orders of magnitude lower than that of the 36.2 GHz transition.
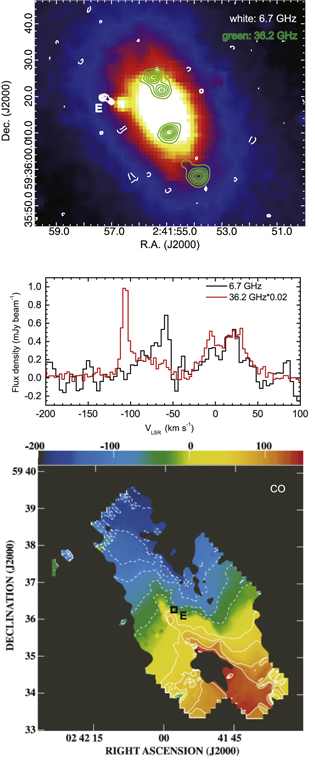
Figure 2. Tentative detection of the 6.7 GHz methanol maser emission in Maffei 2 from the VLA B-array observations. Upper panel: the integrated methanol emission from the 6.7 GHz transition with white contours (contour levels of −3, 3, 4, and 5σ; 1σ = 3 mJy beam−1 km s−1 ), overlaid on the background of 2MASS Ks-band image. As a comparison, the integrated 36.2 GHz methanol emission detected at epoch 2 is shown in green contours (with the same contour levels shown in Figure 1). Middle panel: the corresponding 6.7 GHz methanol spectrum (denoted by a black line) extracted toward the region E marked in the upper panel. The 36.2 GHz methanol spectrum formed from the sum over the four regions A–D is given (red line) as a comparison. Lower panel: the CO integrated intensity map with velocity field directly extracted from Figure 3 of Kuno et al. (2007) to enable comparison of velocities between CO and methanol emission toward region E (marked by black box). (A color version of this figure is available in the online journal.)
Download figure:
Standard image High-resolution image4. Discussion
4.1. Properties of the 36.2 GHz Methanol Maser
As illustrated in Figure 1, the 36.2 GHz methanol maser spectra detected from the four main components show a number of narrow spectral features (with a line width of a few km s−1), suggesting that they represent maser emission. To further investigate the characteristics of the emission we fitted a 2D Gaussian brightness distribution to the images from epoch 2, as these observations were significantly more sensitive. The miriad task IMFIT was to determine the position and flux density of the emission in each channel map. A flux density of 5 mJy beam−1 (corresponding to 2.5σ in the channel map) was adopted as a threshold to construct the maser spots. The spatial distributions of the detected 36.2 GHz methanol maser spots are shown in Figure 3 (upper-left panel). The corresponding peak flux density of each spot toward the four regions is given in the upper-right panel. The current observations only give a lower limit of brightness temperatures for these maser spots in the range of 1–8 K, which is far lower than that which has been measured in some sources with unambiguous maser emission (e.g., >1000 K detected in NGC 253 reported by Chen et al. 2018). The observed integrated intensities of the four methanol emission regions range from 50–70 K km s−1, factors of 3–10 higher than the combined emission from the four closely spaced thermal lines from the 96.7 GHz CH3OH (2–1) transition (5–25 K km s−1), detected toward the corresponding regions (C, D, F, and G; see Meier & Turner 2012). For optically thin, LTE conditions, the ratio of the integrated intensities of 36.2 GHz/only one main 96.7 GHz line (i.e., 2−1,2 − 1−1,1 E) can not exceed 0.8 under any excitation temperatures. In Maffei 2 we have ratios >3 for all four line intensities of the 96.7 GHz methanol transition, suggesting the measured ratios will be higher if we consider a single 2−1,2 − 1−1,1 E line. Therefore this provides further evidence that the emission in the 36.2 GHz transition in Maffei 2 is produced by masers.

Figure 3. Spatial distributions and flux density spectra of the 36.2 GHz methanol maser spots detected at epoch 2 (2019 November 24) with the VLA. Upper-left panel: the overall spatial distribution of the maser spots. Each maser spot is represented by a filled circle with an area proportional to the square of its flux density and with a color indicating its LSR velocity according to the color scale on the right-hand side of the plot. The color-coded background is the radial velocity field projected onto the sky plane as modeled from a rigid body rotation of the galactic plane. The 6.7 GHz maser region E is marked by a box with color indicating its velocity at a peak of −60 km s−1. Upper-right panel: the flux density spectra of maser spots determined from a 2D Gaussian brightness distribution fitting to the maser spots. Lower panels: Zoomed-in views of the spatial distributions of maser spots with their positional uncertainties toward the regions B, C, and D. Black curves describe rotation flow patterns due to galactic bar rotation, expected from the rotation model.
Download figure:
Standard image High-resolution imageConsidering the integrated intensity observed for the 36.2 GHz methanol emission detected in the second epoch of observations (see Table 1), the total isotropic luminosity of Maffei 2 in this transition is 1.8 L⊙ at a distance of 5.7 Mpc. From the interferometric measurements of integrated intensities of 0.62 and 0.26 Jy km s−1 for NGC 253 (at a distance of 3.4 Mpc; Ellingsen et al. 2014) and NGC 4945 (3.7 Mpc; McCarthy et al. 2017), we calculate their corresponding isotropic luminosities to be 0.27 L⊙ and 0.13 L⊙, respectively. Moreover, two additional more recent detections of 36.2 GHz methanol masers have a total luminosity of 0.22 L⊙ and 0.49 L⊙ in IC 342 and NGC 6946, respectively, reported by Gorski et al. (2018). Therefore, compared to the other four nearby galaxies (NGC 253, NCG 4945, IC 342, and NGC 6946), the 36.2 GHz methanol maser in Maffei 2 is between a half and one order of magnitude higher isotropic luminosity. The typical isotropic luminosity of 36.2 GHz methanol masers associated with high-mass star formation regions is 2 × 10⁻⁶ L⊙ (or 500 Jy km s−1 kpc2; see Voronkov et al. 2014; McCarthy et al. 2017). Hence the 36.2 GHz maser emission in Maffei 2 is approximately six orders of magnitude more luminous, and hence this represents a new detection of a class I methanol megamaser in the 36.2 transition, making it the first confirmed source with only a tentative detection in Arp 220. This luminosity is a factor of approximately 120 greater than the 36.2 GHz methanol emission of 0.015 L⊙ (calculated from an integrated intensity of 5600 Jy km s−1 at a distance of 8.5 kpc), which is observed in the central molecular zone of the Milky Way (Yusef-Zadeh et al. 2013). It should be noted that the above estimation is based on an assumed distance of 5.7 Mpc to Maffei 2 (which now appears to be favored in the literature). This is a factor of ∼2 larger than past estimates (e.g., 3.4–3.5 Mpc in Wu et al. 2014) and if we were to adopt this lesser distance, then the CH3OH maser luminosity would be 4 times lower than the above estimates, but still ∼2 times higher than that in NGC 253, IC 342, and NGC 4945, and similar to that in NGG 6946.
4.2. 36.2 GHz Methanol Maser Emission Associated with Galactic Bar Rotation
Zoomed-in views of the 36.2 GHz maser spot distributions (with their positional uncertainties) for the three regions B, C, and D are shown in the lower three panels of Figure 3. Only maser spots with flux density greater than 8 mJy beam−1 (i.e., >4σ) are shown in these zoomed-in views. Note that the distributions of maser spots in region A are not shown because unlike the spots in regions B, C, and D, they are located within a cluster, which is unresolved on scales of 0.1''. Although the maser spots in regions B, C, and D may reflect a random distribution, we suggest that it is more likely that the observed overall patterns of these maser clusters are due to rotational gas flows. The expected velocity field derived from a rigid body rotation model of the galactic plane is shown in the upper-left panel. The radial velocity in the rotation model can be expressed as:

where i is the inclination angle between the orbital plane and the sky plane; ϕ is the positional angle of the major axis of the projected rotational ellipse plane; Vsys is the systemic velocity of the rotation system; ω is the angular velocity of rigid body rotation; variable r is the distance from the zero position. We adopted i = 72° from Kuno et al. (2007), ϕ = 15° toward northeast from the overall maser spot distributions, Vsys = −45 km s−1, which corresponds to the mean of maser velocities in B and C regions. With these parameters fixed, we adjusted the angular velocity ω to construct the rotation velocity field. When ω = 0.28 km s−1 pc−1 the modeled radial velocity field is approximately consistent with the maser spot velocities.
The rotational gas flow pattern around the three maser regions expected from the above rotation model is illustrated by the curves in the lower three panels of Figure 3. It can clearly be seen that the maser spot clusters (in B–D) are well modeled by the overall rotational velocity field; however, we are not able to construct a more accurate kinematic model to fit the spatio-kinematics of each maser spot because of the large velocity dispersion (>30 km s−1) for each region (see Figure 3). This velocity dispersion may physically be due to dynamical interactions between material in the nuclear ring and the rotational galactic bar. It also should be noted that noncircular motions associated with the (nuclear) barred potential are not considered in the rigid body kinematic model because the chosen simpler model captures the overall kinematics well enough for the purposes of this paper. A rotational pattern suggests that the detected 36.2 GHz methanol maser emission components may arise in large-scale shock environments associated with the galactic bar rotation. Dense gas tracers, such as NH3, C18O, and HCN have also been detected toward the four regions that have associated methanol emission (Meier et al. 2008; Lebrón et al. 2011; Meier & Turner 2012), suggesting that significant star formation activity can occur in these regions. Shocked gas produced by outflows from local star formation sites within these regions may contribute to the production of the class I methanol masers. However, it should be noted that within a small-scale shocked environment is difficult to provide enough amplifying length to produce maser emission with sufficient luminosity to be detected at extragalactic distances.
The methanol maser emission regions detected in the VLA observations are located at the edge of the galactic bar, suggesting that they are likely associated with the shocked environment at the bar edge. Ellingsen et al. (2017) found that the 36.2 GHz methanol masers in NGC 253 are located at the interface between the nuclear ring and both ends of the galactic bar, which is similar to what is seen in Maffei 2. Bar shocks may be formed in cloud–cloud collisions at the interface between the edge of the galactic bar and surrounding material due to galactic bar rotation or the surrounding gas infalling into the galactic bar. However, in the case of Maffei 2, the consistency of the rotational pattern shown in regions B, C, and D suggests that the large-scale shocks that excite the methanol maser are more likely produced by a larger-scale rotation of the galactic bar, rather than the surrounding gas infalling into the galactic bar. Although the large-scale shocks that excite the methanol masers might be also induced by other kinematic processes, such as infalling gas in NGC 4945 (McCarthy et al. 2017) or galactic outflows in Arp 220 (as a tentative detection of methanol maser; Chen et al. 2015), our findings support that the galactic bar rotational shocks may be the primary mechanism for extragalactic methanol maser production. A further survey for 36.2 GHz methanol emission toward nearby starburst galaxies with galactic bar rotation systems is necessary to test this hypothesis and further investigate the mechanism.
4.3. Stability of the 36.2 GHz Methanol Maser
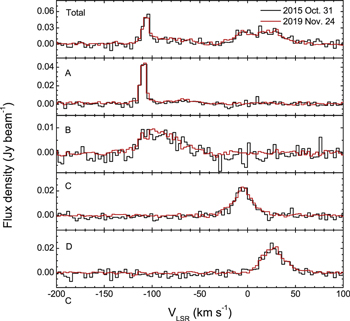
As stated in Section 3.1, the 36.2 GHz methanol emission shows a consistent line profile and line brightness over the four years between the two epochs of observation, with the exception of component B. The different profiles and velocity peaks for component B detected at two epochs are likely mainly because this component is relatively weak, and different spectral resolutions were used for the line images at the two epochs (see Section 3.1 and Figure 1). In order to improve the line detection S/N and to compare the emission from the two epochs more accurately, we imaged the 36.2 GHz methanol line data at the same spectral resolution (3 km s−1) for the two epochs. Figure 4 presents the comparisons of the spectra extracted from the peak positions of the four components obtained from the above imaged data. It clearly shows that the line profile and flux density are very similar between the two epochs. This shows that the 36.2 GHz methanol maser has been very stable between the two observation epochs that are separated by over ∼4 yr. One thing to note is that Humire et al. (2020) made a detection of the 36.2 GHz methanol emission with the 100 m telescope at Effelsberg in 2019 January and February, but their spectra show a different spectral profile and flux density compared to our two epochs of observation. Only two spectral features at LSR velocities of ∼−100 and ∼8 km s−1 were detected in the Effelsberg observations. It appears that this is because the 100 m telescope beam size at 36.2 GHz (∼23'') only covers the emission from components B and C (see Figure 1), with the emission from components A and D being located beyond the half-power points of the telescope beam. Component B also lies close to the edge of the beam in the 100 m observations and this is likely the reason for different flux densities and line profiles, rather than the variability of the 36.2 GHz methanol maser emission.
Figure 4. Detailed comparison of the 36.2 GHz methanol maser spectra detected at two epochs at the same spectral resolution of 3 km s−1. The upper panel is the total spectra that sum over the four regions. The four remaining panels present the maser spectra extracted from the peak positions of the four components A–D as denoted in Figure 1.
Download figure:
Standard image High-resolution image
Variability in the 36.2 GHz methanol maser has been detected in NGC 253 and NGC 4945 in interferometric observations made using the Australia Telescope Compact Array on timescales of a few years (see McCarthy et al. 2020). However, in Maffei 2, we do not detect any variability of the 36.2 GHz methanol masers spanning ∼4 yr in VLA observations that have nearly the same angular resolution. The mechanism causing variability in extragalactic class I methanol masers is not yet known. One possibility is that the masers showing variability are located in more energetic environments with higher velocity shocks as suggested by McCarthy et al. (2020). Under this hypothesis, the nonvariability in Maffei 2 would indicate that the environment of the class I methanol masers in this galaxy is more stable or contains lower velocity shocks than NGC 253 or NGC 4945.
4.4. Production of the 6.7 GHz Class II Methanol Maser
As shown in Figure 2, although the emission from both the 6.7 GHz and 36.2 GHz transitions show a similar velocity range, their spatial distributions are very different. Unlike the 36.2 GHz transition, which is associated with the galactic bar, the 6.7 GHz methanol emission is not found to be associated with other known galactic tracers. Therefore the tentative detection of the 6.7 GHz methanol is likely not associated with larger-scale galactic activities, but rather a star-forming region (or cluster) environment. The detected peak flux density of the 6.7 GHz methanol is 0.7 mJy, corresponding to a luminosity of 2.3 × 10⁴ Jy kpc2 (calculated directly with the peak flux multiplying distance). The 6.7 GHz methanol masers in the Milky Way can be as bright as a few thousand Jy (e.g., Pestalozzi et al. 2005; Yang et al. 2019). For comparison, two bright Galactic 6.7 GHz methanol maser sources with very accurate distance measurements from maser parallax are W3(OH) with 3700 Jy at 2.0 kpc (Pestalozzi et al. 2005; Xu et al. 2006), and G9.62+0.19 with 5240 Jy at 5.2 kpc (Pestalozzi et al. 2005; Sanna et al. 2009), with corresponding peak luminosities of 1.5 × 10⁴ Jy kpc2 and 14.2 × 10⁴ Jy kpc2, respectively. So the tentative detection of 6.7 GHz methanol in Maffei 2 has a comparable luminosity to these two Galactic star-forming regions (clusters). It should be noted that the apparent velocity range of the 6.7 GHz tentative detection is much broader than that observed for any Galactic star formation regions (all of which are less than 20 km s−1), particularly if the emission at positive LSR velocities is considered to also be real (at a 3σ level; see Figure 2). It is somewhat unexpected that one small maser region away from the nuclear gas can show a line profile that appears to mimic that of the overall nucleus. The strongest component, which peaks at −60 km s−1, has a velocity that is consistent with that predicted by the rotational model of the nuclear region toward region E (see Figure 3). The component at positive LSR velocities significantly deviates from the rotational model predictions, and one possibility is that the emission at positive LSR velocities may be produced from another star-forming cluster(s) that may locate in the background or foreground around region E along the line of sight or be offset away from the nuclear rotational plane. CO observations show complicated CO gas kinematics toward region E (Kuno et al. 2007), which exhibits a similar velocity range and pattern to the detected 6.7 GHz emission (see Figure 2). Further sensitive observations are required to confirm the intensity and velocity range of the 6.7 GHz emission for this tentative detection.
The known extragalactic 6.7 methanol masers detected in the LMC and M31 have luminosities in the range 500–10000 Jy kpc2 (see Green et al. 2008; Sjouwerman et al. 2010), which is lower than our tentative detection in Maffei 2. If the detection is confirmed, this would represent the first detection of a class II methanol maser from the 6.7 GHz transition at distances greater than 1 Mpc (beyond the Local Group). All of the extragalactic class II methanol masers detected to date are believed to arise from star-forming regions (or clusters) and correspond to bright Galactic masers in luminosity. Therefore, unlike the class I transitions, there are still no confirmed detections of megamaser or kilomasers from any class II transitions. It may be, as suggested by Phillips et al. (1998) and our findings, that the infrared pumping conditions in individual star formation regions may not operate with sufficient efficiency on the larger scales needed to produce class II kilo- or megamasers, even though these small-scale regions may have high methanol abundances. In Maffei 2, high CH3OH abundances ([CH3OH/H2]) are known across the locations where we detect class I masers. The measured abundances have a range of (0.3–2) × 10−8, particularly in region D (corresponding to region G; see Meier & Turner 2012). It is possible that the high CH3OH abundances associated with bar shocks are commonplace across the nucleus. Thus the 6.7 GHz maser region E may already have a high CH3OH abundance similar to the class I maser regions. Theoretical models of the class II maser pumping suggest that CH3OH abundances around ∼10−6 are required to produce strong maser emission from Galactic star-forming regions (e.g., Sobolev & Deguchi 1994; Cragg et al. 2005), approximately two orders of magnitude higher than 2 × 10⁻⁸. This further suggests that the class II maser (tentatively) detected in Maffei 2 is not associated with a larger-scale enhancement process of CH3OH abundance induced by bar shocks, but is related to those that happened in small-scale star-forming regions (clusters).
5. Summary
VLA observations of the 36.2 GHz class I and 6.7 GHz class II methanol transitions were made toward the nearby starburst galaxy Maffei 2. The main outcomes and scientific insights obtained from the observations are summarized as follows:
- 1.The 36.2 GHz observations made at two epochs separated by 4 yr (2015 October 31 and 2019 November 24) reveal consistent spatial distributions, line profiles, and intensities of the methanol emission. The emission regions are primarily located at the edges of the Maffei 2 bar, offset by a few hundred pc from the galactic center. Some spectral features with narrow line widths of a few km s−1 are detected suggesting that 36.2 GHz transition is masing. The methanol emission in Maffei 2 has approximately an order of magnitude higher isotropic luminosity than that recently detected toward other nearby galaxies and represents the first confirmed "megamaser" from the class I methanol transition.
- 2.A stable 36.2 GHz methanol spectral profile over the two epochs suggests that the class I methanol masers in Maffei 2 may be produced under a relatively stable or low-velocity shock environment. This shock might be induced by the rotation of the galactic bar and traced by the spatial distributions of the 36.2 GHz maser at the bar edges. This hypothesis can be tested through a further survey for 36.2 GHz methanol masers toward other nearby starburst galaxies with galactic bar rotation.
- 3.A tentative detection of emission from the 6.7 GHz class II methanol maser transition has been found in the region around the galactic bulge. This may represent the first detection of the class II methanol maser at the 6.7 GHz transition at distances beyond 1 Mpc. The putative 6.7 GHz methanol emission has a comparable luminosity to that of bright Galactic counterparts in star-forming regions. Therefore, unlike the 36.2 GHz transition, which is related to large-scale galactic activities, the 6.7 GHz methanol maser appears limited to a star-forming region (or cluster) environment.
We thank VLA staff for their assistance in obtaining the data presented in this paper. We also thank an anonymous referee for their useful comments. The National Radio Astronomy Observatory is a facility of the National Science Foundation operated under agreement by the Associated Universities, Inc. This work was supported by the National Natural Science Foundation of China (11873002, 12011530065, 11590781). X.C. thanks to Guangdong Province Universities and Colleges Pearl River Scholar Funded Scheme (2019).