


Abstract
We measure a strong excess in the galaxy number density around PG 1630+377, an extremely massive (MBH ≃ 109.7M⊙) quasar at z = 1.475, using near-infrared narrowband imaging. We identify 79 narrow H-band excess objects in a 525 arcmin2 area including the vicinity and surroundings of the quasar. These sources are likely Hα line emitting, star-forming galaxies at z ≈ 1.47. We detect a δ = 6.6 ± 2.7 overdensity of narrow H-band excess objects located at a projected distance ≈2.1 Mpc northeast of the quasar, which is the densest region in the target area. The overdensity is present in BzK color-selected galaxies, while a previously reported overdensity in the immediate vicinity of PG 1630+377 is not, and yet appears as a group-like structure. These megaparsec-scale environments are estimated to merge into a ≃1014.7M⊙ cluster at present. Our results support the view that extremely massive black holes form and grow in group-scale environments and later incorporate into a galaxy cluster.
Export citation and abstract BibTeX RIS
1. Introduction
The most massive galaxies preferentially reside in overdense areas (e.g., Dressler 1980), where ≈70% of z < 0.4 galaxies with stellar masses M* > 1011.6 M⊙ are found in cluster-scale halo masses of Mhalo ≳ 1014 M⊙ (Yoon et al. 2019). Therefore, it is naturally expected that most of the extremely massive black holes (EMBHs, MBH ≳ 109.5 M⊙; Jun et al. 2017), which reside in the most massive galaxies, live in a cluster environment as well (e.g., McConnell et al. 2011; Hlavacek-Larrondo et al. 2012; Ma et al. 2014; Mezcua et al. 2018). If this is true, EMBHs in quasars could be excellent signposts for finding protoclusters at high redshift. Due to their brightness, it is easier to detect them and to measure their masses compared to typical galaxies, making them potentially useful targets to study galaxy evolution in overdense areas in the early universe and test hierarchical galaxy formation models.
Yet, there are both observational and theoretical studies suggesting that the majority of EMBHs in high-redshift quasars may not reside in a cluster-like environment. It is known that gas-rich galaxy major mergers are more likely to occur in groups than in clusters since the weaker gravitational potential facilitates the gravitational interaction between member galaxies (Danese et al. 1980; Rines & Diaferio 2006). If quasars are fueled by gas-rich major mergers (e.g., Hopkins et al. 2008; Treister et al. 2012; Hong et al. 2015), not only should quasar activity happen more frequently at higher redshift, but we also expect that distant groups, rather than clusters, are the major sites of active EMBHs. This view is supported by observations finding an increased fraction of gas-rich galaxies at high redshift (e.g., Tacconi et al. 2010) forming overdensities (e.g., Elbaz et al. 2007; Scoville et al.2013).
The environment of EMBHs in quasars at z < 0.4 has been extensively studied in Yoon et al. (2019), where about one-third are in the middle of galaxy overdensities, while another third are in a small overdense area next to a larger overdensity, and the remaining third are in low-density regions devoid of overdensities in the vicinity. This trend is at least partially explained by the dispersion in the BH–host galaxy mass relation (e.g., Lauer et al. 2007): the host galaxies of EMBHs are not always massive. On the other hand, the Yoon et al. (2019) result may indicate that EMBHs are not born in the most massive environments (galaxy clusters). Given the simulation results that show EMBHs are more often found in less massive halos at higher redshifts (e.g., Fanidakis et al. 2013; Yoon et al.2019), it is of interest to determine how massive quasars trace overdense galaxy environments at higher redshifts (e.g., Steidel et al. 1998; Chiang et al. 2013; Lee et al. 2014; Kang & Im 2015). The expectation is that they reside in a group-scale environment around a neighboring structure, which evolves into a galaxy cluster where the majority of inactive EMBHs are found today.
Previous studies have searched for overdensities of galaxies around active galactic nuclei (AGNs) at z ∼ 1−2 using spectroscopy or narrowband filter imaging (e.g., Pascarelle et al.1996; Kurk et al. 2000; Pentericci et al. 2000; Baker et al. 2001; Matsuda et al. 2011; Koyama et al. 2013; Lehmer et al. 2013; Sobral et al. 2013, hereafter S13; Noirot et al. 2018; Shim et al. 2019; Stott et al. 2020, hereafter S20), finding a wide range of environments. However, the target AGNs have mostly been selected to be luminous, rather than selected by MBH. Clustering studies of quasars show little evidence for quasars to be in a special environment, but such studies have mostly not targeted massive quasars (e.g., Croom et al. 2005; Coil et al. 2007; Shen et al. 2009; Starikova et al. 2011; Eftekharzadeh et al. 2015; Song et al. 2016; Timlin et al. 2018; Uchiyama et al. 2018). Shirasaki et al. (2016) studied the clustering of AGNs including supermassive BHs of MBH = 109 − 1010 M⊙ finding a significantly higher bias factor than AGNs with less massive BHs, but their study does not extend beyond z = 1.
In an attempt to understand the environment where EMBHs were born, we have been conducting a multiband imaging survey of tens of EMBHs in quasars at various redshifts. One of our target quasars is PG 1630+377 (Green et al. 1986), or SDSS J163201.11+373749.9. This is an MBH ≃ 109.7 M⊙ quasar at z = 1.475 (Rakshit et al. 2020) for which we accumulated JHK and narrow H-band imaging data. If the host galaxy of PG 1630+377 ultimately follows the MBH–M* relation in the local universe (e.g., Häring & Rix 2004; Kormendy & Ho 2013; McConnell & Ma 2013), it will have an M* ≃ 1011.9−12.3 M⊙ at z = 0 from its MBH. Such massive inactive galaxies are predominantly in cluster environments today (e.g., Yoon et al. 2019), but could have been born in a less massive environment as noted above.
In this regard, S20 have recently identified emission-line galaxies around ≲ 1 Mpc of PG 1630+377 that form a δ = 12.7 ± 4.2 overdensity (hereafter ODHST) centered near the quasar, through Hubble Space Telescope/Wide-Field Camera 3 (HST/WFC3) grism spectroscopy. Given this high overdensity factor, they suggest that ODHST will grow into a galaxy cluster with Mhalo,z=0 = 1014.6±0.4 M⊙. However, apart from PG 1630+377, all the member emission-line galaxies in ODHST have low masses, similar to the Large Magellanic Cloud (Section 4), with a total stellar mass of M*,total ≃ 1010.8 M⊙ (Section 5). If ODHST consists of faint galaxies, yet is expected to grow into a rich cluster, searching for a larger and more massive overdensity surrounding ODHST will better tell if PG 1630+377 will end up in a cluster environment now.
Here, we present evidence for a significant overdensity resembling a protocluster in the vicinity of PG 1630+377. To trace the overdense area, we used Hα emitters (HAEs) near the quasar using a narrowband filter, taking advantage of wide field-of-view imaging. HAEs at z ∼ 1−2 are usually hosted by dark matter halos of Mhalo ∼ 1011−12 M⊙, comparable to typical star-forming galaxies (e.g., Hayashi et al. 2007; Sobral et al. 2010), but they are also known to trace overdensities (e.g., Geach et al. 2012; Sobral et al. 2015). Therefore, we expect an overdensity of many HAEs around extremely massive quasars at z ≳ 1, if EMBHs formed in a locally intermediate yet globally highly overdense area.
In this paper, we describe the observations (Section 2), data analysis (Section 3), estimation of the overdensity and galaxy properties (Section 4), and the implications for the growth of PG 1630+377 and its environment (Section 5). We adopt a flat ΛCDM cosmology with H0 = 70 km s−1 Mpc−1, Ωm = 0.3, and ΩΛ = 0.7. We denote comoving quantities with c and use the AB magnitude system.
2. Observations
To sample HAEs near PG 1630+377 with redshifted Hα at z ≈ 1.47, we use the NBH narrowband filter (λcenter = 1.617 μm, Δλ = 0.021 μm; S13). Hα will be the primary emission line sampled by NBH , with other major emission lines (e.g., [O iii], Hβ, or [O ii] at z ≈ 2.23, 2.33, and 3.34, respectively) expected to have lower equivalent widths. The photometric redshift distribution of NBH excess galaxies (e.g., S13) shows that HAEs at z ≃ 1.47 form the strongest and dominant peak compared to other redshifts. We label the NBH emitters as HAEs throughout the paper. With the NBH filter, HAEs are detectable at z ≈ 1.450−1.482.
We performed the imaging observations with the United Kingdom Infrared Telescope (UKIRT) Wide Field Camera (WFCAM) over 2011 June to 2013 January, in clear weather conditions. WFCAM has four sparsely spaced 2k × 2k NIR detectors (1 through 4) with a detector gap of  and each array covering a field of view 13
 65 × 1365 (17 × 17 cMpc2 at z = 1.47). The quasar was placed near the center of detector 3, and detectors 1, 2, and 4 are located SW, S, and W of detector 3, respectively,
  –
– (33–47 cMpc at z = 1.47) away. Note that we did not use the detector 4 data since they showed significant instrumental noise. This enables a comparative study of the environment within a few megaparsecs of the quasar and the field environment tens of megaparsecs away. We observed with the NBH
and H bands to detect an excess in the NBH
over H, as well as with the J and K bands for color information. We dithered between short individual frames (10s in H and K, 20s in J, 40s in NBH
) to enable good sky subtraction, and resampled the combined images into 0
(33–47 cMpc at z = 1.47) away. Note that we did not use the detector 4 data since they showed significant instrumental noise. This enables a comparative study of the environment within a few megaparsecs of the quasar and the field environment tens of megaparsecs away. We observed with the NBH
and H bands to detect an excess in the NBH
over H, as well as with the J and K bands for color information. We dithered between short individual frames (10s in H and K, 20s in J, 40s in NBH
) to enable good sky subtraction, and resampled the combined images into 0 2 pixels (half the original pixel size). The total exposure times were 40, 60, 200, and 42 minutes in the J, H, NBH
, and K bands, respectively.
2 pixels (half the original pixel size). The total exposure times were 40, 60, 200, and 42 minutes in the J, H, NBH
, and K bands, respectively.
3. Analysis
The UKIRT WFCAM Science Archive provides preprocessed (bias, dark, flat) data, with astrometry, stacking, and flux calibration performed. Using the preprocessed data, we stacked all the frames within the minimum schedulable block (stack, H and K bands) or stacked over all stacks in an observing program (deepstack, J and NBH bands). We then constructed a master stacked image for each band using SWarp (Bertin et al. 2002) for the H and K bands observed over multiple programs, while we used deepstack images for J and NBH bands. The provided images contain magnitude zero-points, and we derived the weighted flux zero-point of the master stacks using the variance of pixel values.
In order to better perform joint photometry of broadband and narrowband images, we matched the seeing of the J (082), NBH
(077), and K (085) to the H (087), by Gaussian smoothing using IRAF (Tody 1986) gauss. We then ran SExtractor (Bertin & Arnouts 1996) in dual image mode after aligning the J-, NBH
-, and K-band images to the astrometry of H, thus measuring the flux in identical apertures and seeing sizes. We chose the H band as the reference for dual image mode photometry because the signal-to-noise ratio (S/N) was higher than in the NBH
band for the HAEs. We note that the Gaussian smoothing and image alignment not only smooth the variations of the sky, but also cause the SExtractor Poisson error values to be underestimated due to the covariance between adjacent sky values (e.g., Gawiser et al. 2006). We corrected for these effects by adding constant flux error values in quadrature (i.e.,  , Δf0 is the flux error of the smoothed, aligned image, and
  is the added constant), to match the SExtractor background rms value before the smoothing and alignment processes.
We ran SExtractor with more than five connected pixels above 0.5σ, and used aperture S/N > 3 detections in all the H, NBH , and K bands for better source detection in multiple filters. We adopted a 2'' diameter circular aperture that corresponds to 16.9 kpc at z = 1.47, enough to contain most of the galaxy emission. Blended sources were removed by visual inspection. We used the central 4 k × 4 k pixels per chip to remove spurious detections near the edge of the chips, and removed the halos of saturated stars or crosstalk signals caused by bright stars. Galactic extinction corrections were applied to the fluxes and magnitudes (Schlafly & Finkbeiner 2011). We learned that the detector 3 area had also been covered by the Large Binocular Telescope, Large Binocular Cameras (LBT/LBC) in the griz band (Prochaska et al. 2019; J. C. Howk 2021, private communication), and we performed a similar analysis to the grizK-band data, but this time with the i band as the base.
To identify HAEs we adopted the Σ parameter, which represents the significance of the narrowband emission over the broadband (e.g., Bunker et al. 1995),
where f and Δf are the object flux counts per frequency (fν
) and the noise in an aperture, scaled such that  if NBH
= H. A correction of 0.01—0.03 mag was applied to the H − NBH
colors of sources in each chip to account for differences in seeing. The change in magnitude due to the wavelength offset from H to NBH
was corrected by interpolating using J for sources with S/N > 3, or extrapolating using K (−0.02 to 0.03 mag for the HAEs). We use the term
if NBH
= H. A correction of 0.01—0.03 mag was applied to the H − NBH
colors of sources in each chip to account for differences in seeing. The change in magnitude due to the wavelength offset from H to NBH
was corrected by interpolating using J for sources with S/N > 3, or extrapolating using K (−0.02 to 0.03 mag for the HAEs). We use the term  to note that the colors are corrected for both effects.
We calculated the NBH line equivalent width (EW) and flux (F) values,
It is common to select z ∼ 1−2 HAEs (e.g., Matsuda et al. 2011; Geach et al. 2012; Koyama et al. 2013; Sobral et al. 2015) from Equations (1)–(2) taking (i) Σ > 2.5 − 3, and (ii) a lower limit on the rest-frame EW (EWrest) to remove high-Σ cases caused by small flux errors rather than strong line emission. We used Σ > 2.5 and EWrest > 15 Å (equivalently,  mag) and selected 79 HAEs out of 6917 detected sources (22/2159, 22/2130, and 35/2628 HAEs in detectors 1–3, respectively). In Figure 1, we plot the
  –NBH
diagram.
–NBH
diagram.
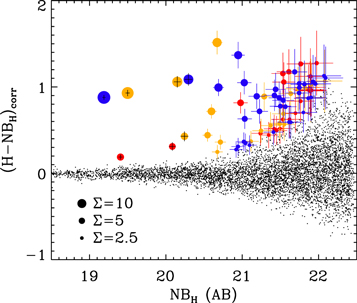
Figure 1. The  –NBH
color–magnitude diagram for the sources with S/N > 3 in all H, NBH
, and K bands (black dots). The HAEs are shown in circles logarithmically scaled with Σ (Equation 1), colored red, yellow, and blue for chips 1–3, respectively.
–NBH
color–magnitude diagram for the sources with S/N > 3 in all H, NBH
, and K bands (black dots). The HAEs are shown in circles logarithmically scaled with Σ (Equation 1), colored red, yellow, and blue for chips 1–3, respectively.
Download figure:
Standard image High-resolution imageWe assessed the expected number of interlopers resulting from the photometric scatter going into the HAE selection. To quantify the number of interlopers we simulated NBH − H colors of the S/N > 3 sources assuming a zero intrinsic color, and the scatter using 10,000 Gaussian random samples per source with the observed magnitude error as σ. We found a mean of 27 and 6 interloping HAEs expected at lower Σ limits of 2.5 and 3, which are 34% and 7% of the 79 observed HAEs, respectively. We correct for the effect of interlopers in the measurement of δ and thereby the Mhalo in Section 4.
Table 1 shows the broadband and narrowband photometry, and other properties of the 79 HAEs. In Figure 2, we plot the overdensity maps of the HAEs around the massive quasar. We calculate the overdensity factor

by counting the number of galaxies within 1 proper Mpc projected distance of each HAE location, n(x, y), 9 converted onto a uniform grid, n(R.A., Decl.), by triangulation. The average number density, 〈n(x, y)〉, was obtained over detectors 1–3, 10 after removing the halos around bright stars (1.7% of the observed area).
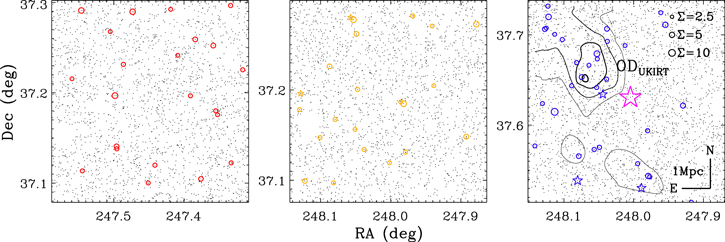
Figure 2. The spatial distribution of HAEs (red, yellow, and blue circles from chips 1–3, respectively), logarithmically scaled with Σ in Equation (1), plotted over all the H-band sources in Figure 1 (black dots). Pointlike sources in the H band are highlighted (stars, SExtractor class_star > 0.95), including PG 1630+377 in detector 3 (magenta star). We draw overdensity contours of the HAEs with increasing line weights at δg (R < 1 Mpc) = 1.5, 3, 4.5, and 6. The peak value of the ODUKIRT overdensity is δg = 6.6 ± 2.7.
Download figure:
Standard image High-resolution imageTable 1. Hα Emitter Properties
| R.A. | Decl. | H | NBH |

| J | K | Σ | EWrest |

| δg |
|---|---|---|---|---|---|---|---|---|---|---|
| (deg) | (deg) | (AB mag) | (AB mag) | (AB mag) | (AB mag) | (AB mag) | (Å) | ( erg s−1) | ||
| Detector 3 (contains the quasar) | ||||||||||
| 248.00467 | 37.63058 | 15.83 ± 0.00 | 14.91 ± 0.00 | 0.89 ± 0.00 | 15.91 ± 0.00 | 16.14 ± 0.01 | 318.5 | 130 ± 0 | 44.88 ± 0.00 | 0.1 |
| 248.05661 | 37.57306 | 20.08 ± 0.02 | 19.19 ± 0.02 | 0.88 ± 0.03 | 20.34 ± 0.02 | 19.99 ± 0.02 | 26.7 | 127 ± 4 | 43.16 ± 0.02 | 1.0 |
| 248.12283 | 37.73175 | 21.39 ± 0.05 | 20.30 ± 0.05 | 1.09 ± 0.07 | 21.83 ± 0.08 | 21.28 ± 0.06 | 12.5 | 183 ± 14 | 42.80 ± 0.03 | 3.5 |
| 247.95453 | 37.71107 | 21.69 ± 0.07 | 20.69 ± 0.07 | 0.99 ± 0.10 | 22.21 ± 0.11 | 21.26 ± 0.05 | 8.4 | 156 ± 18 | 42.61 ± 0.05 | 0.1 |
| 248.12737 | 37.70625 | 22.34 ± 0.13 | 20.95 ± 0.09 | 1.37 ± 0.15 | 22.28 ± 0.12 | 22.24 ± 0.13 | 8.0 | 290 ± 36 | 42.61 ± 0.05 | 3.5 |
| 248.10236 | 37.69476 | 22.08 ± 0.10 | 21.03 ± 0.09 | 1.05 ± 0.14 | 22.74 ± 0.18 | 21.76 ± 0.08 | 6.5 | 172 ± 26 | 42.49 ± 0.06 | 3.4 |
| 248.14168 | 37.57703 | 22.10 ± 0.10 | 21.19 ± 0.11 | 0.89 ± 0.15 | 22.31 ± 0.12 | 22.10 ± 0.11 | 5.1 | 130 ± 25 | 42.37 ± 0.08 | −0.5 |
| 248.03882 | 37.65095 | 21.67 ± 0.07 | 21.03 ± 0.09 | 0.63 ± 0.12 | 22.29 ± 0.12 | 21.43 ± 0.06 | 4.6 | 77 ± 16 | 42.30 ± 0.09 | 4.3 |
| 247.92924 | 37.62168 | 22.43 ± 0.14 | 21.44 ± 0.13 | 0.97 ± 0.19 | 22.43 ± 0.14 | 22.52 ± 0.16 | 4.3 | 150 ± 34 | 42.30 ± 0.09 | −0.7 |
| 248.07881 | 37.56570 | 21.96 ± 0.09 | 21.23 ± 0.11 | 0.72 ± 0.14 | 22.21 ± 0.11 | 21.28 ± 0.06 | 4.3 | 93 ± 21 | 42.28 ± 0.09 | 1.8 |
| 248.08894 | 37.64360 | 22.35 ± 0.13 | 21.42 ± 0.13 | 0.90 ± 0.18 | 22.43 ± 0.14 | 22.48 ± 0.16 | 4.2 | 132 ± 31 | 42.28 ± 0.09 | 2.6 |
| 248.12206 | 37.71988 | 22.37 ± 0.13 | 21.48 ± 0.14 | 0.87 ± 0.19 | 22.62 ± 0.16 | 22.14 ± 0.12 | 3.9 | 126 ± 32 | 42.24 ± 0.10 | 3.6 |
| 248.05220 | 37.67327 | 22.89 ± 0.21 | 21.69 ± 0.16 | 1.17 ± 0.26 | 22.91 ± 0.21 | 22.99 ± 0.24 | 3.8 | 212 ± 55 | 42.27 ± 0.10 | 5.1 |
| 247.96111 | 37.72443 | 22.40 ± 0.13 | 21.54 ± 0.14 | 0.84 ± 0.20 | 22.70 ± 0.17 | 22.20 ± 0.12 | 3.6 | 119 ± 33 | 42.21 ± 0.11 | 0.3 |
| 248.07448 | 37.65326 | 22.30 ± 0.12 | 21.50 ± 0.14 | 0.78 ± 0.19 | 22.24 ± 0.12 | 22.24 ± 0.13 | 3.5 | 104 ± 29 | 42.20 ± 0.11 | 5.9 |
| 247.97696 | 37.54272 | 22.81 ± 0.19 | 21.75 ± 0.17 | 1.04 ± 0.26 | 23.53 ± 0.35 | 22.59 ± 0.17 | 3.4 | 169 ± 49 | 42.20 ± 0.11 | 1.8 |
| 248.05302 | 37.64172 | 22.33 ± 0.12 | 21.56 ± 0.15 | 0.77 ± 0.19 | 23.10 ± 0.24 | 22.61 ± 0.17 | 3.3 | 103 ± 31 | 42.17 ± 0.11 | 4.3 |
| 247.98001 | 37.59386 | 22.76 ± 0.19 | 21.75 ± 0.17 | 0.99 ± 0.25 | 22.82 ± 0.19 | 22.33 ± 0.14 | 3.3 | 155 ± 47 | 42.18 ± 0.11 | −0.7 |
| 248.08183 | 37.66931 | 22.68 ± 0.17 | 21.74 ± 0.17 | 0.93 ± 0.24 | 23.29 ± 0.28 | 22.47 ± 0.16 | 3.2 | 139 ± 43 | 42.16 ± 0.12 | 4.3 |
| 248.01230 | 37.68813 | 22.87 ± 0.20 | 21.81 ± 0.18 | 1.03 ± 0.27 | 23.02 ± 0.23 | 22.63 ± 0.18 | 3.2 | 166 ± 52 | 42.17 ± 0.12 | 1.0 |
| 248.04424 | 37.63417 | 21.40 ± 0.05 | 21.02 ± 0.09 | 0.37 ± 0.11 | 21.82 ± 0.08 | 21.15 ± 0.05 | 3.0 | 38 ± 12 | 42.09 ± 0.12 | 2.6 |
| 248.04910 | 37.57542 | 23.01 ± 0.23 | 21.93 ± 0.20 | 1.06 ± 0.31 | 23.95 ± 0.48 | 22.92 ± 0.23 | 2.9 | 175 ± 60 | 42.14 ± 0.13 | 1.0 |
| 248.12526 | 37.70748 | 21.39 ± 0.05 | 21.04 ± 0.09 | 0.35 ± 0.11 | 22.20 ± 0.11 | 21.15 ± 0.05 | 2.9 | 36 ± 12 | 42.07 ± 0.13 | 3.5 |
| 248.11331 | 37.61475 | 23.02 ± 0.23 | 21.96 ± 0.20 | 1.04 ± 0.31 | 23.05 ± 0.23 | 23.14 ± 0.28 | 2.8 | 168 ± 59 | 42.12 ± 0.13 | 0.1 |
| 247.98878 | 37.53048 | 21.28 ± 0.05 | 20.95 ± 0.09 | 0.31 ± 0.10 | 21.17 ± 0.05 | 21.36 ± 0.06 | 2.8 | 31 ± 11 | 42.05 ± 0.13 | 1.9 |
| 248.06412 | 37.66637 | 22.76 ± 0.18 | 21.87 ± 0.19 | 0.87 ± 0.26 | 22.75 ± 0.18 | 22.57 ± 0.17 | 2.7 | 125 ± 45 | 42.09 ± 0.14 | 5.1 |
| 248.13078 | 37.62393 | 22.81 ± 0.19 | 21.90 ± 0.19 | 0.88 ± 0.27 | 22.64 ± 0.16 | 23.10 ± 0.27 | 2.7 | 127 ± 47 | 42.08 ± 0.14 | 0.2 |
| 248.03831 | 37.70662 | 23.22 ± 0.28 | 22.07 ± 0.22 | 1.13 ± 0.36 | 23.21 ± 0.27 | 22.72 ± 0.19 | 2.7 | 196 ± 73 | 42.10 ± 0.14 | 1.8 |
| 248.11319 | 37.70050 | 21.91 ± 0.08 | 21.41 ± 0.13 | 0.48 ± 0.15 | 22.00 ± 0.09 | 21.92 ± 0.10 | 2.7 | 53 ± 20 | 42.04 ± 0.14 | 3.4 |
| 248.05267 | 37.67905 | 22.21 ± 0.11 | 21.61 ± 0.15 | 0.59 ± 0.19 | 22.88 ± 0.20 | 22.02 ± 0.10 | 2.6 | 70 ± 27 | 42.05 ± 0.14 | 5.1 |
| 248.03773 | 37.69278 | 21.20 ± 0.04 | 20.92 ± 0.09 | 0.28 ± 0.10 | 21.66 ± 0.07 | 20.75 ± 0.04 | 2.6 | 27 ± 10 | 42.01 ± 0.14 | 2.6 |
| 247.97906 | 37.54375 | 23.22 ± 0.28 | 22.09 ± 0.23 | 1.10 ± 0.36 | 26.07 ± 2.23 | 23.14 ± 0.28 | 2.6 | 188 ± 73 | 42.08 ± 0.14 | 1.8 |
| 247.99419 | 37.55743 | 22.23 ± 0.11 | 21.64 ± 0.16 | 0.59 ± 0.19 | 22.75 ± 0.18 | 21.25 ± 0.05 | 2.6 | 70 ± 27 | 42.04 ± 0.14 | 1.8 |
| 248.08035 | 37.53873 | 21.43 ± 0.05 | 21.10 ± 0.10 | 0.33 ± 0.11 | 21.85 ± 0.08 | 21.23 ± 0.05 | 2.6 | 33 ± 12 | 42.01 ± 0.14 | 0.1 |
| 247.91719 | 37.51472 | 22.52 ± 0.15 | 21.80 ± 0.18 | 0.70 ± 0.23 | 22.78 ± 0.18 | 22.00 ± 0.10 | 2.5 | 90 ± 36 | 42.04 ± 0.15 | −0.4 |
| Detector 1 (SW to the quasar) | ||||||||||
| 247.49834 | 37.19687 | 19.61 ± 0.01 | 19.41 ± 0.03 | 0.19 ± 0.03 | 19.90 ± 0.02 | 19.62 ± 0.02 | 6.2 | 17 ± 2 | 42.45 ± 0.06 | −0.7 |
| 247.54625 | 37.29113 | 20.41 ± 0.02 | 20.08 ± 0.04 | 0.31 ± 0.05 | 20.79 ± 0.04 | 20.13 ± 0.02 | 5.6 | 31 ± 5 | 42.40 ± 0.07 | −0.6 |
| 247.47318 | 37.28971 | 21.81 ± 0.08 | 20.98 ± 0.09 | 0.82 ± 0.12 | 22.26 ± 0.12 | 21.42 ± 0.06 | 5.5 | 113 ± 20 | 42.42 ± 0.07 | −0.6 |
| 247.49611 | 37.14061 | 22.73 ± 0.19 | 21.53 ± 0.15 | 1.16 ± 0.24 | 23.49 ± 0.35 | 23.25 ± 0.30 | 4.2 | 205 ± 49 | 42.32 ± 0.09 | 0.1 |
| 247.35831 | 37.25228 | 22.61 ± 0.17 | 21.54 ± 0.15 | 1.06 ± 0.23 | 23.03 ± 0.24 | 23.01 ± 0.25 | 3.9 | 174 ± 44 | 42.29 ± 0.10 | 0.1 |
| 247.38400 | 37.25913 | 22.82 ± 0.21 | 21.61 ± 0.16 | 1.18 ± 0.26 | 22.73 ± 0.19 | 21.96 ± 0.10 | 3.9 | 212 ± 54 | 42.30 ± 0.10 | 1.0 |
| 247.37589 | 37.10472 | 23.05 ± 0.25 | 21.77 ± 0.18 | 1.27 ± 0.31 | 23.22 ± 0.28 | 22.60 ± 0.17 | 3.6 | 246 ± 69 | 42.26 ± 0.11 | −0.7 |
| 247.33362 | 37.29660 | 23.25 ± 0.31 | 21.97 ± 0.22 | 1.28 ± 0.38 | 23.40 ± 0.33 | 22.29 ± 0.13 | 3.0 | 250 ± 84 | 42.18 ± 0.13 | −0.5 |
| 247.48637 | 37.23146 | 23.05 ± 0.25 | 21.89 ± 0.20 | 1.12 ± 0.32 | 22.93 ± 0.22 | 22.64 ± 0.18 | 3.0 | 194 ± 65 | 42.17 ± 0.13 | −0.7 |
| 247.44145 | 37.11984 | 21.71 ± 0.07 | 21.24 ± 0.12 | 0.46 ± 0.14 | 22.24 ± 0.12 | 21.16 ± 0.05 | 2.9 | 51 ± 17 | 42.10 ± 0.13 | 0.1 |
| 247.31635 | 37.22548 | 22.16 ± 0.11 | 21.53 ± 0.15 | 0.62 ± 0.19 | 22.85 ± 0.21 | 21.51 ± 0.07 | 2.8 | 76 ± 27 | 42.10 ± 0.13 | −0.5 |
| 247.33287 | 37.12243 | 22.61 ± 0.17 | 21.76 ± 0.18 | 0.84 ± 0.25 | 23.18 ± 0.27 | 22.25 ± 0.13 | 2.8 | 117 ± 42 | 42.12 ± 0.13 | −0.7 |
| 247.49567 | 37.13796 | 22.91 ± 0.22 | 21.89 ± 0.20 | 1.00 ± 0.30 | 23.09 ± 0.25 | 22.38 ± 0.14 | 2.8 | 157 ± 56 | 42.13 ± 0.13 | 0.1 |
| 247.35477 | 37.18005 | 22.87 ± 0.21 | 21.87 ± 0.20 | 0.97 ± 0.29 | 22.75 ± 0.19 | 22.25 ± 0.13 | 2.8 | 149 ± 53 | 42.13 ± 0.13 | 0.1 |
| 247.39079 | 37.19664 | 22.89 ± 0.22 | 21.89 ± 0.20 | 0.95 ± 0.30 | 22.32 ± 0.13 | 22.16 ± 0.12 | 2.7 | 145 ± 54 | 42.11 ± 0.14 | −0.7 |
| 247.45096 | 37.10019 | 22.90 ± 0.22 | 21.91 ± 0.20 | 0.96 ± 0.30 | 22.68 ± 0.18 | 22.35 ± 0.14 | 2.7 | 147 ± 55 | 42.11 ± 0.14 | 0.1 |
| 247.54489 | 37.11353 | 21.95 ± 0.09 | 21.42 ± 0.14 | 0.51 ± 0.16 | 22.12 ± 0.11 | 21.51 ± 0.07 | 2.7 | 58 ± 21 | 42.07 ± 0.14 | −0.7 |
| 247.41904 | 37.29243 | 22.43 ± 0.14 | 21.70 ± 0.17 | 0.70 ± 0.22 | 22.12 ± 0.11 | 22.79 ± 0.20 | 2.6 | 88 ± 34 | 42.08 ± 0.14 | −0.6 |
| 247.35220 | 37.17571 | 22.26 ± 0.12 | 21.62 ± 0.16 | 0.63 ± 0.20 | 22.54 ± 0.16 | 22.54 ± 0.16 | 2.6 | 76 ± 29 | 42.07 ± 0.14 | 0.1 |
| 247.55960 | 37.21551 | 21.82 ± 0.08 | 21.35 ± 0.13 | 0.44 ± 0.15 | 21.76 ± 0.08 | 21.95 ± 0.10 | 2.5 | 48 ± 19 | 42.04 ± 0.15 | −0.7 |
| 247.40892 | 37.24151 | 22.03 ± 0.10 | 21.49 ± 0.14 | 0.52 ± 0.18 | 22.38 ± 0.14 | 21.74 ± 0.08 | 2.5 | 59 ± 23 | 42.05 ± 0.15 | 0.1 |
| 247.50505 | 37.26770 | 21.98 ± 0.10 | 21.45 ± 0.14 | 0.49 ± 0.17 | 21.79 ± 0.08 | 22.32 ± 0.14 | 2.5 | 55 ± 22 | 42.04 ± 0.15 | −0.7 |
| Detector 2 (S to the quasar) | ||||||||||
| 248.07936 | 37.16735 | 20.42 ± 0.02 | 19.50 ± 0.03 | 0.93 ± 0.04 | 20.81 ± 0.04 | 20.30 ± 0.03 | 21.4 | 139 ± 6 | 43.06 ± 0.02 | 1.0 |
| 248.00179 | 37.11935 | 21.20 ± 0.05 | 20.15 ± 0.05 | 1.06 ± 0.07 | 21.56 ± 0.07 | 21.34 ± 0.06 | 13.6 | 174 ± 12 | 42.85 ± 0.03 | 1.0 |
| 248.05716 | 37.28037 | 22.20 ± 0.12 | 20.67 ± 0.07 | 1.51 ± 0.14 | 22.06 ± 0.11 | 22.56 ± 0.17 | 10.5 | 366 ± 34 | 42.76 ± 0.04 | 1.0 |
| 247.97900 | 37.13115 | 21.29 ± 0.05 | 20.60 ± 0.07 | 0.72 ± 0.08 | 22.12 ± 0.11 | 21.02 ± 0.05 | 7.2 | 93 ± 12 | 42.53 ± 0.06 | 0.1 |
| 248.03799 | 37.13404 | 20.66 ± 0.03 | 20.24 ± 0.05 | 0.43 ± 0.06 | 21.06 ± 0.05 | 20.39 ± 0.03 | 6.6 | 46 ± 7 | 42.47 ± 0.06 | 1.0 |
| 248.04724 | 37.20046 | 20.98 ± 0.04 | 20.55 ± 0.06 | 0.44 ± 0.07 | 21.47 ± 0.06 | 20.50 ± 0.03 | 5.2 | 48 ± 9 | 42.36 ± 0.08 | −0.7 |
| 247.96860 | 37.28190 | 22.17 ± 0.11 | 21.29 ± 0.12 | 0.89 ± 0.16 | 22.55 ± 0.16 | 21.65 ± 0.08 | 4.6 | 129 ± 28 | 42.33 ± 0.09 | 0.2 |
| 248.08716 | 37.22608 | 21.08 ± 0.04 | 20.71 ± 0.07 | 0.36 ± 0.08 | 21.19 ± 0.05 | 21.04 ± 0.05 | 3.8 | 37 ± 9 | 42.21 ± 0.10 | −0.7 |
| 247.98569 | 37.18666 | 22.55 ± 0.16 | 21.63 ± 0.16 | 0.92 ± 0.23 | 22.96 ± 0.23 | 22.19 ± 0.12 | 3.4 | 137 ± 40 | 42.20 ± 0.11 | 0.1 |
| 248.05095 | 37.15623 | 22.70 ± 0.19 | 21.73 ± 0.17 | 0.98 ± 0.25 | 23.13 ± 0.27 | 22.69 ± 0.19 | 3.3 | 152 ± 46 | 42.19 ± 0.12 | 1.0 |
| 247.94092 | 37.27069 | 21.74 ± 0.08 | 21.25 ± 0.11 | 0.49 ± 0.14 | 21.80 ± 0.09 | 21.20 ± 0.05 | 3.1 | 55 ± 18 | 42.12 ± 0.12 | 0.1 |
| 247.89227 | 37.14827 | 22.22 ± 0.12 | 21.54 ± 0.15 | 0.69 ± 0.19 | 22.64 ± 0.18 | 22.20 ± 0.12 | 3.1 | 87 ± 28 | 42.14 ± 0.12 | −0.7 |
| 248.05312 | 37.27770 | 22.81 ± 0.20 | 21.82 ± 0.19 | 0.99 ± 0.28 | 23.67 ± 0.41 | 22.17 ± 0.12 | 3.0 | 155 ± 51 | 42.16 ± 0.12 | 1.0 |
| 248.04886 | 37.26200 | 21.94 ± 0.09 | 21.37 ± 0.13 | 0.55 ± 0.16 | 21.63 ± 0.07 | 21.39 ± 0.06 | 3.0 | 64 ± 21 | 42.12 ± 0.12 | 1.0 |
| 247.98163 | 37.18477 | 22.92 ± 0.23 | 21.90 ± 0.20 | 1.02 ± 0.30 | 23.11 ± 0.26 | 22.33 ± 0.14 | 2.9 | 164 ± 57 | 42.14 ± 0.13 | 0.1 |
| 248.12849 | 37.19608 | 20.93 ± 0.04 | 20.67 ± 0.07 | 0.25 ± 0.08 | 20.79 ± 0.04 | 21.07 ± 0.05 | 2.8 | 24 ± 8 | 42.06 ± 0.13 | 0.3 |
| 247.93857 | 37.20466 | 22.06 ± 0.10 | 21.49 ± 0.14 | 0.58 ± 0.17 | 22.48 ± 0.15 | 21.44 ± 0.06 | 2.8 | 68 ± 24 | 42.09 ± 0.13 | −0.7 |
| 248.08153 | 37.09720 | 22.06 ± 0.10 | 21.49 ± 0.14 | 0.57 ± 0.17 | 22.38 ± 0.14 | 21.41 ± 0.06 | 2.8 | 67 ± 24 | 42.08 ± 0.13 | 0.1 |
| 248.12234 | 37.09914 | 21.49 ± 0.06 | 21.11 ± 0.10 | 0.37 ± 0.12 | 21.45 ± 0.06 | 21.75 ± 0.08 | 2.7 | 38 ± 14 | 42.06 ± 0.14 | 0.2 |
| 248.10086 | 37.14724 | 22.78 ± 0.20 | 21.90 ± 0.20 | 0.87 ± 0.28 | 23.37 ± 0.33 | 22.78 ± 0.21 | 2.6 | 125 ± 48 | 42.08 ± 0.14 | 0.1 |
| 247.87794 | 37.27275 | 22.14 ± 0.11 | 21.55 ± 0.15 | 0.56 ± 0.18 | 21.71 ± 0.08 | 22.28 ± 0.13 | 2.6 | 66 ± 25 | 42.05 ± 0.14 | −0.6 |
| 248.12994 | 37.17825 | 23.14 ± 0.28 | 22.08 ± 0.23 | 1.07 ± 0.36 | 23.70 ± 0.43 | 22.48 ± 0.16 | 2.5 | 177 ± 70 | 42.08 ± 0.15 | 0.3 |
Note. Catalog of z ≈ 1.47 HAEs and their properties. The coordinates (R.A., Decl.) are from the epoch J2000.0. The magnitudes are uncorrected for aperture size, and the colors are corrected to the effective wavelength of the NBH
band and with filter correction between the broad and narrow bands. The significance of the NBH
emission (Σ), the rest-frame line equivalent width (EWrest), the Hα luminosity from the NBH
excess flux ( , with aperture correction and [N ii] contamination correction), and the overdensity of neighbor galaxies within 1 Mpc projected distance (δ), are defined in Equations (1)–(3) We assume the redshifted Hα emission lies on the center of the NBH
filter (z = 1.466) for the redshift-dependent parameter LHα
. Due to the width of the NBH
filter, the luminosity distance is uncertain by 1.3% and the luminosity by 0.01 dex.
, with aperture correction and [N ii] contamination correction), and the overdensity of neighbor galaxies within 1 Mpc projected distance (δ), are defined in Equations (1)–(3) We assume the redshifted Hα emission lies on the center of the NBH
filter (z = 1.466) for the redshift-dependent parameter LHα
. Due to the width of the NBH
filter, the luminosity distance is uncertain by 1.3% and the luminosity by 0.01 dex.
A machine-readable version of the table is available.
4. Results
Figure 2 reveals an overdense area (hereafter ODUKIRT) with a clear peak located ≈2.1 proper Mpc NE of PG 1630+377, whereas no prominent overdensity peaks are found in detectors 1 and 2. We correct for the effect of interlopers changing the δg
values, adopting the estimated number of interlopers (Section 3) assuming a uniform distribution. For Σ > 2.5 HAEs, correcting for the interlopers reduces 〈n〉 by 34 % and the peak n by 2.3%. We find the interloper-corrected δg
= 6.6 ± 2.7 from Equation (1) and Poisson error statistics,  . Making the same correction for the Σ > 3 limit yields δg
= 7.3 ± 3.3. We test how the significance and position of ODUKIRT change with the choice of the Σ limit. Varying the lower Σ limit between 2.5 and 3, in 0.1 steps, we find that the strongest overdensity stays nearly at the same location with δg
= 4.1−6.5, even without interloper correction.
. Making the same correction for the Σ > 3 limit yields δg
= 7.3 ± 3.3. We test how the significance and position of ODUKIRT change with the choice of the Σ limit. Varying the lower Σ limit between 2.5 and 3, in 0.1 steps, we find that the strongest overdensity stays nearly at the same location with δg
= 4.1−6.5, even without interloper correction.
We select z ≃ 1.5 galaxies near PG 1630+377 using the BzK methodology of Daddi et al. (2004). Using the LBT/LBC griz photometry (for the saturated PG 1630+377 we use SDSS photometry) covering the UKIRT K-band detector 3, we perform a similar analysis as done in Section 3, and make a BzK color selection from S13 in Figure 3. We use Figure 5 of S13 to select z ≃ 1.5 galaxies, roughly embraced by the Daddi et al. (2004) selection for 1.4 ≲ z ≲ 2.5 BzK galaxies. S13 further used i−z colors to better select z ≈ 1.47 HAEs, but we did not include this criterion in selecting z ≃ 1.5 BzK galaxies. We adopt the B−z (with the B band extrapolated from the g and r bands) and z−K color boundaries to select 1026 galaxies at z ≃ 1.5, with median aperture magnitudes of 24.7, 24.3, 23.7, 23.7, and 22.7 mag, respectively, in grizK. Furthermore, we divide the z ≃ 1.5 BzK galaxies with a color cut of B − z = 2.71 into passive BzK (pBzK, 58 objects) and star-forming BzK (sBzK, 968 objects) galaxies as in Daddi et al. (2004). The strongest overdensity of BzK galaxies is δg = 1.3 coincident with ODUKIRT, with two δg ≃ 1 structures west and south of PG 1630+377. Including the quasar itself, 13 emission-line galaxies around PG 1630+377 within z = 1.4787 ± 0.0125 11 have also been identified to form a δg = 12.7 ± 4.2 overdensity (ODHST) through HST/WFC3 grism spectroscopy (S20; J. P. Stott 2021, private communication), probing the central ≃ 1 Mpc around PG 1630+377. The HST/WFC3 G141 grism data probe rest-frame 4350–6880 Å at z = 1.47, covering Hα emission as well as Hβ and [O iii].
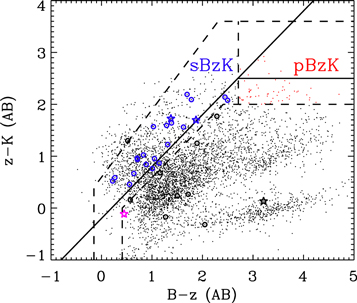
Figure 3. The BzK color–color diagram of galaxies around PG 1630+377 (dots, UKIRT HAEs in circles and stars, following Figure 2). PG 1630+377 is marked with a magenta star. The selection of passive and star-forming z ≃ 1.5 BzK galaxies (pBzK and sBzK in red and blue, respectively) are shown in dashed lines, close to the intersection between Daddi et al. (2004; solid lines) and S13.
Download figure:
Standard image High-resolution imageUsing the BzK galaxies we are better able to investigate the properties of UKIRT-selected galaxies. Of the 35 HAEs in UKIRT detector 3, 32 have matches in the LBT/LBC data, and 22 of those 32 (69%) are sBzK z ≃ 1.5 galaxies and 5/32 are near the boundary of the color cut. This verifies that the majority of HAEs are star-forming galaxies at their expected redshifts of z ≃ 1.5. We further estimate the number of Hα absorption systems. There are 97 NBH absorption sources with Σ < –2.5, EWrest < –15 Å , and we cross-matched 29 in LBT/LBC out of 31 in UKIRT detector 3. Only 4/29 (14%) lie on the BzK z ≃ 1.5 galaxy selection with one near the color cut boundary, and 24/29 are on the z < 1 galaxy region of the color–color diagram. Thus, even if NBH absorption galaxies are potentially showing absorption lines, most of them are absorbed in other lines than Hα, in contrast to most of the HAEs showing Hα in emission.
BzK galaxies help classify point-like HAEs too, which may come from moderate luminosity AGN or nuclear star-formation. The number of SDSS DR16 quasars (Lyke et al. 2020) expected as NBH -excess HAEs (z = 1.450 − 1.482; Section 2) over UKIRT detectors 1–3, is only 0.12. Still, some HAEs are pointlike: apart from PG 1630+377, 5/49 at H < 22.5 have SExtractor H-band stellarity class_star > 0.95. Of them, three are in detector 3 and have optical stellarities 0.6–0.9 (averaged over griz bands), where two are z ≃ 1.5 BzK galaxies and one is a BzK star. Future spectroscopy will better tell the nature of Hα absorbers and pointlike HAEs.
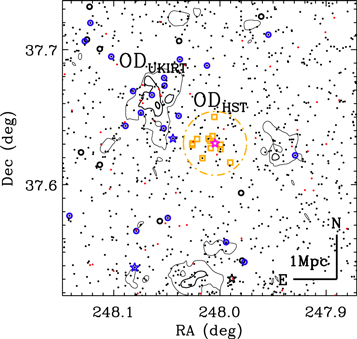
We plot in Figure 4, the BzK-selected z ≃ 1.5 galaxies and their overdensity contours, together with the UKIRT HAEs and the HST emission-line galaxies at z ≈ 1.47. ODUKIRT coincides with the largest overdensity in the BzK galaxies, and a notable fraction of pBzK galaxies (red dots in Figure 4) are seen at the center, independently confirming the significance of the overdensity. Interestingly, ODHST is not reproduced by BzK galaxies nor HAEs in Figure 4. The HST/WFC3 galaxies are simply fainter than the photometrically selected galaxies—only 4 of 13 HST emission-line galaxies are BzK detected (S/N > 3, where three are BzK-selected and one is PG 1630+377) and and only 2 of the 13 are UKIRT-detected (one is PG 1630+377, and the other source shows Σ = 1.5). Another factor is that the NBH filter misses Hα emission at z > 1.482, which includes 4 of the 13 HST emission-line redshifts. Thus, δg for ODUKIRT may have been mildly underestimated.
Figure 4. The distribution of galaxies around PG 1630+377 (magenta star) in the UKIRT detector 3 region. z = 1.473−1.491 emission line galaxies from S20 (yellow squares and the approximate field of view marked in yellow), the star-forming and passive z ≃ 1.5 BzK galaxies (Prochaska et al. 2019; black and red dots), and the UKIRT HAEs (circles and stars from Figure 3) are overplotted. Contours of δg (R < 1 Mpc) = 0.4, 0.8, and 1.2 from the BzK galaxies are shown in the order of increasing thickness.
Download figure:
Standard image High-resolution image
We find stellar masses of the HAEs to be  (median 10.2) from
  with a 0.2 dex dispersion in the relation (Nagaraj et al. 2021), assuming zero K correction for star-forming galaxies and linear interpolation from UKIRT to the HST/F160W magnitudes. A similar range of M* values for sBzK galaxies is found. Emission-line galaxies in S20 are less massive, with
  (median 9.6) for the 12 galaxies at z = 1.473-1.491 around PG 1630+377. pBzK galaxies are the most massive, where we used
  (Yoon et al. 2017) from rest-frame r and g−r photometry and applying a K correction of
  , which yields
  (median 11.0).
We further estimate the star formation rate (SFR), adopting SFR = 7.9(LHα
/1042 erg s−1)M⊙ yr−1 with a systematic uncertainty of  dex (Kennicutt 1998). We corrected the F in Equation (2) for the [N ii] contamination, by [N ii]/H α = −0.296 log EW(Å) + 0.8 (Sobral et al. 2015; this relation has 0.4 dex dispersion from Villar et al. 2008), assuming the absence of evolution in [N ii]/Hα at z < 0.8 extends to z ≃ 1.5. The SFR values for the HAEs in detector 3, corrected for internal extinction E(B − V) = 0.25(B − z + 0.1) (0.026 mag dispersion) with attenuation A(Hα) = 3.33E(B − V) (Calzetti et al. 2000; Daddi et al. 2004; with median E(B − V) = 0.34 mag), are 16−227 M⊙ yr−1 (median 32 M⊙ yr−1).
12
This is comparable to the SFR values for z ∼ 1−2 star-forming main-sequence galaxies with M* ∼ 1010
M⊙ (e.g., Daddi et al. 2007). Adding up the SFR values and propagating the uncertainties from the 17 HAEs at δg
> 1.5 within ODUKIRT, we find a total of 825 (±136 measurement,
dex (Kennicutt 1998). We corrected the F in Equation (2) for the [N ii] contamination, by [N ii]/H α = −0.296 log EW(Å) + 0.8 (Sobral et al. 2015; this relation has 0.4 dex dispersion from Villar et al. 2008), assuming the absence of evolution in [N ii]/Hα at z < 0.8 extends to z ≃ 1.5. The SFR values for the HAEs in detector 3, corrected for internal extinction E(B − V) = 0.25(B − z + 0.1) (0.026 mag dispersion) with attenuation A(Hα) = 3.33E(B − V) (Calzetti et al. 2000; Daddi et al. 2004; with median E(B − V) = 0.34 mag), are 16−227 M⊙ yr−1 (median 32 M⊙ yr−1).
12
This is comparable to the SFR values for z ∼ 1−2 star-forming main-sequence galaxies with M* ∼ 1010
M⊙ (e.g., Daddi et al. 2007). Adding up the SFR values and propagating the uncertainties from the 17 HAEs at δg
> 1.5 within ODUKIRT, we find a total of 825 (±136 measurement,  systematic) M⊙ yr−1. The 12 emission-line galaxies in S20 show extinction-corrected (assuming the median E(B − V) = 0.34 mag from the HAEs) Hα-based SFR values 3–44 M⊙ yr−1 (median 15 M⊙ yr−1), with a total SFR = 192 (±31 measurement,
  systematic) M⊙ yr−1 in ODHST.
Assuming the protocluster spherically collapses into a single structure at z = 0 (e.g., Steidel et al. 1998 and references therein), its mass would be

where  is the mean matter density at present, Vc
is the observed comoving volume where δg
of the overdensity is defined, δm
is the matter overdensity related to the observed galaxy overdensity δg
in Equation (3) as 1 + b
δm
= C(1 + δg
) and to the linear overdensity δL
as
is the mean matter density at present, Vc
is the observed comoving volume where δg
of the overdensity is defined, δm
is the matter overdensity related to the observed galaxy overdensity δg
in Equation (3) as 1 + b
δm
= C(1 + δg
) and to the linear overdensity δL
as  , b is the bias factor, and C is the redshift distortion factor
  where f ≈ Ωm
(z)4/7. For ODUKIRT we adopt Vc
≈ 1150 cMpc3, the area of a cylinder with a projected proper radius 1 Mpc (or 2.47 cMpc) multiplied by the redshift slice of Δz = 0.032 (Section 2; 60 cMpc). Next, b ≃ 1.9 ± 0.19 with a ≃ 10% uncertainty from Cochrane et al. (2017) at our extinction-corrected mean Hα luminosity
where f ≈ Ωm
(z)4/7. For ODUKIRT we adopt Vc
≈ 1150 cMpc3, the area of a cylinder with a projected proper radius 1 Mpc (or 2.47 cMpc) multiplied by the redshift slice of Δz = 0.032 (Section 2; 60 cMpc). Next, b ≃ 1.9 ± 0.19 with a ≃ 10% uncertainty from Cochrane et al. (2017) at our extinction-corrected mean Hα luminosity  for the HAEs. This yields (
f
, C, δm
) ≈ (0.92, 0.61 ± 0.16, 1.91 ± 1.06) and logMhalo,z=0/M⊙ ≃ 14.35 ± 0.16. Likewise, adopting (b, Vc
, Δz) =(1.45 ± 0.145, 700 cMpc3, 0.025) for ODHST yields (f, C, δm
) ≈ (0.92, 0.42 ± 0.14, 3.31 ± 1.22), and logMhalo,z=0/M⊙ ≃ 14.47 ± 0.16.
13
for the HAEs. This yields (
f
, C, δm
) ≈ (0.92, 0.61 ± 0.16, 1.91 ± 1.06) and logMhalo,z=0/M⊙ ≃ 14.35 ± 0.16. Likewise, adopting (b, Vc
, Δz) =(1.45 ± 0.145, 700 cMpc3, 0.025) for ODHST yields (f, C, δm
) ≈ (0.92, 0.42 ± 0.14, 3.31 ± 1.22), and logMhalo,z=0/M⊙ ≃ 14.47 ± 0.16.
13
The conversion from δg
into Mhalo,z=0 assumes that Mhalo,z=0 is independent of the choice of galaxy property, as b is calibrated, for example, at given Hα luminosity (e.g., Cochrane et al. 2017). We test this for ODUKIRT by varying the Σ limit for HAE selection from 2.5 to 3 again in steps of 0.1, and find that while  monotonically increases with the Σ limit as 42.27–42.43,
  stays nearly constant in between 14.35 and 14.40 (mean and scatter of 14.38 ± 0.02). This suggests that the interloper-corrected HAEs robustly produce consistent Mhalo,z=0 values sampled at various Hα luminosities. Such a test is impossible for ODHST due to the lack of bright emission-line galaxies, and we note a potential overestimation in Mhalo for ODHST (Section 5).
5. Discussion
None of the HAEs, emission-line galaxies, and BzK galaxies (with maximum  , respectively) reach the expected mass of PG 1630+377 today. PG 1630+377 has an expected log M*/M⊙ ≃ 11.9-12.3 from the local MBH–M* relation (e.g., Häring & Rix 2004; Kormendy & Ho 2013; McConnell & Ma 2013) with an intrinsic scatter of ≃ 0.3 dex. The expected mass at z = 1.47 is (
 , adopting an evolution in the MBH/M* ratio,
  (Merloni et al. 2010; but see also Ding et al. 2020; Suh et al. 2020 for the nonevolution in the ratio up to z ∼ 2). Still, they are able to define sufficiently overdense environments including ODUKIRT and ODHST, with a total SFR = 1017 (±140 measurement,
  systematic) M⊙ yr−1. These results suggest that PG 1630+377 would evolve into one of the most massive galaxies in this region, with M* comparable to the brightest cluster galaxies (BCGs) in massive clusters.
Yet, the immediate environment (<1 Mpc) of PG 1630+377 shows a rather group-like property. If PG 1630+377 were absent, the member emission-line galaxies that comprise ODHST would all be relatively low mass (on par with the Large Magellanic Cloud), and their total stellar mass, M*,total ≃ 1010.8 M⊙ would suggest Mhalo ≃ 1012.8 M⊙ (e.g., Lee et al. 2019). ODHST is a highly overdense region with δg = 12.7, but could have been identified only with deep HST observations. Although PG 1630+377 itself appears extremely massive, the expected Mhalo assuming a universal M* function (Section 4) may have been overestimated for ODHST, which lacks massive galaxies, complicating whether ODHST will become a massive cluster from the clustering of fainter galaxies alone. On the other hand, ODUKIRT with M*,total ≃ 1011.6 M⊙ shows M* and SFR values for individual and total member galaxies that are several times more than those in ODHST without even correcting for the shallower magnitude limit. Furthermore, there is a significant excess of BzK galaxies in this area. Thus, the galaxy properties of ODUKIRT already resemble those of a galaxy cluster.
These results are in line with previous simulations showing rapid growth of EMBHs in z ≃ 1.5 quasars, occurring in group-like halos (Mhalo ∼ 1013 M⊙) but evolving into cluster-scale halos at present (e.g., Fanidakis et al. 2013; Yoon et al. 2019). The linear overdensities for ODUKIRT and ODHST are, δL = 0.76, 0.93, respectively, which would grow into δL ≈ 1.6, 2.0 at z = 0 assuming a matter dominated ∝ t2/3 linear growth with time t. Thus, both overdensities are likely to collapse into themselves, and merge if the relative speed is less than the escape velocity, supported by their proximities and current level of δg . If such merging of ODUKIRT and ODHST is to happen from z = 1.475 to the present, we estimate the present-day mass will be Mhalo,z=0/M⊙ ≃ 1014.35±0.16 + 1014.47±0.16 = 1014.71±0.10.
We compare Mhalo,z=0 to the Mhalo from the BCG–cluster mass relation at z ≲ 1 (e.g., Lidman et al. 2012) assuming PG 1630+377 will become the BCG. 14 We consider PG 1630+377's M* to be in between M* = 300 MBH ≈ 1012.2 M⊙ on the nonevolving MBH−M* relation, and 100 MBH ≈ 1011.7 M⊙ assuming that the BH is 3 times overmassive to the relation. These M*,BCG estimates connect to Mhalo ≳ 1015 M⊙ and ≃ 1014.5−15 M⊙, respectively. This independently suggests that ODHST would have merged with ODUKIRT to become a sufficiently massive galaxy cluster with Mhalo,z=0 ≳ 1014.5 M⊙. Furthermore, the BCG–cluster mass relation suggests that PG 1630+377's MBH is overmassive to the present-day MBH−M* relation (e.g., Ferré-Mateu et al. 2015; Jun et al. 2017) to better meet Mhalo,z=0 ≃ 1014.7 M⊙.
6. Summary
We have investigated the galaxy environment of an EMBH quasar PG 1630+377, finding a δg = 6.6 overdensity of z ≈ 1.47 HAEs ≈ 2.1 Mpc to the northeast. Our discovery of ODUKIRT and the previous identification of ODHST gives an example of an EMBH forming and growing in a group, but later incorporated into a much larger structure. Future multiobject spectroscopy of ODUKIRT and ODHST member candidates should solidify the connection between these two overdensities and the birthsite of an EMBH. Enlarging the sample of z ∼ 1 EMBH quasars will statistically quantify the significance of them by identifying group-like, protocluster environments. Low-resolution near-infrared spectra from upcoming large-area surveys (e.g., Laureijs et al. 2011; Doré et al. 2018) will also map overdensities around a large number of z ≲ 1 AGNs.
We thank the anonymous referee for the constructive comments on the paper, Chris Howk and Jessica Werk for providing the LBT/LBC imaging data, John Stott for providing the HST/WFC3 galaxy catalog (HST Cycle 24 Large Program 14594; PIs: R. Bielby, J. P. Stott), Marios Karouzos for participating in the UKIRT observations, and Junsup Shim and Myung Gyoon Lee for helpful communications. This research was supported by Basic Science Research Program through the National Research Foundation of Korea (NRF) funded by the Ministry of Education (NRF-2017R1A6A3A04005158, No. 2020R1A2C3011091, and No. 2021M3F7A1084525). Portions of this research were carried out at the Jet Propulsion Laboratory, California Institute of Technology, under a contract with the National Aeronautics and Space Administration. UKIRT is owned by the University of Hawaii (UH) and operated by the UH Institute for Astronomy; operations are enabled through the cooperation of the East Asian Observatory. When the data reported here were acquired, UKIRT was operated by the Joint Astronomy Centre on behalf of the Science and Technology Facilities Council of the U.K.
Footnotes
- 9
We compensate for the loss of the circular area near the edge of the chip.
- 10
The S/N = 3 limit is deeper by only ≈ 0.05 mag in chip 3 over chip 1, and we treat detectors 1–3 as identical detectors. The number of detected sources in chip 3 with a 0.05 mag shallower limit would be reduced by only 2%.
- 11
- 12
HAEs can be star-forming galaxies or AGNs, but the majority are likely star-forming galaxies based on spectroscopy (e.g., Matsuda et al. 2011; Koyama et al. 2013; Lehmer et al. 2013) and the low fraction of pointlike HAEs in our UKIRT field. We assume that most of the LHα comes from star formation apart from PG 1630+377.
- 13
Although we used the errors on (b, δg ) to estimate ΔMhalo,z=0 for ODUKIRT, the process diverges for ODHST in the direction of an overestimated δg or an underestimated b at given uncertainties, or an overestimated Δδg or an underestimated Δb at given parameter values. Simply to obtain a converging set of parameter uncertainties, we fix Δb = 0, ΔC = 0 to derive Δδm for ODHST.
- 14
This assumption gives a lower limit to the BCG mass and hence the cluster mass, if PG 1630+377 happens not to be the BCG at z ≲ 1.