


Abstract
We have made a spectroscopic investigation of the nature of 053949.17−693747.4, a blue star with mid-infrared excess, projected within a superbubble in the H ii complex N160 in the Large Magellanic Cloud (LMC). Analyses of photometric and spectrophotometric data of this star indicate that it is an O7 ± 1 V in the LMC. The radial velocity of this star from a 2010 spectrum shows an offset of ∼150 km s−1 from that of the background interstellar medium (ISM), while the spectra taken in 2020 show stellar velocity similar to the ISM velocity. The velocity variations indicate that 053949.17−693747.4 must be a binary system. The lack of spectroscopic features from a stellar companion and the large radial velocity variations of the primary O7 star imply that the companion is most likely an early-type B star. Hubble Space Telescope Hα and [O iii] images of 053949.17−693747.4 show a small nebula around the star with the southern rim resembling a blow-shock-like structure. While the physical nature as a bow shock cannot be robustly established, this small nebula is likely the cause of 053949.17−693747.4's mid-infrared excess. Spectroscopic monitoring over an entire binary period is needed to establish the period and systemic velocity to determine the properties of the binary companion and whether this binary system is a runaway.
Export citation and abstract BibTeX RIS
1. Introduction
Runaway stars make up a population of stars with peculiar velocities, and they are often early-type stars found in isolated environments (Blaauw 1961). They can be diagnosed and investigated either by direct measurement of their radial or transverse velocities (e.g., Evans et al. 2010; Tetzlaff et al. 2011; Lennon et al. 2017; Maíz Apellániz et al. 2018) or through circumstantial evidence such as the detection of bow shocks around them or their locations in isolation (e.g., Gvaramadze et al. 2010; Peri et al. 2012, 2015; Kobulnicky et al. 2016).
Runaway stars are thought to be ejected from star clusters. Two mechanisms have been proposed for the origin of runaway stars (Hoogerwerf et al. 2000): (i) the binary-supernova scenario (BSS)—a supernova explosion of the more massive star in a binary system gives the less massive star a kick (Blaauw 1961; Stone 1991)—and (ii) the dynamical ejection scenario (DES)—dynamical encounters in dense stellar systems eject a star (Poveda et al. 1967; Gies & Bolton 1986).
The expected runaway fractions among O-type stars vary from at best a few percent (Eldridge et al. 2011; Renzo et al. 2019) to ∼10% (Oh & Kroupa 2016), although the observed fraction is ∼10%–20% (Blaauw 1961; Gies 1987; Maíz Apellániz et al. 2018). An important signature of DES is the binarity of runaway stars. While the majority of massive stars are formed in binary systems and observed binary fractions for O stars are greater than 50% (see, e.g., Sana et al. 2012, 2013; Almeida et al. 2017), several observational studies indicate that 5%–25% of O-type runaway stars are binary systems (Mason et al. 1998; Maíz Apellániz et al. 2018), consistent with the expected fraction from N-body calculations of massive star clusters (Oh & Kroupa 2016).
In a spectroscopic study of blue stars with infrared excesses in the Large Magellanic Cloud (LMC; R. Ishioka et al. 2020, in preparation), we found a star with a large velocity offset from the background interstellar medium (ISM). This star is located within the superbubble N160 (Henize 1956) around the OB association LH 103 (Lucke & Hodge 1970), and archival Hubble Space Telescope (HST) images of the surrounding ISM appear to show a bow-shock-like structure, thus we speculated that this was a runaway star ejected from the OB association. However, in two additional spectra we obtained recently, the radial velocity of the blue star becomes similar to that of the background ISM.
This paper reports our investigation of the nature of this blue star, 053949.2–693747.4 in the LMC, whether it is a runaway star or a binary system. Section 2 describes the initial identification of the runaway candidate and observations used in the subsequent study. In Section 3, we determine the spectral type of the star from the optical photometric and spectrophotometric data. Section 4 presents arguments for its nature. A summary of our study of 053949.2–693747.4 is given in Section 5.
2. Initial Identification and Available Observations
2.1. Initial Identification of the Runaway Candidate
The Spitzer Space Telescope observations of the LMC, especially those from the program Surveying the Agents of Galaxy Evolution (Meixner et al. 2006), have been used in conjunction with ground-based optical and near-IR photometric surveys to identify young stellar objects (YSOs) in the LMC (Gruendl & Chu 2009). During the course of that work, it is noticed that over 100 stars are blue, with  , and have 8 μm or 24 μm excesses. These blue stars with IR excesses could be YSOs or evolved stars. To probe the true nature of these stars, we have obtained long-slit medium-dispersion spectra, which allow us to examine properties of not only the stars but also the ambient ISM. One of the blue stars with IR excesses, 053949.2–693747.4 (Gruendl & Chu 2009), exhibits stellar velocity that is offset from the ambient ISM velocity by almost 150 km s−1, suggesting a possible runaway star. It is nevertheless also possible that this peculiar velocity originates from orbital motion in a binary system; thus, additional spectroscopic observations have been obtained to distinguish between the two possibilities.
2.2. Photometric Measurements
The multiwavelength photometric measurements of 053949.2–693747.4 were taken from various sources. Its UBVI photometry is from the Magellanic Cloud Photometric Survey (MCPS; Zaritsky et al. 2004), JHK photometry from the Two Micron All-Sky Survey (2MASS; Skrutskie et al. 2006), and Spitzer IRAC 3.6, 4.5, 5.8, and 8.0 μm and MIPS 24 μm photometry from Gruendl & Chu (2009). These photometric measurements are listed in Table 1 and the spectral energy distribution (SED) is plotted in Figure 1.

Figure 1. Spectral energy distribution of 053949.2−693747.4. Green filled circles are photometric data from MCPS (UVBI) and 2MASS (JHK), and IRAC measurements taken from Gruendi & Chu (2009). The green line represents the optical spectrum obtained with the Goodman Spectrograph on the SOAR 4.1 m telescope, adjusted to match photometric data after flux calibration. The cyan filled circles and blue line are photometry and spectrum after the extinction correction of  . The magenta filled circles and dotted line are the synthetic photometry and spectrum of an O7 V star.
Download figure:
Standard image High-resolution imageTable 1. Optical and Infrared Photometric Measurements of 053949.2−693747.4
| Band | Central Wavelength | Magnitude |
|---|---|---|
| (μm) | ||
| U | 0.375 | 15.21 ± 0.06 |
| B | 0.430 | 15.95 ± 0.07 |
| V | 0.530 | 15.66 ± 0.07 |
| I | 0.860 | 15.46 ± 0.07 |
| J | 1.235 | 15.29 ± 0.07 |
| H | 1.662 | 14.86 ± 0.0 |
| K | 2.159 | 14.58 ± 0.12 |
| IRAC1 | 3.60 | 14.14 ± 0.09 |
| IRAC2 | 4.5 | 13.48 ± 0.0 |
| IRAC3 | 5.8 | 12.82 ± 0.13 |
| IRAC4 | 8.0 | 10.77 ± 0.09 |
| MIPS1 | 23.675 | 3.52 ± 0.12 |
Note. UBVI are from MCPS, JHK are from 2MASS, and Spitzer IRAC and MIPS measurements are from Gruendl & Chu (2009).
Download table as: ASCIITypeset image
2.3. Spectroscopic Observations
The first long-slit medium-dispersion spectra of 053949.2−693747.4 were obtained with the Goodman Spectrograph (Clemens et al. 2004) on the SOAR 4.1 m telescope at Cerro Pachon on 2010 February 3. We performed additional observations at two epochs, on 2020 January 9 and 2020 February 12, with the same spectrograph but increasing spectral resolutions. Narrower slits were used, and the spectral resolutions estimated from the FWHM of comparison lines in lamp spectra are ∼500, ∼1000, and ∼4000 at the wavelength of 5000 Å. The log of these spectroscopic observations is presented in Table 2.
Table 2. Log of Spectroscopic Observations with Goodman Spectrograph on SOAR 4.1 m Telescope
| Date | UT | Exp. Time | Spectral Range | Grating/Filter | Slit Width | Spectral Scale | Spatial Scale | Airmass |
|---|---|---|---|---|---|---|---|---|
| hh:mm:ss | (s) | (Å) | (Å pixel−1) | (arcsec pixel−1) | ||||
| 2010 Feb 3 | 03:05:42 | 300 | ∼3700–8500 | RALC 300/GG-385 | 1 03 03 |
∼2.6 | ∼0.30 | 1.34 |
| 03:00:20 | 300 | ∼3700–8500 | RALC 300/GG-385 | 103 |
∼2.6 | ∼0.30 | 1.35 | |
| 2020 Jan 9 | 02:47:56 | 600 | ∼3700–7100 | SYZY 400/NoFilter | 10 |
∼2.0 | ∼0.32 | 1.30 |
| 02:58:06 | 600 | ∼3700–7100 | SYZY 400/NoFilter | 10 |
∼2.0 | ∼0.32 | 1.30 | |
| 03:08:17 | 600 | ∼3700–7100 | SYZY 400/NoFilter | 10 |
∼2.0 | ∼0.32 | 1.30 | |
| 2020 Feb 12 | 02:21:12 | 1200 | ∼3855–5155 | RALC 1200 RED/NoFilter | 06 |
∼0.32 | ∼0.14 | 1.34 |
| 02:41:41 | 1200 | ∼3855–5155 | RALC 1200 RED/NoFilter | 06 |
∼0.32 | ∼0.14 | 1.36 | |
| 03:02:16 | 1200 | ∼3855–5155 | RALC 1200 RED/NoFilter | 06 |
∼0.32 | ∼0.14 | 1.38 |
Download table as: ASCIITypeset image
The long-slit spectrogram from 2010 is shown in the top panel of Figure 2. These spectroscopic data were reduced with standard procedures in the software package IRAF. The images were bias-subtracted and flat-fielded first. Then the wavelength was calibrated by comparisons with HgAr lamp spectra taken before and after the target observation. The flux calibration was done using a spectrum of the spectrophotometric standard star EG 21 taken on the same night. Finally, spectra were extracted from apertures centered on the star and background on both sides of the star along the slit, as marked on the spectrogram in Figure 2. Because the surface brightness of the background nebular emission varies steeply along the slit, simply subtracting an aperture-scaled background spectrum from the stellar spectrum would leave prominent nebular line residuals. On the other hand, the nebular excitation does not vary as steeply as the surface brightness, thus we scaled the background spectrum according to the [O iii] λλ4959, 5007 lines until these forbidden lines were mostly subtracted from the stellar spectrum. The background-subtracted spectrum of 053949.2−693747.4 is plotted in the bottom panel of Figure 2. The difficulty and uncertainty in the background subtraction is illustrated by the [O iii] doublet, of which the λ5007 line is over-subtracted and λ4959 is under-subtracted. The nebular Hα is also over-subtracted, so the stellar Hα will be omitted in our analysis.
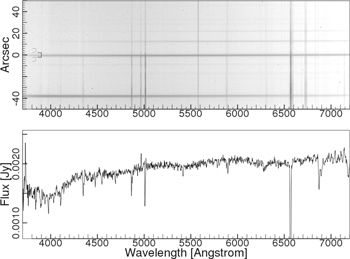
Figure 2. Long-slit spectrogram (top panel) and extracted background-subtracted spectrum (bottom panel) of 053949.2–693747.4. The slit was oriented north–south, and north is at the image top. The image is displayed logarithmically. The apertures used to extract spectra for the star and background are marked on the left edge of the spectrogram. The background-subtracted spectrum shows that the hydrogen Balmer lines and [O iii] λ5007 line are over-subtracted and the [O iii] λ4959 is under-subtracted. These spectral regions were omitted in the analysis of the stellar spectrum.
Download figure:
Standard image High-resolution image2.4. HST Images
We have searched the HST archive and found Hα and [O iii] λ5007 images of 053949.2−693747.4 taken with the Wide Field Planetary Camera 2 (WFPC2) from program 8247 (PI: Heydari-Malayeri). The program target LMC-N160A1 was in the WF2 field and 053949.2−693747.4 fell in the PC1 field. The Hα observations were made with the F656N filter in 4 × 1040 s exposures, and the [O iii] observations were made with the F502N filter in 4 × 1200 s exposures. The PC1 camera has a 36'' × 36'' field of view and a scale of 0045 pixel−1 (Baggett et al. 2002).
3. Spectral Classification of the Star
To assess physical properties of the star 053949.2−693747.4, we start with its MCPS measurements listed in Table 1. Adopting a distance modulus of 18.5 for the LMC (Pietrzyński et al. 2019), and assuming that star 053949.2−693747.4 is in the LMC, its absolute magnitude MV would be <−2.8. The star's bright MV magnitude, blue (U − B) color, and location in an H ii region suggest that the star is most likely a massive early-type star. As all O stars have  (Schmidt-Kaler 1982), we assume this is the intrinsic color of 053949.2−693747.4. From this intrinsic color and the observed
  , a color excess
  is estimated. We adopt a canonical reddening law with
  for early-type stars and
  , and find
  ,
,  , and
, and  for this star. The colors and magnitudes of 053949.2−693747.4 are consistent with those of O5.5–9 main-sequence stars (Schmidt-Kaler 1982). The extinction-corrected photometry and spectrum of the star are plotted in Figure 1 as cyan filled circles and a blue line, respectively, along with synthetic photometry and the spectrum of an O7 main-sequence star plotted in magenta.
We have also compared the extinction-corrected SED of 053949.2−693747.4 in the wavelength range of 4000–5500 Å with theoretical spectra synthesized with the SPECTRUM code (Gray & Corbally 1994), using the ATLAS9 atmosphere models (Castelli & Kurucz 2003). The best-fit model has a stellar effective temperature of Teff = 38,000 ± 5000 K, corresponding to O4 ∼ 8.5 main-sequence stars with a luminosity of log (L/L⊙) ∼5.2 ± 0.4 and MV = −4.9 ± 0.6.
Figure 3 compares this star's  and luminosity to evolutionary tracks of stars with initial masses of 15–44 M⊙ (Haemmerlé et al. 2019). It shows that 053949.2−693747.4 is best described as a star with an initial mass of ∼30 ± 10M⊙ and an age younger than ∼6 Myr, corresponding to an O7 ± 2 main-sequence star.

Figure 3. Theoretical Hertzsprung–Russell diagram showing evolutionary tracks for stars of various initial masses, from Haemmerlé et al. (2019). Star 053949.2−693747.4 is plotted in a filled circle with error bars.
Download figure:
Standard image High-resolution imageFinally, we use the equivalent widths (EWs) of stellar lines in the spectrum to determine the spectral type of 053949.2−693747.4. Figure 4 shows the SOAR Goodman spectrum of 053949.2−693747.4 in comparison with spectra of standard main-sequence O-type stars taken from Walborn & Fitzpatrick (1990) and Jacoby et al. (1984). The presence of He ii stellar absorption lines in the spectrum confirms that this star is an O-type star, and its EW(HeII 4686) = 0.92 ± 0.05 indicates the luminosity class V (Martins 2018). Though the measurements are with large uncertainties due to the poor continuum fitting and line blending and contamination, the EW ratio of the He i λ4471 to He ii λ4542 suggests an O7 ± 0.5 spectral type. We conclude that the spectral type of 053949.2−693747.4 is ∼O7 ± 1 V star.
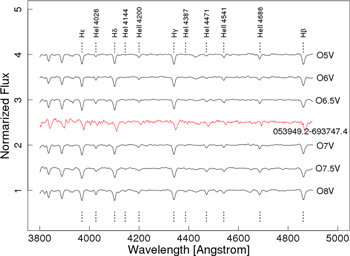
Figure 4. Comparison of normalized spectrum of 053949.2–693747.4 (red) with spectra of O5-8 main-sequence stars. Spectra of O-type stars are taken from Walborn & Fitzpatrick (1990) except for an O7.5V star from Jacoby et al. (1984). The resolution of these spectra have been degraded to match the Goodman spectrum of 053949.2–693747.4.
Download figure:
Standard image High-resolution image4. Identification as a Binary Star
4.1. Radial Velocities
The SOAR Goodman long-slit spectrogram (Figure 2) samples not only the spectrum of 053949.2−693747.4, but also those of the ionized gas in the background. Spectra of the background ISM are extracted at positions with 3'' ∼ 5'' offset from the star on either side, as marked in the top panel of Figure 2. The normalized spectra of this star at three epochs are plotted along with that of an O7 V star in the top left panel of Figure 5, and the background nebula spectrum in February 2010 (normalized to the continuum) is presented in the panel beneath. The right panels in Figure 5 show the mean profiles of stellar absorption lines (upper) and the background nebular emission lines (lower) for observations at three epochs.

Figure 5. Left: normalized spectra of 053949.2−693747.4 with a template spectrum of O7 V (upper) and background nebula spectrum (lower). Right: normalized mean profiles of stellar absorption lines (upper) and background nebula emission lines (lower) for spectra at three epochs.
Download figure:
Standard image High-resolution imageRadial velocity of the background ISM is measured by Gaussian-fitting of profiles of the bright Hγ, Hβ, and [O iii] λλ4959, 5007 lines separately for the two spectra from either side of the star and for the average spectrum of the two. Since the radial velocities from either side of the star are consistent with each other, we only list the radial velocities measured from the average spectra in Table 3. The individual radial velocity measurements, the median values, and the radial velocity measurements for mean profiles of stellar lines are listed in Table 3. The mean radial velocities of the background ionized gas are ∼300 km s−1 for three epochs, and are close to the mean radial velocity of the LMC.
Table 3. Radial Velocities (RVs) of Stellar and Nebular Lines
| Line | 2010 Feb | 2020 Jan | 2020 Feb | |||
|---|---|---|---|---|---|---|
| RV | EW | RV | EW | RV | EW | |
| (km s−1) | (Å) | (km s−1) | (Å) | (km s−1) | (Å) | |
| Nebular lines | ||||||
| Hγ 4340.5 | 318 ± 27 | 348 ± 17 | 310 ± 5.3 | |||
| Hβ 4861.3 | 291 ± 24 | 306 ± 16 | 307 ± 4.6 | |||
| [O iii] 4958.9 | 287 ± 27 | 299 ± 17 | 305 ± 4.3 | |||
| [O iii] 5006.8 | 296 ± 24 | 301 ± 17 | 306 ± 4.3 | |||
| Median | 293 ± 14 | 303 ± 23 | 307 ± 2.0 | |||
| Mean Profile | 294 ± 24 | 304 ± 16 | 307 ± 4.5 | |||
| Stellar lines | ||||||
| He i 4026.2 | 402 ± 23 | 0.68 | 350 ± 24 | 1.07 | 294 ± 22 | 0.57 |
| He i 4387.9 | 441 ± 22 | 0.50 | 325 ± 18 | 0.29 | 306 ± 27 | 0.42 |
| He i 4471.5 | 466 ± 21 | 1.01 | 301 ± 26 | 0.65 | 302 ± 19 | 1.05 |
| He ii 4200 | 461 ± 34 | 0.94 | 264 ± 20 | 0.86 | 405 ± 24 | 0.77 |
| He ii 4541.6 | 485 ± 32 | 0.78 | 325 ± 19 | 0.66 | 276 ± 24 | 0.74 |
| He ii 4685.7 | 449 ± 16 | 0.90 | 333 ± 17 | 0.83 | 263 ± 15 | 0.65 |
| He ii 5411.5 | 342 ± 33 | 1.18 | 327 ± 18 | 1.22 | NA | NA |
| Median | 449 ± 48 | 325 ± 28 | 298 ± 50 | |||
| Mean Profile | 462 ± 23 | 316 ± 20 | 297 ± 10 | |||
| Cross-Corr. | 441 ± 11 | 321 ± 15 | 292 ± 14 | |||
Download table as: ASCIITypeset image
The H Balmer absorption lines of 053949.2−693747.4 are contaminated by the background nebular emission, and the background subtraction is rendered difficult because of the large variations in the nebular emission over small spatial scales, except for the last observation with a higher resolution. We therefore measure the stellar radial velocity using the much less contaminated He i λ4026 and λ4471, and uncontaminated He ii λ4200, λ4686, λ4541, and λ5411 lines. The radial velocities determined by Gaussian-fitting of the He i and He ii line profiles and mean profiles of the stellar lines are also listed in Table 3. We have also cross-correlated the observed spectra of 053949.2−693747.4 with a template spectrum of an O7 V star to determine its radial velocity.
While the radial velocities of nebular emission lines are consistent with one another at three epochs as shown in the lower panel, the radial velocities of stellar absorption lines at the latest two epochs are lower than the value measured from the 2010 spectrum and closer to the background nebula velocity of ∼300 km s−1. From the 2010 spectrum, the radial velocity of the mean profile of stellar absorption lines is measured to be 462 ± 23 km s−1. The median of the radial velocity measurements for individual lines is 449 ± 48 km s−1. A radial velocity of 441 ± 11 km s−1 is derived from the cross-correlation with a template spectrum. These values are consistent with one another within the error limits, and are significantly higher than the background nebula velocity of ∼300 km s−1. On the other hand, from the 2020 January and February spectra, the radial velocities of stellar absorption lines are consistent with the background nebular velocity within the error limits, as shown in the right panels in Figure 5.
The two spectra taken in 2020 show similar stellar radial velocities that are consistent with those of nebular emission lines. To exclude the possibility that the discrepancy of radial velocities between nebular lines and stellar lines measured from the 2010 spectrum is due to some systematic cause such as the misalignment of the target, we examined spectra of other stars obtained with the same setting on the same night. First, we checked slit images for each target, and confirmed that the seeing on the night was worse than the slit width. Then, we checked the peak position on the slit for each target, and confirmed that the miscentering of each target on the slit is less than 0.4 pixel, or < 1/8 of the slit width, which is too small to explain 150 km s−1. In addition, other stars with comparable miscentering do not show the peculiar velocity. We, thus, concluded the observed large variation of stellar radial velocities of 150 ± 30 km s−1 is real and indicates that 053949.2−693747.4 is a binary system.
4.2. Restriction on the Binarity
In this section, we investigate the binary parameters of the system from the variable information. Because spectral lines of the O7 V star's companion are not clearly detected in the observed spectra, the companion must be fainter than the O7 V star. This is also supported by the absolute V magnitude of the star consistent with that of a single O-type main-sequence star at the distance of the LMC. No X-ray point source is detected there, thus, the companion is not a compact object. It is thus reasonable to consider that the O7 V star is the primary and the companion is the secondary in this binary system.
The minimum value of the semiamplitude of the radial velocity curve, K1, is 1/2 of the 150 km s−1 velocity difference between the 2010 and 2020 spectra, 75 km s−1, for a systemic velocity that is the average of the 2010 and 2020 stellar velocities, or 75 km s−1 from the background nebular velocity. If the systemic velocity is the same as the background nebular velocity, the minimum value of the K1 velocity would be ∼150 km s−1. The hidden companion star should be massive enough to cause the large radial velocity variation of the O7 V star in its orbital motion. We, thus, surmise that the companion star is an early B V star.
Assuming a circular orbit, the distance of the O7 V star to the center of mass,  , can be expressed as
where P is the orbital period and i is the angle between the orbital plane and the sky plane. The distance between the two stars, a, is
where M1 and M2 are the masses of the O7 V star and its early B V companion, respectively. With the above two expressions and the assumption of i = 0°, Kepler's third law can be rewritten as

where G is the gravitational constant.
Using this Kepler's law and reasonable parameter values of  ,
,  , and
, and  km s−1, we can constrain the period P for a given binary separation a. The separation between the two stars has to be greater than the radius of the primary O7 V star, i.e., a > 11 R⊙; thus, the period P should be longer than 1 d. On the other hand, if K1 is ∼150 km s−1, the period will be shorter than 20 d. If we assume the companion is a B0 V star, then M2/M1 ∼0.5, the orbital period of the system will be ∼35 days for
  km s−1, and ∼5 days for K1 ∼ 150 km s−1.
The mean profiles of stellar absorption lines in the 2010 spectrum appear asymmetric. If the asymmetry in the profile is due to a fainter and cooler companion, the asymmetry must be seen to vary for temperature- and luminosity-dependent lines in the spectrum. Because the resolution and data quality of the 2010 spectrum is inadequate to examine each line's profile, we compared mean smoothed profiles of He i and He ii lines with a model spectrum of a O7 V+B0 V binary system. For the model spectrum, we constructed synthetic spectra of O7 V and B0 V stars taken from a synthetic spectral library (Munari et al. 2005) with respective radial velocity shifts, then convolving with Gaussian function to reduce the resolution of the synthetic spectra to the observed one of ∼500. Figure 6 shows the mean smoothed profiles of He i and He ii absorption lines (solid and dashed black lines, respectively) in the 2010 spectrum and the model spectrum (red lines). The mean profile of observed He i absorption lines is more asymmetric than that of He ii absorption lines, which is not inconsistent with the profiles of the model spectrum; however, the rather low quality of the data prevents us from further examination of details. Light blue lines are best-fit Gaussian profiles by minimizing the  value against the observed data points. We note that the model spectrum is best fitted to the mean smoothed profile with a systemic velocity of ∼340 km s−1, which is slightly larger than the radial velocity of the background nebular lines; though, the uncertainty in the observed spectrum is too large to make a concrete conclusion on the systemic velocity.

Figure 6. Comparison of profiles of He i lines (solid lines) and He ii lines (dashed lines). Observed profiles (thin lines) and smoothed mean profiles (thick black lines) of the 2010 spectrum are plotted with profiles of a synthetic composite spectrum of an O7 V and B0 V binary (red lines). Light blue lines represent best-fit Gaussian profiles to the observed profiles. Spectra of O7 V and B0 V stars to composite a model spectrum are taken from a spectral library (Munari et al. 2005).
Download figure:
Standard image High-resolution imageThe mean profiles of stellar absorption lines in spectra at the two epochs in 2020 appear more symmetric than the mean profiles of the 2010 spectrum. This suggests radial velocities of two stars due to the orbital motion are close to zero at the two epochs in 2020, thus the systemic velocity of the star is close to the nebular velocity.
4.3. Bow-shock-like Structure and Proper Motion
Before we obtained the 2020 spectra of 053949.2−693747.4, we thought the large radial velocity observed in 2010 was caused by the runaway nature of the star. An O-type star moving supersonically through the ISM, its fast wind will interact with the ISM to form a bow shock. We have found archival HST Hα and [O iii] images of 053949.2−693747.4. As shown in Figure 7, the images show a small ionized nebula around the star and the south rim of the nebula appears to resemble a bow shock. However, examined closely, the ISM around the star has a very complex structure in juxtaposition to dust lanes whose bright rims may have given the impression of a bow-shock-like morphology, rendering the bow-shock nature uncertain. We note in passing that this small ionized gas region is within the apertures used in Spitzer photometry (Gruendl & Chu 2009), and its heated dust may well be responsible for 053949.2−693747.4's excess 8 and 24 μm emission in its SED.

Figure 7. HST images around 053949.2−693747.4. The left and middle panels are, respectively, Hα (F656N) and [O iii] (F502N) images with a 25'' × 25'' field of view. The green rectangle in the middle panel marks the field of view of the [O iii] close-up in the right panel. In this close-up, the bow-shock-like structure is located at 12–15 from the star on its south side.
Download figure:
Standard image High-resolution image
We have checked the Gaia DR2 catalog (Gaia Collaboration et al. 2018) for proper motions of 053949.2−693747.4 and 126 stars projected within 3' distance that are brighter than 18 mag and have measurements with standard errors smaller than 0.3 mas yr−1 in proper motions and 0.1 mas in parallax. The proper motion of 053949.2−693747.4 is 1.771(66) mas yr−1 in R.A. direction and 0.615(65) mas yr−1 in the decl. direction, which is within the errors identical to the median of the proper motions of the nearby stars, 1.825(20) mas yr−1 in R.A. direction and 0.617(23) mas yr−1 in decl. direction. A transverse velocity of the star against the median motion of its neighboring stars is less than ∼35 km s−1.
5. Summary
This paper reports our investigation of 053949.2–693747.4, a blue star with excess emission at 8 and 24 μm. This star is located near the southwest rim of the superbubble in the H ii complex N160 in the LMC. A long-slit spectrum of this star taken in 2010 shows that the star's radial velocity is offset from the ISM velocity by ∼130 km s−1, which can be caused by a runaway star or orbital motion in a binary system. Based on photometric data and spectroscopic observations, we have estimated its spectral type to be O7 ± 1 V. Archival HST Hα and [O iii] images of 053949.2–693747.4 show a seemingly bow-shock-like structure to the south of the star, which would be suggestive of a runaway star, but examined closely the bow-shock-like structure borders dusty features and does not appear to be a physically coherent structure. To distinguish between the runaway and binary nature, additional spectra of 053949.2–693747.4 were taken in 2020. The 2020 spectra show stellar velocities close to the ISM velocity, as opposed to a 130 km s−1 offset seen in the 2010 spectra. The radial velocity variations indicate that 053949.2–693747.4 must be a binary system with a radial velocity semiamplitude K1 greater than 75 km s−1. Furthermore, the secondary in this binary system must be an early B V star, whose mass is about 0.5 times the primary O7 V star's mass, in order to hide photometrically and spectroscopically. The profiles of He i and He ii absorption lines are not inconsistent with the modeled composite spectrum of an O7 V and early B V binary system. If K1 is equal to the radial velocity variation, ∼150 ± 20 km s−1, the binary period will be less than 10 days. Given the currently available data, we cannot exclude the possibility that 053949.2–693747.4 is a runaway binary with a systemic velocity of ∼75 km s−1 offset from the ISM velocity. The Gaia DR2 proper motions show that the transverse velocity of 053949.2–693747.4 relative to the median motion of 126 LMC stars projected in its neighborhood is less than ∼35 km s−1, which does not strongly bolster a runaway nature. To definitively determine whether 053949.2–693747.4 is a runaway, spectroscopic monitoring of its radial velocities over an entire binary period is needed to pin down its systemic velocity for comparison with the ambient ISM velocity.
We thank Dr. Robert Gruendl for initial data reduction of the 2010 SOAR Goodman spectrophotometric observations. We are also thankful to the SOAR Director Dr. Jay Elias for granting the SOAR telescope time and Dr. Regis Cartier for his assistance in the 2020 SOAR observations. This paper is based in part on observations obtained at the Southern Astrophysical Research (SOAR) telescope, which is a joint project of the Ministe'rio da Ciência, Tecnologia, InovaCoes e Cominicaco es do Brasil (MCTIC/LNA), the US National Science Foundation's NSF's NOIRLab (NOIRLab), the University of North Carolina at Chapel Hill (UNC), and Michigan State University (MSU). Y.H.C. and C.J.L. acknowledge grants MOST 107-2119-M-001-018 and MOST 108-2112-M-001-045 from the Ministry of Science and Technology of Taiwan, Republic of China. Finally, we would like to express our deepest appreciation for the anonymous referee's very helpful comments and suggestions.