


Abstract
The main goal of this paper is to use ultraviolet photometry from the Galaxy Evolution Explorer (GALEX) satellite to study chromospheric activity among red giant and core-helium-burning (CHeB) stars. Correlations are sought between several chromospheric and coronal activity indicators for giants that were detected in soft X-rays by the ROentgen SATellite. There is an evident correlation between  and
and  , where LX is the X-ray luminosity and FMg II is the flux from Mg ii h and k emission lines, although there is substantial scatter. Using GALEX far-ultraviolet (FUV) magnitudes, the relationship between an FUV-excess parameter (a proxy for chromospheric and transition-region emission lines) and X-ray luminosity is documented. Correlations found herein are not strong, and may be linked to binarity. There is a varied range of FUV emission among CHeB stars, indicating that giants in this phase may be exhibiting differences or cycles in outer atmospheric activity. Additionally, efforts were made to constrain a relationship between excess FUV and near-ultraviolet emission and the projected surface rotation velocity,
  , of giants. No clear relationship was found. Obscurities in this relationship may result from a spread in
  inclinations, and/or too few stars with
  km s−1.
Export citation and abstract BibTeX RIS

Original content from this work may be used under the terms of the Creative Commons Attribution 4.0 licence. Any further distribution of this work must maintain attribution to the author(s) and the title of the work, journal citation and DOI.
1. Introduction
Stars of FGK spectral type undergo mass loss during the main-sequence stage of evolution via a coronal hot wind and rotational spin down. This mass loss, in turn, is associated with a decrease in surface magnetic field strength. Activity levels in the chromosphere, transition region, and corona are tied to the magnetic field strength and thus also decrease with age during the main-sequence phase (Skumanich 1972). Such correlations suggest that FGK stars should be relatively inactive once they commence evolving to the red giant branch (RGB) in the Hertzsprung–Russell (HR) diagram. Indeed, an observing program by Linsky & Haisch (1979) early in the International Ultraviolet Explorer (IUE) satellite mission showed an absence of coronal emission among a small sample of highly evolved late-type giants, although such stars were known to possess chromospheres through earlier studies such as Wilson (1967, 1976), Deutsch (1970), Bappu & Sivaraman (1977), and Stencel (1978).
In years since, there has been additional research into the surface activity levels of giant stars. Surveys have been made of soft X-ray coronal emission among giants in different regions of the HR diagram (see, e.g., Maggio et al. 1990; Haisch et al. 1991; Ayres et al. 1998a; Hünsch et al. 1998a; Gondoin 1999). Clarifying the absence of coronal emission among the coolest giants, Ayres et al. (1997) suggested that coronal loops are partially embedded in the chromosphere. This implies that coronae remain active into the subgiant and giant phases (see also Hünsch & Schröder 1996; Ayres et al. 2007). Observations with the IUE and Far Ultraviolet Spectroscopic Explorer satellites have enabled studies of far-ultraviolet (FUV) emission lines arising in a transition region. Examples of such studies for samples of red giants, in varying stages of evolution, include Linsky & Haisch (1979), Ayres et al. (1981), Simon (1984), Hartmann et al. (1985), Simon & Drake (1989), and Dupree et al. (2005). Additionally, Ayres et al. (1982) demonstrated that broad C iv profiles are typical of active giant stars. Chromospheric activity in giants is less elusive to optical observation, and thus has a long history of study going back to the discovery of the Wilson–Bappu effect (Wilson & Vainu Bappu 1957). Ground-based and IUE studies by Rutten & Pylyser (1988), Pasquini et al. (1990), Dupree et al. (1999), Pérez Martínez et al. (2011), and Smith & Shetrone (2000), for example, have aided in further mapping out chromospheric activity in giants through observation of the Mg ii h and k and Ca ii H and K emission lines.
Among red giants there is interest in activity levels in core-helium-burning (CHeB) stars, also known as red clump giants (see, e.g., Baliunas et al. 1983). There are clues to be gleaned from understanding the surface activity levels of such stars. For example, one may interpret the evolution of internal angular momentum and magnetic braking within these stars as they prepare to make a second ascent of the RGB. Core helium burning occurs with a violent flash for stars less than ∼2 M⊙, or more gradually for higher-mass stars. Works such as Maeder & Meynet (2014) explore how the core of CHeB stars may spin down and impact surface activity levels. The notable recent work of Schröder et al. (2020) shows the first direct evidence of magnetic braking during the helium core burning phase. Through TIGRE high-resolution spectra they found that two Hyades, K-type, helium-core-burning giants are entering their blue loop. These two stars have more active chromospheres and coronae than two other observed Hyades giants which have already evolved onto the blue loop. This magnetic braking is a similar phenomena to that which occurs in cool main-sequence stars. Hence, it is of particular interest to investigate the activity levels of giant stars which are burning helium in their cores.
High-resolution spectroscopy is often used to trace activity levels in the chromosphere and transition region. For example, Ca ii emission, which originates in the chromosphere, has been a prime tool among both giant and main-sequence stars since the Fraunhofer H and K lines are dark in the photosphere. Upon proceeding to shorter wavelengths in the mid-ultraviolet to FUV for FGK stars, photospheric flux is also reduced. The reduction allows chromospheric emission lines to be illuminated with greater contrast. FUV brightness, as measured by the Galaxy Evolution Explorer (GALEX) satellite, has been found to trace both Ca ii H and K emission lines, and hence chromospheric activity among dwarf stars (Smith & Redenbaugh 2010; Findeisen et al. 2011; Crandall et al. 2020), as well as soft X-ray emission (Smith et al. 2017), which is a tracer of coronal activity (see, e.g., Pizzolato et al. 2003; Jackson et al. 2012; Booth et al. 2017). Such results for main-sequence stars motivate an analogous study focusing on a GALEX-based FUV color of giant stars. In a previous paper, Smith (2018) documented correlations between (FUV − B) color and the strength of the λ2800 Mg ii h and k emission lines for giant stars. The present paper seeks to extend a comparison of FUV-based colors against other measures of red giant activity.
This work considers four indicators of the atmospheric activity of giant stars of late spectral type: Mg ii
h and k emission lines, X-ray emission, FUV emission, and  rotation estimates. In Section 2 we lay out the sample of giant stars and their properties for which we have compiled data on the FUV, X-ray, and Mg ii activity indicators. Section 3 demonstrates a clear relationship between X-ray luminosity as a coronal activity indicator and Mg ii emission as a chromospheric activity indicator. Section 4 examines the activity levels of red giant stars as seen in the FUV and X-ray using GALEX and ROentgen SATellite (ROSAT) space telescope observations. Within that section we investigate the differences in X-ray and FUV observations as tracers of giant star surface activity. Following that the Hyades giants are specifically addressed. To complete the work, in Section 6 we attempt to constrain the activity–rotation relation of giants using FUV and
  data, a relationship which proves to be elusive despite clear activity indication variances in our sample. A conclusion is given in Section 7.
2. Red Giant Sample
Our initial step was to select a sample of giant stars for which soft X-ray data were available. We have used the Hünsch et al. (1998b) catalog of 450 giants and supergiants detected in the ROSAT All-Sky Survey (RASS). Hünsch et al. (1998b) first selected 3839 stars of spectral types A, F, G, K, M, and C, and luminosity classes I, II, III, or intermediate classes within the Bright Star Catalogue (BSC; Hoffleit & Warren 1991). They cross-matched positions of these BSC giants and supergiants with the RASS in order to detect locations with X-ray emission. The reader is referred to Hünsch et al. (1998b) for details on how their cross-matching was done. The result was 450 giants and supergiants with ROSAT X-ray observations. Individual X-ray luminosities were not calculated in the Hünsch et al. (1998b) compilation due to a lack of precise parallaxes. Instead, the X-ray-to-bolometric flux ratio is quoted. This ratio is used within our work as a measure of coronal brightness. This Hünsch et al. (1998b) sample of giants and supergiants was further narrowed down for the needs of each proceeding section.
In Section 3 we cross-matched by HD number the ROSAT compilation of red giant detections from Hünsch et al. (1998b) with a sample with Mg ii h and k stellar surface flux measurements (Pérez Martínez et al. 2011). With this cross-matched sample we compare soft X-ray and chromospheric activity as indicators of stellar activity.
In Section 4 the Hünsch et al. (1998b) catalog was cross-matched with the GALEX source catalog to compile a sample of giants with soft X-ray and FUV magnitude measurements. The GALEX GR6/7 database was searched for FUV sources that could be identified with the R.A. and decl. of the stars in the ROSAT source list of Hünsch et al. (1998b). A search radius of 8'' was used about each star in Hünsch et al. (1998b). The search radius used is unrelated to the aperture through which the GALEX GR6/7 FUV magnitudes were derived. Searches were centered upon the J2000 coordinates of each ROSAT-detected giant, this being very similar to the eras in which the ROSAT and GALEX observatories were operational (1990–1999 and 2003–2013, respectively). This sample was then used to compare soft X-ray and FUV magnitude measurements as stellar activity indicators.
We have also made use of a separate ensemble of red giants for which Massarotti et al. (2008) derived projected rotation velocities from high-resolution, ground-based optical spectra. In Section 6 we utilize this red giant sample by cross-matching with GALEX according to the process described in the previous paragraph. The resulting sample allows a comparison between rotational velocity and ultraviolet (UV) magnitudes as stellar activity indicators.
3. Mg ii λ2800 Emission and X-Ray Activity Indicators of Giants
A commonly used indicator of stellar activity among red giant stars is the pair of λ2800 Mg ii h and k chromospheric emission lines. Pérez Martínez et al. (2011) studied a sample of red giants for which high-resolution spectra of these lines are available in the archives of the IUE satellite. They derived the flux arriving at Earth in the combined Mg ii h and k emission lines from the flux-calibrated IUE archive spectra. This observed flux was converted to a flux at the stellar surface. Their approach yielded two values of this stellar surface flux, since they calculated two values of stellar effective temperature, Teff, one based on the observed (V − K) color and a second based on the (B − V) color. They also applied appropriate bolometric corrections to the V and K magnitudes in order to get two values for the bolometric luminosity. In this section we adopt a mean of the two surface flux determinations made by Pérez Martínez et al. (2011) and denote this as FMg II . Furthermore, the ratio of the Mg ii h and k surface flux to the bolometric surface flux was calculated for each star according to

using the mean of the two effective temperature values from Pérez Martínez et al. (2011). Equation (1) can be rewritten in a form that is more practical for present purposes, namely

where fMg II denotes the value of the Mg ii h and k stellar surface flux as given by Pérez Martínez et al. (2011) in units of milliwatts per square meter. Equation (2) was used to calculate a flux ratio (FMg II /Fbol) for those red giants considered in this section.
Cross-matching the ROSAT compilation of red giant detections from Hünsch et al. (1998b; see Section 2) with the sample covered by Pérez Martínez et al. (2011) gives the stars listed in Table 1, wherein the HD number and the designation by constellation are listed. Both the  and
and  stellar activities are listed together with (B − V) color and the absolute visual magnitude. The values of (B − V) color in Table 1 are those given by Pérez Martínez et al. (2011), while absolute visual magnitudes, MV
, were calculated by combining V magnitudes from Mermilliod et al. (1997) with stellar parallaxes obtained from the SIMBAD database (Wenger et al. 2000). Most of the parallaxes given by SIMBAD for the stars in Table 1 come in turn from the Gaia Data Release 2 (DR2; Gaia Collaboration et al. 2018a), although some are from the Tycho-Gaia Astrometric Solution (Gaia Collaboration et al. 2016) or Hipparcos (van Leeuwen 2007). Binarity is often addressed as a concern when interpreting the activity levels of FGK giants in particular. Information on the binary status of each star is codified in Table 1 according to the following convention: "n" indicates stars not noted from a SIMBAD query to be a binary, "D" corresponds to a star that is listed in one or more double star catalogs but which is not designated as a spectroscopic binary in SIMBAD, "SB" indicates those stars that are listed as spectroscopic binaries in SIMBAD, while chromospherically active RS CVn stars are separately identified. The list in Table 1 also contains one long-period variable (LPV), a flare star (HD 133208), a BY Dra variable (HD 203387), the rotationally variable (Ro) star HD 111812, and one Cepheid (HD 102350), which itself is a member of a binary system. The majority of stars listed in Table 1 are members of a binary system. We are presuming that this reflects a propensity for proposers of IUE time to favor active giants as opposed to chromospherically quiet evolved stars.
stellar activities are listed together with (B − V) color and the absolute visual magnitude. The values of (B − V) color in Table 1 are those given by Pérez Martínez et al. (2011), while absolute visual magnitudes, MV
, were calculated by combining V magnitudes from Mermilliod et al. (1997) with stellar parallaxes obtained from the SIMBAD database (Wenger et al. 2000). Most of the parallaxes given by SIMBAD for the stars in Table 1 come in turn from the Gaia Data Release 2 (DR2; Gaia Collaboration et al. 2018a), although some are from the Tycho-Gaia Astrometric Solution (Gaia Collaboration et al. 2016) or Hipparcos (van Leeuwen 2007). Binarity is often addressed as a concern when interpreting the activity levels of FGK giants in particular. Information on the binary status of each star is codified in Table 1 according to the following convention: "n" indicates stars not noted from a SIMBAD query to be a binary, "D" corresponds to a star that is listed in one or more double star catalogs but which is not designated as a spectroscopic binary in SIMBAD, "SB" indicates those stars that are listed as spectroscopic binaries in SIMBAD, while chromospherically active RS CVn stars are separately identified. The list in Table 1 also contains one long-period variable (LPV), a flare star (HD 133208), a BY Dra variable (HD 203387), the rotationally variable (Ro) star HD 111812, and one Cepheid (HD 102350), which itself is a member of a binary system. The majority of stars listed in Table 1 are members of a binary system. We are presuming that this reflects a propensity for proposers of IUE time to favor active giants as opposed to chromospherically quiet evolved stars.
Table 1. Cross-matched Sample with ROSAT Observations and Mg ii h and k Measurements
| HD |

|

| (B − V) | MV | Binarity a | Name |
|---|---|---|---|---|---|---|
| 1522 | −6.94 | −5.2 | 1.19 | −1.08 | D | ι Cet |
| 3627 | −7.03 | −5.3 | 1.26 | 0.71 | SB | δ And |
| 4128 | −5.39 | −4.7 | 1.01 | −0.32 | n | β Cet |
| 4502 | −4.81 | −4.0 | 1.08 | 0.24 | RS CVn | ζ And |
| 9746 | −4.40 | −3.6 | 1.20 | −0.06 | RS CVn | OP And |
| 13480 | −4.58 | −4.2 | 0.74 | 0.20 | SB, CABS | ι Tri |
| 17506 | −6.70 | −5.2 | 1.56 | −3.39 | D | η Per |
| 19476 | −6.88 | −5.1 | 0.97 | 1.11 | D | κ Per |
| 27371 | −5.59 | −4.1 | 0.97 | 0.17 | D | γ Tau |
| 27697 | −6.87 | −5.0 | 0.97 | 0.36 | SB | δ Tau |
| 28305 | −7.01 | −5.1 | 1.00 | 0.27 | D |
 Tau Tau |
| 28307 | −5.22 | −4.7 | 0.94 | 0.46 | SB | θ1 Tau |
| 40409 | −6.79 | −5.2 | 1.01 | 2.55 | n | 36 Dor |
| 42995 | −7.20 | −5.1 | 1.57 | −2.08 | SB | η Gem |
| 62044 | −4.08 | −3.8 | 1.11 | 1.44 | RS CVn | σ Gem |
| 62345 | −6.54 | −5.1 | 0.92 | 0.39 | D | κ Gem |
| 62509 | −7.73 | −5.1 | 0.99 | 1.07 | D | β Gem |
| 71369 | −6.44 | −5.1 | 0.84 | −0.33 | D | o UMa |
| 82210 | −4.46 | −4.2 | 0.77 | 2.05 | RS CVn | 24 UMa |
| 84441 | −7.00 | −4.7 | 0.78 | −1.42 | n |
Leo |
| 93497 | −5.16 | −4.5 | 0.89 | −0.09 | D | μ Vel |
| 93813 | −7.00 | −5.2 | 1.22 | −0.11 | n | ν Hya |
| 102350 | −6.58 | −4.9 | 0.85 | −1.29 | D, Cepheid | – |
| 106677 | −3.96 | −3.9 | 1.10 | 0.45 | RS CVn | DK Dra |
| 108907 | −6.53 | −5.2 | 1.56 | −1.44 | SB | 4 Dra |
| 109379 | −7.44 | −5.1 | 0.88 | −0.60 | n | β Crv |
| 111812 | −4.48 | −4.4 | 0.65 | 0.19 | Ro | 31 Com |
| 113226 | −6.47 | −5.0 | 0.92 | 0.20 | D |
Vir |
| 115659 | −6.02 | −5.1 | 0.91 | −0.07 | SB | γ Hya |
| 133208 | −6.76 | −5.2 | 0.93 | −0.68 | Flare | β Boo |
| 141714 | −4.91 | −4.3 | 0.78 | 1.04 | RS CVn | δ CrB |
| 147675 | −5.27 | −4.6 | 0.91 | 0.48 | n | γ Aps |
| 148387 | −7.62 | −5.1 | 0.90 | 0.47 | n | η Dra |
| 148856 | −6.50 | −5.1 | 0.93 | −0.37 | SB | β Her |
| 150798 | −6.92 | −5.0 | 1.41 | −3.48 | D | α TrA |
| 150997 | −6.58 | −4.7 | 0.90 | 0.88 | D | η Her |
| 153751 | −4.86 | −4.4 | 0.86 | −0.62 | RS CVn |
UMi |
| 159181 | −5.90 | −4.4 | 0.92 | −2.53 | D | β Dra |
| 163993 | −4.95 | −4.7 | 0.92 | 0.58 | LPV | ξ Her |
| 203387 | −4.94 | −4.5 | 0.87 | 0.38 | BY Dra | ι Cap |
| 205435 | −5.18 | −4.5 | 0.87 | 1.11 | n | ρ Cyg |
| 211416 | −7.08 | −4.6 | 1.37 | −1.08 | SB | α Tuc |
| 216489 | −4.02 | −3.0 | 1.10 | 0.98 | RS CVn | IM Peg |
| 218356 | −5.23 | −3.4 | 1.23 | −1.55 | SB | 56 Peg |
Note.
a n: not listed as a binary star in SIMBAD; CABS: chromospherically active binary; D: in one or more double star catalogs but not listed as spectroscopic binary in SIMBAD; LPV: long-period variable; Ro: rotationally variable; SB: listed as spectroscopic binary in SIMBAD.Download table as: ASCIITypeset image
The soft X-ray luminosity normalized to the bolometric luminosity is plotted in Figure 1, versus an analogous flux ratio for the Mg ii
h and k emission lines. Symbols in the figure depict the binarity status, as described in the figure caption. A correlation is evident, albeit with some considerable scatter. The most X-ray luminous giants are the RS CVn stars, which also exhibit strong Mg ii
h and k emission. Most of the other giants in the sample with  are binaries or other exotica, although there are two giants in this X-ray regime that are not known binaries and which evince slightly enhanced Mg ii
h and k emission. Many of the stars in Figure 1 are relatively quiet with
are binaries or other exotica, although there are two giants in this X-ray regime that are not known binaries and which evince slightly enhanced Mg ii
h and k emission. Many of the stars in Figure 1 are relatively quiet with  and
and  . Among the giants in this "quiet" category, there is no correlation between the two activity indicators, although there is a range in normalized X-ray flux of more than a factor of 10 at a given (FMg II
/Fbol). Giants with intermediate levels of λ2800 Mg ii emission, such that
. Among the giants in this "quiet" category, there is no correlation between the two activity indicators, although there is a range in normalized X-ray flux of more than a factor of 10 at a given (FMg II
/Fbol). Giants with intermediate levels of λ2800 Mg ii emission, such that  , are rather interesting since they have very little difference in Mg emission but almost a factor of 100 spread in normalized X-ray flux.
1
Much of the correlation in Figure 1 is driven by giants with high levels of activity for which
, are rather interesting since they have very little difference in Mg emission but almost a factor of 100 spread in normalized X-ray flux.
1
Much of the correlation in Figure 1 is driven by giants with high levels of activity for which  , and many of these stars are RS CVn variables or spectroscopic binaries for which enhanced rotation is anticipated. It seems that (i) relatively high-activity stars contribute much of the correlation seen in Figure 1, and (ii) there can be a large range in
  among giants with comparable Mg ii
h and k emission and (B − V) color.
among giants with comparable Mg ii
h and k emission and (B − V) color.
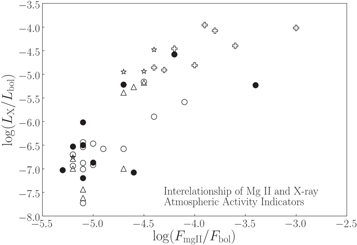
Figure 1. Soft X-ray luminosity  vs.
vs.  for giant stars in Table 1. Symbols pertain to binarity as follows. Open triangle: star not listed to be a binary by SIMBAD. Open circle: double star according to SIMBAD. Filled circle: spectroscopic binary. Plus symbol: RS CVn star. Five-point star: other type of variable.
Download figure:
Standard image High-resolution image4. Activity of Giants in the Far-ultraviolet and X-Ray
In addition to investigating Mg ii h and k emission as a chromospheric activity indicator, this paper also seeks to demonstrate the chromospheric activity levels of giant stars with the use of FUV photometry. We make use of GALEX FUV magnitude observations. The primary goal of the GALEX mission was to observe UV luminosity functions of external galaxies and investigate their star formation histories (see Martin et al. 2005; Salim et al. 2005; Treyer et al. 2005). Coincidently, the telescope also observed a plethora of stars, including giants, within the Milky Way. As such, we cross-matched the Hünsch et al. (1998b) sample of 450 giants with the GALEX GR6/7 data release, as described in Section 2, and collected FUV magnitude measurements through the Mikulski Archive for Space Telescopes (Conti et al. 2011). We refer to our resulting sample as the GALEX-ROSAT cross-matched sample.
The activity–FUV relationship for FGK main-sequence stars, as observed and calibrated by Smith & Redenbaugh (2010) and Crandall et al. (2020), is dependent on (B − V) color. A similar circumstance might be expected for red giants, thereby requiring an optical color sensitive to photospheric temperature in addition to the abovementioned FUV photometry data. Throughout this section we use either Gaia colors or Johnson (B − V) for this purpose. The Gaia catalog is widely accessible and is often used as the new standard due to its unprecedented precision in measurement.
4.1. A ROSAT-GALEX Cross-matched Sample of Giants
As noted above, we have cross-matched the Hünsch et al. (1998b) sample of ROSAT-detected giant stars with FUV sources in the GALEX GR6/7 catalog. We further cross-matched this sample with Gaia Data Release 2 data to find those stars with green and blue photometry, amounting to 191 giants. These stars are listed in Table 2 with their HD identifiers, GALEX FUV GR6/7 magnitude, Gaia green and blue magnitudes, and ROSAT X-ray luminosities. Johnson BV photometry is also available for these stars from a variety of sources including the paper of Hünsch et al. (1998b) and various Hipparcos catalogs.
Uncertainties in the Gaia photometry are derived from data in the Gaia catalog. Magnitude errors are not directly listed within the catalog because they are asymmetric. The asymmetry does not impact the overall conclusions of this work. As such, we used the formula

to calculate the standard deviation of Gaia magnitudes, where F is the observed flux and  is the zero-point error (Jordi 2018). The calculated errors in the Gaia magnitudes are listed in Table 2. Most are comparatively small with respect to the plot scales that are used in Figures 2–5. The Vega magnitude zero-point errors estimated by the Gaia Collaboration are σG
=0.0018 mag,
is the zero-point error (Jordi 2018). The calculated errors in the Gaia magnitudes are listed in Table 2. Most are comparatively small with respect to the plot scales that are used in Figures 2–5. The Vega magnitude zero-point errors estimated by the Gaia Collaboration are σG
=0.0018 mag,  mag, and
  mag.
mag.

Figure 2. A Hertzsprung–Russell diagram of the ROSAT-GALEX red giant sample as obtained from Gaia photometry and parallaxes: the Gaia absolute G magnitude vs. the (GBP − GRP ) color which covers the full wavelength range of the Gaia photometric system. Stars to the left of (GBP − GRP ) ⪅ 0.8 mag are close to the main sequence, while stars to the right of this dividing line comprise the red giant sample used in this work. Error bars are Gaia magnitude uncertainties.
Download figure:
Standard image High-resolution image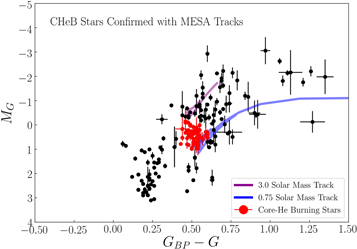
Figure 3. A Hertzsprung–Russell diagram of the red giant sample as derived from Gaia data. By comparison with Figure 2 the color plotted here is (GBP − G). Red dots denote the CHeB stars suggested by the MESA evolutionary tracks, which are plotted as solid lines. The 0.75 M⊙ (blue) and 3.0 M⊙ (purple) lines include the CHeB segments of the evolutionary tracks, which form a boundary around those stars that are presumed here to be in the core-helium-burning phase of evolution. Error bars are Gaia magnitude uncertainties.
Download figure:
Standard image High-resolution image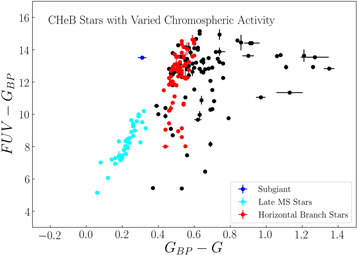
Figure 4. An FUV–optical two-color diagram of the red giant sample with ROSAT X-ray data plus GALEX FUV and Gaia photometry. The FUV-based color (FUV − GBP ) is plotted vs. optical (GBP − G). The red circles denote horizontal branch CHeB stars as inferred from MESA evolutionary tracks. There is a range in the (FUV − GBP ) color of the CHeB stars suggestive of a range in chromospheric activity. The dark blue symbol corresponds to an inactive subgiant. The cyan symbols refer to late-main-sequence stars. Both cyan and blue symbols refer to pre-red giant branch stars.
Download figure:
Standard image High-resolution image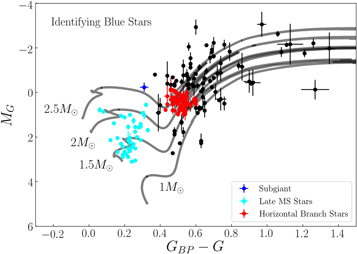
Figure 5. MESA evolutionary tracks of 1, 1.5, 2, and 2.5 solar masses over-plot on CHeB stars (red) and two sets of bluer stars. The cyan points likely depict lower mass stars which are exiting the main sequence and evolving toward the red giant branch. The blue point corresponds to a more massive subgiant in the evolutionary sense. Error bars are Gaia magnitude uncertainties.
Download figure:
Standard image High-resolution imageThe stars in Table 2 have quite bright Gaia magnitudes. They fall in a magnitude range where the later eDR3 photometry constitutes a significant improvement over DR2 (Riello et al. 2021). One star is particularly commented upon below for which there is a noted difference between DR2 and eDR3 photometry.
Errors associated with GALEX FUV magnitudes were looked at in two ways. The GR6/7 data release lists formal uncertainties in FUV magnitude for the stars in our GALEX-ROSAT cross-matched sample. These have been entered into the column labeled (FUV) in Table 2. The average value of (FUV) among all stars in Table 2 is av(FUV) = 0.07 mag, while the standard deviation is 0.07 mag. We take this average to be representative of the 1σ uncertainty in FUV mag for the giants in Table 2.
In a second approach uncertainties were considered by applying small number statistics to data for any star with multiple GALEX FUV magnitude measurements listed in the GR6/7 Data Release. The FUV error analysis was based on Table 1 of Keeping (1962), in which for a given small sample of measurements of a quantity, the standard deviation is computed as the ratio of the range among the measurements and a constant value given in the table as a function of sample size. These uncertainty estimates, denoted σ(FUV), range from 0.01 to 0.48 mag. Many stars in the GALEX-ROSAT cross-match sample, however, do not have estimates of this FUV magnitude error, as there were only 78 giants with multiple FUV measurements listed in GR6/7. As such, the average value, av(FUV), is used for error bars shown in certain figures accompanying this section. These uncertainties av(FUV) tend to be smaller than those computed on the basis of the small-sample statistics approach, which may be some indication that there is intrinsic variability among the FUV magnitudes of red giant stars. Any such variability would introduce scatter into our attempts to correlate the FUV excess against soft X-ray activity.
We are interested in exploring GALEX FUV photometry as an indicator of stellar activity in red giants. In order to facilitate this effort we have formulated two combined FUV–optical colors: (FUV − GBP ) from a combination of GALEX FUV and Gaia photometry, and (FUV − B) from combining GALEX and Johnson photometry. It is this second color that was calibrated as an activity and age indicator for FGK main-sequence stars by Crandall et al. (2020). In the next subsections we attempt to place the GALEX-ROSAT cross-matched giants into the context of various color–magnitude diagrams, following which trends between measures of FUV and X-ray activity are searched for.
4.2. Gaia Color–Magnitude Diagrams for the ROSAT-GALEX Giant Sample
Figure 2 presents a photometric HR diagram of the crossed-matched ROSAT-GALEX sample of giant stars in which Gaia eDR3 (Gaia Collaboration et al. 2018a) observations are used to provide magnitude and color data. Herein, MG is the Gaia green absolute magnitude obtained using Gaia parallaxes while the photospheric color plotted is (GBP − GRP ). The sample can be divided into two main groups with a gap around (GBP − GRP ) = 0.8 mag. To the left of this gap are stars belonging to a main-sequence population, or else are very slightly post-main sequence, whereas the red giants are to the right. This figure is similar to that of Figure 10 in the Gaia Collaboration's paper on the HR diagram (Gaia Collaboration et al. 2018b), although our sample is much smaller. The HR diagram from the Gaia Collaboration is particularly useful due to it being extensively populated by stars in the CHeB phase of evolution. A comparison with Figure 2 reveals that a large fraction of the stars in our ROSAT-GALEX giant sample are also likely to be in this stage of evolution. This is in contrast to stars ascending the RGB for the first or second time.
The stars plotted in Figure 2 are also shown in a different version of the HR diagram in Figure 3 in which MG is plotted versus the (GBP − G) color. We will employ this particular Gaia color below as it is most analogous to the Johnson (B − V) color that we will also use in several following sections.
4.3. Identifying Core-helium-burning Stars
As noted above, the red giant sample discussed in Section 4.2 contains CHeB stars. We have identified candidates for CHeB stars in Figure 3 through a comparison with Modules for Experiments in Stellar Astrophysics (MESA) evolutionary tracks (Paxton et al. 2011, 2013, 2015; Choi et al. 2016; Dotter 2016). The CHeB stars were expected to fall within 0.4 ⪅ (GBP − G) ⪅ 0.8 mag and −1.0 ⪅ MG ⪅ 1.0 mag. We plotted a range of MESA models and concluded that CHeB stars are bound by the 0.75 M⊙ and 3.0 M⊙ evolutionary tracks, as represented by the blue and purple lines in Figure 3, respectively. The red dots between these tracks in Figure 3 are identified as candidate CHeB stars.
4.4. A GALEX-Gaia Two-color Diagram
Chromospheric emission is greatly dominated by photospheric flux at most optical wavelengths. However, FUV broadband photometry is sensitive to chromospheric and transition-region flux, including that from emission lines. Thus, a color such as (FUV − GBP ) is expected to be sensitive to stellar activity. Figure 4 shows a two-color plot of (FUV − GBP ) versus (GBP − G) for the ROSAT-GALEX red giants selected for this work. The red symbols denote the Population I equivalent of horizontal branch stars (from Figure 3) that are likely burning helium in their cores. There is a notable range of (FUV − GBP ) color among these CHeB stars, suggestive of a range in chromospheric activity levels.
In Figure 4 there is a group of bluer stars with a clear separation of activity levels. These stars have been plotted along with MESA evolutionary tracks in Figure 5 to identify their evolutionary phase. Both Figures 4 and 5 depict this set of stars with cyan points. This population is comprised of late-main-sequence and post-main-sequence stars, which have relatively blue FUV colors. The dark blue point in the figure corresponds to the most massive star of this group, and appears to be a subgiant which falls near a pre-RGB segment of the 2.5 M⊙ evolutionary track (although its luminosity is comparable to that of redder RGB stars). As shown in Figure 4, this subgiant is relatively inactive based on the (FUV − GBP ) color, indicating that it has evolved and spun down. Both late-main-sequence stars and the proposed subgiant are blueward of the evolutionary tracks marking the RGB region of the HR diagram.
Figure 6 shows the distribution of (B − V) measurements for the subgiant and late-main-sequence stars in our cross-matched ROSAT-GALEX sample. The majority of these stars have (B − V) ≤ 0.55 mag. As such, the photospheric flux likely impacts the utility of their FUV magnitude as an indicator of chromospheric activity. We note a color discrepancy for the subgiant star (dark blue in Figure 4). This star, HD 148374, has a Johnson color of (B − V) = 0.97 mag, but a Gaia DR2 color of (GBP − G) = 0.31 mag. However, Gaia eDR3 observations give a more consistent color of (GBP − G) = 0.16 for the subgiant.
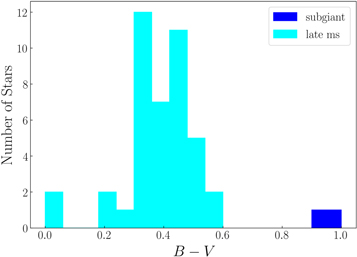
Figure 6. Distributions of (B − V) color for the subgiant and late-main-sequence stars in the ROSAT-GALEX cross-matched sample.
Download figure:
Standard image High-resolution image4.5. An FUV-excess Parameter
Crandall et al. (2020) calibrated a relationship involving FUV magnitude as an indicator of activity versus stellar age for dwarf stars. Their calibration was also dependent on Johnson (B − V) color. Dwarf stars with (B − V) ≤ 0.55 mag likely have significant photospheric contamination of the GALEX FUV band and so their calibration took an approach of defining an FUV-excess parameter from which photospheric contributions were empirically subtracted. A similar approach is taken here for giant stars.
To assist with quantifying chromospheric effects on FUV–optical colors of giant stars, the left panel of Figure 7 shows a two-color plot for a large sample of giant stars drawn from the rotational velocity study by Massarotti et al. (2008). Both GALEX FUV magnitudes and Johnson B and V magnitudes from the Hipparcos Input Catalogue were compiled for the Massarotti et al. (2008) sample. The stars observed by Massarotti et al. (2008) have a more extended coverage at redder (B − V) color than the ROSAT-GALEX cross-matched sample, which is plotted separately in the right panel of Figure 7.
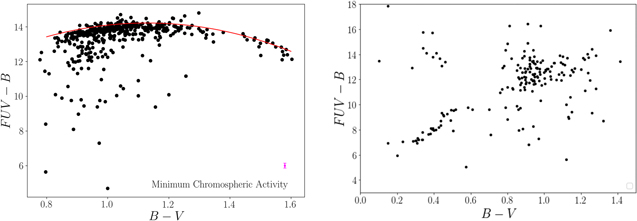
Figure 7. An (FUV − B, B − V) two-color diagram for the GALEX-ROSAT cross-matched sample of stars is shown in the right panel. In a separate (left) panel the set of red giants from Massarotti et al. (2008) with GALEX FUV and Johnson photometry is plotted. The red line in the left panel represents an empirically chosen two-color locus, defined in the text as u, which is taken to correspond to the (FUV − B) color as a function of (B − V) for red giants with minimal levels of chromospheric activity. It has been adapted so as to serve as an upper envelope to the data points from the Massarotti et al. (2008) sample. An error bar of length ±2av(FUV) = ±0.14 mag is shown (in magenta) in the left panel, as based on values of (FUV) from Table 2. These uncertainties likely dominate over the error in observed B magnitude, and are taken as 2σ error estimates for the (FUV − B) color. No upper-limit locus has been attempted in the right panel that plots the GALEX-ROSAT cross-matched stars. The function for u, based on the Massarotti et al. (2008) sample, is used herein between 0.8 ≤ (B − V) ≤ 1.6 for both samples.
Download figure:
Standard image High-resolution imageTo compare FUV and X-ray emission as activity indicators we first introduce a FUV-excess parameter, QFUV, based on the Massarotti et al. (2008) sample (see similar excess parameters defined in Findeisen et al. 2011, Smith et al. 2017, Crandall et al. 2020, and Dixon et al. 2020). Here QFUV is defined as

where B is the Johnson blue magnitude and u corresponds to an empirically chosen relation between (FUV − B) and (B − V) for red giants having minimal levels of chromospheric activity. This FUV-excess parameter is defined in such a way that the greater the FUV flux of a star the more negative is the value of QFUV. The minimum-activity locus of u versus (B − V) adopted here is plotted in Figure 7 as a red line, and it is intended to represent the boundary of minimum FUV activity for a given (B − V) color. The locus for u (mag) was estimated to fit the quadratic function

The giant sample of Massarotti et al. (2008) has been utilized here for defining the function u rather than the sample of Hünsch et al. (1998b), since the former is expected to be less biased with respect to stellar chromospheric and coronal activity. By contrast, the Hünsch et al. (1998b) sample is comprised of stars selected on the basis of being detected in an all-sky soft X-ray survey. As such, it might be weighted toward more active red giants, whereas we have sought to define the locus u on the basis of it being an upper envelope in Figure 7 to giants with the lowest levels of GALEX FUV-band emission. The Massarotti et al. (2008) sample has fewer stars in the color range 0.8 < (B − V) < 0.9 than across the redder domain of 0.9 < (B − V) < 1.2. As such, the locus used here for u may have more inherent uncertainty for giants with (B − V) < 0.90.
We have used Johnson BV photometry rather than Gaia photometry to define the FUV-excess parameter QFUV such that our following results for giant stars can be readily compared with the work of Crandall et al. (2020) for main-sequence stars. In the next subsection the baseline of Equation (5) is applied to the X-ray sample of giants of Hünsch et al. (1998b). Uncertainties in values of Q are expected to be dominated by uncertainties in the GALEX FUV magnitudes, since ground-based photoelectric B − V photometry often has uncertainties on the order of 0.01–0.02 mag. Since the B − V colors employed in this work come from several sources it is not straightforward to obtain a precise B − V uncertainty for the stars in Table 2.
Uncertainties in both (FUV − B) and QFUV can be addressed more specifically. An uncertainty σ(FUV−B) in the color (FUV − B) can be estimated from uncertainties σFUV and σB in the FUV and B magnitudes, respectively, as follows:

If we take the uncertainty σFUV for a star in Table 2 to be given by the value of (FUV) from that table, and assuming σB
= 0.02 mag, then estimates of σ(FUV−B) can be obtained for stars in Table 2. An average uncertainty can be had by setting σFUV = av(FUV) = 0.070 mag and, σB
= 0.020 mag, from which follows an average σ(FUV−B) = 0.073 mag. The uncertainty in the (FUV − B) color is therefore going to be typically dominated by measurement uncertainty in the GALEX FUV magnitude.
Error estimation for the QFUV excess parameter follows from

where σ(FUV−B) is calculated as in the previous paragraph. Since u is a function of (B − V), the term σu in Equation (7) is given by

with du/d[B − V] = − 14.72(B − V) + 16.62 from Equation (5). If we adopt σ(B−V) = 0.02 mag, then for a giant star with (B − V) = 1.0 mag it follows that σu = 0.04 mag. An average value for σQ can be calculated upon adopting σ(FUV−B) = 0.07 mag, as above, leading to an estimate of σQ = 0.08 mag. This estimate shows that the uncertainty in Q is dominated by uncertainty in the (FUV − B) color, from which it follows that σQ for the typical star in Table 2 is again dominated by uncertainty in the FUV magnitude.
4.6. An X-Ray and Far-ultraviolet Activity Comparison
We next compare the chromospheric activity parameter QFUV based on GALEX observations to coronal activity using the ROSAT sample of giants published by Hünsch et al. (1998b). Figure 8 shows the FUV-excess parameter QFUV versus X-ray-to-bolometric luminosity ratio,  , for the cross-matched sample. Not included are stars from Figure 5 with 0.0 ≤ (B − V) ≤ 0.6 mag, as this is a range in which we were unable to define the minimum chromospheric activity locus, u, in Figure 7. This limit excludes all of the late-main-sequence stars (cyan points), and reduces the sample size to one subgiant, 59 CHeB, and 79 other giant stars.
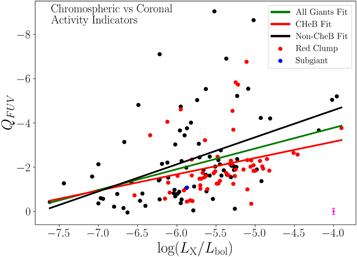
Figure 8. A comparison of chromospheric activity level, as denoted by the FUV-excess parameter QFUV, and coronal activity level, as traced by  . Stars in the CHeB phase (red points) and other giants (black points) show a range of both coronal and chromospheric activity levels. Correlations were fitted for three samples: all giants in the figure (green line), CHeB stars (red line), and non-CHeB giants (black line). A representative error bar of length ±2 av(FUV) = ±0.14 mag is included in the figure (magenta), which is based on the average of the values of (FUV) from Table 2. This uncertainty typically exceeds the error in B − V color by such an amount that it will approximate the uncertainty in the values of Q plotted here.
Download figure:
Standard image High-resolution imageCorrelations between QFUV and  in Figure 8 were constrained for three samples: all giants in the figure (green line), CHeB stars (red line), and other giants (black line). These fits take the form of

for the CHeB giants,

for the non-CHeB giants, and

for all giants in the figure. The rms scatter in QFUV about the fits to CHeB giants, non-CHeB giants, and the full sample in Figure 8 are 1.28, 1.76, and 1.60 mag, respectively. This scatter is considerable compared to the observational uncertainty in the FUV magnitude, which in turn dominates the uncertainty in QFUV. The fit parameters, the rms scatter about QFUV, as well as the Spearman correlation coefficient, ρ, and coefficient of determination are listed in Table 3. We note that these fits have significant errors due to the scatter in QFUV. There is also little correlation between QFUV and  , as is evident in the poor Spearman coefficients.
Table 2. GALEX Data for a ROSAT Giant Star Sample
| Name | GALEX | GALEX | Gaia | Gaia | Gaia | Gaia | ROSAT | |
|---|---|---|---|---|---|---|---|---|
| FUV | Q |
(FUV) | G | σG | GBP |

|

| |
| (mag) | (mag) | (mag) | (mag) | (mag) | (mag) | |||
| HD 1227 | 20.08 | −0.85 | 0.10 | 5.87 | 0.00 | 6.36 | 0.00 | −6.09 |
| HD 1522 | 18.38 | −0.56 | 0.05 | 3.08 | 0.01 | 3.94 | 0.01 | −6.94 |
| HD 1737 | 18.28 | −2.00 | 0.06 | 4.87 | 0.00 | 5.43 | 0.00 | −5.24 |
| HD 2630 | 14.65 | −1.85 | 0.01 | 6.04 | 0.00 | 6.26 | 0.00 | −5.35 |
| HD 4482 | 18.04 | −2.46 | 0.08 | 5.22 | 0.00 | 5.76 | 0.00 | −5.48 |
| HD 4502 | 15.21 | −4.19 | 0.02 | 3.68 | 0.00 | 4.39 | 0.01 | −4.81 |
| HD 4737 | 18.84 | −2.16 | 0.11 | 6.03 | 0.00 | 6.50 | 0.00 | −5.32 |
| HD 5516 | 17.78 | −1.54 | 0.06 | 4.05 | 0.01 | 4.64 | 0.01 | −5.31 |
| HD 6245 | 18.48 | −1.62 | 0.07 | 5.11 | 0.00 | 5.62 | 0.00 | −5.81 |
| HD 6559 | 19.15 | −2.29 | 0.11 | 5.82 | 0.00 | 6.39 | 0.00 | −5.31 |
| HD 6763 | 13.40 | −2.10 | 0.00 | 5.40 | 0.00 | 5.61 | 0.00 | −5.66 |
| HD 6793 | 17.38 | −2.64 | 0.04 | 5.09 | 0.00 | 5.59 | 0.00 | −4.51 |
| HD 7672 | 16.38 | −3.77 | 0.01 | 5.24 | 0.00 | 5.78 | 0.01 | −3.9 |
| HD 8634 | 14.98 | −2.26 | 0.01 | 6.06 | 0.00 | 6.32 | 0.00 | −5.19 |
| HD 8829 | 12.92 | −2.85 | 0.01 | 5.41 | 0.00 | 5.61 | 0.00 | −5.77 |
| HD 8921 | 19.89 | −1.52 | 0.13 | 5.72 | 0.00 | 6.45 | 0.01 | −6.11 |
| HD 9774 | 18.85 | −1.40 | 0.13 | 4.98 | 0.00 | 5.53 | 0.00 | −6.23 |
| HD 10072 | 18.04 | −1.63 | 0.08 | 4.73 | 0.00 | 5.25 | 0.00 | −5.34 |
| HD 10308 | 15.98 | −1.36 | 0.02 | 6.09 | 0.00 | 6.34 | 0.00 | −4.6 |
| HD 10588 | 18.59 | 7.41 | 0.09 | 6.07 | 0.00 | 6.55 | 0.00 | −5.1 |
| HD 11025 | 14.86 | −5.73 | 0.02 | 5.40 | 0.00 | 5.91 | 0.00 | −5.22 |
| HD 11559 | 17.99 | −1.53 | 0.05 | 4.30 | 0.00 | 4.85 | 0.00 | −5.65 |
| HD 11937 | 16.83 | −1.36 | 0.03 | 3.38 | 0.00 | 4.01 | 0.01 | −4.92 |
| HD 12055 | 13.65 | −5.82 | 0.01 | 4.53 | 0.00 | 5.06 | 0.00 | −5.25 |
| HD 12173 | 13.25 | 2.18 | 0.01 | 6.16 | 0.00 | 6.24 | 0.00 | −5.79 |
| HD 12641 | 16.89 | −3.69 | 0.01 | 5.70 | 0.00 | 6.18 | 0.00 | −5.28 |
| HD 15889 | 19.56 | −1.89 | 0.16 | 5.98 | 0.00 | 6.53 | 0.00 | −5.15 |
| HD 15920 | 18.63 | −1.18 | 0.07 | 4.88 | 0.00 | 5.40 | 0.00 | −5.7 |
| HD 16058 | 18.60 | −0.56 | 0.11 | 4.41 | 0.00 | 5.67 | 0.01 | −5.91 |
| HD 16161 | 18.66 | −0.79 | 0.10 | 4.58 | 0.01 | 5.11 | 0.00 | −5.99 |
| HD 16246 | 15.15 | −2.18 | 0.01 | 6.38 | 0.00 | 6.62 | 0.00 | −4.28 |
| HD 16327 | 15.57 | −2.10 | 0.02 | 6.07 | 0.00 | 6.33 | 0.00 | −5.14 |
| HD 17006 | 18.86 | −1.89 | 0.07 | 5.86 | 0.00 | 6.33 | 0.00 | −4.98 |
| HD 17824 | 18.28 | −1.25 | 0.07 | 4.45 | 0.00 | 5.02 | 0.00 | −5.49 |
| HD 18953 | 18.38 | −1.84 | 0.03 | 5.06 | 0.00 | 5.57 | 0.00 | −4.82 |
| HD 19926 | 13.95 | −6.90 | 0.01 | 5.11 | 0.00 | 5.80 | 0.00 | −5.37 |
| HD 20313 | 14.09 | −0.94 | 0.02 | 5.59 | 0.00 | 5.77 | 0.00 | −5.93 |
| HD 21024 | 14.92 | −1.77 | 0.02 | 5.39 | 0.00 | 5.65 | 0.00 | −5.45 |
| HD 22231 | 20.56 | −0.44 | 0.22 | 5.34 | 0.00 | 5.93 | 0.00 | −5.87 |
| HD 23838 | 14.91 | −4.73 | 0.01 | 5.42 | 0.00 | 5.86 | 0.00 | −5.4 |
| HD 24497 | 11.83 | −9.04 | 0.00 | 5.90 | 0.00 | 6.43 | 0.00 | −5.52 |
| HD 26076 | 20.82 | −0.34 | 0.22 | 5.76 | 0.00 | 6.29 | 0.00 | −5.05 |
| HD 26575 | 19.69 | −2.02 | 0.11 | 6.12 | 0.00 | 6.69 | 0.00 | −5.51 |
| HD 27022 | 17.72 | −1.83 | 0.05 | 5.02 | 0.00 | 5.48 | 0.00 | −5.0 |
| HD 28525 | 14.60 | −5.54 | 0.02 | 5.42 | 0.00 | 5.90 | 0.00 | −5.09 |
| HD 31553 | 18.65 | −2.47 | 0.09 | 5.41 | 0.00 | 6.06 | 0.00 | −5.58 |
| HD 31910 | 15.83 | −3.02 | 0.02 | 3.69 | 0.00 | 4.29 | 0.01 | −6.02 |
| HD 34172 | 19.11 | −1.60 | 0.12 | 5.57 | 0.00 | 6.07 | 0.00 | −5.99 |
| HD 34658 | 14.37 | −1.80 | 0.01 | 5.21 | 0.00 | 5.46 | 0.00 | −5.77 |
| HD 37434 | 17.27 | −4.22 | 0.04 | 5.76 | 0.00 | 6.40 | 0.00 | −4.93 |
| HD 37763 | 20.59 | 0.05 | 0.30 | 4.81 | 0.00 | 5.44 | 0.00 | −6.63 |
| HD 38645 | 19.25 | −1.89 | 0.09 | 5.97 | 0.00 | 6.46 | 0.00 | −5.25 |
| HD 39070 | 16.92 | −3.21 | 0.03 | 5.32 | 0.00 | 5.81 | 0.01 | −5.64 |
| HD 39523 | 18.18 | −1.65 | 0.06 | 4.13 | 0.00 | 4.78 | 0.00 | −5.63 |
| HD 39743 | 17.88 | −3.66 | 0.04 | 6.28 | 0.00 | 6.83 | 0.01 | −4.19 |
| HD 46730 | 13.81 | −2.33 | 0.01 | 6.19 | 0.00 | 6.39 | 0.00 | −6.09 |
| HD 47442 | 14.99 | −4.81 | 0.01 | 4.02 | 0.00 | 4.71 | 0.00 | −6.49 |
| HD 47703 | 16.54 | −1.63 | 0.02 | 6.33 | 0.00 | 6.62 | 0.00 | −5.54 |
| HD 50337 | 12.12 | −7.10 | 0.01 | 4.10 | 0.00 | 4.66 | 0.00 | −6.22 |
| HD 50522 | 15.10 | −3.75 | 0.01 | 4.19 | 0.01 | 4.58 | 0.00 | −5.87 |
| HD 51266 | 20.77 | −0.56 | 0.29 | 5.98 | 0.00 | 6.49 | 0.00 | −5.54 |
| HD 54719 | 19.62 | −0.14 | 0.12 | 3.95 | 0.01 | 4.69 | 0.01 | −6.68 |
| HD 57727 | 18.77 | −1.00 | 0.07 | 4.73 | 0.00 | 5.27 | 0.00 | −5.61 |
| HD 62141 | 19.60 | −1.47 | 0.11 | 5.99 | 0.00 | 6.49 | 0.00 | −5.69 |
| HD 62264 | 16.32 | −5.03 | 0.02 | 5.99 | 0.00 | 6.43 | 0.00 | −5.74 |
| HD 62898 | 19.09 | −0.24 | 0.14 | 4.34 | 0.00 | 5.42 | 0.00 | −6.40 |
| HD 68290 | 17.93 | −1.72 | 0.05 | 4.41 | 0.00 | 4.95 | 0.00 | −5.53 |
| HD 69148 | 18.43 | −1.98 | 0.09 | 5.48 | 0.00 | 5.96 | 0.00 | −5.88 |
| HD 71152 | 13.98 | −2.77 | 0.01 | 6.88 | 0.00 | 7.04 | 0.00 | −4.36 |
| HD 71369 | 17.01 | −0.80 | 0.05 | 3.03 | 0.00 | 3.77 | 0.01 | −6.44 |
| HD 71433 | 16.64 | −1.87 | 0.04 | 6.47 | 0.00 | 6.76 | 0.00 | −5.02 |
| HD 73596 | 14.64 | 3.70 | 0.01 | 6.10 | 0.00 | 6.33 | 0.00 | −5.89 |
| HD 74485 | 18.97 | −2.06 | 0.06 | 5.87 | 0.00 | 6.36 | 0.00 | −5.30 |
| HD 77996 | 18.74 | −1.61 | 0.06 | 4.58 | 0.00 | 5.26 | 0.00 | −5.58 |
| HD 78235 | 18.30 | −1.83 | 0.05 | 5.15 | 0.00 | 5.66 | 0.00 | −5.02 |
| HD 78668 | 18.65 | −2.02 | 0.08 | 5.50 | 0.00 | 6.01 | 0.00 | −5.06 |
| HD 79193 | 13.39 | −1.08 | 0.01 | 6.05 | 0.00 | 6.19 | 0.00 | −5.59 |
| HD 79940 | 14.27 | −1.63 | 0.01 | 4.45 | 0.00 | 4.76 | 0.00 | −6.31 |
| HD 80710 | 16.73 | −4.73 | 0.03 | 5.71 | 0.00 | 6.41 | 0.00 | −5.95 |
| HD 81799 | 18.18 | −1.87 | 0.08 | 4.32 | 0.00 | 4.97 | 0.00 | −5.66 |
| HD 81873 | 19.79 | −1.12 | 0.08 | 5.39 | 0.00 | 5.97 | 0.00 | −5.78 |
| HD 82210 | 16.56 | −2.05 | 0.03 | 4.28 | 0.00 | 4.76 | 0.00 | −4.46 |
| HD 82635 | 17.06 | −2.31 | 0.04 | 4.23 | 0.00 | 4.79 | 0.00 | −5.10 |
| HD 83108 | 15.07 | −2.36 | 0.02 | 6.37 | 0.00 | 6.60 | 0.00 | −5.29 |
| HD 84441 | 15.08 | −2.13 | 0.02 | 2.60 | 0.00 | 3.73 | 0.07 | −7.00 |
| HD 85206 | 18.29 | −3.05 | 0.12 | 5.53 | 0.00 | 6.22 | 0.00 | −5.72 |
| HD 85396 | 19.24 | −0.90 | 0.10 | 5.15 | 0.00 | 5.67 | 0.00 | −5.62 |
| HD 85945 | 18.06 | −2.57 | 0.07 | 5.71 | 0.00 | 6.20 | 0.00 | −4.46 |
| HD 87682 | 19.51 | −1.60 | 0.17 | 5.94 | 0.00 | 6.43 | 0.00 | −5.26 |
| HD 88639 | 18.17 | −2.37 | 0.07 | 5.82 | 0.00 | 6.30 | 0.01 | −4.85 |
| HD 88786 | 19.52 | 8.22 | 0.15 | 6.24 | 0.00 | 6.70 | 0.00 | −5.28 |
| HD 90071 | 13.64 | −2.23 | 0.01 | 6.16 | 0.00 | 6.35 | 0.00 | −5.25 |
| HD 91135 | 16.66 | −2.06 | 0.03 | 6.38 | 0.00 | 6.67 | 0.00 | −5.94 |
| HD 93813 | 18.12 | −0.36 | 0.06 | 2.79 | 0.03 | 3.71 | 0.03 | −7.00 |
| HD 95314 | 20.56 | −0.03 | 0.27 | 5.24 | 0.00 | 6.15 | 0.00 | −5.79 |
| HD 98233 | 20.48 | −1.24 | 0.26 | 6.43 | 0.00 | 6.93 | 0.00 | −5.28 |
| HD 99564 | 15.64 | −2.00 | 0.02 | 5.80 | 0.00 | 6.08 | 0.01 | −5.15 |
| HD 99967 | 19.50 | −2.20 | 0.14 | 5.91 | 0.00 | 6.61 | 0.01 | −6.12 |
| HD 100418 | 16.42 | −2.39 | 0.03 | 5.90 | 0.00 | 6.22 | 0.00 | −5.27 |
| HD 101107 | 13.64 | −1.80 | 0.01 | 5.44 | 0.00 | 5.67 | 0.00 | −6.04 |
| HD 101112 | 20.51 | −0.94 | 0.27 | 5.90 | 0.00 | 6.46 | 0.00 | −5.91 |
| HD 101132 | 13.77 | −1.98 | 0.01 | 5.53 | 0.00 | 5.75 | 0.00 | −5.42 |
| HD 101154 | 20.19 | −1.37 | 0.20 | 5.95 | 0.00 | 6.55 | 0.00 | −5.45 |
| HD 102070 | 17.59 | −2.15 | 0.08 | 4.37 | 0.00 | 4.96 | 0.00 | −6.19 |
| HD 103484 | 18.12 | −2.36 | 0.07 | 5.28 | 0.00 | 5.81 | 0.00 | −5.23 |
| HD 104438 | 19.43 | −1.29 | 0.16 | 5.26 | 0.00 | 5.85 | 0.00 | −6.11 |
| HD 106677 | 16.46 | −5.19 | 0.04 | 5.86 | 0.00 | 6.49 | 0.01 | −3.96 |
| HD 108225 | 19.42 | −0.57 | 0.09 | 4.72 | 0.00 | 5.26 | 0.00 | −6.15 |
| HD 109272 | 19.60 | −0.53 | 0.16 | 5.33 | 0.00 | 5.81 | 0.00 | −5.94 |
| HD 109379 | 16.08 | −1.26 | 0.03 | 2.25 | 0.00 | 7.51 | 0.41 | −7.44 |
| HD 112989 | 16.63 | −3.65 | 0.04 | 4.42 | 0.00 | 5.12 | 0.00 | −5.96 |
| HD 113049 | 19.05 | −2.03 | 0.14 | 5.70 | 0.00 | 6.26 | 0.00 | −5.27 |
| HD 113226 | 17.25 | −0.48 | 0.05 | 2.45 | 0.00 | 3.72 | 0.08 | −6.47 |
| HD 114474 | 19.60 | −0.88 | 0.11 | 4.90 | 0.00 | 5.50 | 0.01 | −5.97 |
| HD 115337 | 15.63 | −5.52 | 0.01 | 6.06 | 0.00 | 6.53 | 0.01 | −5.63 |
| HD 115659 | 17.14 | −0.68 | 0.05 | 2.62 | 0.00 | 3.52 | 0.03 | −6.02 |
| HD 117566 | 17.46 | −2.36 | 0.04 | 5.54 | 0.00 | 5.97 | 0.00 | −4.73 |
| HD 119458 | 16.43 | −4.05 | 0.03 | 5.75 | 0.00 | 6.21 | 0.00 | −6.12 |
| HD 120048 | 18.54 | −2.30 | 0.12 | 5.68 | 0.00 | 6.19 | 0.00 | −5.05 |
| HD 120064 | 14.38 | −3.27 | 0.01 | 5.82 | 0.00 | 6.12 | 0.00 | −5.03 |
| HD 122744 | 19.42 | −1.74 | 0.11 | 6.01 | 0.00 | 6.49 | 0.00 | −5.67 |
| HD 129312 | 17.52 | −2.44 | 0.05 | 4.53 | 0.01 | 5.10 | 0.00 | −5.71 |
| HD 130529 | 18.23 | −2.76 | 0.11 | 5.22 | 0.00 | 5.98 | 0.00 | −5.44 |
| HD 132813 | 15.72 | −3.13 | 0.02 | 3.09 | 0.02 | 4.95 | 0.02 | −6.67 |
| HD 133208 | 17.72 | −0.78 | 0.05 | 3.14 | 0.00 | 3.86 | 0.01 | −6.76 |
| HD 136138 | 13.95 | −6.75 | 0.01 | 5.39 | 0.00 | 5.94 | 0.00 | −5.11 |
| HD 136407 | 14.15 | −2.97 | 0.01 | 6.02 | 0.00 | 6.25 | 0.00 | −5.59 |
| HD 139906 | 17.90 | −2.34 | 0.07 | 5.60 | 0.00 | 6.06 | 0.00 | −5.81 |
| HD 141714 | 16.83 | −2.03 | 0.05 | 4.33 | 0.00 | 4.80 | 0.00 | −4.91 |
| HD 144208 | 11.40 | −6.83 | 0.00 | 5.60 | 0.00 | 5.97 | 0.00 | −5.53 |
| HD 147266 | 19.35 | −1.59 | 0.16 | 5.77 | 0.00 | 6.28 | 0.00 | −5.63 |
| HD 147675 | 16.80 | −1.87 | 0.04 | 3.52 | 0.00 | 4.16 | 0.01 | −5.27 |
| HD 148374 | 19.57 | −1.07 | 0.15 | 5.76 | 0.01 | 6.07 | 0.02 | −5.87 |
| HD 148387 | 17.10 | −0.42 | 0.05 | 2.48 | 0.02 | 3.22 | 0.02 | −7.62 |
| HD 150450 | 18.78 | −0.59 | 0.09 | 3.94 | 0.00 | 5.15 | 0.00 | −6.97 |
| HD 150682 | 14.42 | −2.22 | 0.01 | 5.80 | 0.00 | 6.03 | 0.00 | −5.31 |
| HD 150997 | 17.02 | −1.33 | 0.04 | 3.12 | 0.00 | 3.88 | 0.01 | −6.58 |
| HD 151087 | 13.54 | −1.78 | 0.01 | 5.94 | 0.00 | 6.12 | 0.00 | −5.28 |
| HD 151900 | 14.67 | −2.60 | 0.02 | 6.19 | 0.00 | 6.43 | 0.00 | −5.22 |
| HD 153956 | 20.44 | −0.97 | 0.16 | 5.69 | 0.00 | 6.31 | 0.00 | −6.03 |
| HD 154619 | 19.50 | −1.47 | 0.15 | 6.13 | 0.00 | 6.61 | 0.00 | −5.71 |
| HD 155103 | 13.04 | −1.94 | 0.01 | 5.28 | 0.00 | 5.50 | 0.00 | −6.21 |
| HD 156015 | 13.63 | 3.40 | 0.01 | 5.19 | 0.01 | 5.63 | 0.02 | −4.85 |
| HD 156266 | 19.37 | −0.72 | 0.14 | 4.39 | 0.01 | 4.99 | 0.00 | −6.54 |
| HD 156971 | 14.00 | −2.31 | 0.01 | 6.37 | 0.00 | 6.56 | 0.00 | −5.60 |
| HD 159181 | 14.39 | −3.44 | 0.01 | 2.38 | 0.00 | 3.35 | 0.03 | −5.90 |
| HD 161814 | 19.62 | −1.26 | 0.14 | 5.49 | 0.00 | 6.03 | 0.00 | −5.47 |
| HD 163217 | 18.27 | −2.27 | 0.09 | 4.76 | 0.00 | 5.44 | 0.00 | −5.94 |
| HD 165462 | 19.45 | −2.14 | 0.14 | 5.97 | 0.00 | 6.57 | 0.00 | −5.32 |
| HD 166208 | 17.66 | −2.12 | 0.05 | 4.71 | 0.00 | 5.23 | 0.00 | −5.45 |
| HD 168322 | 20.71 | −0.47 | 0.28 | 5.84 | 0.00 | 6.37 | 0.00 | −5.80 |
| HD 169836 | 19.81 | −0.99 | 0.14 | 5.46 | 0.00 | 5.99 | 0.00 | −5.10 |
| HD 175824 | 14.98 | −1.85 | 0.01 | 5.71 | 0.00 | 5.98 | 0.00 | −5.19 |
| HD 176598 | 18.43 | −2.13 | 0.10 | 5.35 | 0.00 | 5.88 | 0.00 | −5.30 |
| HD 180006 | 18.81 | −1.44 | 0.09 | 4.82 | 0.00 | 5.38 | 0.00 | −6.22 |
| HD 181597 | 21.16 | −0.49 | 0.31 | 5.99 | 0.00 | 6.59 | 0.00 | −5.83 |
| HD 184398 | 13.11 | −8.63 | 0.01 | 6.00 | 0.00 | 6.66 | 0.01 | −5.02 |
| HD 184492 | 18.16 | −2.31 | 0.06 | 4.71 | 0.00 | 5.37 | 0.00 | −5.47 |
| HD 187372 | 19.34 | −0.72 | 0.06 | 5.31 | 0.00 | 6.42 | 0.00 | −6.23 |
| HD 189831 | 19.61 | −0.21 | 0.12 | 4.20 | 0.00 | 5.04 | 0.00 | −6.80 |
| HD 190252 | 19.24 | −1.73 | 0.09 | 6.08 | 0.00 | 6.55 | 0.00 | −5.37 |
| HD 196385 | 13.63 | −2.59 | 0.01 | 6.29 | 0.00 | 6.48 | 0.00 | −5.65 |
| HD 196574 | 18.71 | −0.54 | 0.06 | 4.01 | 0.00 | 4.56 | 0.00 | −6.22 |
| HD 199253 | 19.46 | −1.05 | 0.11 | 4.84 | 0.00 | 5.46 | 0.00 | −5.88 |
| HD 199442 | 21.32 | −0.11 | 0.24 | 5.70 | 0.00 | 6.33 | 0.00 | −5.26 |
| HD 199532 | 14.40 | −2.46 | 0.01 | 4.93 | 0.00 | 5.26 | 0.00 | −4.45 |
| HD 199665 | 19.32 | −1.02 | 0.10 | 5.24 | 0.00 | 5.75 | 0.00 | −5.70 |
| HD 199951 | 17.28 | −2.08 | 0.04 | 4.37 | 0.00 | 4.90 | 0.00 | −5.02 |
| HD 200763 | 20.12 | −0.37 | 0.15 | 4.85 | 0.00 | 5.46 | 0.00 | −5.95 |
| HD 202951 | 19.86 | 0.02 | 0.08 | 5.19 | 0.00 | 6.25 | 0.01 | −5.81 |
| HD 203387 | 16.74 | −2.28 | 0.03 | 3.97 | 0.00 | 4.52 | 0.00 | −4.94 |
| HD 204960 | 19.95 | −0.82 | 0.13 | 5.26 | 0.00 | 5.83 | 0.00 | −6.04 |
| HD 207964 | 14.35 | −2.14 | 0.01 | 5.81 | 0.00 | 6.03 | 0.00 | −4.92 |
| HD 209278 | 12.27 | −5.05 | 0.00 | 7.06 | 0.00 | 7.12 | 0.01 | −4.81 |
| HD 210960 | 14.94 | −4.61 | 0.01 | 5.27 | 0.00 | 5.80 | 0.00 | −5.95 |
| HD 211416 | 16.40 | −1.57 | 0.04 | 2.22 | 0.00 | 3.57 | 0.03 | −7.08 |
| HD 212132 | 13.77 | −2.08 | 0.01 | 5.52 | 0.00 | 5.74 | 0.00 | −5.16 |
| HD 212271 | 18.67 | −1.93 | 0.05 | 5.26 | 0.00 | 5.78 | 0.00 | −4.90 |
| HD 214987 | 19.45 | −1.66 | 0.09 | 5.80 | 0.00 | 6.32 | 0.00 | −5.36 |
| HD 214995 | 19.38 | −1.85 | 0.06 | 5.58 | 0.00 | 6.19 | 0.00 | −5.40 |
| HD 215545 | 13.99 | −2.03 | 0.01 | 6.54 | 0.00 | 6.70 | 0.00 | −5.19 |
| HD 216489 | 15.94 | −5.04 | 0.02 | 5.66 | 0.01 | 6.28 | 0.02 | −4.02 |
| HD 216718 | 16.36 | −4.01 | 0.03 | 5.53 | 0.01 | 5.97 | 0.00 | −5.82 |
| HD 216756 | 14.34 | −2.51 | 0.01 | 5.79 | 0.00 | 6.02 | 0.00 | −5.84 |
| HD 218356 | 14.79 | −5.21 | 0.02 | 4.24 | 0.00 | 5.03 | 0.00 | −5.23 |
| HD 218527 | 18.37 | −1.81 | 0.07 | 5.13 | 0.00 | 5.66 | 0.00 | −5.51 |
| HD 218658 | 14.10 | −4.54 | 0.01 | 4.20 | 0.00 | 4.66 | 0.01 | −5.29 |
| HD 218670 | 17.44 | −1.61 | 0.04 | 3.52 | 0.00 | 4.16 | 0.01 | −5.43 |
| HD 219916 | 15.76 | −3.44 | 0.03 | 4.56 | 0.00 | 5.10 | 0.00 | −6.34 |
| HD 220657 | 14.61 | −2.64 | 0.01 | 4.20 | 0.00 | 4.60 | 0.00 | −4.90 |
| HD 223011 | 12.45 | −1.93 | 0.00 | 6.27 | 0.00 | 6.39 | 0.00 | −5.19 |
| HD 223346 | 16.01 | −1.62 | 0.01 | 6.34 | 0.00 | 6.60 | 0.00 | −5.47 |
| HD 223460 | 16.45 | −3.61 | 0.02 | 5.62 | 0.00 | 6.09 | 0.00 | −4.30 |
A machine-readable version of the table is available.
Table 3. Fits for FUV-excess Parameter QFUV vs. 
| Sample a | Nb | ac | bc | ρd | (r2) e | rms f |
|---|---|---|---|---|---|---|
| CHeB giants | 59 | −0.74 | −6.09 | −0.42 | 0.07 | 1.28 |
| Non-CHeB giants | 79 | −1.22 | −9.47 | −0.49 | 0.19 | 1.76 |
| All giants and subgiants | 139 | −0.94 | −7.52 | −0.43 | 0.12 | 1.60 |
Notes.
a Sample of giants. b Number of stars within each sample. c Fit parameters of QFUV = + b.
d
Spearman coefficient.
e
Coefficient of determination.
f
rms variation of QFUV about each fit.
+ b.
d
Spearman coefficient.
e
Coefficient of determination.
f
rms variation of QFUV about each fit.Download table as: ASCIITypeset image
Figure 8 shows that while there is a range of atmospheric activity for giants, as indicated by both FUV-excess and X-ray observations, there is significant scatter between the two indicators. We investigated binarity as a possible contribution to this phenomenon. In Figure 9 we show the X-ray luminosity ratio versus QFUV while focusing on certain populations of stars: no variable stars, RS CVn, visual, symbiotic, or spectroscopic binaries (top left); no spectroscopic, RS CVn, or symbiotic binaries (top right); only spectroscopic, RS CVn, and symbiotic binaries (bottom left); and all RS CVn, visual, symbiotic, and spectroscopic binaries (bottom right). Binarity for each star was found in the SIMBAD online data system. There is a reduced amount of scatter in QFUV for the population that does not include any binaries or variable stars (top-left panel of Figure 9), with high activity levels of QFUV < −3.0 mag appearing to be less frequent among single giant stars than among binaries.
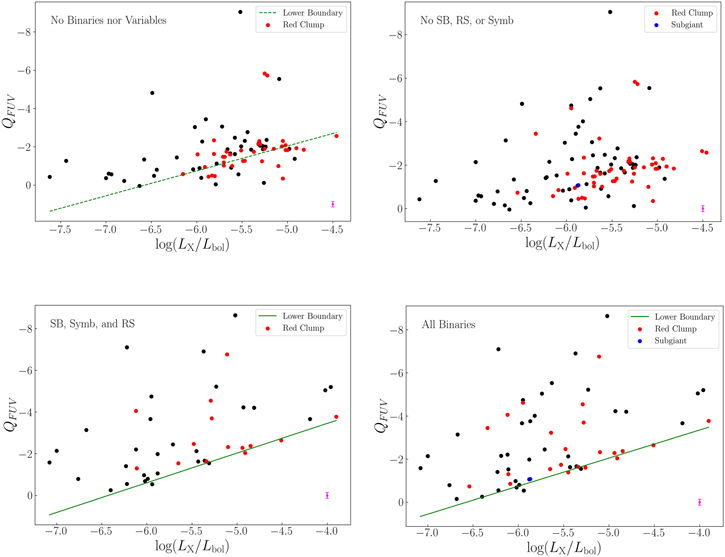
Figure 9. The FUV-excess parameter QFUV vs. the ratio of X-ray-to-bolometric luminosity for four populations: no variable stars, RS CVn variables, visual, symbiotic, or spectroscopic binaries (top left); no spectroscopic, RS CVn, or symbiotic binaries (top right); only spectroscopic, RS CVn, and symbiotic binaries (bottom left); and all RS CVn, visual, symbiotic, and spectroscopic binaries (bottom right). Green lines on the bottom panels indicate an upper boundary to the value of QFUV as calculated for the samples in each panel. The green line in the top-left panel is the lower boundary for all binaries transposed from the bottom-right panel. A representative error bar of length ±2av(FUV) = ±0.14 mag is included in the figure (magenta). As discussed in the text, this term is typically anticipated to dominate the error in the values of QFUV.
Download figure:
Standard image High-resolution imageIn addition to the least-squares fits discussed above, we have experimented with fitting an upper limit to the value of QFUV as a function of normalized X-ray luminosity. Green lines on the bottom panels of Figure 9 take the equations

for the sample of spectroscopic, RS CVn, and symbiotic binaries, and

for the sample with all binaries. These QFUV boundary equations were determined by fitting to the giants with the most positive value of QFUV at a given (LX/Lbol). They indicate that for giants in binary systems there is a lower limit to the FUV excess that is a function of X-ray luminosity. The dashed green line in the top-left panel is the upper boundary to QFUV for all binaries transposed from the bottom-right panel. The nonbinaries in the upper panels of Figure 9 do not follow the same boundary to QFUV as the binaries. The limiting value of QFUV shows a more apparent correlation with X-ray brightness among active binary stars (bottom panels of Figure 9) than among nonbinary giants. At a given value of QFUV ∼ −2.0 mag there is a range of a factor of 10 or more in soft X-ray luminosity in all panels. This is similar to the scatter in (LX/Lbol) seen at a given (FMg II /Fbol) in Figure 1. In summary, the single giants show much less evidence of a correlation between QFUV and X-ray luminosity than binary stars, although there is substantial scatter in these relationships for all groupings of giants in Figure 9. The trend shown by the green line in this figure may pertain to physical situations in which stellar activity is controlled by an internal dynamo that is enhanced within giants whose rotation is "spun up" by virtue of membership in a binary.
There are five stars with QFUV < −4.0 mag in the top-left panel of Figure 9 which are not binaries or variables: HD 24497, HD 28525, HD 47442, HD 11025, and HD 12055. These giants are quite active as indicated by their QFUV values, and for three of them the X-ray luminosity is also relatively high. As they are single stars, their activity levels are not impacted by companions. Additionally, they are not pulsating. It was of interest to investigate their GALEX FUV measurements further. The left panel of Figure 10 shows QFUV versus GALEX FUV magnitude for the population of stars in the top-left panel of Figure 9. The five stars with QFUV < −4 mag have the brightest FUV apparent magnitudes in the sample, indicating that their GALEX observations would not likely have enhanced uncertainties from being faint sources. A plot of QFUV versus Johnson (B − V) color for this population is shown in the right panel of Figure 10, from which it is apparent that these five stars are not different in effective temperature from the CHeB and giant peers. The nature of these sources is unclear to us. It is possible that these are observational artifacts or a confusion of two unresolved sources in the GALEX FUV images. One possible explanation for the very negative QFUV values for the five stars might be a white dwarf companion, but there is no indication from the SIMBAD database to suggest such might be the case.
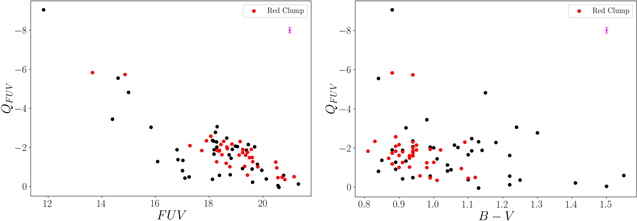
Figure 10. The FUV-excess parameter QFUV vs. GALEX FUV magnitude (left) and Johnson (B − V) color (right) for the single giants (no binaries or variables) that comprise the top-left panel of Figure 9. Relatively active giants with QFUV < −4.0 mag are bright in the FUV bandpass and have optical colors of (B − V) < 1.2 mag. A representative error bar of length ±2av(FUV) = ±0.14 mag is included in the figure (magenta).
Download figure:
Standard image High-resolution imageSaturation in the GALEX detectors can lead to an underestimation of flux for sources brighter than both near-ultraviolet (NUV) and FUV mAB ∼ 15 (Morrissey et al. 2007). As such, we have replotted the top-left panel of Figure 9 upon excluding the sources with FUV < 15 mag. The result is shown in Figure 11. The fit between FUV-excess color and  is shown in green with an rms scatter about the fit of 0.64 mag. The Spearman coefficient, ρ, for the population is −0.53 and r2 = 0.27. The correlation shown by the fit in Figure 11 is not a strong one.

Figure 11. FUV excess QFUV vs. the ratio of X-ray luminosity over bolometric luminosity for nonbinary and nonvariable giants with an FUV magnitude fainter than 15 mAB (mag). A linear fit is shown in green and has an rms fit about QFUV of 0.64 mag. A representative error bar of length ±2av(FUV) = ±0.14 mag is included in the figure (magenta).
Download figure:
Standard image High-resolution imageCHeB stars in our GALEX-ROSAT sample exhibit a range in QFUV excess. A number of the chromospheric and transition-region emission lines radiated by G- and K-type stars within the wavelength range of the GALEX FUV band have been studied by Ayres et al. (1981). In their Figures 2 and 3, they demonstrated that K dwarfs and giants can have weaker emission lines than G dwarfs and giants, respectively. Thus, despite the fact that a K giant will have a lower photospheric brightness in the FUV band than a G giant, the contrast between the chromospheric and photospheric contributions may be reduced for the K giant. This may help account for why the greatest range in FUV excesses is observed herein among giants of similar temperatures to the CHeB stars than among redder and cooler giants (e.g., Figure 7). The giants of the Hyades clusters are CHeB stars that are effectively coeval yet are known to exhibit a range of stellar activity. They may provide some context for the spread in FUV-band activity found among the field CHeB stars. As such, we turn to this small ensemble of stars in the next section.
The FUV-excess parameter, QFUV, has been introduced in the above work as a measure of the FUV excess of a giant star relative to the least-active giants at a given B − V color. It is dependent on the minimum-activity locus u(B − V), as defined in Equation (5), and as such is influenced by errors in the FUV magnitude, the (B − V) color, and the degree to which the equation for u as a function of (B − V) provides a good match to a locus for minimum-activity giants. The appropriate locus for u might depend on the evolutionary state of a red giant, i.e., shell hydrogen burning versus core helium burning. Furthermore, stars with among the largest FUV magnitude errors in Table 2 typically have values of QFUV relatively close to zero. This is a consequence of those stars that are faintest in the FUV band having relatively large values of FUV magnitude, and therefore the QFUV index. Consequently, the equation for the envelope function u is sensitive to a subset of stars with among the largest errors in FUV mag. This is a factor of potential error in the derivation of the u function. Were some of the above error terms to affect the placement of u systematically as a function of (B − V), then a (B − V)-dependent scatter would be introduced into Figures 8 through 11. Since the average value of (FUV) for the stars in Table 2 is 0.07 mag, while for stars in Table 5 it is 0.18 mag, possible 3σ offsets in the apparent u locus of 0.5 mag, or more, relative to the intrinsic stellar locus might be present, particularly outside the color range 0.90 ≤ (B − V) ≤ 1.20, where the left panel of Figure 7 is less well populated.
Given such potential uncertainties in the employed equation for u as a function of (B − V), we have also taken an approach to the data in which no FUV-excess parameter such as QFUV is involved, but rather the (FUV − B) color is compared directly with the X-ray-to-bolometric luminosity ratio,  , among giants within limited (B − V) color ranges. Figure 12 shows (FUV − B) plotted versus
  for giants grouped into three B − V bins. Stars that have been identified as possible CHeB giants are plotted with open circles to distinguish them from stars (filled circles) in other giant-branch phases of evolution (such as first-ascent giants or asymptotic giant branch stars).
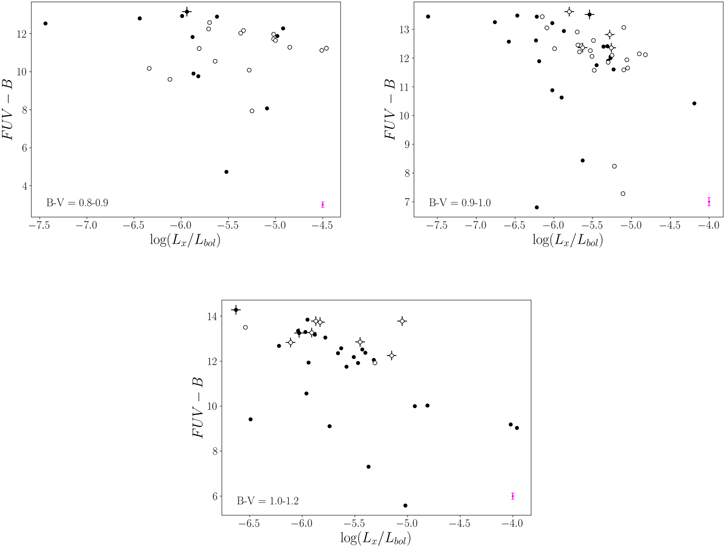
Figure 12. (FUV − B) color vs. the ratio of X-ray-to-bolometric luminosity for the ROSAT-GALEX giant sample. Stars are grouped into three different panels on the basis of their B − V color. Open circles: candidates for core-helium-burning giants. Filled circles: stars in other giant-branch stages of evolution (first-ascent red giant branch or asymptotic giant branch). Crosses depict stars for which the uncertainty in FUV magnitude, (FUV) from Table 2, exceeds 0.15 mag, regardless of evolutionary state. In addition, a representative error bar (magenta) of length ±2av(FUV) = ±0.14 mag is included in each panel, based on the values of (FUV) from Table 2. The uncertainty in FUV magnitude will typically exceed the error in B magnitude, and as such will approximate the uncertainty in the values of (FUV − B) plotted herein.
Download figure:
Standard image High-resolution imageWithin each color bin in Figure 12 there is a trend for the (FUV − B) color to be bluer, on average, among the giants with higher X-ray-to-bolometric luminosity ratios. This tendency is perhaps more clearly evinced among the redder giants as compared to the color range that includes the CHeB stars. However, all three panels of Figure 12 are characterized by significant scatter about any possible correlation. Stars with FUV magnitude errors greater than 0.15 mag, as given in the GR6/7 data release, are designated with crosses in Figure 12. Excluding these stars from consideration does not alter the conclusions or tighten any of the correlations.
5. The Hyades Giants
Four of the giants in Table 1 are members of the Hyades open cluster. The data in Table 1 reveal quite a spread in stellar activity among these giants, a phenomenon that was first reported by Baliunas et al. (1983). The four Hyades giants are listed in the Appendix as Table 4 in order of decreasing soft X-ray luminosity as measured by ROSAT, which is again listed. The binarity of these stars has been noted in Table 1. There is no GALEX photometry available for these Hyades giants in either the DR4/5 or DR6/7 data releases. Thus, in order to address the question of whether there is a correlation between stellar activity and the UV brightness of these stars alternative data have to be sought.
Measurements of the Hyades cluster giants in several different photometric systems are listed in Table 4. The Johnson UBV photometry is the mean of values given in the catalog of Mermilliod (1987a, 1987b), while the (33 − B) color is based on the 33 mag of the Johnson & Mitchell (1975) 13-color photometric system. UV magnitudes as measured by the Astronomical Netherlands Satellite (ANS; van Duinen et al. 1975) were obtained from the compilation of Wesselius et al. (1982). Magnitudes measured in the λ1800, λ2200, λ2493, and λ3294 bandpasses are listed in Table 4, and are herein denoted as m18, m22, m25, and m33, respectively. There is an offset between the Johnson 33 mag and the ANS m33, which ranges between 0.09 and 0.15 mag for the stars in Table 4. Consequently, both a (33 − B) Johnson color and a composite (m33 − B) ANS-Johnson color are listed in the table. Other composite colors using the ANS magnitudes and the Johnson B magnitude are also given.
In the case of all the colors listed in Table 4 that employ an UV bandpass the average (mλ
− B) color of the two higher-activity giants θ1 Tau and γ Tau is bluer than the average for the two lowest-activity giants δ Tau and Tau. The difference between these averages increases as the UV bandpass shifts to shorter wavelengths. Hence, there may be some evidence from Table 4 that the brightness of Hyades giants in shorter-wavelength bandpasses is correlating with stellar activity. One of the complications in interpreting the colors is that all four Hyades giants are double stars or spectroscopic binaries. Thus, some of the color differences in Table 4 may have a photospheric origin, particularly at the longer UV wavelengths, due to the combined light of two stars.
The Hyades giants are in the core-helium-burning phase of evolution. Although they are effectively coeval, they may differ in mass and hence in the amount of time they have spent thus far in this phase (Schröder et al. 2020). If a magnetic dynamo is reenergized within CHeB stars once they contract and spin up after evolving through the helium core flash at the tip of the RGB, their dynamo and surface activity may decline during the CHeB phase by analogy with the decrease experienced during the main-sequence phase. In such a circumstance the range in activity among the Hyades giants may be a consequence of a range in evolution times in the CHeB phase. Regardless of their origin, the differences in activity among the Hyades giants indicate that the range in FUV activity seen among field giants in Section 4 is not atypical.
6. The Stellar Activity–Rotation Relationship in Giants
Many observations show a relationship of slowing stellar rotation with age in FGK dwarf stars (see, e.g., Kraft 1967; Soderblom 1985; Barnes 2001; Soderblom et al. 2001). However, the relationship may not be the same for giants as for dwarfs. For example, in the case of main-sequence stars, Wang et al. (2020) found a relation of  , where RX is the X-ray-to-bolometric luminosity ratio, Prot is the rotation period, and R is the stellar radius. They did not find the same relationship for giants. In this section we examine the stellar activity–rotation relationship of giant stars using GALEX FUV and NUV photometry combined with
  rotation speed measurements from the literature.
6.1. An FUV–Rotation Relation
A large sample of red giants with rotational velocities was needed in order to have a reasonable number of stars when cross-matched with the GALEX catalog. The sample used in this analysis was derived from Massarotti et al. (2008), who made rotational velocity measurements for 761 giants within 100 pc of the Sun. Massarotti et al. (2008) determined projected rotational  velocities with spectra acquired with CfA Digital Speedometers (Latham 1992) on the Wyeth Reflector at Oak Ridge Observatory and the Tillinghast Reflector and MMT at the Whipple Observatory. Stellar spectra were cross-correlated with synthetic spectrum templates from Kurucz (1992) to derive rotation speeds. We cross-matched the Massarotti et al. (2008) catalog with the GALEX GR6/7 source archive as described in Section 2, and the Hipparcos catalog, which resulted in a sample of 267 giants with rotational velocities as well as FUV and Johnson B magnitudes. Three of these stars have quoted rotational velocities of
  km s−1. There are zero stars with rotational velocities between
  km s−1 and these three stars. With such a large gap, it is not enlightening to include the three fast-rotating stars in our attempt to correlate QFUV and rotational velocity. These three stars are HIP 3693 (RS CVn, K1 giant; Koevari et al. 2007), HIP 75127 (K1 giant; Houk & Swift 1999), and HIP 112748 (G8 giant; Keenan & McNeil 1989). We were then left with a sample of 264 giant stars. The great majority of these stars have projected rotation speeds less than 6 km s−1.
Stars in the cross-matched GALEX-rotation speed sample are listed in the Appendix as Table 5, along with FUV and NUV magnitudes, plus errors (FUV) and (NUV), all from the GR6/7 data release, as well as the projected rotation speed from Massarotti et al. (2008). The average value of (FUV) for the stars in Table 5 is av(FUV) = 0.18 mag, with a standard deviation of 0.12 mag. In the case of the NUV magnitude the uncertainties are much smaller, with av(NUV) = 0.01 mag and a standard deviation of 0.01 mag.
Figure 13 shows GALEX FUV-excess parameter QFUV versus Massarotti et al. (2008) rotational velocities. Values of QFUV were determined by Equations (4) and (5). We do not see a clear correlation between FUV radiation and rotation for stars with  km s−1 in this figure. A possible explanation for the scatter could be a spread in the angle of inclination of the stellar rotation axes. Such variations in
  may obscure any trends. Stars bright in the FUV may have intrinsically high rotation, but if the rotation axis is inclined close to the line of sight to a star the full rotation would not be observed. The lack of correlation in Figure 13 would then be the result of a projection effect. In such a case correlations would not be expected between
  and other chromospheric activity indicators among this sample of giants.
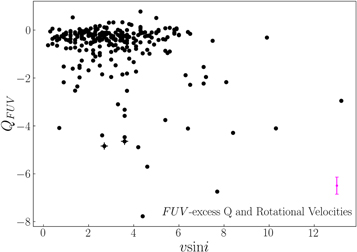
Figure 13. GALEX FUV-excess parameter QFUV vs. projected rotational velocities for giant stars from Massarotti et al. (2008). Not included are six stars with  km s−1. The two giants with a "+" symbol have very negative QFUV values (<−4), but are not binaries. A representative error bar of length ±2av(FUV) = ±0.36 mag is included in the figure (magenta).
Download figure:
Standard image High-resolution imageWe further investigated the giants in Figure 13 with very negative QFUV values, those with QFUV ≤ −4.0. Eleven stars fall in that regime, with eight of them being binaries: HIP 7097, HIP 10661, HIP 23221, HIP 52085, HIP 53240, HIP 62886, HIP 74896, and HIP 78481. HIP 68904 is identified as a pulsating star (Strassmeier et al. 2011), which may impact observations of activity levels. The remaining two stars, HIP 79882 and HIP 94490, designated with "+" symbols in Figure 13, are not binaries but high-proper-motion giants.
6.2. An NUV–Rotation Relation
NUV emission has been shown to correlate with rotational velocities for red giant stars by Dixon et al. (2020). In their work they compiled a set of 133 red giants that were observed by the Sloan Digital Sky Survey APOGEE project and also have GALEX NUV magnitudes. Similar to the analysis in Dixon et al. (2020), we have defined an NUV-excess parameter, described here as QNUV. This excess is defined by

where NUV is the GALEX-observed NUV magnitude, B is the Johnson magnitude, and u is now a reference value relative to which an NUV excess is defined. Figure 14 shows a two-color diagram of the Massarotti et al. (2008) sample of giants with GALEX NUV observations. Values of the B − V color were obtained from the Hipparcos Catalogue. The red line in this figure defines u, and it is likely an effective temperature trend. It is not a locus purely defined by chromospheric activity, as the NUV passband contains a greater amount of photospheric light for FGK stars than does the FUV passband. The locus corresponds to the equation


Figure 14. An NUV-based two-color diagram of the Massarotti et al. (2008) sample of giants with GALEX NUV magnitudes. A representative error bar would be of length ±0.02–0.03 mag based on av(NUV) = 0.01 mag from Table 5. This uncertainty is relatively small on the scale of the figure and, as such, an error bar is not shown.
Download figure:
Standard image High-resolution imageWe show the NUV excess, QNUV, versus rotational velocity,  , in Figure 15. A clear correlation is not evident. By contrast, Dixon et al. (2020) did find a correlation between their NUV-excess parameter and
  for red giants in their Figure 7 using a sample that contained a larger number of stars with
  –10 km s−1.
2
Below this limit the relationship is less evident in both our work and theirs.
–10 km s−1.
2
Below this limit the relationship is less evident in both our work and theirs.

Figure 15. NUV excess QNUV vs. projected rotational velocities from Massarotti et al. (2008). A representative error bar would be of an approximate length ±0.02–0.03 mag based on av(NUV) = 0.01 mag from Table 5. This uncertainty is relatively small on the scale of the figure, and is not shown.
Download figure:
Standard image High-resolution imageThere is a complication to interpreting Figure 15 because of the significant contribution of stellar photospheric light to the NUV bandpass. It was shown by Mohammed et al. (2019) that the NUV magnitude of giant stars in the core-helium-burning phase is sensitive to metallicity. Although most of the giants in Figure 15 are Population I stars, there may be differences in metallicity among them.
7. Conclusions
7.1. Summary
Relationships have been sought among red giant stars between two indicators of chromospheric and transition-region activity and coronal soft X-ray emission. In Section 3 a total of 450 giants and subgiants from Hünsch et al. (1998b) has been cross-matched with Pérez Martínez et al. (2011) to obtain a sample of giants with measured Mg ii
h and k and ROSAT X-ray emission flux. There is a correlation between  and
and  for this cross-matched sample. Relatively high-activity binary stars contribute significantly to this correlation. Nonetheless, there is a large range of up to 1 dex in
  for giants with comparable
  and (B − V) color, which is particularly notable among lower-activity giants with the weaker λ2800 Mg II emission line strengths.
In Section 4 we have presented a comparative study of FUV excess and soft X-ray emission for a sample of giants from a cross-match between the Hünsch et al. (1998b) ROSAT X-ray catalog and the GALEX all-sky survey. Within this sample 66 stars were identified as being in the CHeB phase of evolution via a comparison between their HR diagram and MESA evolutionary tracks. These 66 giants have measurements of both GALEX FUV and Gaia GBP magnitudes, and they exhibit a wide range in the (FUV − GBP ) color: 8.00 ≤(FUV − GBP ) ≤ 14.63 mag. As FUV magnitudes have been demonstrated as a chromospheric activity indicator, it follows that there is a varied range of activity levels for the CHeB stars. One interpretation of this scatter among the CHeB stars might be that those with the greatest FUV brightness are in a phase of enhanced activity after having decreased in radius and spun up following the helium core flash, causing resurgence of a rotation-induced magnetic dynamo. Since stars spend an extended time in the CHeB phase of evolution, if they subsequently spin down during this phase, a range in activities may result.
Not only is there a range of stellar activity in the FUV among the CHeB stars and other giants, there is also considerable scatter in X-ray luminosity. We attempted to constrain a relationship between an FUV-excess parameter QFUV and  for giants with colors (B − V) > 0.62 mag and (FUV − GBP
) > 11 mag. The correlations do not have a high level of significance, and there is a scatter of a factor ∼10 or more in normalized soft X-ray luminosity for a given QFUV. Among the ∼60 binary giants in the lower-right panel of Figure 9 there is a trend for the minimum FUV excess to correlate with
for giants with colors (B − V) > 0.62 mag and (FUV − GBP
) > 11 mag. The correlations do not have a high level of significance, and there is a scatter of a factor ∼10 or more in normalized soft X-ray luminosity for a given QFUV. Among the ∼60 binary giants in the lower-right panel of Figure 9 there is a trend for the minimum FUV excess to correlate with  . Additionally, late-main-sequence stars are clearly separated from red giants in a (FUV − GBP
) versus optical two-color diagram.
. Additionally, late-main-sequence stars are clearly separated from red giants in a (FUV − GBP
) versus optical two-color diagram.
We endeavored to constrain correlations between rotational velocities and GALEX UV emission for a sample of giants from Massarotti et al. (2008). However, a clear correlation was not evident between either FUV or NUV excess and  . Scatter in any intrinsic relation between UV excess and surface rotation speed may be obscured by a range in rotation axis inclinations of the giants in the Massarotti et al. (2008) sample. Also, the range in
  among our sample is limited to only ∼7 km s−1.
7.2. Discussion
Combining the results of the present paper with those of Smith (2018) and Smith & Cochrane (2020), the following conclusions are offered as to the behavior of the GALEX FUV-band brightness of red giant stars. 3 (i) Smith (2018) found that the GALEX FUV-band brightness of red giants correlates with the strength of the chromospheric Mg ii λ2800 h and k emission lines, albeit with scatter and above some lower limit of FUV excess, and thus concluded that flux in the FUV bandpass is tracing conditions in the chromospheres of red giants. (ii) The Mg ii λ2800 emission lines in turn are found in this paper to show a correlation with soft X-ray luminosity, but again the overall correlation has considerable scatter in it, and is most notably seen when giants in active binary systems are considered. At the lowest levels of λ2800 hk emission measured there is a spread of a factor of ∼10 in Figure 1 in the soft X-ray luminosity ratio (LX/Lbol). (iii) Any correlation between FUV-bandpass excess and (LX/Lbol) is obscured by large scatter and the results of Section 4 herein reveal only weak trends. When active binary giants are considered a correlation is seen between soft X-ray luminosity and the minimum FUV excess at a given (LX/Lbol). (iv) FUV excesses among red giants do not obviously correlate with stellar age as discerned by Smith & Cochrane (2020) from a comparison between red giants in various kinematic moving groups.
To the above summaries can be added the fact that correlations for giant stars have been discerned among  and each of the GALEX NUV excess (Dixon et al. 2020), Mg ii
λ2800 emission (Smith 2018), and soft X-ray luminosity (Gondoin 1999), although such trends often require the presence of giants with
and each of the GALEX NUV excess (Dixon et al. 2020), Mg ii
λ2800 emission (Smith 2018), and soft X-ray luminosity (Gondoin 1999), although such trends often require the presence of giants with  km s−1 to be clearly discernible. The implication of such observations seems to be that among some giant stars the level of chromospheric and coronal activity may be linked to rotation and, by analogy with main-sequence stars, with a magnetic dynamo. However, as suggested by the results of the present paper in many red giants, perhaps mostly those of low rotation speeds and low levels of activity, the tracers of chromospheric and coronal activity start to become decoupled. One possible explanation might be that in more slowly rotating giants the coronal activity is diminishing and non-dynamo-related processes might be contributing to chromospheric heating. This could be particularly the case for stars near the upper part of their first or second ascents of the RGB if pulsation is starting to set in and acoustic heating of the chromosphere is becoming dominant.
We conclude this discussion by noting that from the results of the present paper the GALEX FUV excess of red giants may not be as useful a chromospheric indicator as the Mg ii λ2800 h and k emission lines, given that the former does not appear to correlate as well with coronal X-ray emission as do the latter, e.g., compare Figure 1 with Figures 8 or 14. This suggests a greater utility in identifying activity levels with the Mg emission lines as compared to GALEX broadband FUV flux. A benefit of using the Mg ii emission lines is that they arise from a single species in a single ionization state, and thus probe a specific region of the chromosphere. By comparison, when utilizing broadband FUV flux as an activity indicator we are sampling a combined sum of multiple emission lines from a variety of species in different ionization states, along with a photospheric background. The various chromospheric emission lines within the GALEX FUV band will not all vary in strength in the same way as a function of temperature, and not all species responsible for the emission lines will reach their maximum populations at the same stellar effective temperature. Thus, there is a complication of having within the FUV band a heterogeneous combination of emission lines each varying with temperature in different ways. This variance may act to obscure the resolution with which GALEX FUV brightness can trace activity within the chromosphere and transition region.
We gratefully acknowledge the support of the National Science Foundation through award AST-1517791. This research has made use of the NASA Astrophysics Data System. The GALEX FUV data presented in this paper were obtained from the Mikulski Archive for Space Telescopes (MAST). STScI is operated by the Association of Universities for Research in Astronomy, Inc., under NASA contract NAS5-26555.
Appendix
Data for the samples of stars considered in Sections 5 and 6 of this paper are listed in Tables 4 and 5, respectively. Table 4 contains ultraviolet ANS plus Johnson photometry for giants of the Hyades cluster. Table 5 contains GALEX FUV and NUV photometry for giants with rotational velocity data.
Table 4. Photometry of Hyades Giants
| Star | HD |

| m18 | m22 | m25 | m33 | V | (B − V) | (U − B) | (33 − B) | (m33 − B) | (m25 − B) | (m22 − B) | (m18 − B) |
|---|---|---|---|---|---|---|---|---|---|---|---|---|---|---|
| θ1 (77) Tau | 28307 | −5.22 | ⋯ | ⋯ | ⋯ | ⋯ | 3.840 | 0.952 | 0.722 | 0.778 | ⋯ | ⋯ | ⋯ | ⋯ |
| γ Tau | 27371 | −5.59 | 12.276 | 10.080 | 9.188 | 5.544 | 3.647 | 0.987 | 0.808 | 0.765 | 0.910 | 4.554 | 5.446 | 7.642 |
| δ Tau | 27697 | −6.87 | ⋯ | 10.861 | 9.651 | 5.679 | 3.757 | 0.983 | 0.826 | 0.841 | 0.939 | 4.911 | 6.121 | ⋯ |
|
Tau | 28305 | −7.01 | 13.177 | 10.909 | 9.653 | 5.574 | 3.535 | 1.014 | 0.877 | 0.930 | 1.025 | 5.104 | 6.360 | 8.628 |
Download table as: ASCIITypeset image
Table 5. GALEX Data for the Massarotti et al. (2008) Giant Star Sample
| HIP | FUV |
(FUV) | QFUV | NUV |
(NUV) | QNUV |

|
|---|---|---|---|---|---|---|---|
| (mag) | (mag) | (mag) | (mag) | (km s−1) | |||
| 343 | 21.16 | 0.36 | 0.09 | 14.68 | 0.01 | 0.44 | 2.8 |
| 626 | 20.49 | 0.12 | −1.18 | 14.13 | 0.00 | −0.11 | 3.8 |
| 729 | 20.36 | 0.17 | −0.42 | 13.99 | 0.00 | 0.23 | 0.6 |
| 1168 | 18.94 | 0.07 | −0.20 | 15.30 | 0.01 | −0.14 | 6.0 |
| 1562 | 18.38 | 0.05 | −0.56 | 13.23 | 0.00 | 0.42 | 0.4 |
| 2498 | 21.82 | 0.27 | −0.19 | 14.87 | 0.01 | 0.47 | 2.7 |
| 3092 | 18.48 | 0.09 | −0.14 | 13.17 | 0.00 | 0.37 | 6.5 |
| 3436 | 20.72 | 0.14 | −0.62 | 14.72 | 0.01 | 0.10 | 2.9 |
| 3455 | 19.68 | 0.12 | −0.18 | 13.64 | 0.00 | 1.00 | 2.3 |
| 3675 | 18.04 | 0.08 | −2.53 | 12.73 | 0.00 | −0.56 | 3.7 |
| 3849 | 20.76 | 0.15 | −0.10 | 15.13 | 0.01 | −0.26 | 1.8 |
| 4288 | 20.39 | 0.18 | −0.20 | 13.92 | 0.00 | 0.49 | 1.7 |
| 4742 | 21.59 | 0.34 | −0.72 | 14.77 | 0.01 | 0.18 | 1.4 |
| 4801 | 21.41 | 0.40 | −0.44 | 15.73 | 0.02 | 0.18 | 2.9 |
| 4809 | 20.02 | 0.13 | −0.81 | 13.17 | 0.00 | 0.37 | 4.6 |
| 5951 | 14.41 | 0.01 | −5.69 | 13.29 | 0.00 | 0.86 | 4.6 |
| 6025 | 21.22 | 0.17 | −0.49 | 15.25 | 0.01 | 0.12 | 3.6 |
| 6376 | 21.46 | 0.20 | −0.46 | 14.74 | 0.00 | 0.24 | 2.3 |
| 6451 | 21.82 | 0.34 | −0.30 | 15.73 | 0.01 | 0.25 | 2.7 |
| 6537 | 18.75 | 0.11 | −0.11 | 12.50 | 0.00 | 0.56 | 2.7 |
| 6714 | 19.64 | 0.12 | −1.73 | 13.90 | 0.01 | −0.02 | 4.1 |
| 6999 | 20.02 | 0.18 | −0.35 | 14.02 | 0.01 | 0.88 | 1.7 |
| 7097 | 14.35 | 0.01 | −4.29 | 11.87 | 0.00 | 0.56 | 8.4 |
| 8198 | 18.75 | 0.08 | −0.42 | 13.88 | 0.00 | 2.18 | 3.2 |
| 8597 | 22.99 | 0.25 | −0.02 | 16.21 | 0.01 | 0.03 | 2.0 |
| 9862 | 21.37 | 0.27 | −0.38 | 15.31 | 0.01 | 0.08 | 2.6 |
| 10661 | 19.979 | 0.17 | −4.10 | 12.81 | 0.00 | −5.05 | 10.3 |
| 11432 | 20.852 | 0.31 | −0.03 | 14.45 | 0.01 | 0.24 | 1.2 |
| 12148 | 20.794 | 0.19 | −0.22 | 14.26 | 0.01 | 0.28 | 0.9 |
| 12247 | 20.105 | 0.19 | −0.70 | 13.83 | 0.01 | 0.15 | 3.7 |
| 13701 | 19.017 | 0.05 | −0.17 | 13.62 | 0.00 | 1.24 | 2.2 |
| 14060 | 21.012 | 0.09 | 0.05 | 14.00 | 0.00 | 0.06 | 2.4 |
| 14439 | 20.938 | 0.32 | 0.00 | 14.14 | 0.01 | 0.02 | 1.9 |
| 14781 | 22.136 | 0.31 | −0.20 | 15.26 | 0.01 | 0.13 | 1.2 |
| 14838 | 19.631 | 0.15 | 0.09 | 13.04 | 0.00 | 0.57 | 4.3 |
| 15004 | 20.861 | 0.27 | −0.08 | 13.92 | 0.00 | 0.32 | 1.8 |
| 15514 | 19.362 | 0.14 | −1.10 | 12.88 | 0.00 | 0.20 | 2.3 |
| 15557 | 21.423 | 0.40 | −0.09 | 15.65 | 0.02 | 0.12 | 2.8 |
| 15861 | 20.483 | 0.21 | −0.40 | 14.82 | 0.01 | 0.21 | 1.4 |
| 16181 | 20.874 | 0.23 | −0.10 | 14.11 | 0.00 | 0.57 | 1.6 |
| 18543 | 16.953 | 0.04 | −0.28 | 13.69 | 0.01 | 0.03 | 3.8 |
| 18606 | 21.069 | 0.23 | 0.12 | 13.90 | 0.00 | 0.16 | 2.8 |
| 19038 | 19.2 | 0.09 | −0.42 | 13.35 | 0.00 | 0.66 | 2.8 |
| 19302 | 20.615 | 0.25 | −0.37 | 14.13 | 0.01 | 0.61 | 0.7 |
| 19777 | 19.4 | 0.13 | −0.84 | 13.61 | 0.01 | −0.18 | 1.6 |
| 19983 | 20.965 | 0.28 | −0.08 | 14.57 | 0.01 | 0.23 | 1.4 |
| 20263 | 18.368 | 0.06 | −2.52 | 13.15 | 0.00 | −0.11 | 1.4 |
| 20892 | 21.651 | 0.44 | 0.32 | 15.24 | 0.01 | 0.04 | 2.9 |
| 22176 | 20.934 | 0.32 | −0.44 | 15.43 | 0.01 | 0.15 | 3.7 |
| 22545 | 20.104 | 0.20 | −0.67 | 14.41 | 0.00 | 0.80 | 4.1 |
| 22633 | 20.709 | 0.21 | −0.62 | 14.18 | 0.00 | 0.57 | 0.2 |
| 22881 | 18.355 | 0.09 | −1.97 | 13.66 | 0.01 | 1.06 | 1.6 |
| 23221 | 11.829 | 0.00 | −7.77 | 13.21 | 0.00 | 1.60 | 4.4 |
| 23475 | 21.576 | 0.21 | 0.33 | 15.18 | 0.00 | 0.08 | 3.1 |
| 24197 | 19.918 | 0.19 | 0.14 | 15.85 | 0.01 | 0.14 | 4.3 |
| 24479 | 21.442 | 0.26 | −0.09 | 15.31 | 0.01 | 0.11 | 3.5 |
| 24665 | 21.683 | 0.44 | −0.42 | 15.45 | 0.01 | 0.29 | 1.4 |
| 26942 | 20.916 | 0.24 | −0.07 | 14.18 | 0.01 | 0.62 | 2.0 |
| 32173 | 19.755 | 0.12 | −0.09 | 15.44 | 0.01 | 0.01 | 4.8 |
| 32740 | 21.819 | 0.51 | 0.79 | 15.72 | 0.02 | 0.32 | 4.3 |
| 33449 | 15.097 | 0.01 | −3.75 | 12.14 | 0.00 | 1.10 | 5.4 |
| 34267 | 20.268 | 0.20 | −0.06 | 13.84 | 0.01 | 1.11 | 1.9 |
| 34693 | 19.624 | 0.12 | −0.14 | 14.29 | 0.01 | 0.39 | 5.8 |
| 35146 | 20.495 | 0.23 | 0.01 | 14.14 | 0.01 | 0.50 | 3.7 |
| 35253 | 20.734 | 0.21 | −0.31 | 13.56 | 0.00 | 0.21 | 9.9 |
| 36207 | 22.187 | 0.40 | 0.03 | 15.19 | 0.01 | 0.13 | 0.7 |
| 36616 | 21.059 | 0.27 | 0.26 | 14.43 | 0.00 | 0.25 | 3.8 |
| 36962 | 18.664 | 0.04 | 0.08 | 14.60 | 0.00 | −0.03 | 5.9 |
| 37046 | 20.852 | 0.31 | −0.42 | 14.92 | 0.01 | 0.28 | 4.1 |
| 37204 | 19.986 | 0.17 | −0.42 | 14.33 | 0.01 | 1.47 | 3.7 |
| 37636 | 19.597 | 0.11 | −1.51 | 13.56 | 0.00 | −0.04 | 0.9 |
| 37740 | 18.242 | 0.05 | −0.20 | 12.74 | 0.00 | 1.81 | 3.3 |
| 38785 | 22.224 | 0.38 | −0.61 | 15.82 | 0.01 | −0.07 | 3.2 |
| 39311 | 19.27 | 0.10 | −0.48 | 14.18 | 0.01 | 0.34 | 4.7 |
| 41395 | 20.326 | 0.18 | −0.57 | 14.83 | 0.01 | 0.33 | 3.0 |
| 42010 | 21.433 | 0.22 | −0.21 | 15.55 | 0.01 | 0.24 | 2.6 |
| 42662 | 20.005 | 0.20 | −0.12 | 14.00 | 0.01 | 0.81 | 1.7 |
| 42911 | 19.073 | 0.08 | −0.16 | 13.02 | 0.00 | 0.62 | 2.8 |
| 43813 | 18.324 | 0.04 | 0.18 | 12.83 | 0.00 | 2.00 | 2.5 |
| 44818 | 18.295 | 0.05 | −1.81 | 13.86 | 0.00 | 1.43 | 3.7 |
| 44843 | 21.585 | 0.26 | −0.75 | 15.20 | 0.01 | 0.16 | 1.0 |
| 44990 | 21.76 | 0.27 | −0.36 | 15.08 | 0.01 | 0.26 | 1.2 |
| 45158 | 20.819 | 0.29 | 0.07 | 13.63 | 0.01 | 0.20 | 0.4 |
| 45527 | 20.408 | 0.15 | −0.21 | 14.33 | 0.01 | 0.08 | 3.4 |
| 45860 | 17.54 | 0.05 | −0.07 | 14.03 | 0.00 | 0.29 | 6.4 |
| 46471 | 18.808 | 0.11 | −1.67 | 13.55 | 0.00 | 0.32 | 2.0 |
| 46543 | 20.409 | 0.20 | −0.28 | 13.96 | 0.01 | 1.13 | 0.9 |
| 46618 | 20.998 | 0.23 | −0.25 | 15.29 | 0.01 | 0.30 | 0.8 |
| 46952 | 17.058 | 0.04 | −2.28 | 13.10 | 0.00 | 1.34 | 6.5 |
| 47029 | 19.494 | 0.14 | −0.39 | 14.01 | 0.00 | 1.38 | 1.0 |
| 47205 | 19.326 | 0.06 | −0.90 | 13.07 | 0.00 | −0.17 | 3.0 |
| 47310 | 19.679 | 0.08 | −0.29 | 14.79 | 0.01 | 0.38 | 3.0 |
| 47431 | 18.928 | 0.06 | −0.26 | 14.19 | 0.00 | 0.54 | 4.5 |
| 47908 | 15.075 | 0.02 | −2.17 | 11.75 | 0.00 | 2.46 | 8.1 |
| 48347 | 22.678 | 0.42 | −0.05 | 16.44 | 0.02 | 0.00 | 0.3 |
| 48982 | 21.121 | 0.23 | 0.13 | 14.42 | 0.00 | 0.37 | 2.7 |
| 49221 | 21.462 | 0.27 | −0.49 | 15.09 | 0.01 | 0.06 | 2.2 |
| 49637 | 19.285 | 0.04 | −0.03 | 14.62 | 0.00 | −0.06 | 5.1 |
| 49841 | 18.161 | 0.06 | −0.57 | 13.43 | 0.00 | 1.89 | 2.1 |
| 50336 | 20.548 | 0.15 | −0.68 | 15.08 | 0.01 | 0.04 | 2.5 |
| 50546 | 20.78 | 0.27 | −0.38 | 14.34 | 0.01 | 0.30 | 3.5 |
| 50552 | 19.25 | 0.14 | −1.84 | 13.49 | 0.01 | 0.05 | 2.6 |
| 50801 | 16.798 | 0.05 | −0.43 | 14.05 | 0.01 | 0.27 | 7.5 |
| 50851 | 21.13 | 0.15 | −0.27 | 14.99 | 0.00 | 0.24 | 3.4 |
| 51069 | 18.536 | 0.06 | −0.19 | 14.49 | 0.00 | 0.34 | 6.0 |
| 51233 | 17.439 | 0.03 | −1.53 | 12.95 | 0.00 | 1.58 | 7.1 |
| 52085 | 15.274 | 0.01 | −4.47 | 12.75 | 0.00 | 0.56 | 3.6 |
| 52686 | 20.621 | 0.28 | −0.24 | 14.73 | 0.01 | 0.45 | 4.7 |
| 52943 | 18.119 | 0.06 | −0.37 | 13.98 | 0.01 | 1.53 | 5.3 |
| 53064 | 20.715 | 0.05 | −0.23 | 14.67 | 0.00 | 0.16 | 4.6 |
| 53157 | 20.825 | 0.27 | −0.95 | 15.09 | 0.01 | −0.01 | 5.5 |
| 53229 | 18.838 | 0.13 | −0.16 | 13.29 | 0.00 | 1.33 | 2.1 |
| 53240 | 16.831 | 0.04 | −4.08 | 13.66 | 0.00 | 0.33 | 0.7 |
| 53273 | 20.521 | 0.25 | 0.08 | 13.81 | 0.00 | 0.73 | 2.1 |
| 53426 | 20.107 | 0.21 | −0.23 | 13.76 | 0.01 | 0.17 | 1.2 |
| 53449 | 18.327 | 0.07 | −2.94 | 15.48 | 0.01 | 0.10 | 13.2 |
| 53465 | 20.953 | 0.31 | −0.42 | 14.91 | 0.01 | 0.17 | 3.5 |
| 54539 | 18.077 | 0.08 | −0.29 | 13.87 | 0.00 | 2.03 | 5.5 |
| 54863 | 20.851 | 0.17 | −0.29 | 14.67 | 0.01 | 0.13 | 0.5 |
| 56260 | 21.801 | 0.43 | −0.17 | 15.17 | 0.01 | 0.20 | 1.0 |
| 56975 | 19.907 | 0.18 | −0.40 | 13.22 | 0.01 | 0.20 | 3.2 |
| 57380 | 17.896 | 0.06 | −0.85 | 14.47 | 0.01 | −0.03 | 3.8 |
| 57399 | 18.652 | 0.11 | −0.42 | 13.87 | 0.01 | 1.12 | 2.3 |
| 57477 | 20.63 | 0.18 | 0.02 | 15.06 | 0.00 | 0.22 | 3.3 |
| 57791 | 20.723 | 0.11 | −0.14 | 14.14 | 0.00 | 0.23 | 1.4 |
| 58110 | 18.123 | 0.07 | −2.35 | 13.16 | 0.00 | 0.18 | 1.5 |
| 58181 | 20.185 | 0.15 | −0.96 | 14.27 | 0.00 | −0.13 | 4.4 |
| 59285 | 20.97 | 0.14 | −0.32 | 14.96 | 0.00 | 0.31 | 2.2 |
| 59847 | 19.467 | 0.16 | −0.42 | 13.58 | 0.00 | 1.09 | 3.4 |
| 59856 | 18.182 | 0.04 | −2.17 | 14.26 | 0.00 | 0.45 | 0.9 |
| 60170 | 20.71 | 0.23 | −0.11 | 14.22 | 0.01 | 0.19 | 2.9 |
| 60172 | 19.528 | 0.09 | −0.82 | 14.57 | 0.01 | 0.59 | 1.9 |
| 60585 | 20.549 | 0.24 | −3.32 | 14.23 | 0.01 | −2.89 | 3.6 |
| 60742 | 19.434 | 0.15 | −0.27 | 13.95 | 0.00 | 0.85 | 3.5 |
| 61309 | 20.633 | 0.28 | 0.08 | 13.78 | 0.01 | 0.40 | 2.3 |
| 61724 | 19.04 | 0.13 | −1.48 | 13.69 | 0.01 | 0.48 | 1.6 |
| 61740 | 20.26 | 0.22 | 0.23 | 14.13 | 0.01 | 0.08 | 3.9 |
| 62103 | 19.926 | 0.23 | −0.48 | 14.38 | 0.01 | 1.78 | 1.2 |
| 62356 | 19.592 | 0.16 | −0.75 | 15.09 | 0.01 | 0.08 | 3.5 |
| 62886 | 14.76 | 0.02 | −4.88 | 12.79 | 0.00 | 0.76 | 4.2 |
| 63142 | 21.08 | 0.34 | −0.84 | 14.33 | 0.00 | 0.08 | 2.2 |
| 63355 | 19.164 | 0.11 | 0.03 | 15.28 | 0.01 | −0.12 | 5.8 |
| 63810 | 21.877 | 0.49 | −0.23 | 14.85 | 0.00 | 0.06 | 1.7 |
| 64022 | 19.644 | 0.10 | 0.06 | 15.16 | 0.01 | −0.04 | 5.9 |
| 64078 | 20.423 | 0.25 | −0.09 | 14.22 | 0.01 | 0.26 | 2.6 |
| 64212 | 20.128 | 0.26 | −1.26 | 14.26 | 0.01 | −0.74 | 1.7 |
| 64496 | 21.452 | 0.35 | −0.03 | 15.53 | 0.01 | 0.25 | 1.8 |
| 64751 | 21.377 | 0.37 | −0.10 | 14.22 | 0.01 | 0.09 | 1.8 |
| 64823 | 20.4 | 0.28 | −0.23 | 15.15 | 0.01 | 0.12 | 1.5 |
| 65301 | 19.892 | 0.18 | −0.53 | 13.38 | 0.01 | 0.24 | 3.7 |
| 65639 | 20.071 | 0.16 | 0.00 | 13.93 | 0.01 | 0.63 | 4.3 |
| 65790 | 20.795 | 0.18 | −0.09 | 14.06 | 0.00 | 0.16 | 4.5 |
| 65867 | 21.747 | 0.50 | −0.64 | 15.53 | 0.01 | 0.26 | 0.6 |
| 65951 | 21.265 | 0.23 | −0.08 | 14.78 | 0.00 | 0.31 | 1.7 |
| 66098 | 19.837 | 0.23 | −0.36 | 14.04 | 0.01 | 1.22 | 0.4 |
| 66763 | 20.727 | 0.32 | −0.03 | 13.80 | 0.00 | 0.22 | 1.7 |
| 66936 | 20.024 | 0.12 | −0.63 | 13.44 | 0.00 | −0.42 | 3.1 |
| 67459 | 18.688 | 0.09 | 0.02 | 14.82 | 0.01 | 0.25 | 5.1 |
| 67929 | 20.29 | 0.21 | −0.18 | 13.98 | 0.00 | 0.30 | 2.5 |
| 68513 | 21.611 | 0.52 | −0.37 | 14.24 | 0.01 | 0.11 | 1.8 |
| 68739 | 21.067 | 0.31 | −0.60 | 16.28 | 0.01 | 0.11 | 4.9 |
| 68904 | 18.652 | 0.10 | −4.11 | 14.61 | 0.01 | −1.06 | 6.4 |
| 69185 | 21.186 | 0.34 | −0.52 | 14.30 | 0.01 | 0.46 | 1.4 |
| 69427 | 19.048 | 0.13 | −0.40 | 14.30 | 0.01 | 0.33 | 5.1 |
| 69879 | 19.53 | 0.17 | −0.51 | 13.25 | 0.00 | 0.17 | 2.1 |
| 70012 | 20.108 | 0.09 | −0.19 | 13.58 | 0.00 | 0.39 | 3.4 |
| 70027 | 20.021 | 0.19 | −0.20 | 14.41 | 0.01 | 0.25 | 4.2 |
| 70038 | 20.441 | 0.41 | −0.78 | 14.31 | 0.01 | 0.66 | 4.1 |
| 70791 | 19.967 | 0.18 | −0.18 | 13.78 | 0.00 | 1.39 | 2.7 |
| 71053 | 18.764 | 0.11 | −0.12 | 14.37 | 0.01 | 1.12 | 5.0 |
| 71778 | 22.1 | 0.37 | −0.75 | 15.43 | 0.01 | −0.03 | 1.2 |
| 72618 | 21.946 | 0.74 | −0.97 | 15.53 | 0.01 | −0.11 | 2.2 |
| 72631 | 19.135 | 0.07 | −0.86 | 13.48 | 0.00 | 0.76 | 5.4 |
| 73518 | 21.693 | 0.13 | −0.37 | 15.84 | 0.01 | 0.01 | 3.2 |
| 73745 | 19.654 | 0.18 | −0.24 | 14.55 | 0.01 | 0.64 | 3.5 |
| 74666 | 18.201 | 0.06 | −0.23 | 12.17 | 0.00 | 1.12 | 3.6 |
| 74868 | 21.79 | 0.10 | −0.23 | 15.10 | 0.01 | 0.20 | 2.0 |
| 74896 | 13.953 | 0.01 | −6.74 | 12.81 | 0.00 | −0.54 | 7.7 |
| 75049 | 20.474 | 0.13 | −0.18 | 13.67 | 0.00 | 0.17 | 2.6 |
| 75101 | 21.162 | 0.19 | −0.43 | 14.85 | 0.00 | 0.19 | 2.5 |
| 75127 | 20.513 | 0.31 | −0.25 | 14.28 | 0.01 | 0.53 | 0.6 |
| 76133 | 20.551 | 0.29 | −0.25 | 14.27 | 0.00 | 0.25 | 2.7 |
| 76425 | 19.699 | 0.24 | −0.40 | 14.28 | 0.01 | 1.71 | 1.4 |
| 77048 | 21.183 | 0.40 | 0.34 | 14.25 | 0.01 | 0.27 | 3.5 |
| 77070 | 17.881 | 0.05 | −0.13 | 12.66 | 0.00 | 1.05 | 4.3 |
| 77512 | 16.826 | 0.05 | −1.95 | 11.75 | 0.00 | 0.97 | 7.2 |
| 78132 | 20.723 | 0.14 | −0.18 | 14.61 | 0.00 | 0.24 | 2.0 |
| 78159 | 19.184 | 0.11 | −0.33 | 13.90 | 0.00 | 0.42 | 2.4 |
| 78481 | 15.785 | 0.02 | −4.39 | 13.74 | 0.00 | 0.82 | 2.6 |
| 79666 | 20.706 | 0.30 | −0.36 | 14.58 | 0.01 | 0.13 | 2.8 |
| 79882 | 13.583 | 0.01 | −4.64 | 11.97 | 0.00 | 1.11 | 3.6 |
| 80181 | 19.719 | 0.17 | −0.15 | 13.41 | 0.00 | 0.89 | 2.8 |
| 80538 | 21.698 | 0.21 | −0.07 | 14.83 | 0.00 | −0.02 | 1.2 |
| 80708 | 21.518 | 0.38 | −0.09 | 16.62 | 0.01 | 0.13 | 5.8 |
| 80816 | 15.756 | 0.02 | −1.95 | 11.89 | 0.00 | 1.63 | 3.0 |
| 81008 | 19.188 | 0.09 | −0.38 | 15.27 | 0.01 | −0.01 | 5.4 |
| 81833 | 17.021 | 0.04 | −1.26 | 12.70 | 0.00 | 1.98 | 2.2 |
| 82426 | 21.28 | 0.24 | −0.02 | 14.37 | 0.00 | 0.23 | 3.4 |
| 82730 | 20.386 | 0.26 | −0.16 | 14.15 | 0.01 | 0.35 | 2.5 |
| 82764 | 20.149 | 0.17 | −0.23 | 14.02 | 0.01 | 1.00 | 3.6 |
| 82989 | 21.406 | 0.34 | 0.17 | 14.25 | 0.01 | 0.52 | 2.3 |
| 83000 | 18.357 | 0.09 | −0.21 | 13.93 | 0.01 | 1.80 | 4.7 |
| 83138 | 20.437 | 0.16 | −0.98 | 14.68 | 0.01 | −0.33 | 4.7 |
| 83947 | 19.91 | 0.16 | −0.50 | 14.76 | 0.01 | 0.12 | 4.3 |
| 83999 | 20.495 | 0.26 | −1.22 | 14.39 | 0.01 | 0.14 | 3.0 |
| 84656 | 19.626 | 0.16 | −1.48 | 13.61 | 0.01 | −0.32 | 2.5 |
| 84691 | 20.508 | 0.21 | −0.21 | 14.15 | 0.00 | 0.73 | 3.0 |
| 84916 | 21.319 | 0.35 | −1.04 | 14.78 | 0.01 | −0.02 | 2.5 |
| 86459 | 22.381 | 0.21 | −0.19 | 15.67 | 0.01 | −0.01 | 3.7 |
| 86742 | 18.223 | 0.07 | 0.08 | 13.06 | 0.00 | 1.31 | 5.4 |
| 86786 | 21.413 | 0.33 | −0.85 | 15.01 | 0.01 | 0.05 | 3.2 |
| 87158 | 19.116 | 0.12 | −1.47 | 13.77 | 0.00 | 0.67 | 3.2 |
| 87308 | 20.141 | 0.20 | −0.64 | 14.37 | 0.01 | 0.48 | 1.7 |
| 87585 | 19.06 | 0.08 | −0.05 | 13.12 | 0.00 | 0.35 | 2.3 |
| 87834 | 21.446 | 0.43 | −0.21 | 14.69 | 0.01 | 0.25 | 2.1 |
| 88836 | 20.515 | 0.19 | −0.35 | 14.52 | 0.01 | 0.08 | 3.1 |
| 89047 | 20.912 | 0.18 | 0.03 | 13.85 | 0.00 | 0.43 | 1.9 |
| 89772 | 20.752 | 0.20 | 0.05 | 14.37 | 0.00 | 0.50 | 1.6 |
| 89826 | 19.622 | 0.11 | −0.08 | 13.54 | 0.00 | 0.26 | 5.0 |
| 91279 | 20.863 | 0.25 | −0.17 | 13.70 | 0.01 | 0.32 | 0.9 |
| 92831 | 20.519 | 0.04 | −0.13 | 13.89 | 0.00 | 0.31 | 4.0 |
| 92997 | 20.75 | 0.24 | −0.29 | 14.69 | 0.01 | 0.11 | 0.9 |
| 94490 | 15.535 | 0.02 | −4.84 | 13.91 | 0.01 | −0.01 | 2.7 |
| 97290 | 19.6 | 0.11 | −0.52 | 13.95 | 0.00 | 0.77 | 1.9 |
| 97783 | 17.823 | 0.06 | −3.09 | 12.88 | 0.00 | −0.72 | 3.3 |
| 98210 | 20.104 | 0.15 | −1.60 | 14.65 | 0.01 | 0.09 | 1.3 |
| 101101 | 19.754 | 0.13 | −0.53 | 13.98 | 0.01 | 0.13 | 4.0 |
| 101936 | 20.305 | 0.10 | −0.09 | 13.85 | 0.00 | 0.40 | 1.0 |
| 102515 | 21.531 | 0.31 | −1.85 | 14.63 | 0.01 | −1.53 | 3.5 |
| 102532 | 15.904 | 0.03 | −3.57 | 12.28 | 0.00 | −0.17 | 3.6 |
| 102891 | 20.788 | 0.16 | −0.36 | 14.32 | 0.01 | 0.05 | 3.5 |
| 103414 | 21.32 | 0.24 | −0.12 | 15.38 | 0.01 | 0.06 | 2.7 |
| 104202 | 20.709 | 0.25 | −0.42 | 13.63 | 0.01 | 0.21 | 1.1 |
| 105411 | 19.873 | 0.14 | −0.95 | 13.81 | 0.01 | −0.05 | 2.5 |
| 105502 | 19.313 | 0.09 | −0.09 | 13.84 | 0.00 | 1.14 | 3.2 |
| 105515 | 16.738 | 0.03 | −2.22 | 12.76 | 0.00 | 1.47 | 7.1 |
| 106055 | 21.61 | 0.44 | −0.88 | 14.75 | 0.00 | −1.07 | 5.6 |
| 106944 | 20.013 | 0.10 | −0.28 | 13.35 | 0.00 | 0.13 | 2.5 |
| 108102 | 20.838 | 0.14 | −0.26 | 15.01 | 0.01 | 0.21 | 2.2 |
| 108513 | 21.355 | 0.34 | −0.28 | 14.79 | 0.01 | 0.32 | 1.7 |
| 108868 | 18.951 | 0.08 | −1.57 | 13.41 | 0.00 | 0.29 | 1.6 |
| 109068 | 19.908 | 0.17 | 0.11 | 15.21 | 0.01 | 0.08 | 5.6 |
| 109352 | 19.305 | 0.18 | −1.33 | 13.49 | 0.00 | 0.14 | 4.0 |
| 109577 | 20.634 | 0.24 | −0.24 | 13.88 | 0.00 | 0.44 | 2.0 |
| 109654 | 20.591 | 0.18 | −0.11 | 14.39 | 0.01 | 0.27 | 4.4 |
| 110882 | 19.707 | 0.13 | −0.27 | 13.85 | 0.00 | 0.91 | 1.5 |
| 110900 | 21.397 | 0.17 | −0.41 | 14.18 | 0.00 | 0.02 | 3.5 |
| 111710 | 20.126 | 0.12 | −0.28 | 13.93 | 0.00 | 0.07 | 3.8 |
| 112067 | 19.382 | 0.06 | −1.87 | 14.14 | 0.00 | −0.44 | 6.3 |
| 112748 | 18.055 | 0.06 | −0.33 | 12.65 | 0.00 | 1.77 | 4.0 |
| 113521 | 20.212 | 0.11 | −0.26 | 13.32 | 0.00 | 0.14 | 3.4 |
| 115830 | 19.274 | 0.10 | −0.25 | 13.54 | 0.00 | 0.95 | 3.1 |
| 115919 | 18.603 | 0.07 | −0.83 | 13.29 | 0.00 | 1.33 | 3.6 |
| 115953 | 21.359 | 0.24 | −0.25 | 15.01 | 0.01 | 0.04 | 2.2 |
| 116355 | 21.378 | 0.33 | 0.54 | 13.86 | 0.01 | 0.05 | 1.3 |
| 116422 | 21.549 | 0.19 | −0.29 | 15.27 | 0.01 | −0.09 | 3.7 |
| 116823 | 22.022 | 0.18 | −0.76 | 16.45 | 0.01 | 0.05 | 3.3 |
| 116957 | 20.194 | 0.17 | −0.30 | 14.35 | 0.00 | −0.81 | 4.8 |
| 117541 | 20.955 | 0.14 | −0.33 | 14.87 | 0.00 | 0.16 | 4.0 |
| 117722 | 21.73 | 0.33 | 0.52 | 15.39 | 0.01 | 0.09 | 5.0 |
| 117778 | 22.298 | 0.29 | −0.21 | 15.26 | 0.01 | 0.11 | 1.5 |
Footnotes
- 1
An interesting comparison pair here is HD 4128 and HD 84441, neither of which are indicated by SIMBAD to be binaries, yet HD 4128 has a greater
 by a factor of 30. Of these two HD 84441 (HIP 47908) has a spectral classification as listed by SIMBAD of G1III, although others sources suggest G0II. Massarotti et al. (2008) measured a projected rotation speed of km s−1, which is quite high for an isolated giant star. By contrast, HD 4128 (HIP 3419) is a high-proper-motion star of spectral type G9.5III that has been the subject of a number of X-ray (Einstein, ROSAT, and ASCA) detections, yet Massarotti et al. (2008) measured a lower (=6.8 km s−1) than for HD 84441.
 - 2
There was no overlap in stars between our sample and the Dixon et al. (2020) sample.
- 3
All three of these papers pertain to giants of near-solar metal abundances and so no statements are made here as to how the FUV brightness may vary with metallicity.


