


ABSTRACT
We report the discovery of significant mass/light offsets in the strong gravitational lensing system SDSS J1011+0143. We use the high-resolution Hubble Space Telescope (HST) F555W- and F814W-band imaging and Sloan Digital Sky Survey (SDSS) spectroscopy of this system, which consists of a close galaxy pair with a projected separation of  at zlens ∼ 0.331 lensing an Lyα emitter (LAE) at zsource = 2.701. Comparisons between the mass peaks inferred from lens models and light peaks from HST imaging data reveal significant spatial mass/light offsets as large as 1.72 ± 0.24 ± 0.34 kpc in both filter bands. Such large mass/light offsets, not seen in isolated field lens galaxies and relaxed galaxy groups, may be related to the interactions between the two lens galaxies. The detected mass/light offsets can potentially serve as an important test for the self-interacting dark matter model. However, other mechanisms such as dynamical friction on spatially differently distributed dark matter and stars could produce similar offsets. Detailed hydrodynamical simulations of galaxy–galaxy interactions with self-interacting dark matter could accurately quantify the effects of different mechanisms. The background LAE is found to contain three distinct star-forming knots with characteristic sizes from 116 to 438 pc. It highlights the power of strong gravitational lensing in probing the otherwise too faint and unresolved structures of distance objects below subkiloparsec or even 100 pc scales through its magnification effect.
Export citation and abstract BibTeX RIS
1. INTRODUCTION
Galaxies are the fundamental building blocks of the visible universe. They contain all the known ingredients in the universe, including stars, gas, and dark matter. In the currently well-established Λ cold dark matter (ΛCDM) scenario (e.g., Riess et al. 1998; Perlmutter et al. 1999; Burles et al. 2001; Anderson et al. 2014; Planck Collaboration et al. 2015), galaxies form in the so-called bottom-up hierarchical clustering fashion, with low-mass galaxies and dark matter halos that galaxies reside in forming early and subsequently growing and merging to form more massive galaxies/halos (e.g., Peebles & Dicke 1968; White & Rees 1978; Blumenthal et al. 1984; White & Frenk 1991; Kauffmann et al. 1993; Navarro et al. 1995).
Interacting galaxies serve as valuable astronomical laboratories, allowing the study of different species of particles under violent dynamical conditions, and hence augmenting our understanding of the natures of stars, gas, and dark matter. By monitoring X-ray and H i data in galaxy clusters and merging galaxies, gas is found to fall behind stars and dark matter during galaxy interactions (e.g., Cayatte et al. 1990; Allen et al. 2002; Markevitch et al. 2002; Clowe et al. 2004; Kenney et al. 2004; Markevitch et al. 2004; Bradač et al. 2006; Randall et al. 2008; Million et al. 2010; Köhlinger & Schmidt 2014). This lagging is consistent with the ram pressure stripping picture first proposed by Gunn & Gott (1972), in which the interstellar gas is slowed down by the ram pressure of the intracluster medium. Stars are barely affected as they are much more massive and tightly bound.
Owing to its dark nature, dark matter can only be probed by a limited number of techniques. Being extremely sensitive to gravity, the strong gravitational lensing effect is the most powerful and promising probe of dark matter. Utilizing multiple images seen in strong gravitational lensing systems, people have confirmed the existence of dark matter and explored its properties to a great extent (e.g., Kochanek 1995; Keeton et al. 1998; Rusin et al. 2003; Bolton et al. 2008a, 2008b, 2012; Brownstein et al. 2012; Vegetti et al. 2012; Nierenberg et al. 2014; Shu et al. 2015). Recently, several studies have detected a further separation between the distributions of stars and total mass in galaxy clusters (e.g., Williams & Saha 2011; Mohammed et al. 2014; Harvey et al. 2015; Massey et al. 2015). Such separations can be used to test the self-interacting dark matter model, because dark matter self-interactions would induce an extra drag force only on dark matter and therefore separate it from stars.
Indeed, several recent works have estimated the lower limits on the dark matter self-interacting cross section assuming that the detected mass/light offsets are solely caused by dark matter self-interactions (Williams & Saha 2011; Kahlhoefer et al. 2015; Massey et al. 2015). However, other possibilities need to be taken into account as well when interpreting such separations (e.g., Kahlhoefer et al. 2014; Mohammed et al. 2014; Massey et al. 2015).
On the other hand, significant mass/light offsets have never been detected in galaxy-scale or galaxy-group-scale systems. Extensive studies of over 200 isolated strong lens galaxies discovered by the Lenses Structure and Dynamics (LSD) Survey, the Sloan Lens ACS (SLACS) Survey, the BOSS Emission-Line Lens Survey (BELLS), the Strong Lensing in the Legacy Survey (SL2S), and the SLACS for the Masses (S4TM) Survey have verified that in general light traces mass well in terms of the coincidence of centroids (e.g., Treu & Koopmans 2004; Koopmans et al. 2006; Gavazzi et al. 2007; Bolton et al. 2008a; Brownstein et al. 2012; Sonnenfeld et al. 2013; Newman et al. 2015; Shu et al. 2015). To date, approximately 100 group-scale strong lenses have been identified in the Cambridge And Sloan Survey Of Wide ARcs in the skY (CASSOWARY) Survey (Stark et al. 2013), the Sloan Bright Arcs Survey (Kubo et al. 2010), and the Strong Lensing Legacy Survey-ARCS (SARCS) sample (More et al. 2012), as well as other individual observations. No mass/light offsets have been reported in these group-scale lenses either, although some works explicitly fix the mass centroid to that of the light for systems with insufficient constraints (e.g., Dye et al. 2008; Belokurov et al. 2009; Limousin et al. 2009; Suyu et al. 2009; Jones et al. 2010; Grillo & Christensen 2011; Oguri et al. 2012; Grillo et al. 2013, 2014; Foëx et al. 2014). Nevertheless, the nondetections suggest that these isolated lens galaxies and galaxy groups are substantially relaxed.
In this paper, we present the first detection of significant mass/light offsets on galaxy scales. The system we study is the strong gravitational lens system SDSS J1011+0143, which was first discovered by Bolton et al. (2006b) and further followed up with high-resolution Hubble Space Telescope (HST) imaging observations. A galaxy pair consisting of two early-type galaxies (ETGs) with a projected distance of 0 88 at redshifts of ∼0.331 acts as the lens, while the background source is an Lyα emitter (LAE) at
  . We perform lens modeling based on the HST F555W- and F814W-band imaging data and construct the total mass distributions in both filter bands for SDSS J1011+0143. The mass-model results from both filter bands are in excellent agreement. The mass peaks inferred from lens models exhibit clear spatial offsets up to
  , or equivalently 1.72 ± 0.24 ± 0.34 kpc, from the starlight peaks seen in both filter bands. We suggest that the offsets in SDSS J1011+0143 are caused by the interactions of the lensing galaxy pair.
The paper is organized as follows. Section 2 introduces the HST imaging data used. Section 3 explains our lens modeling strategy. Results are summarized in Section 4. We discuss the detected mass/light offsets in Section 5, and we present the conclusions in Section 6. For all calculations, we adopt a fiducial cosmological model with  ,
,  , and
, and  (WMAP7; Komatsu et al. 2011).
2. THE DATA
SDSS J1011+0143 was first identified as a strong gravitational lens system by Bolton et al. (2006b) based on the presence of an anomalous high-significance emission line at  in its Sloan Digital Sky Survey (SDSS) spectrum. Follow-up long-slit spectroscopic and imaging observations using the Low Resolution Imaging Spectrometer (LRIS; Oke et al. 1995) on the Keck I telescope confirmed the spectroscopic line detection and revealed quadruple lensed images in a symmetric configuration. The foreground lens, appearing to be a single component in both the SDSS and Bolton et al. (2006b) observations, had a spectroscopic redshift of
  . The anomalous emission line, coincident with the lensed images on either side of the lens galaxy as indicated by the LRIS long-slit spectroscopy, showed the classic, asymmetric morphology, typical of Lyα emission (
 ). It was therefore determined to be a Lyα emission coming from a background LAE at
  because there are no other lines detected such as would be expected if it were something else. Based on the LRIS B-band imaging data, Bolton et al. (2006b) found the Einstein radius of SDSS J1011+0143 to be
  and the total mass within
  to be
to be  .
.
The data that we use in this work were collected by the follow-up HST GO Program# 10831 (PI L. Moustakas) through the F555W (V) and F814W (I) filters of the Wide-Field Channel (WFC) of the Advanced Camera for Surveys (ACS). For each filter, four subexposures, each with an exposure time of 522 s, were successfully taken in 2006 November and December. The archival flat-fielded (FLT) subexposure data for each filter were fully reduced and combined using the custom-built GUI tool, ACSPROC, following the recipe described in Bolton et al. (2008a), Brownstein et al. (2012), and Shu et al. (2015).
Figure 1 shows the reduced central  mosaics of the lens system SDSS J1011+0143 viewed in the HST F555W band (top) and F814W band (bottom). The overall configuration of the system looks alike in both filter bands. The high spatial resolution of the HST reveals that the foreground lens actually comprises two distinct luminous components. The primary lens galaxy at which the mosaics are centered is brighter and more extended, while the secondary lens is located
  away to the southeast. The spatially resolved four lensed images also indicate a multicomponent source configuration. Although no spectroscopic data are currently available for each individual lens galaxy, neither the central
  -radius aperture-integrated spectrum from SDSS nor the long-slit observation going across the minor axis of the unresolved lens shows any noticeable structures in the absorption lines indicating two different redshifts. As will be shown later, the two lens galaxies also have the same V – I color (within the errors). Therefore, they must have similar redshifts. That is further supported by the slightly distorted morphological shapes of the two lens galaxies and a possible "bridge" between them as indications of recent/ongoing galaxy interactions. Considering that the SDSS-measured velocity dispersion of the unresolved system is 259 ± 16 km s
  with a resolution of 70 km s−1, we estimate the relative line-of-sight velocity of the two lens galaxies to be
  km s−1.
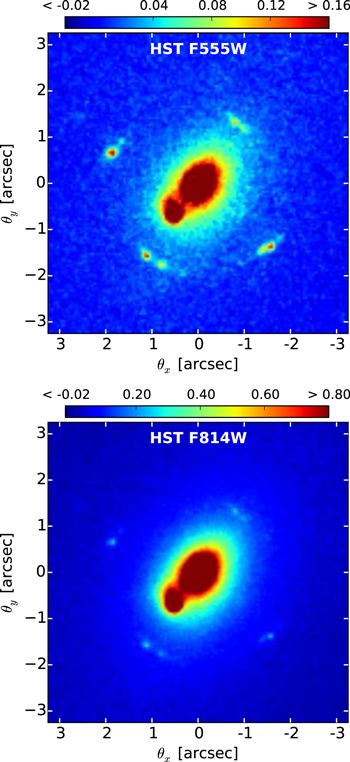
Figure 1. Central  mosaics of the lens system SDSS J1011+0143 viewed in the HST F555W (top) and F814W (bottom) bands. All images displayed in this paper are oriented such that north is up and east is to the left, with units of x and y giving offsets in R.A. (J2000) and decl. (J2000) relative to the center (
 ,
,  ). The color bars indicate the intensity levels in units of electrons per second per pixel2.
Download figure:
Standard image High-resolution imageThe major difference between the F555W band and F814W band is in the contrast between the foreground lens galaxies and lensed images. The lens galaxies are much brighter ( ) viewed in the F814W band, while the brightnesses of the lensed images stay about the same in the two bands. As a result, the image contrast is much more favorable for the study of the relatively faint lensed source in the F555W band. This is exactly as expected because the background source is an LAE, presumably with active star formation, and should appear bluer in color as compared to the foreground lenses that are red ETGs.
We note here that for all the HST imaging data, the corresponding pixel count errors are rescaled such that the average error of the background matches the standard deviation of the background to correct for possible correlations in the errors caused by the image resampling procedure in the data reduction.
3. LENS MODELING STRATEGY
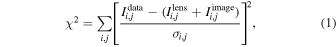
In order to obtain an accurate lens model from the two-dimensional imaging data, the surface brightness distribution of the foreground lens needs to be appropriately modeled, especially when it contributes a significant fraction to the light budget at positions of the lensed features. As shown by Figure 1, SDSS J1011+0143 consists of two luminous lens galaxies with distorted morphologies. A simple two-component fit to the foreground light assuming a Sérsic model (Sérsic 1963) leaves two relatively localized clumps of residuals around the centers of the two lens galaxies. We therefore build a four-Sérsic component model for the foreground-light distribution.
To generate the lens model, we employ the parametric lens fitting technique implemented in Shu et al. (2015) with appropriate modifications. The total surface mass distribution is assumed to be contributed solely from the lens galaxy pair characterized by two singular isothermal ellipsoid (SIE) mass clumps. The total deflection angle is calculated analytically following Kormann et al. (1994). We continue adding Sérsic blobs one by one to model the surface brightness distribution of the background source until a satisfactory fit is achieved. In the end the source is modeled by three Sérsic blobs. The predicted lensed images are generated by forward ray tracing.
Instead of performing lens modeling on the foregroud-light-subtracted data as is commonly done in the community (e.g., Koopmans et al. 2006; Marshall et al. 2007; Bolton et al. 2008a; Newton et al. 2011; Brewer et al. 2012; Brownstein et al. 2012; Sonnenfeld et al. 2013; Shu et al. 2015), we fit the foreground light and mass simultaneously in this work. This treatment has the advantage of largely reducing the systematic errors in the inferred model parameters that, as discussed by Bolton et al. (2006a) and Marshall et al. (2007), get introduced by adopting different foreground-light subtraction methods with different parameterized models, especially when the foreground-light subtraction and lens modeling are done separately. The foreground-light distribution model is combined with the predicted lensed images and convolved with the appropriate point-spread function (PSF) generated by the Tiny Tim tool (Krist 1993). The combined model is then compared to the observed data, and the goodness of fit is determined by the  function, defined as
where  ,
,  , and
, and  are the observed, PSF-convolved foreground lens, and PSF-convolved lensed image intensities at pixel
  in the image plane, respectively.
  is the rescaled flux error at pixel
  . All the model parameters are optimized using the Levenberg–Marquardt algorithm with the LMFIT package (Newville et al. 2014).
We apply the aforementioned lens modeling strategy to the data in both filters independently. As will be shown later, the best-fit models based on the two different sets of data converge nicely within uncertainties. Since the F555W-band results should in principle be less affected by the foreground-light subtraction (owing to better contrast of the lensed images relative to the lens galaxies), we quote F555W lens model parameters for definiteness in the text and report the results obtained from the F814W-band data in the tables for reference.
Marshall et al. (2007) explored the systematic uncertainty in the lens and source parameters introduced by different foreground-light subtraction schemes and found it to be ∼0.6% in the Einstein radius, ∼2% in the source effective radius, and ∼0.1 mag in the source magnitude. Several other studies quantified the overall systematic uncertainty in the Einstein radius to be 2%–3% (Bolton et al. 2008a; Sonnenfeld et al. 2013). Compared to those studies, our strategy of fitting the light and mass simultaneously should in principle reduce that part of the systematic uncertainties. Nevertheless, we adopt 3% as a generous fractional uncertainty in the measured Einstein radius owing to foreground subtraction in subsequent analyses. As will be shown later, this 3% uncertainty is only a minor effect when compared to the statistical uncertainty of the derived lens model parameters.
4. RESULTS
4.1. Best-fit Parameters
Figure 2 illustrates the performance of the four-Sérsic model in the foreground-light subtraction. We obtain a satisfactory fit to the foreground-light distribution. As mentioned earlier, the performance is similarly good for the F814W-band data. Table 1 summarizes the best-estimated parameter values of the four-Sérsic model in both filter bands. We denote the four components as 1.1, 1.2, 2.1, and 2.2. We can see that both the primary lens and secondary lens can be well represented by a compact and bright component (1.1/2.1) and a more extended but relatively fainter component (1.2/2.2) with small separations (∼01–02) between the two. Combining light from 1.1 and 1.2, we estimate the V- and I-band AB apparent magnitudes for the primary lens to be 19.54 and 17.69, respectively. Similarly, the V- and I-band AB apparent magnitudes for the secondary lens are 22.14 and 20.38, respectively. For simplicity, we adopt the same error of 0.11 for the apparent magnitudes, or equivalently 10% fractional error in the fluxes as suggested by the best-fit model. Note that the two lens galaxies have the same V – I color within the errors, being 1.85 ± 0.16 for the primary lens and 1.76 ± 0.16 for the secondary lens. The centroid position, position angle, and axis ratio of the four components are consistent within 3σ between the F555W and F814W bands. The effective radius and Sérsic index are different mainly because the two bands essentially trace different populations of stars that presumably distribute differently.
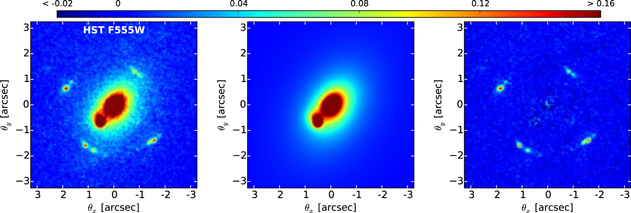
Figure 2. Performance of the foreground-light subtraction with the four-Sérsic model in the HST F555W band. The reduced data in the F555W band, the best-fit model, and the foreground-subtracted residual are shown from left to right, respectively.
Download figure:
Standard image High-resolution imageTable 1. Foreground-light Model Parameters
| Band | ID |

|
 a
a
|
 a
a
|

|
n |

|

|
|---|---|---|---|---|---|---|---|---|
| F555W | 1.1 | 19.54 ± 0.11 | −0.0095 ± 0.0006 | 0.0254 ± 0.0005 | 0.217 ± 0.008 | 2.11 ± 0.07 | 141.8 ± 0.6 | 0.686 ± 0.006 |
| 1.2 | 0.118 ± 0.005 | −0.084 ± 0.005 | 1.28 ± 0.04 | 1.43 ± 0.04 | 150.6 ± 0.5 | 0.665 ± 0.005 | ||
| 2.1 | 22.14 ± 0.11 | −0.5208 ± 0.0005 | −0.6889 ± 0.0008 | 0.0650 ± 0.0014 | 1.03 ± 0.08 | 169 ± 3 | 0.831 ± 0.014 | |
| 2.2 | −0.607 ± 0.006 | −0.496 ± 0.009 | 0.246 ± 0.009 | 0.93 ± 0.06 | 24 ± 19 | 0.95 ± 0.04 | ||
| F814W | 1.1 | 17.69 ± 0.11 | −0.0085 ± 0.0003 | 0.0260 ± 0.0002 | 0.274 ± 0.006 | 2.78 ± 0.04 | 143.1 ± 0.3 | 0.692 ± 0.002 |
| 1.2 | 0.130 ± 0.003 | −0.103 ± 0.003 | 1.70 ± 0.03 | 1.73 ± 0.02 | 149.8 ± 0.2 | 0.660 ± 0.002 | ||
| 2.1 | 20.38 ± 0.11 | −0.5206 ± 0.0002 | −0.6898 ± 0.0004 | 0.0530 ± 0.0006 | 1.18 ± 0.06 | 169 ± 1 | 0.785 ± 0.008 | |
| 2.2 | −0.601 ± 0.002 | −0.513 ± 0.004 | 0.244 ± 0.004 | 1.05 ± 0.03 | 23 ± 3 | 0.87 ± 0.02 |
Notes. Best-estimated parameter values of the foreground-light model. Columns (from left to right) represent the apparent magnitude, central x and y coordinates, effective radius, Sérsic index, position angle, and axis ratio of the individual Sérsic blob.
aPositions relative to the center of the cutout mosaic with R.A. (J2000) and decl. (J2000) of ( ,
,  ).
).
Download table as: ASCIITypeset image
Although the foreground-light distribution is complex, the best-fit lens mass model turns out to be rather simple. Figure 3 demonstrates the performance of the two-SIE lens model in the F555W band. The first three panels display the foreground-subtracted F555W-band data, the best-fit model, and the final residual. Critical lines connecting points of infinite magnification in the image plane are also plotted in white. We can see from the residual plot that the two-SIE lens model is sufficient to provide a satisfactory recovery of the observed quadruple lensed images. The  value of the fit defined by Equation (1) is 17,032 for a degree of freedom (dof) of 17,101. The F814W-band data are also well explained by a set of similar lens model parameters with a
  value of 18,384 for the same dof.
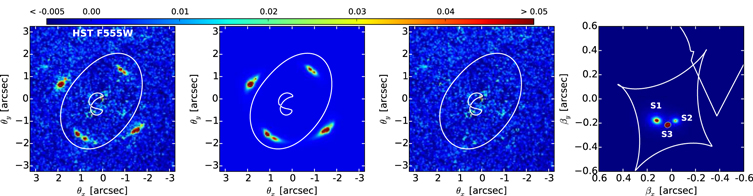
Figure 3. Performance of the lens model in the F555W band. The foreground-subtracted data in the F555W band, the best-fit lens model, the final residual, and the source-light distribution are displayed from left to right, respectively. White lines in the image plane (first three columns) are the critical lines, while white lines in the source plane (last column) are the caustics.
Download figure:
Standard image High-resolution imageThe best-estimated lens model parameters inferred from individual filter bands are summarized in Table 2. The first column is the lensing strength (Einstein radius)  in arcseconds. The reported uncertainty in
  is a combination of the statistical uncertainty and the 3% systematic uncertainty due to foreground subtraction in quadrature. The characteristic lensing velocity dispersion
  is related to
  as
as

where  and
and  are the angular diameter distances from the lens and the observer to the source, respectively. Here we adopt the intermediate-axis convention of Kormann et al. (1994) for
  and
and  . Focusing on the F555W band, the primary lens has a lensing velocity dispersion
  of 236 ± 18 km s−1. The secondary lens has a slightly smaller lensing velocity dispersion of
  km s−1.
Table 2. Lens Model Parameters
| Band | ID |

|

|
 a
a
|
 a
a
|

|
q |
|---|---|---|---|---|---|---|---|
| F555W | Lens 1 | 1.27 ± 0.20 | 236 ± 18 | 0.21 ± 0.05 | −0.03 ± 0.03 | 154 ± 2 | 0.626 ± 0.012 |
| Lens 2 | 0.65 ± 0.19 | 169 ± 25 | −0.51 ± 0.12 | −0.33 ± 0.05 | 148 ± 4 | 0.74 ± 0.03 | |
| F814W | Lens 1 | 1.26 ± 0.19 | 235 ± 18 | 0.23 ± 0.05 | −0.03 ± 0.03 | 154 ± 2 | 0.618 ± 0.016 |
| Lens 2 | 0.67 ± 0.19 | 171 ± 24 | −0.55 ± 0.13 | −0.32 ± 0.05 | 149 ± 5 | 0.76 ± 0.03 | |
Notes. Best-estimated parameter values of the lens model. Columns (from left to right) represent the Einstein radius, lensing velocity dispersion, central x and y coordinates, position angle, and axis ratio of the individual SIE clump.
aPositions relative to the center of the cutout mosaic with R.A. (J2000) and decl. (J2000) of ( ,
,  ).
).
Download table as: ASCIITypeset image
In the best-fit model, there are three distinct source components located within the caustics (the rightmost panel in Figure 3), which are the mappings of the critical lines in the source plane. We denote them as S1, S2, and S3 in descending order of brightness. Best-estimated values for a selection of source parameters are summarized in Table 3. The uncertainty in the source apparent magnitude is a combination of the statistical uncertainty and the 0.1 mag systematic uncertainty due to foreground subtraction in quadrature. The statistical uncertainty in the total flux is assumed to be equal to that of the peak intensity, which ranges from 5% to ~50%. We define the average magnification μ for each source component to be the ratio of the total flux mapped onto the image plane to the total flux in the source plane. S1 is the most luminous component with an intrinsic V-band AB apparent magnitude of 26.7 ± 0.6. Its effective radius is  in the source plane, which corresponds to a physical size of 438 ± 38 pc. S2 and S3 are relatively fainter and smaller with effective radii of 266 ± 37 pc and 116 ± 6 pc, respectively. All three source components are highly magnified by a factor of 19 or more. Recalling that the background source is an LAE at a redshift of 2.701, the HST F555W filter covers the rest frame ≈1200–1600 Å. The detected three distinct source components hence correspond to individual star-forming knots at subkiloparsec scales in the LAE. It highlights the power of strong gravitational lensing in probing the otherwise too faint, unresolved "fine" structures of distance objects below subkiloparsec or even 100 pc scales through its magnification effect.
Table 3. Source Model Parameters
| Band | ID |

|
μ |

|

|
n |
|---|---|---|---|---|---|---|
| F555W | S1 | 26.7 ± 0.6 | 19 ± 11 | 0.054 ± 0.005 | 438 ± 38 | 2.4 ± 0.3 |
| S2 | 28.1 ± 0.1 | 19 ± 1 | 0.033 ± 0.005 | 266 ± 37 | 1.4 ± 0.4 | |
| S3 | 28.2 ± 0.5 | 43 ± 20 | 0.014 ± 0.001 | 116 ± 6 | 0.22 ± 0.03 | |
| F814W | S1 | 26.4 ± 0.2 | 19 ± 4 | 0.055 ± 0.006 | 445 ± 48 | 2.1 ± 0.4 |
| S2 | 27.7 ± 0.1 | 16 ± 1 | 0.024 ± 0.002 | 192 ± 16 | 0.4 ± 0.2 | |
| S3 | 28.7 ± 0.6 | 86 ± 47 | 0.013 ± 0.008 | 109 ± 69 | 0.19 ± 0.03 | |
Note. Best-estimated parameter values of the source model. Columns (from left to right) represent the apparent magnitude, average magnification, effective radius in arcseconds and parsecs, and Sérsic index of the individual source component.
Download table as: ASCIITypeset image
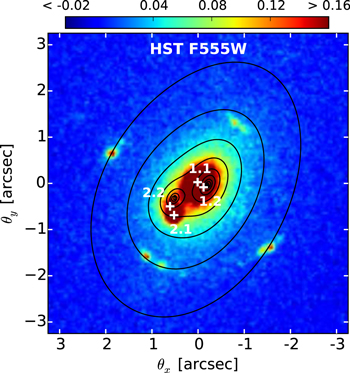
4.2. Mass/Light Offsets
The centroids of the projected mass components exhibit significant spatial offsets from the centroids of the corresponding luminous components in the lens galaxies. The offsets are clearly visualized in Figure 4, where we overlay the projected total mass isodensity contours (black) reconstructed from the lens model on the HST F555W-band image. The foreground-light peaks are marked by the white plus signs. We associate the mass peak near light peak 1.2 with the primary lens and the mass peak near light peak 2.2 with the secondary lens. The projected spatial mass/light offsets for the primary lens are
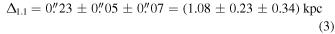
where  and
and  are the offsets between the mass and light peaks 1.1 and 1.2, respectively. Similarly, for the secondary lens,
Figure 4. Mass/light offsets in SDSS J1011+0143 in the HST F555W band. The black contours represent the surface mass isodensity levels. White plus signs mark the individual light peaks.
Download figure:
Standard image High-resolution image
Note that the first set of uncertainties in the above equations represent the statistical uncertainties from fitting the HST imaging data. The second set of uncertainties represent the systematic uncertainties in the data themselves including two major contributions, the  native pixel size of the HST WFC camera and the
  half-width at half-maximum of the applied PSF. Nevertheless, the detected mass/light offsets are of high statistical significances, especially for
  .
.
We point out that the offsets between the mass peak and the light peaks for the more massive primary lens ( and
and  ) are relatively smaller than those for the less massive secondary lens (
 and
and  ). In addition,
  and
and  point, to the zeroth order, in the opposite direction of
  and
and  . The separations from the mass peaks to the fainter, more extended light components 1.2 and 2.2 are smaller than those to the brighter and more compact light components 1.1 and 2.1. The statistical significances of offsets
  and
and  are
are  . The significance of
  is approximately 2.7σ, and the significance of
  is
is  .
.
5. DISCUSSION
First of all, we clarify that the detected spatial offsets are between the projected total mass, which includes stars, dark matter, and gas, and V+I-band light mostly from red, old stars in the two lens galaxies. In the central region that gravitational lensing is sensitive to, dark matter should contribute a substantial fraction to the total-mass budget. The lens system SDSS J1011+0143 in this work is directly comparable to the lens samples from the SLACS Survey (Bolton et al. 2008a) and the SLACS for the Masses (S4TM) Survey (Shu et al. 2015) in terms of galaxy properties as they are all ETGs at similar redshifts selected from the SDSS database with the same selection technique. Studies on the SLACS and S4TM samples have shown that the projected dark matter fraction within the Einstein radius is ∼30%–60% (Koopmans et al. 2006; Bolton et al. 2008b; Auger et al. 2010; Shu et al. 2015). Considering the facts that the dark matter fraction increases with galaxy mass/velocity dispersion and the velocity dispersions of the two lens galaxies in this work are at intermediate positions as compared to the SLACS and S4TM samples, we thus estimate the projected dark matter fraction of SDSS J1011+0143 within the region enclosed by the quadruple lensed images to be at a level of ~45%. Although the gas fraction cannot be determined with the current data, the detected [O ii] emission in the spectrum of SDSS J1011+0143 (Figure 1 in Bolton et al. 2006b) indicates a considerable amount of cold gas in this galaxy pair.
We argue that the detected mass/light offsets are real and not artificial owing to the limitations of our lens model. In this work, we use a relatively simple mass model with two SIE clumps for the total mass distribution. Suppose that the total mass distribution instead follows the light distribution and can be divided into four components, each of which is further separated into a stellar part and a dark matter part. Then the mass peaks of our adopted two-component model should have lain between light peaks 1.1 and 1.2 and between 2.1 and 2.2. This is obviously not the case as implied by Figure 4. We have considered a two-SIE plus external shear model but find that the external shear is consistent with zero and the mass/light offsets still persist. We also investigate the significance of the detected mass/light offsets by relaxing the assumption of an isothermal mass profile. In particular, we model the mass distributions of the two lens galaxies as two singular power-law ellipsoid (SPLE) clumps with the power-law index as an extra free parameter. We find that the two-SPLE lens model yields almost identical results with slightly better  value (only by a few). To further justify that, we test two-SPLE lens models with mass centroids manually bound to the light centroids with all four possible combinations (note that the light centroids are still free parameters). These "mass/light bound" models all yield poorer fits with
  of ∼100–1200 compared to the reported best-fit model. More importantly, the model with mass centroids bound to light components 1.2 and 2.2 has the smallest
  among all the "mass/light bound" models. It again supports our finding that the true mass centroids are closer to the faint and more extended light peaks 1.2 and 2.2.
The detection of significant mass/light offsets in the galaxy pair SDSS J1011+0143, although unexpected, is not a surprising result. Several lines of evidence, including the distorted morphological shapes, small projected separation, and presumably similar redshifts, suggest that the two lens galaxies have experienced/are still experiencing intense interactions. Stars, gas, and dark matter react differently during galaxy interactions. All materials including stars, gas, and dark matter in the interacting galaxies will experience dynamical friction and tidal stripping, which slow down and reshape the galaxies. Stars are effectively collisionless even under violent galaxy interactions. Interstellar gas is further subject to ram pressure, which exerts a drag force and is therefore lagged behind stars. The "Bullet Cluster" (1E 0657-558) is one of the most famous observational examples of such lagging (e.g., Markevitch et al. 2002; Clowe et al. 2004; Markevitch et al. 2004; Randall et al. 2008). Star formation activities will be triggered within the lagged and compressed gaseous regions. This is supported by the detected [O ii] emission in the spectra of the lens galaxies (Figure 1 in Bolton et al. 2006b), although the exact locations of star-forming regions are still unknown based on the current data.
The behavior of dark matter, however, is uncertain as its dynamical nature is still unsettled. Recently, several sets of observations of the galaxy cluster Abell 3827 have converged to the conclusion that one of the central galaxies in Abell 3827 exhibits a mass/light offset of  kpc, which was the first detection of a significant mass/light offset on galaxy-cluster scales (Williams & Saha 2011; Mohammed et al. 2014; Massey et al. 2015). The interpretation suggested by these works is that dark matter particles have a nonzero self-interaction cross section so that the collisions induce an extra drag force only on dark matter particles, which then get lagged behind stars. A constraint on the dark matter self-interaction cross section can thus be obtained from the amount of the offset, although the exact number is still subject to discussion (Kahlhoefer et al. 2015). Being the first detection on galaxy scales, the mass/light offsets in SDSS J1011+0143 can also be attributed to the nonzero self-interaction cross-section argument.
It is worth mentioning that several studies have pointed out that dynamical friction could also in principle induce a similar offset between the spatially more extended dark matter and the more centrally concentrated and therefore more dynamical-friction-resistant stars in galaxies undergoing merging (Kahlhoefer et al. 2014; Mohammed et al. 2014; Massey et al. 2015). Nevertheless, no matter which mechanisms produce the offsets, we suggest that interactions between the two lens galaxies are the underlying origin. Indeed, extensive studies of strong-lensing events in field galaxies and relaxed galaxy groups have shown that in general light traces mass well within uncertainties in terms of the coincidence of centroids (Treu & Koopmans 2004; Koopmans et al. 2006; Gavazzi et al. 2007; Bolton et al. 2008a; Dye et al. 2008; Belokurov et al. 2009; Limousin et al. 2009; Suyu et al. 2009; Jones et al. 2010; Grillo & Christensen 2011; Brownstein et al. 2012; Oguri et al. 2012; Grillo et al. 2013, 2014; Sonnenfeld et al. 2013; Foëx et al. 2014; Newman et al. 2015; Shu et al. 2015). Furthermore, the smaller offsets in the more massive galaxy and opposite direction between offsets associated with individual lens galaxies in SDSS J1011+0143 cannot be properly explained without considering the relative motion of the two lens galaxies.
Additionally, if the detected mass/light offsets are a result of dark matter lagging behind stars, the actual offsets between dark matter and stars should be larger than the reported values  ,
,  ,
,  , and
, and  , which are the offsets between the total mass and stars. Considering that the estimated dark matter fraction of SDSS J1011+0143 is about 50%, we expect that the offsets between dark matter and stars are approximately twice those reported numbers.
6. CONCLUSION
In this paper, we build detailed lens models based on high-resolution HST F555W- and F814W-band imaging data of the strong gravitational lens system SDSS J1011+0143, which comprises a pair of interacting ETGs at redshifts of ∼0.331 acting as the lens and an LAE at  as the background source. The foreground-light distribution is modeled as four distinct Sérsic components to substantially capture the distorted morphological shapes due to galaxy interactions. To model the total-mass distribution, we adopt a two-SIE clump model. With three Sérsic source components, we obtain a satisfactory fit to the observations. The V- and I-band AB apparent magnitudes of the primary lens are 19.54 ± 0.11 and 17.69 ± 0.11, and 22.14 ± 0.11 and 20.38 ± 0.11 for the secondary lens. The best-estimated mass- and source-model parameters are in excellent agreement between the two filter bands. In the F555W band, the Einstein radius of the more massive primary lens is
  , and
, and  for the relatively less massive secondary lens. The three highly magnified (
 or more) source components correspond to intrinsically faint and compact star-forming knots in the LAE with V-band apparent magnitudes from 28.2 to 26.7 and effective radii from 116 to 438 pc. It demonstrates the capability of strong gravitational lens systems as a natural cosmic telescope in resolving intrinsically faint and compact objects at large distances.
When comparing the projected total-mass peaks inferred from lens models to the starlight-distribution peaks, we find significant spatial offsets between the mass and light of both lens galaxies. The offsets in the primary lens point, to the zeroth order, in the opposite direction of those in the secondary lens. The largest offset is seen in the secondary lens, with a value of  (in the F555W band) or equivalently 1.72 ± 0.24 ± 0.34 kpc.
Such large mass/light offsets are not seen in field lens galaxies and relaxed galaxy groups studied in other works (Treu & Koopmans 2004; Koopmans et al. 2006; Gavazzi et al. 2007; Bolton et al. 2008a; Dye et al. 2008; Belokurov et al. 2009; Limousin et al. 2009; Suyu et al. 2009; Jones et al. 2010; Grillo & Christensen 2011; Brownstein et al. 2012; Oguri et al. 2012; Grillo et al. 2013; Sonnenfeld et al. 2013; Foëx et al. 2014; Grillo et al. 2014; Newman et al. 2015; Shu et al. 2015). We thus believe that the detected mass/light offsets in SDSS J1011+0143 are related to the interactions between the two lens galaxies. Indeed, similar mass/light offsets are reported in galaxy clusters where galaxy interactions are even more frequent and violent (e.g., Williams & Saha 2011; Mohammed et al. 2014; Harvey et al. 2015; Massey et al. 2015). These works propose that the mass/light offsets in galaxy clusters are caused by the separations between stars and dark matter, which is actually self-interacting instead of collisionless. They further provide estimations of the dark matter self-interacting cross section. However, estimation strategies are still subject to discussion (e.g., Williams & Saha 2011; Harvey et al. 2014; Kahlhoefer et al. 2015; Massey et al. 2015). Although the self-interacting dark matter hypothesis would have a great impact on our understanding of dark matter if it were confirmed, other alternative explanations do exist. For instance, several studies point out that dynamical friction under certain circumstances can produce similar offsets (Kahlhoefer et al. 2014; Mohammed et al. 2014; Massey et al. 2015).
To fully understand the detected mass/light offsets in SDSS J1011+0143, further observations and numerical simulations need to be carried out. The currently available HST F555W- and F814W-band photometric data are primarily sensitive to old stars in the lens galaxies, but not the recently born young stars and star-forming clouds, which should account for a substantial fraction in the mass budget in merging galaxies. Follow-up observations in the X-ray and radio can be helpful in determining the distribution of gas and provide a complementary view of this merging galaxy pair. So far spectroscopic data for SDSS J1011+0143 are limited to an SDSS observation covering the entire central  -radius region and a Keck long-slit observation across the minor axis of the unresolved system. Spatially resolved (integral-field) spectra for this system would provide two-dimensional kinematics measurements and a lensing-independent probe of the total mass distribution. Detailed hydrodynamical simulations on galaxy–galaxy interactions, similar to what has been recently done by Schaller et al. (2015) but with self-interacting dark matter considered, could quantify the relative effects of different mechanisms in producing the mass/light offsets observed in this system. Lastly, there is a significant handful of unmodeled multicomponent strong gravitational lenses in the SLACS and S4TM samples that would be a good next step for working on this topic further.
We thank the anonymous referee for helpful comments. The support and resources from the Center for High Performance Computing at the University of Utah are gratefully acknowledged. The work of L.A.M. and D.S. was carried out at Jet Propulsion Laboratory, California Institute of Technology, under a contract with NASA. A.D.'s research was supported by the National Optical Astronomy Observatory (NOAO). NOAO is operated by the Association of Universities for Research in Astronomy (AURA), Inc., under a cooperative agreement with the National Science Foundation. Support for program #10831 was provided by NASA through a grant from the Space Telescope Science Institute, which is operated by the Association of Universities for Research in Astronomy, Inc., under NASA contract NAS 5-26555.
Funding for the SDSS and SDSS-II has been provided by the Alfred P. Sloan Foundation, the Participating Institutions, the National Science Foundation, the U.S. Department of Energy, the National Aeronautics and Space Administration, the Japanese Monbukagakusho, the Max Planck Society, and the Higher Education Funding Council for England. The SDSS Web site is http://www.sdss.org/.
The SDSS is managed by the Astrophysical Research Consortium for the Participating Institutions. The Participating Institutions are the American Museum of Natural History, Astrophysical Institute Potsdam, University of Basel, University of Cambridge, Case Western Reserve University, University of Chicago, Drexel University, Fermilab, the Institute for Advanced Study, the Japan Participation Group, Johns Hopkins University, the Joint Institute for Nuclear Astrophysics, the Kavli Institute for Particle Astrophysics and Cosmology, the Korean Scientist Group, the Chinese Academy of Sciences (LAMOST), Los Alamos National Laboratory, the Max-Planck-Institute for Astronomy (MPIA), the Max-Planck-Institute for Astrophysics (MPA), New Mexico State University, Ohio State University, University of Pittsburgh, University of Portsmouth, Princeton University, the United States Naval Observatory, and the University of Washington.
Footnotes
- *
Based on observations made with the NASA/ESA Hubble Space Telescope, obtained from the Data Archive at the Space Telescope Science Institute, which is operated by AURA, Inc., under NASA contract NAS 5-26555. These observations are associated with program #10831.