


Abstract
NGC 1232 is a face-on spiral galaxy and a great laboratory for the study of star formation due to its proximity. We obtained high spatial resolution Hα images of this galaxy, with adaptive optics, using the SAM instrument at the SOAR telescope, and used these images to study its H ii regions. These observations allowed us to produce the most complete H ii region catalog for it to date, with a total of 976 sources. This doubles the number of H ii regions previously found for this object. We used these data to construct the H ii luminosity function, and obtained a power-law index lower than the typical values found for Sc galaxies. This shallower slope is related to the presence of a significant number of high-luminosity H ii regions (log L > 39 dex). We also constructed the size distribution function, verifying that, as for most galaxies, NGC 1232 follows an exponential law. We also used the Hα luminosity to calculate the star formation rate. An extremely interesting fact about this galaxy is that X-ray diffuse observations suggest that NGC 1232 recently suffered a collision with a dwarf galaxy. We found an absence of star formation around the region where the X-ray emission is more intense, which we interpret as a star formation quenching due to the collision. Along with that, we found an excess of star-forming regions in the northeast part of the galaxy, where the X-ray emission is less intense.
Export citation and abstract BibTeX RIS
1. Introduction
The distribution of H ii regions is an excellent tracer of the star formation in spiral galaxies (e.g., Kennicutt 1992). Catalogs of these regions provide an observational base that can be used to study global star formation across galactic disks. From observational properties of these regions (e.g., recombination lines or dust emission) quantities like the star formation rate (SFR) can be obtained.
The SFR is an important factor in the chemical evolution of a galaxy. Its value gives the total amount of gas converted to stars over a given time interval, which may depend on several environmental properties. It is long known that a large fraction of the star formation in the local universe occurs in gas-rich disk galaxies (Kennicutt 1989). Optical imaging clearly reveals that spiral arms in disk galaxies have a high concentration of young stars, implying that SFR must be higher in the arms regions than anywhere else in the galaxy. However, it is still a matter of debate if the higher SFR in the arms is just an effect of the larger gas densities (e.g., Elmegreen & Elmegreen 1986; Elmegreen 1995; Foyle et al. 2010), or if the mass excess in the arms could directly act to trigger the star formation (e.g., Roberts & Whitehurst 1975; Seigar et al. 2002; Gittins & Clarke 2004).
Grand-design and multi-arm spiral galaxies are ideal laboratories to study these effects. However, there are only a few of these galaxies close enough that individual clusters can be analyzed. A high-resolution study of these systems can help to shed some light on the nature of the processes converting gas into stars.
NGC 1232 is technically a grand-design spiral galaxy, practically face-on (inclination = 290; de Vaucouleurs et al. 1991; Corwin et al. 1994). Morphologically, it is classified as a SAB(rc)c. It has well-defined spiral arms, despite being a bit uncommon as they do not wind smoothly as expected for a galaxy of this type. Its arms appear to be "bent" in areas rather than gently winding structures seen in undisturbed spiral galaxies, which is probably related to the gravitational distortion caused by its satellite (Arp 1982). It is considered a prototype of multi-arm regular spirals, having hints of a bar in the nuclear region, a small bulge and long arms that disperse to the external regions, producing a number of thin arms. Radio studies suggest that it has a large neutral gas envelope that extends much beyond the optical limits of the galaxy (van Zee & Bryant 1999). It also has a satellite galaxy, NGC 1232A, with which it is believed it has interacted in complex ways, but due to the large difference in their redshifts and lack of any other sign of physical association, it is likely not currently interacting with it (Arp 1982). The estimated distance between NGC 1232 and its satellite is 2.4 Mpc (van Zee & Bryant 1999), which means that they are not currently physically associated. Both galaxies may be associated with the Eridanus group of galaxies, but at a projected distance of 2.2 Mpc from the center of the low-mass cluster, neither is likely to be bound to the cluster (Willmer et al. 1989).
NGC 1232 covers about 6 7 × 78 on the sky at a distance of 19.8 Mpc.4
The nuclear region seems dominated by an older population, as evidenced from the spectra in the optical (6df galaxy survey; Jones et al. 2009) and near-infrared (Martins et al. 2013), while the spiral arms are populated by numerous regions of star formation.
7 × 78 on the sky at a distance of 19.8 Mpc.4
The nuclear region seems dominated by an older population, as evidenced from the spectra in the optical (6df galaxy survey; Jones et al. 2009) and near-infrared (Martins et al. 2013), while the spiral arms are populated by numerous regions of star formation.
In a recent study, Garmire (2013) provides evidence that NGC 1232 suffered a collision with a dwarf galaxy using X-ray images from NASA Chandra Observatory. This result is based on the detection of an unusual pattern of diffuse emission, which is related to a shocked gas region with a temperature of 5.8 MK, covering an impact area of 7.25 kpc in diameter. The image of the collision (Figure 1 of Garmire 2013) reveals a cloud with a cometary appearance sweeping across the galaxy and possibly colliding with the disk. The center of the collision is about 4.3 kpc to the west of the nucleus of NGC 1232. According to the authors the shock wave of this collision may have triggered some star formation, producing bright and massive stars.
Motivated by the observed diffuse X-ray emission by Garmire (2013), we obtained optical high angular resolution imaging of NGC 1232 in g', r', and Hα to study its star formation activity, searching for the connection to the spiral arms and looking for additional evidence of this putative collision. The paper is divided as follows: in Section 2, we present the observations and data reduction; in Section 3, we present the H ii regions detection; in Section 4, we present the catalog properties; in Section 5, we obtain the SFR distribution and discuss the results; and in Section 6, we present our conclusions.
2. Observations and Data Reduction
2.1. Observations
NGC 1232 was observed on the night of 2014 January 23 (Program SO2013B-021), with the filters g', r', and Hα. The observations were carried out with the SOAR telescope using the SOAR Adaptive Module (SAM), an instrument with an installed laser-assisted adaptive optics (AO) system (Fraga et al. 2013). By selectively compensating for low-altitude turbulence, AO improves resolution at visible wavelengths. The instrument contains a 4k × 4k pixels CCD sensor that spans a square field of 3'. The natural seeing in the V band during the observations was 0 8. With AO the V-band seeing improved to 055. In Hα, the seeing was 05 and in the g' band, 066. Three individual on-source integrations were carried out for each filter, of 240 s each for g' and r' and 600 s for Hα. The standard star Hiltner 600 was also observed in the three filters for flux calibration purposes.
2.2. Reduction and Calibration
The images were reduced in a standard way using the Image Reduction and Analysis Facility (IRAF5
; Valdes 1998; Valdes & Tody 1998). The reduction process includes bias subtraction, flat-field corrections, and cosmic-ray cleaning. Correction for Galactic extinction was applied using the dust maps from Schlegel et al. (1998) and the extinction law from Cardelli (1989). SAM has a substantial optical distortion, typical of two off-axis parabolic mirrors (Fraga et al. 2013). The distortion can reach up to 42 pixels (193 in the sky) in the image. The distortion is well described by quadratic terms in x and y (in pixels, described in the instrument manual), and we applied these corrections to our images.
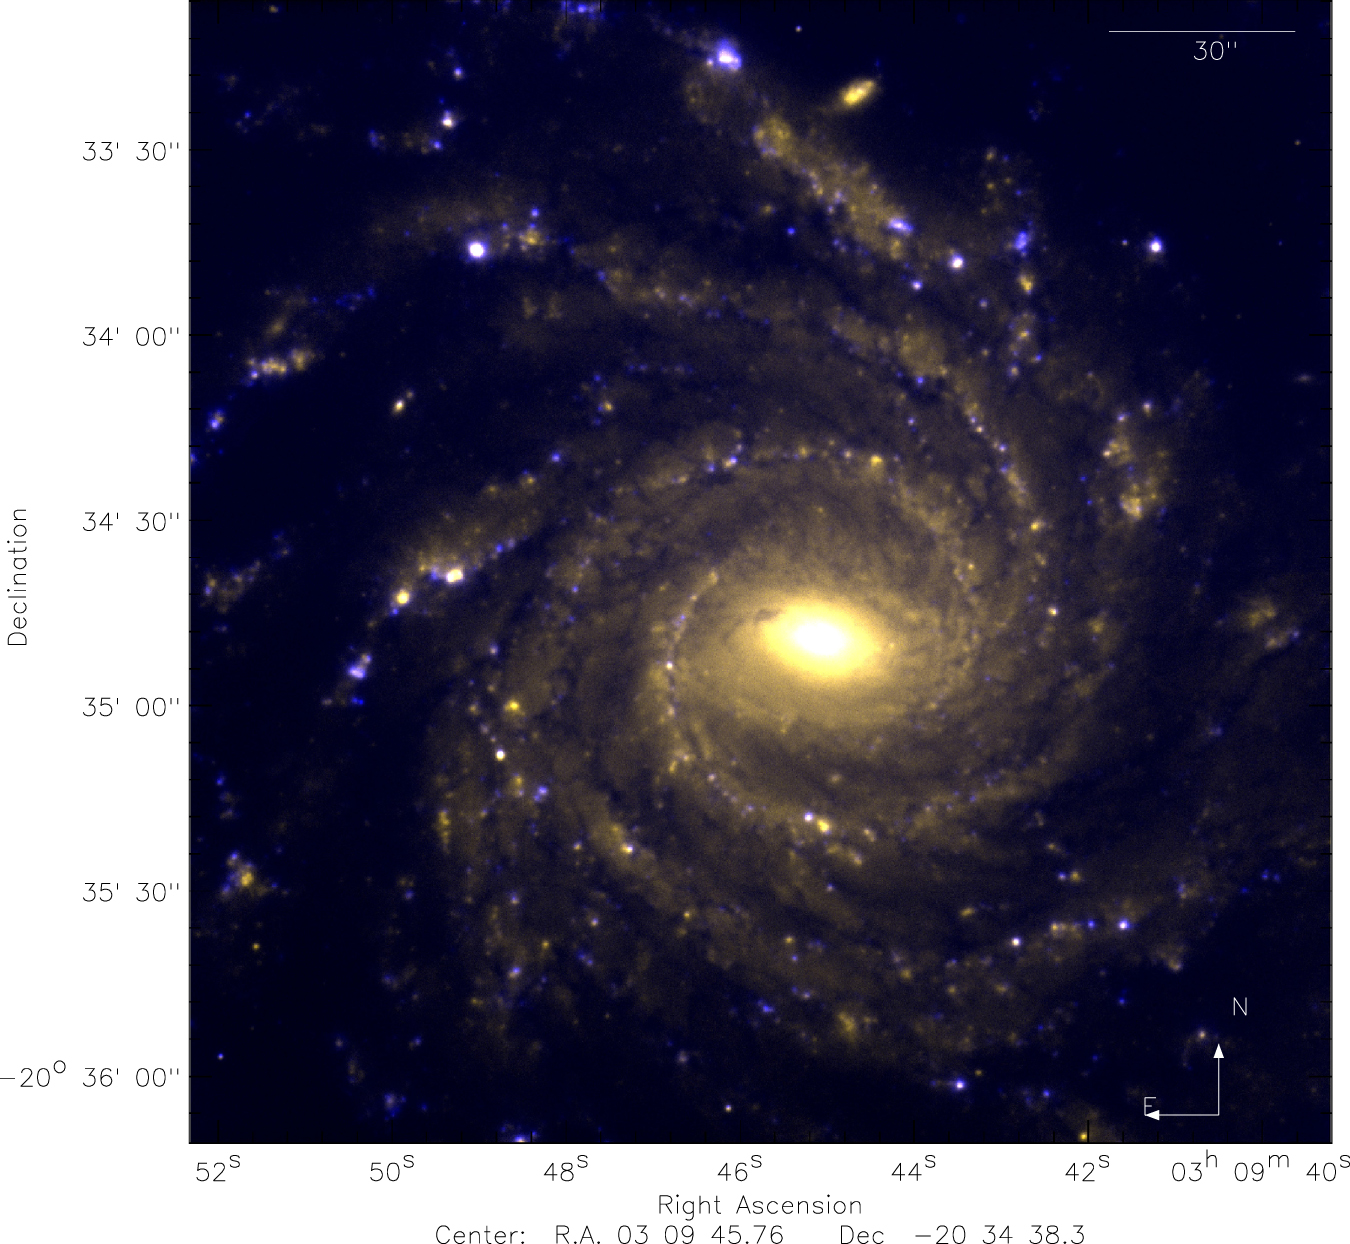
Flux calibration was done using the g', r' and Hα images of the standard star. Using these images, the transmission curves of each filter6 and its flux-calibrated spectrum obtained from Hamuy et al. (1992, 1994), we calculated the conversion factor from photon counts to flux units (erg cm−2 s−1). Figure 1 shows the resulting image obtained after combining the final exposures in each filter.

Figure 1. NGC 1232 combined flux-calibrated image of the filters g' (green), r'(red), and Hα (blue), obtained with the instrument SAM at SOAR.
Download figure:
Standard image High-resolution image3. Hα Photometry and H ii Region Identification
The continuum subtraction was done using the r' image as described in Schmitt et al. (2006). Since this is a broadband filter and encompasses the Hα emission-line region, it is contaminated by that emission. This means that besides the scaling for the Hα filter width, it has to be corrected for the contribution of the Hα flux to the total observed flux. The subtraction then has to be recursive. This is done by first subtracting the scaled continuum image from the line image; then, the resulting line image was subtracted from the continuum image to remove the emission-line contribution to this image, and the corrected continuum image was used to subtract the continuum emission from the original line image. This process was repeated a few times, until the Hα and continuum fluxes in regions affected by contamination did not change, indicating that the process had converged. In total, we needed six iterations to reach convergence.
The detection of the H ii regions in the NGC 1232 Hα image was performed with the aid of SExtractor (Bertin & Arnouts 1996). This software is used to build a catalog of objects from an astronomical image. It first determines the background, and then which pixels of the image are objects, able to separate close or superimposed objects. For each identified H ii region, its position and size are determined by fitting an ellipse function. It also derives the photometry of each source. There are two important input parameters used in SExtractor for H ii region photometry, the minimum number of pixels of a given source and the minimum flux compared to the background. We adopted 10 pixels as the minimum number of pixels for an object to be detected, which roughly correspond to the seeing of the observation. We also required that to be detected the sources should have a minimum flux of 2σ, where σ is the average sky noise around the source. The average sky noise surface brightness in our image was about 2 × 10⁻¹⁸ erg cm2 s−1 arcsec−2.
We detected 976 sources. The highest number of sources ever detected for this galaxy was 529 sources by Hodge & Kennicutt (1983). It is important to take into account that our result almost doubles the number of sources already detected for this galaxy, even though our image does not encompass the whole galaxy but only the central part.
A direct comparison of individual H ii regions properties from our study and Hodge & Kennicutt (1983) is extremely difficult. This is because their study was done using a photographic plate, and no information about sensitivity is given in their paper. Also, they state that the individual separation of the objects is dependent on the properties of the plate, and many times a number of bright knots in a lower-luminosity envelope were given a single object identification number.
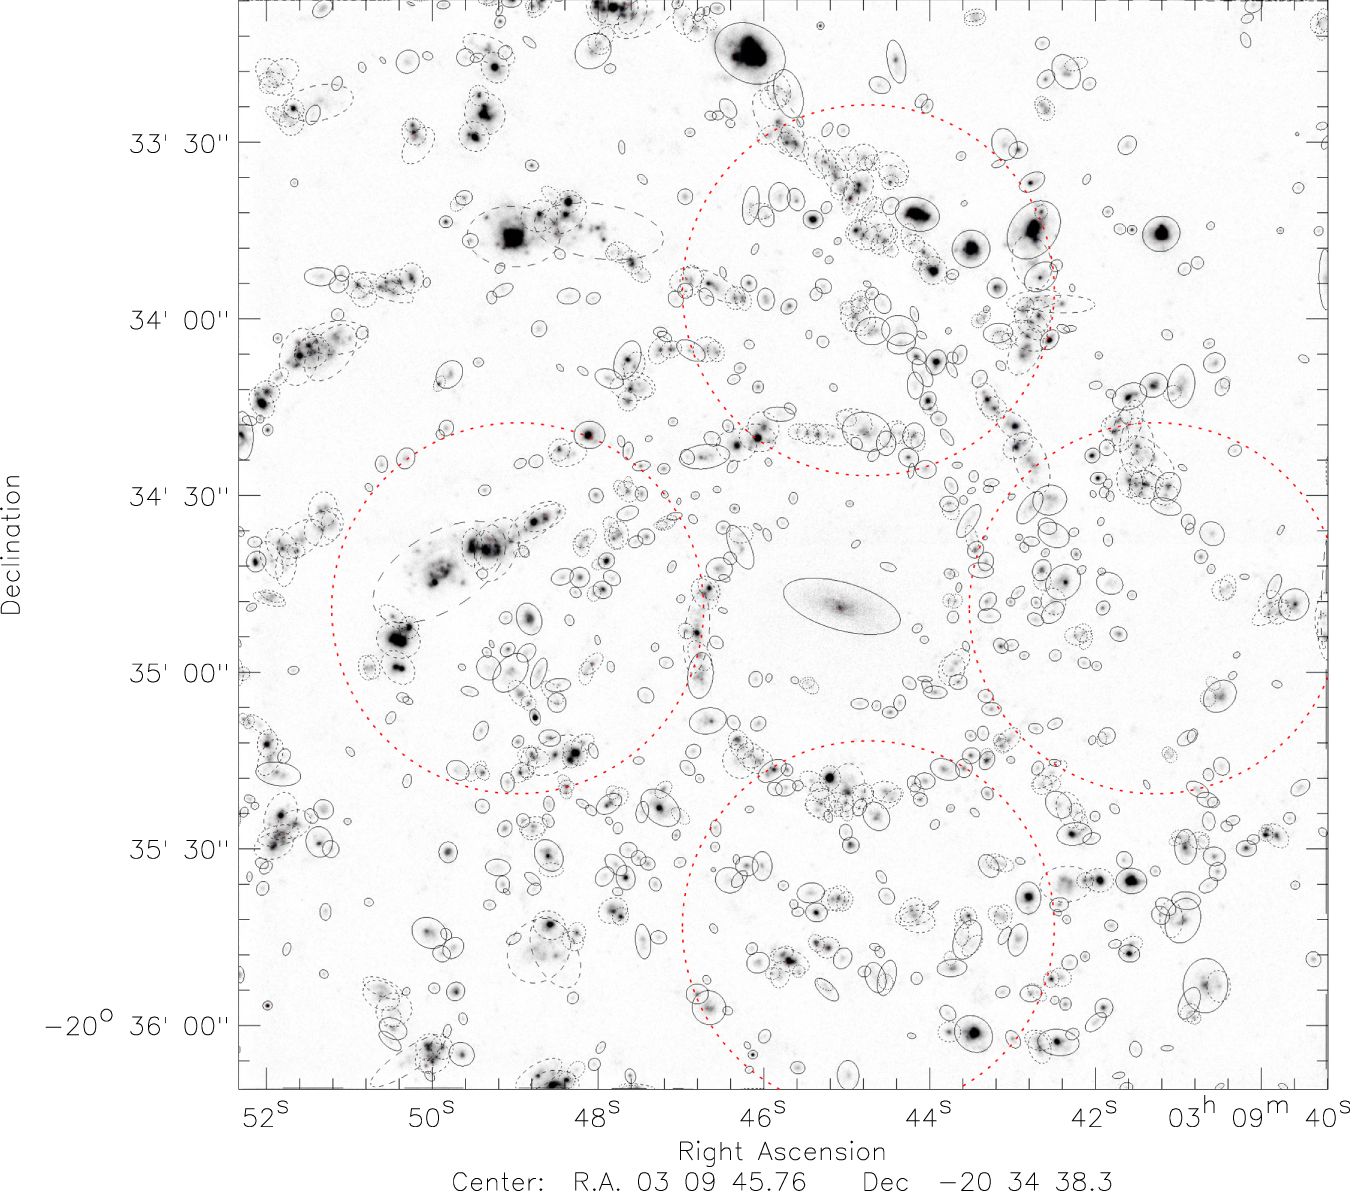
In any case, we expect that the higher number of H ii regions identified here can help to improve studies such as the nature of the spiral structure and the spatial distribution of star-forming regions, abundance gradients, and the use of H ii properties (sizes, luminosities, etc.) for the extragalactic distance scale. Figure 2 shows the sources detected by SExtractor. Table 1 shows, as an example, the 10 most luminous H ii regions detected. The complete catalog can be found in the online material.

Figure 2. H ii regions fitted by SExtractor for NGC 1232. As in Figure 1, north is up and east is left. Darker H ii regions are regions with higher Hα emission. Black dashed lines represent fonts marked with the crowded flag, where the Kron radius measured by SExtractor was not determined with confidence. We detected 976, which is the highest number of sources ever detected for this galaxy. The large dotted red circles refer to Figure 3.
Download figure:
Standard image High-resolution imageTable 1. Data for the 10 Most Luminous H ii Regions Detected in Galaxy NGC 1232
| Source | Position (R.A.) | Position (Decl.) | F(Hα) (10−17 erg cm−2 s−1) | SFR (M⊙/yr) | Area (pixel2) | L(Hα) (erg s−1) |
|---|---|---|---|---|---|---|
| 1.0 | 03h09m45 70 70 |
−20h33m1635 |
16220.49 ± 7.99 | 40.332e–3 ± 4.840e–3 | 9670.00 | 7.61e+39 |
| 2.0 | 03h09m4293 |
−20h33m4688 |
11033.00 ± 7.91 | 27.433e–3 ± 3.292e–3 | 9366.00 | 5.18e+39 |
| 3.0 | 03h09m4764 |
−20h33m4309 |
4593.81 ± 4.58 | 11.422e–3 ± 1.371e–3 | 3051.00 | 2.16e+39 |
| 4.0 | 03h09m4900 |
−20h33m4582 |
4528.41 ± 5.67 | 11.260e–3 ± 1.351e–3 | 4841.00 | 2.12e+39 |
| 5.0 | 03h09m4206 |
−20h34m4309 |
3880.59 ± 7.12 | 9.649e–3 ± 1.158e–3 | 7131.00 | 1.82e+39 |
| 6.0 | 03h09m5050 |
−20h33m4672 |
3652.16 ± 4.41 | 9.081e–3 ± 1.090e–3 | 2902.00 | 1.71e+39 |
| 7.0 | 03h09m4158 |
−20h34m5459 |
3640.34 ± 4.34 | 9.052e–3 ± 1.086e–3 | 2848.00 | 1.71e+39 |
| 8.0 | 03h09m4826 |
−20h33m4891 |
2729.06 ± 4.11 | 6.786e–3 ± 0.814e–3 | 2503.00 | 1.28e+39 |
| 9.0 | 03h09m4412 |
−20h33m0882 |
2611.27 ± 3.74 | 6.493e–3 ± 0.779e–3 | 2147.00 | 1.23e+39 |
| 10. | 03h09m4261 |
−20h33m2654 |
2354.45 ± 4.36 | 5.854e–3 ± 0.703e–3 | 2839.00 | 1.10e+39 |
Only a portion of this table is shown here to demonstrate its form and content. A machine-readable version of the full table is available.
Download table as: DataTypeset image
The Hα luminosity of each H ii region can be obtained from the Hα flux measured by SExtractor, after correcting for two effects: internal extinction and the contamination from [N ii] lines to the total flux.
For the internal extinction, we adopt the values of Bresolin et al. (2005), who measured emission lines of 13 H ii regions in NGC 1232. They obtained the interstellar extinction using the Balmer decrement measured using the Hα, Hβ, and Hδ lines. From their values of c(Hβ) and using Cardelli (1989) extinction law, we obtain AHα, which varies from 0.0 to 0.8, with an average value of 0.52, removing the lowest and the highest values. We then applied this average value to correct the flux of all H ii regions in our sample.
The correction for the contamination of [N ii] is necessary because the lines [N ii] λ6548 Å and [N ii] λ6584 Å are very close to the Hα line and fall within the bandpass of the Hα filter used. To this purpose, we again use the values obtained by Bresolin et al. (2005). Although the study is based only on strong emission-line regions, searching for high-metallicity objects, we believe they give the best estimate for the [N ii]/Hα ratio we could get for this galaxy, instead of doing actual spectroscopy of each region (which is beyond the scope of this paper). They found a large variation of this ratio, with values between 0.07 and 0.63, with 61% of the objects with a ratio smaller than 0.3. We excluded the highest and lowest values, and from these data we obtained an average [N ii]λ6584 Å/Hα ratio of 0.24. To account for the other [N ii] line, we used the theoretical ratio between the two, which is 1/3. We then assumed that, on average, 32% of the flux measured by SExtractor for each H ii region is a contamination by the [N ii] lines, and corrected for this amount. It is important to realize that this is an approximation, since each object might have very different ratios from this average value, and the errors associated with this will propagate to the Hα luminosity and SFR measurements. After these corrections the Hα fluxes were employed to derive the Hα luminosity adopting a galaxy distance of 19.8 Mpc.
4. Catalog Properties
The faintest H ii region luminosity measured was about 7.6 × 1035 erg s−1. These low luminosity regions are probably ionized by single stars or matter bounded regions with significant photon loss (Youngblood & Hunter 1999). The most luminous H ii region we detected in NGC 1232 has a luminosity of 6.6 × 1039 erg s−1, comparable with the luminosity of the 30 Doradus nebula in the Large Magellanic Cloud (7 × 1039 erg s−1; Kennicutt 1984). In this section, we will analyze the general properties of the H ii regions detected here with respect to their luminosity and sizes.
The H ii luminosity function is an important diagnostic of star formation properties in galaxies (Kennicutt 1989). The differential H ii luminosity function is usually parameterized as a power law (Kennicutt 1989; Banfi et al. 1993; Oey & Clarke 1998):

where N(L)dL is the number of nebulae with Hα luminosities in the range of L to L+dL, A is a constant, and a is the power-law index. Past studies found that the slope of the H ii luminosity function is correlated with the morphological type, in the sense that early-type galaxies show steeper slopes than late types. The power-law index a is ≈2.6 for Sa galaxies (Caldwell et al. 1991), ≈2.0 for Sb-Sc galaxies (Kennicutt 1989; Banfi et al. 1993), and between 1.0 and 1.7 for Im galaxies (Kennicutt 1989; Youngblood & Hunter 1999). In a study of the H ii region luminosity functions of 30 nearby galaxies, Kennicutt (1989) found that late-type spirals and irregulars have shallower slopes often extending beyond 1039 erg s−1, while among earlier-type spirals the luminosity functions rarely extend beyond this value. These differences have been interpreted as differences in star formation properties, like differences in gas dynamics and molecular cloud mass spectrum (Kennicutt 1989; Thronson et al. 1991; Rand 1992) or related to the evolution of the ionizing clusters, where steeper slopes would be the consequence of aging effects (Oey & Clarke 1998). Steeper slopes in earlier-type galaxies can be explained by a lower maximum number of ionizing stars cutoff found for the parent OB associations (Oey & Clarke 1998). Late-type galaxies would have a large number of what Oey & Clarke (1998) call "saturated" clusters, which are rich clusters with complete statistics in terms of initial mass function. These clusters would be responsible for the high-luminosity end of the luminosity function.
We built the luminosity function for NGC 1232, following the same criteria used by previous authors (e.g., Kennicutt 1989; Oey & Clarke 1998; Youngblood & Hunter 1999), binning the luminosities in logarithmic intervals of 0.2 dex. The result is shown in Figure 3. It can be seen that the luminosity function in NGC 1232 shows a break in slope, with the fainter H ii regions showing a shallower slope compared with the high-luminosity objects. This same effect was already observed for a large number of other galaxies (e.g., Kennicutt 1989; Rand 1992; Walterbos & Braun 1992; Rozas et al. 1996). Oey & Clarke (1998) showed that this might be related to the aging of the stellar population, where the slope transition moves to lower L as the population ages and objects grow fainter. Kennicutt (1989) found that for most galaxies in their sample, this turnover point occurred between 1036 and 1037 erg s−1. In NGC 1232, the break in slope happens around log L = 37.5 dex. To obtain the power-law index, we excluded the points below this value. With that we obtained a = 1.14 for the power-law index (left panel of Figure 3). This value is lower than typical values found for Sc galaxies, being closer to the values found for Im galaxies. In agreement with what is seen in the literature, where shallower luminosity functions are related with the presence of high-luminosity H ii regions, we find that NGC 1232 has a significant number of H ii regions with luminosities higher than 1039 erg s−1.

Figure 3. H ii luminosity function of NGC 1232. The left panel shows the luminosity function including all H ii regions of the galaxy. The solid line represents the power law fitted for log L ≥ 37.5 dex. The four panels in the right side of this figure correspond to the luminosity functions in four different regions of the galaxy, as indicated by the red circle over the galaxy's image of each plot. Slope values a for each of the fits are shown at the top of each plot.
Download figure:
Standard image High-resolution imageThe properties of the H ii regions could be affected by dynamical and chemical differences along the disk (e.g., Hodge 1987; Knapen 1998; Cedrés et al. 2013). For this reason, it is important to determine if the luminosity function is affected by the location of the H ii regions in the galaxy. This is especially important in the scenario where a possible collision with a dwarf galaxy might have affected different regions of this galaxy in different ways. We then constructed the luminosity function in four different parts of the galaxy, all at the same distance from the center (≈2.7 kpc), one in each direction from the nucleus, in a way that the west region of the galaxy that includes the X-ray peak was inside one of them. This is shown in the right panel of Figure 3, where for each plot the red circle over the image of the galaxy represents the region considered. From this plot we can see that the western region of the galaxy has no high-luminosity H ii regions, which makes the slope of the luminosity function steeper, compared to the other regions. The high-luminosity regions are mostly concentrated in the northern and in the eastern regions of the galaxy.
With respect to sizes, van den Bergh (1981) proposed that the frequency distribution of H ii regions in spiral galaxies follows the law

where N is the number of H ii regions observed with a diameter larger than D, and D0 is the characteristic diameter of the galaxy. N0 is an (extrapolated) characteristic value for the total number of regions. Most spiral galaxies, independent of the specific morphological type, seem to follow this distribution (Ye 1992). We obtained the diameters of the H ii regions of NGC 1232 from the areas measured by SExtractor, defining D = 2(A/π)1/2, where A is the area, and constructed this cumulative distribution function, as shown in Figure 4. From this figure it is possible to see that the largest regions are too big compared to the distribution defined by the rest of the regions. This effect was previously observed for other galaxies as well (Hodge & Kennicutt 1983; Youngblood & Hunter 1999). These points, all located in the upper part of the galaxy, were excluded when determining the slope of the diameter distribution. We then obtained D0 = 100.9 ± 1.5 pc for NGC 1232, which is a typical value found for spiral galaxies (Hodge 1987; Ye 1992).

Figure 4. H ii regions size cumulative distribution. The inset in the top right of this figure shows the location of the five brightest H ii regions detected (red triangles), which were excluded from the the fit. The fit to the remaining regions is shown by the solid line. The characteristic diameter of the galaxy obtained by this fit is D0 = 100.9 ± 1.5 pc.
Download figure:
Standard image High-resolution imageHodge (1987) suggested that there is a variation of the diameter distribution with galactocentric distance, showing a tendency to have a larger D0 for outer than for inner regions. Their results imply that the slope of the diameter distribution might be related to the environment, probably the gas density and/or the dynamical environment of the gas. In order to verify this for NGC 1232, we divided it in two parts: inner and outer region. The inner region is defined as the region inside half of the maximum H ii region distance to the center, which is 11.2 kpc. Indeed, we found D0 = 89.7 ± 1.7 pc for the inner region and D0 = 106.6 ± 2.6 pc for the outer region. The different cumulative distributions for the inner and outer regions are shown in Figure 5. From this figure we can also see that the five largest H ii regions are located in the outer region of NGC 1232.

Figure 5. H ii regions size cumulative distribution for the inner (filled circle) and outer (open square) region of NGC 1232. The inner region is defined as the region inside half of the maximum H ii region distance to the center, which is 11.2 kpc. The solid lines represent the fits for each distribution. We found D0 = 89.7 ± 1.7 pc for the inner region and D0 = 106.6 ± 2.6 pc for the outer region, following the trend found in the literature, which shows a tendency to have a larger D0 for outer than for inner regions.
Download figure:
Standard image High-resolution imageAnother characteristic of the H ii regions that can be explored is if they are radiation or matter bounded. If they are radiation bounded and have similar gas densities across the galaxy, then their diameter should scale as the cube root of the ionizing luminosity (Osterbrock 1989). Previous studies (e.g., Kennicutt 1989; Banfi et al. 1993) found that H ii regions in galaxies are essentially radiation bounded. To verify that for the H ii regions of NGC 1232 we plotted the luminosities versus their diameters. This is shown in Figure 6. In this figure, the two dotted lines mark the expected slopes for radiation bounded H ii regions. It is important to realize that most of these regions will be ionized by more than one star, which results in a situation physically different from that expected by a Ströngren sphere. However, we can see from Figure 6 that at least the larger regions seem to be indeed radiation bounded. Smaller regions, as previously mentioned, might be matter bounded.

Figure 6. Logarithm of the luminosity vs. the logarithm of the diameter for the H ii regions detected in NGC 1232. The dotted lines indicate the trend expected if the H ii regions are radiation bounded, which is the cube root of the ionizing luminosity.
Download figure:
Standard image High-resolution image5. Star Formation Rate
The SFR is then obtained adopting the equation from Calzetti et al. (2007):

The Hα flux, luminosity, and SFR for each H ii region are presented in Table 1. The left side of Figure 7 shows the SFR distribution in the galaxy. The uncertainties in the SFR vary from 12% to 17%, with an average value of 13%, taking into account the errors in the fluxes obtained by SExtractor and the error in the distance determination. It does not take into account the approximations for the extinction and [N ii] correction, which are much harder to estimate.

Figure 7. SFR of NGC 1232, calculated for each H ii region. Left: SFR distribution. The size of the dots is proportional to the size of each H ii region. The gray contour represents the X-ray contours from Garmire (2013). Right: distribution of the SFR per unity area. The green "x" in both plots marks the peak of the X-ray emission (X-ray data obtained from G. Garmire 2018, private communication).
Download figure:
Standard image High-resolution imageAs expected, the SFR is higher in the spiral arms, as is commonly accepted in the literature that the H ii regions are tracers of these arms. Another quantity that can be studied with our data and which carries more physical meaning, is the SFR density, or SFR per unity area (ΣSFR). The results are shown in the right panel of Figure 7. ΣSFR was obtained by dividing the SFR of every H ii region by their physical size, given by SExtractor. In can be seen in the right panel of Figure 7 that the spiral pattern becomes less obvious, supporting the hypothesis that the spiral arms only show more star formation because they concentrate most of the gas, but not necessarily are they more efficient at forming stars (Scoville et al. 2001; Foyle et al. 2010; Gutiérrez et al. 2011; Kreckel et al. 2016). Of course, a more conclusive result can only be achieved by separating the H ii regions of the arms from the inter-arms, which is non-trivial for multi-armed galaxies.
In terms of general behavior, NGC 1232 is a typical spiral galaxy, which have total SFR values around 1 M⊙ yr−1 (Lee et al. 2009). We found a value of 0.77 M⊙ yr−1 from our data, measuring the total Hα flux inside a large aperture and performing the same process to obtain the Hα luminosity as was done for each H ii region. It is important to remember that our data do not encompass the whole galaxy. Flux sensitivity also has to be taken into account for direct comparisons with other authors, in the sense that low sensitivities will result in significant amounts of Hα diffuse emission not being detected, leading to a lower SFR measurement. Our sensitivity is just slightly higher than that of Lee et al. (2009).
The ΣSFR values obtained in this work for NGC 1232 can be compared with the values obtained by Grosbol & Dottori (2012). They derived ΣSFR gradients for several spiral galaxies, including NGC 1232, finding an essentially constant ΣSFR along the radius of the galaxy, with values between 10−2–10−3 M⊙ yr−1 kpc−2. With our superior image quality, we confirm their results. If we look at the average radial values, we can also see that there is no obvious ΣSFR gradient in the galaxy.
However, the most interesting feature that we found in this distribution is a clear asymmetry in the intensity of the SFR, where the regions of more intense formation (red symbols) appear to be located preferably in the northeast side of the galaxy (Figure 7), while we notice an absence of star formation to the west and very likely to the south of the nucleus.
As mentioned previously, Garmire (2013) found a diffuse X-ray emission in NGC 1232 that indicates a possible collision with a dwarf galaxy. The peak of the diffuse X-ray emission is coincident with the zone where the H ii regions are smaller and more sparse, while the excess SFR in the northeast of the galaxy is where the emission is weaker. The X-ray contours in the left panel of Figure 7 can help to see that. We interpret this result as a suppression of the star formation in the hot gas region and/or as an intensification of the star formation in the post-shock region of the dwarf galaxy's passage.
To make this effect more evident, we picked an annulus including the X-ray peak region, and divided this annulus in six sections of 60° each. For each of these sections we computed average properties related to the H ii regions, namely, the number of regions in each section, the average diameter of the regions, and average luminosity. This is shown in Figure 8. These numbers will, of course, be affected by the size of the chosen regions (which, if too big will just average out any localized differences) and their placement (inter-arm locations will naturally have less H ii regions than in arm locations). By looking at sections at the same distance from the center in all directions we tried to avoid both these effects. It can be seen from Figure 8 that the green section is clearly deficient compared to the other regions, both in terms of number of regions and in average properties (sizes and luminosities). This section is located close to the X-ray peak. This result provides additional evidence on the quenching of the star formation as a result of the collision with the dwarf galaxy. In-depth spectroscopic study will certainly be helpful to reach a definitive conclusion on this issue.

Figure 8. Main properties of the H ii regions in six different regions of NGC 1232, at the same distance from the center, color-coded as shown in the top left plot. The top right plot shows the number of H ii regions in each section, starting with the one on the top left (red region) and following in the clockwise direction. The bottom left plot shows the average diameter of the H ii regions (in pc) in each section as measured by SExtractor and the bottom right plot the average luminosity (in Log units), following the same order as the top right plot. It can be clearly seen that the green region (second point in each plot), which is around the region of the X-ray peak, has a deficiency of large and luminous H ii regions.
Download figure:
Standard image High-resolution image
6. Conclusions
In this work, we study the star formation distribution in the galaxy NGC 1232, a spiral galaxy seen practically face on. It is considered a grand-design spiral, and therefore an excellent laboratory for the study of the relationship between star formation and spiral arms. Besides that, Garmire (2013) reports evidence that a dwarf galaxy might have crossed the disk of NGC 1232, based on the detection of a diffuse, hot X-ray emission cloud observed in this galaxy.
We obtained a high spatial resolution Hα image of NGC 1232 using SAM at SOAR telescope, with AO. This resulted in the best spatial resolution image of this galaxy so far. A total of 976 H ii regions were detected for the SOAR image field, which encompasses about the 50% central part of optical image of the galaxy. Despite not covering the entire galaxy, the number of sources detected here represent the most complete Hα source catalog for this galaxy in the literature, since double the number of H ii regions were already detected in this object.
We also constructed the H ii regions luminosity function, obtaining a power-law index of a = 1.14. This is a value typically lower than what is found for Sc galaxies. In the case of NGC 1232, this is related to the presence of a significant number of high-luminosity H ii regions. These are mainly found in the northern and eastern part of the galaxy, while the eastern part of the galaxy clearly shows a lack of these brighter regions. We also constructed the size distribution function of the H ii regions, verifying that, as for most galaxies, NGC 1232 follows an exponential law, with a characteristic diameter of D0 = 100.9 ± 1.5 pc.
We used the Hα luminosity to determine the SFR of each H ii region, and analyzed their distribution in the galaxy. We also calculated the SFR density ΣSFR for each source. Results show that, as expected, stronger star formation is found along the spiral arms. However, the apparent concentration of H ii regions in the spiral arms is diluted when the SFR density is analyzed.
We also found an interesting pattern in the distribution of the SFR, where there seems to be an lower number of H ii sources exactly in the region where the diffuse X-ray gas has a peak of emission. This might be due to a quenching of star formation due to the collision with the dwarf galaxy. On the other hand, there seems to be an excess of star formation in the northeast part of the galaxy, where the X-ray emission is weaker. We suggest that this excess might have been induced by a shock wave from the collision.
We thank the referee for invaluable suggestions that greatly improved the paper. Based on observations obtained at the Southern Astrophysical Research (SOAR) telescope, which is a joint project of the Ministério da Ciência, Tecnologia, e Inovação (MCTI) da República Federativa do Brasil, the U.S. National Optical Astronomy Observatory (NOAO), the University of North Carolina at Chapel Hill (UNC), and Michigan State University (MSU). A.A.S. acknowledges CAPES for financial support. L.M. thanks CNPQ for financial support through grant 303697/2015-6 and FAPESP through grant 2015/14575-0. A.R.A. thanks CNPq for partial support to this work. We thank Andrei Tokovinin from the SOAR observatory, for the excellent support during the observations with SAM/SOAR. We also thank G. Garmire for the X-ray data used in this paper.
Facility: SOAR(SAM) - The Southern Astrophysical Research Telescope.
Software: IRAF (Valdes 1998; Valdes & Tody 1998), SExtractor (Bertin & Arnouts 1996).
Footnotes
- 4
Distance obtained from the NASA/IPAC Extragalactic Database (NED).
- 5
IRAF is distributed by the National Optical Astronomy Observatory, which is operated by the Association of Universities for Research in Astronomy, Inc., under cooperative agreement with the National Science foundation.
- 6