

Summary
Here, we present a combinatorial approach using high-resolution microscopy, computational tools, and single-cell labeling in living C. elegans embryos to understand single cell dynamics during neurodevelopment.
Abstract
Caenorhabditis elegans (C. elegans) stands out as the only organism in which the challenge of understanding the cellular origins of an entire nervous system can be observed, with single cell resolution, in vivo. Here, we present an integrated protocol for the examination of neurodevelopment in C. elegans embryos. Our protocol combines imaging, lineaging and neuroanatomical tracing of single cells in developing embryos. We achieve long-term, four-dimensional (4D) imaging of living C. elegans embryos with nearly isotropic spatial resolution through the use of Dual-view Inverted Selective Plane Illumination Microscopy (diSPIM). Nuclei and neuronal structures in the nematode embryos are imaged and isotropically fused to yield images with resolution of ~330 nm in all three dimensions. These minute-by-minute high-resolution 4D data sets are then analyzed to correlate definitive cell-lineage identities with gene expression and morphological dynamics at single-cell and subcellular levels of detail. Our protocol is structured to enable modular implementation of each of the described steps and enhance studies on embryogenesis, gene expression, or neurodevelopment.
Introduction
C. elegans stands out as the only organism in which every cell in the embryo can be observed throughout neurodevelopment. With the entire cell-lineage known and invariant1, and with the development of new tools that allow labeling and continuous imaging of single cells in embryos, biologists can now begin examining different steps in the development of the nematode nervous system from all angles - cell birth; migration and differentiation; neurite formation, targeted outgrowth and fasciculation; synapse formation; and tuning of functional circuits. Capturing neuronal outgrowth dynamics in the C. elegans embryo, by combining stably expressed reporters and fluorescence microscopy, is valuable to the scientific community.
Developmental studies in C. elegans often leverage the invariant cell-lineage and cell-fate maps of this species to augment contextual understanding at the single-cell level within the intact organism1. Auto-lineaging analysis - using StarryNite2,3,4 and AceTree5,6,7,8 software - benefits from high contrast, high resolution images of fluorescent nuclei. To work optimally, StarryNite/AceTree also depends upon predictable constrained orientation of imaged embryos during development. Confocal microscopy, done in C. elegans embryos compressed between two coverslips, has been the standard auto-lineaging microscopy method for more than a decade because it provides both high contrast/high resolution and a predictable constrained orientation of the embryo7,8. We previously described the construction and use of a novel light-sheet-based dual-view inverted selective plane illumination microscope (diSPIM) for live sample imaging such as C. elegans embryogenesis9,10,11,12,13. Light-sheet microscopy, in general, provides low phototoxicity, high speed, and long-term imaging of live 3D specimens14,15. The diSPIM method, specifically, produces four-dimensional (4D) images with nearly isotropic spatial resolution of approximately 330 nm9.
Compared with confocal microscopy, diSPIM offers higher signal-to-noise and speed, more isotropic spatial resolution, and is more suitable for long-term in vivo imaging16. We therefore worked to adapt diSPIM data for input into StarryNite/AceTree and investigated whether this would enhance the lineaging analyses. A major hurdle is that diSPIM specimens cannot be easily constrained by eggshell-compression to adopt expected orientations for StarryNite/ AceTree. Random orientation of cell positions in the volume being analyzed degrades the accuracy of auto-lineaging analysis.
We therefore employed CytoSHOW, a viewer-guided user interface which allows users to select precise 3D orientation of embryos during pre-processing of diSPIM images, yielding image data that is both quality-optimized and context-aware for input into StarryNite/AceTree. Upon user-selection of imaged embryos, CytoSHOW orchestrates an automated data processing pipeline. Cropped and background-subtracted embryo images are saved within TIFF stack files for each position, timepoint and view. CytoSHOW then iteratively calls the program SpimFusion to co-register and jointly deconvolve the two pre-processed views, using the Richardson-Lucy17,18 algorithm to yield isotropic high-resolution volumetric images. A diSPIM-specific set of parameters has been optimized for StarryNite to govern its behavior during image-segmentation and nucleus-tracking in isotropically fused images. Fused images and lineaging results are then edited using AceTree, which allows users to identify and fix any errors in the auto-lineage trace generated by StarryNite. AceTree can also can present lineage-tree and 3D modeled renderings of tracked nuclei in the embryo. We find that auto-lineaging speed and accuracy are markedly enhanced using isotropically fused images, when compared to raw images from either SPIM camera. Our protocol, while optimized for the C. elegans application described here, could be generally adapted for auto-lineaging of diSPIM data produced for other species or specimens. If this is the intended use of the protocol, please note that additional tuning of the StarryNite parameters will likely be required for new specimens, as described3,4.
Successful implementation of this protocol results in images with 4D-isotropic resolution and enables biologists to trace cell lineages, while simultaneously identifying and analyzing neurons in the developing C. elegans embryo. Moreover, by merging several post-processing algorithms - with hardware acceleration being the most time-consuming of these - we can now analyze both fine subcellular details and the cell-lineages and cell-fates of live embryos in essentially real time. This new protocol allows precise, informed manipulation and observation of cell behavior during probative studies of differentiation and morphogenesis in vivo. In this manuscript, we present a detailed explanation of the improved protocols we have developed for lineaging and cell tracking in developing C. elegans embryos, to enhance studies of embryogenesis, gene expression or neurodevelopment.
Protocol
1. Assembling the diSPIM steel imaging chamber with poly-L-lysine coated coverslip
NOTE: The steps below are all required to optimize and automate lineage analysis of nematode embryos by StarryNite/AceTree. Several options (indicated by as such) may be omitted for experiments that do require tracing of C. elegans cell lineages.
- Draw a small rectangle (2mm x 5mm) in the center of a clean rectangular coverslip (no. 1.5, 24 mm x 50 mm) with a sharpie (or similar pen).
- Flip the coverslip over to the unmarked side and place 10 μL of poly-L-lysine (cat. no. P1524) over the marked rectangle.
NOTE: Make a working concentration of 1 mg/mL poly-L-lysine dissolved in filtered water (or equivalent). For long-term storage, prepare 5–10 mL aliquots and store at −20 °C. Once thawed, the aliquots can be stored at room temperature (23 °C) for 3–4 weeks. - Allow the poly-L-lysine to coat the coverslip for 5 minutes (Figure 1A). Poly-L-lysine is used for coating glass cover slips where the embryos will be mounted, allowing the embryo eggshell to stick firmly to the coverslip, even when the objectives are immersed in the imaging medium.
- Place the poly-L-lysine coated coverslip in the bottom half of the steel imaging chamber.
- Place the top half of the steel imaging chamber onto the bottom half with the coverslip and tighten with the four screws associated with the chamber. Check visually from the side to make sure the top half is evenly seated in the bottom half (Figure 1B).
- Fill the chamber with 7–8 mL of M9 buffer19, an isotonic buffer which helps prevent early stage embryos from succumbing to abnormal osmotic pressure. 1-cell, and even 2-cell embryos are osmotically sensitive and can develop abnormally if not in this isotonic buffer. Embryos also tend to arrest at the 3-fold stage if M9 is substituted with water.
2. Preparing C. elegans embryo samples for mounting
NOTE: Approximately 18 hours prior to imaging, five young (1 day since final molt) adults and ten larval stage 4 (L4) C. elegans are picked to a nematode growth medium (NGM) agar plate seeded with E. coli strain OP50. Platinum wire picks are used to move larvae and young adult C. elegans without harming the animal19.
- Prepare a 1% methyl cellulose (cat. no. H7509-25G) solution in M9 buffer.
NOTE: Methyl cellulose must be stirred in warm M9 until it is dissolved. Once prepared, this solution can be stored at room temperature. - Add 500 µL of 1% methyl cellulose-in-M9 solution into the depression of a concave microscope slide. This viscous buffer will be used in two occasions: 1) when harvesting early embryos by dissection of adult worms and 2) when washing late-stage embryos picked directly from an NGM plate.
NOTE: Methyl cellulose is used to prevent embryos from sticking to the microscope slide. - For imaging late stage embryos, pick laid C. elegans embryos (preferably from an NGM plate with young adults present) by using an eyelash pick, and move the embryos to the 1% methyl cellulose on the concave microscope slide. The eyelash pick helps reduce force and thus minimize stress or damage to the embryos during handling. The procedure to make an eyelash pick is covered by Hart20.
- With a second eyelash pick (in the opposite hand), gently tap both eyelashes together to suspend the embryos in the methyl cellulose.
- Optional: If planning to lineage embryonic cells with StarryNite, one must mount 1-cell to 4-cell embryos. To do so, first select young adults from an NGM plate and move them into the M9-methyl cellulose solution on the concave microscope slide by using a platinum wire pick.
- Optional: With the sharpened tips of hypodermic needles (no. 18G x 1 ½), slice the animal transversely at the mid body to release 1-cell to 4-cell embryos.
3. The Mouth Pipette: Assembling aspirator tube with microcapillary pipette
NOTE: We use an aspirator tube with a hand pulled microcapillary pipette inserted into the rubber gasket of the tube. This allows us to transfer embryos from the dissection slide to the Poly-L-lysine-coated surface in the buffer-filled imaging chamber.
- Manually pull the microcapillary pipette over an open flame to create two halves with stretched tips.
- Take one half of the microcapillary pipette and insert the blunt end into the rubber gasket of the aspirator tube (Figure 1C). Set the other half of microcapillary pipette aside for use later (if needed).
- With the assembled aspirator tube fitted with microcapillary pipette, gently break the tip of the microcapillary pipette and create an opening that will fit about 1–2 two embryos (from here on this instrument is called a “mouth pipette").
4. Mounting C. elegans embryos on Poly-L-lysine coated coverslip
- With the aspirator mouthpiece held gently between the teeth, pre-fill the microcapillary pipette with 10–15 µL of M9 Buffer and then gently suck several embryos from the concave slide into the capillary.
- Transfer the embryos to the steel imaging chamber filled with M9 Buffer, positioning the capillary tip so that embryos will fall into the central rectangle of the coverslip.
- Avoiding injury to the embryos, gently move them with an eyelash pick or use the mouth pipette to position the embryos vertically, to orient the embryos so that the long axis of the embryo is perpendicular to the long axis of the coverslip (Figure 1B inset, bottom panel).
NOTE: Positioning the embryo in this orientation minimizes the number of slices to image, thereby reducing light dosage and data processing time while improving acquisition speed. - Place the steel imaging chamber into the sample holder on microscope stage (Figure 1D).
5. Assembly, software setup and laser optimization for embryonic imaging using the diSPIM
- See step-by-step instructions on how to assemble the entire fiber-coupled diSPIM from commercially available parts in Kumar et al.10,11 and at http://www.dispim.org. A video-protocol of how to assemble the diSPIM is also available on the ASI website (http://www.asiimaging.com).
NOTE: Instrument setup for this protocol is identical to Kumar et al.10,11 diSPIM, which makes use of 40x 0.8NA water immersion lenses for imaging. The only difference between the setup in this protocol and Kumar et al.10,11 is the addition of a dichroic mirror (splitting at 560 nm) and red and green bandpass filters inside an imaging splitting device (model A12801-01) installed on both diSPIM imaging arms. The addition of image splitting optics allows simultaneous capture of images from two distinct fluorophores – excited by 561 nm and 488 nm lasers – by separating the emission bands onto two halves of the same camera chip. - After instrument assembly, check the optical alignment of the diSPIM before imaging.
NOTE: To properly align the diSPIM see https://youtu.be/qnOrg30NNuE, and for hardware information, http://dispim.org/hardware/objectives and http://www.asiimaging.com. - Use the open-source platform Micro-Manager (https://micro-manager.org/)21, which has been optimized for operating Light Sheet Microscopes for high-throughput cellular imaging22. We recommend use of the ASI diSPIM plugin for multi-position acquisition, which allows simultaneous imaging of up to 30 embryos as described23.
- With Micro-Manager open, set laser intensities to ~179 µW (0.5) for 488 nm and ~79 µW (0.25) for 561 nm (Figure 2A, red rectangle).
NOTE: These are recommended settings for long-term imaging of C. elegans embryos using 1-minute intervals. During long-term dual-color imaging, the 561 nm laser is used to image nuclei (mCherry::Histone) until embryos are at bean stage, at which point the 488 nm laser is then turn on to also image the GFP-labeled neurons. These imaging conditions are optimized for minimizing phototoxicity and ensuring survival and hatching of the embryos while enabling prolonged (12–14 hours) continuous acquisition of neurodevelopmental and lineaging data. - In Micro-Manager, choose menu Plugins > Device Control > ASI diSPIM to open the ASI diSPIM window (Figure 2B). Choose the Acquisition Tab. In this tab's Data Saving Settings section (green rectangle), Volume Settings section (blue square), and Slice Settings section (orange square), ensure that each parameter is set as shown in Figure 2B.
NOTE: Our image analysis software CytoSHOW is adapted to work with other optional output data formats such as bulk-concatenated OME-TIFF file series and TIFF-stack file series created post-acquisition through use of an export function built into Micro-Manager. Typically, the single-time-point-stack collated OME-TIFF file data format is used because it allows real-time viewing and processing of image volume as soon as the raw data are acquired.
6. Optimized autofocus parameters for long-term imaging of C. elegans embryos
- Set Micro-Manager autofocus parameters to the settings optimized for long-term lineage-quality diSPIM-imaging of C. elegans embryos. In the ASI diSPIM window, click the Autofocus Tab (Figure 2C). In the General Autofocus Options section (black square) specify parameters precisely as shown. Note that the Autofocus channel (red square) should specify your nuclear channel fluorescence channel in lineaging experiments.
NOTE: If the max offset is greater than 5 µm, images tend to drift out of focus. - Click, Plugins > Acquisition Tools > Pattern Overlay.
- In the Pattern Overlay window, click Show Grid.
- In the ASI diSPIM window, click the Navigation tab.
- Click check boxes for Beam and Sheet of Path A or B then click Live. Image acquisition begins. A Live view window opens. Select the auto-focus analysis region of the embryo by drawing a box around the embryo on the selected channel from 6.1.
NOTE: We typically capture 420 time points for 10 embryos per imaging session. The raw data per image session are typically 1.7TB, while deconvolved and StarryNite-processed data are 1.4TB (see Steps 9 and 10). We recommend using large-capacity HDD (18TB on our current system) for image acquisition, and cloud platforms for image storage. - Click Start Acquisition in the "Acquisition Tab to commence long-term multi-dimensional image capture (Figure 2B).
7. Opening raw Micro-Manager images in CytoSHOW
- Download the software bundle from http://dispimlineage.wormguides.org.
NOTE: The software bundle will be downloaded as a .zip file and will need to be extracted to the “C:\” directory before use. Further details for installation are given at http://dispimlineage.wormguides.org/diSPIMlineaging_InstallationInstructions.htm . - Double-click the file C:\CytoSHOWextrasForC\CytoSHOW_APP.jnlp to begin running CytoSHOW.
- Choose menu File > New > diSPIM Monitor (Micro-Manager). Locate the root data set folder where acquisition timepoint folders were saved. Select any timepoint folder and click Open. Multidimensional navigation windows (called diSPIM monitor windows) are opened automatically for both SPIMA and SPIMB (Figure 3A).
NOTE: These windows will monitor the root data folder for newly saved raw timepoint stacks (in the event that a specimen is still being recorded). After each new timepoint is acquired, each of the windows monitoring the distinct SPIM arms and sample positions will refresh to display the entire multichannel 4D dataset for each embryo.
8. Generating Max projection images with CytoSHOW
Even before deconvolution, the raw data can be quickly processed to appraise the specimen's global features.
- Click the Z-MIP button on the left side panel of the image window (Figure 3A, red rectangle) to make maximum intensity projections through the full depth and full-time course of a given position or SPIM arm. A Z-projection hyperstack window will appear.
- In the Z-projection hyperstack window, set projection type to Max intensity. Specify which channels, slices, and time-point frames to process based on user preference.
- Click OK when completed.
- Select the folder location to save the Max intensity outputs from the file dialogue window, and then click OK. Allow some time (15–20 minutes, depending on size of dataset and processing power of the computer) for CytoSHOW to generate projection images.
9. Analyzing cell lineages in isotropic high-resolution volumetric data
- Optional: With the raw data open via diSPIM monitor in CytoSHOW, select the Polygon selection tool (Figure 3A, black arrows) and click just outside the embryo’s anterior, posterior, dorsal and ventral edges (in that exact order) to generate a “bowtie" pattern over the embryo. Do for both views (SPIM-A and SPIM-B, Figure 3A).
NOTE: This selection specifies the elliptical region of interest (ROI) in which the embryo is centered and records the anterior-posterior axis of the embryo. The bowtie pattern cues CytoSHOW that the user plans to further specify a precise rotation of the final isotropically fused volumes into an orientation that is optimal for lineaging analyses by StarryNite/AceTree. In cases where StarryNite lineaging is not part of the experimental plan, other selection tools and shapes may be chosen to set the ROI for image processing. - If multiple embryos were simultaneously imaged by using the multi-position acquisition option, open and perform Step 9.1 for all embryos. This will allow parallel execution of future steps for all embryos in one session. Close the SIMA and SPIMB windows for any embryos you do not wish to process.
- Click the diSPIM button on the left side panel of diSPIM monitor window (Figure 3A, highlighted in yellow). This reveals a subpanel of controls specific to diSPIM processing.
- Align green and red channels for each SPIM arm. Because emission channel splitters are used to capture distinct red and green images simultaneously on the same camera, it is important to visually align the exact pixel registration of these two physically adjacent image fields when they are overlaid. Reuse of the same alignment adjustments is typically feasible over many consecutive imaging sessions, but should be checked (as in Steps 9.4.1–9.4.5).
- Starting with the SPIMA panel, select the red channel by moving the CM scroll bar to the left (Figure 3A, orange arrow, left panel).
- Using the x-, y-, and z-adjusters (Figure 3A, orange square), shift the red channel to match the green.
- Click diSPIM button (Figure 3A, highlighted in yellow), to close the subpanel and trigger propagation of the same shifts to all other Position windows.
- Confirm that correct alignment propagated to other frames and time points by moving the “z” scroll bar (Figure 3A, blue arrow, left panel) and/or “t” scroll bar (Figure 3A, green arrow, left panel). If multi-position acquisition was performed and several embryos were imaged (Step 5.3), the alignment should have also propagated to those embryos. Confirm by also examining the numbers for x-, y-, and z-adjusters (Figure 3A, orange square, which should be the same for the SPIMA panel of all embryos).
- Repeat Steps 9.4.1–9.4.4 for the SPIMB diSPIM monitor window (Figure 3A, right panel).
- Click the “diSPIM” button and then the “Fuse” button (Figure 3A, blue rectangle) to open a dialog box called “Deconvolve/Fuse diSPIM Raw Data Volumes” (Figure 3B). Set parameters as shown in Figure 3B. These parameters are briefly addressed in the following substeps:
- Set Key registration on Channel 1 (488 nm laser) or 2 (561 nm laser). Select the channel with denser or more ubiquitous signal. For lineaging experiments always select the channel used to image the ubiquitous nuclear histone fluorescence.
- Set input volumes relative orientation to +1 or -1. The correct orientation index depends on a specific diSPIM’s camera placements (Figure 4).
NOTE: If uncertain, test each option by duplicating a single timepoint from both SPIM A and B diSPIM monitor window, following steps 9.1–9.12 and arbitrarily choosing an input volumes relative orientation to test. Incorrect orientations will yield blurry images with artifacts, while correct orientations will yield clear images. The input volumes relative orientation value that yields the clear image can then be reused for all future data from the given diSPIM instrument. - Choose whether the fused volume should be oriented the same as the A or B input volume (based on user preference).
- Select "Fresh registration for every volume". This option controls how SpimFusion calculates registration matrices for each volume pair at each timepoint. The “Fresh” option allows the algorithm to optimize registration adaptively at each timepoint.
- Set the number of deconvolution iterations to 10. This number tends to reliably yield the desired high resolution in a time-efficient manner.
- Optional: If auto-lineaging is desired (highly recommended), check Auto-launch StarryNite lineaging of Fused Volumes. This option will launch StarryNite automatically to segment and track cells in the imaged volumes produced by SpimFusion.
- Optional: For highest accuracy in automated lineaging, it is best to reposition the isotropically fused embryo volumes into the canonical "ADL" (Anterior[x-west], Dorsal[y-north], Left[z-near]) orientation. Select the Define volume output orientation in preview option to indicate this choice. CytoSHOW will respond by processing an initial pair of isotropically fused volumes, allowing the user to closely observe and specify the rotations needed to achieve ADL registration.
- Click Yes once all parameters are selected.
- Specify the Output directory in which to save the processed files. Click OK.
- Optional: If the Define volume output orientation in preview option was selected, set the t scroll bar (Figure 3A, green arrow, left panel) in the SPIM-A window to the early timepoint at which ABa and ABp cells have reached metaphase. Set the t scroll bar in the SPIM-B window to the later comma stage of development. This will aid in specifying ADL orientation.
- Optional: Click OK when ready. If the previewing option in 9.5.7 above was selected, only two preview volumes will be isotropically fused for the timepoints indicated by the t-sliders of the SPIM-A and SPIM-B image windows. These two preview timepoints can be used to specify precise realignment of output embryo volumes to the ADL orientation, as explained below.
- Locate the newly displayed 3DProjY_Decon-Fuse_.... window. Move the t scroll bar to time point 2 of this preview window. Move the Z slider until the view directly down the embryo's long axis is shown.
- Move the t scroll bar back to time point 1 of the 3DProjY_Decon-Fuse_.... window. Choose the line-selection tool and draw a line selection from the EMS cell (ventral-most round nucleus) through the plane of the AB-cell metaphase plates.
- Click the orange diSPIM Preview button on the 3DProjY_Decon-Fuse_.... window. The fine adjustments to the orientation of the previewed imaged volume will be saved for use in processing the full dataset.
- Optional: The Deconvolve/Fuse diSPIM Raw Data Volumes dialog will reappear, just as in step 9.5 above. Click Yes without choosing the Define volume output orientation in preview option. Specify the Output Folder for the full data processing run.
- Set the t scroll bars (Figure 3A, green arrow, left panel) of the diSPIM monitor windows to the starting timepoint (SPIMA) and ending timepoint (SPIMB) of the full span of images to process. Then click Ok.
- As SpimFusion progresses, CytoSHOW opens and refreshes a multidimensional window showing the sliced-4D isotropic fused volume for each embryo, as well as two windows with rotating-4D max-intensity projections of the isotropic volume. During this time, do not disrupt or close any CytoSHOW window until isotropic fusion and lineage tracking are complete.
- Optional: Note that once the StarryNite splash screen has appeared and later disappeared, the full data-processing pipeline has been completed. This window must not be closed during processing or StarryNite will be interrupted.
10. Opening StarryNite lineage trace series in AceTree (optional)
- Open the customized version of “AceTree_16BitCompat.jar” provided.
- Choose menu the File > Open configure file. Locate your Output directory previously indicated to CytoSHOW. Open the Decon_Fuse_..._Pos[n] subfolder for embryo [n]. Select aaa_edited.xml and Open.
- Use the AceTree menu Edit > Edit tools to open the Edit Track and Adjust or Delete Cells windows.
- Click the half-shaded circle Figure 5B, red square to adjust the Red and Green intensities.
- Proceed with lineage visualization and editing as previously described5,6,8 (manuscripts are also included in our download bundle).
Representative Results
We first validated the viability of embryos imaged using the protocol's parameters for diSPIM acquisition (sections 1-6). Ten embryos were simultaneously imaged at 20 °C, one volume/embryo/minute, from the 2-cell stage to the 2-fold stage (7.5 hours, 451 volumes/embryo). To monitor cell divisions throughout embryogenesis, we used strain BV514, which ubiquitously expresses the mCherry::Histone reporter constructs from the integrated transgene array ujIs11324. Figure 6 shows a timeline of this first half of embryonic development for one of the imaged embryos. Each image represents a single-view maximum-intensity projection (produced by steps 7-8) of the imaged embryo. We found that the optimized protocols did not induce any detectable phototoxicity to the embryos, as assessed by timing of cell divisions (not shown), time of hatching, and timing related to developmental milestones (Figure 6 and references1,25,26).
We then applied the protocol to analyze outgrowth dynamics of single neurons in developing embryos. We imaged DCR7692 (olaex4655), a transgenic nematode strain that expresses GFP off the neuropeptide flp-19 promoter in a subset of unidentified cells (DACR2819, Pflp-19 (3.6kb)::Syn21::GFP::CAAX::p10 3’UTR). Following the steps of the protocol outlined here, we determined that the unidentified cells correspond to motor neurons RMDDL and RMDDR, to the excretory canal cell, and to two muscle cells (Figure 7). We then examined and quantified the outgrowth dynamics of the RMDDL and RMDDR neurons. We observed that the RMDDL and RMDDR neurons are obliquely shaped as early as 360 minutes post fertilization, with the longer cellular axis representing the subsequent axis for neurite outgrowth (Figure 7 and Movie S1). Using the “simple neurite tracing” plugin in FIJI and applying it to 3D reconstructions of isotropically fused volumes, we then quantified the stereotypic outgrowth of the RMDDL and RMDDR neurites for six embryos. We determined that the outgrowth dynamics were stereotyped for RMDDL and RMDDR across embryos (herein called RMDDs). From 385-410 minutes post fertilization, the RMDDs neurites extended 6.0±0.5µm (mean ± SEM; n = 12 neurites) anterior of the cell bodies (Figure 7B,C,I). From 415-445 minutes post fertilization, both neurites extend dorsally into and around the presumptive nerve ring (asterisk in Figure 7D). On average, each RMDD neurite extended 11.0 ± 0.6 µm (mean ± SEM; n = 12 neurites) from the cell body before synchronously meeting its contralateral counterpart at the apex of the ring (Figure 7I). Importantly, our representative results demonstrate that we are able to examine, compare and quantify neuronal developmental features for single identifiable cells by using our integrated protocol (Figure 7 and Figure 8).
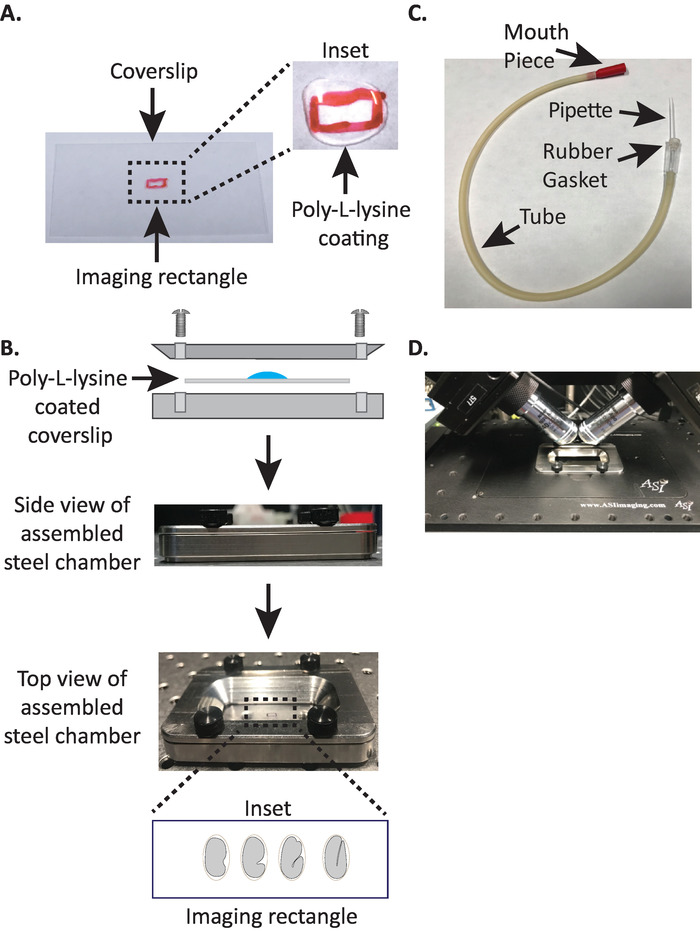
Figure 1: diSPIM sample mounting setup. (A) Preparation of coverslip with Poly-L-lysine. In the inset, 10 µL of Poly-L lysine was used to coat the coverslip for 5 minutes. Poly-L-lysine allows the embryo eggshell to stick firmly to the coverslip in the rectangle. (B) Schematic of the steel imaging chamber and the assembled chamber. In the inset, representative embryos are oriented with the anterior-posterior axis perpendicular to the long axis on the coverslip. (C) Assembled aspirator tube with microcapillary pipette. (D) Steel imaging chamber mounted in sample holder under diSPIM 40x objectives. Please click here to view a larger version of this figure.

Figure 2: Long-term diSPIM imaging setup in Micro-Manager. (A) Recommended diSPIM laser power parameters (red rectangle) optimized for prolonged imaging while reducing phototoxicity (as assessed by higher hatching rate of C. elegans embryos). Set 561 nm laser to 79 µW (0.25) and 488 nm laser to 179 µW (0.5). Note that exact calibration of software settings to laser power varies among diSPIM installations. It is recommended that users measure and calibrate the laser power in order to achieve 79 µW (561 nm) and 179 µW (488 nm) laser power. (B) diSPIM parameters for data saving (green rectangle), volume settings (blue square), and slice settings (orange square). (C) diSPIM autofocus parameters for long-term imaging of C. elegans embryogenesis (see steps 6.1-6.6). Please click here to view a larger version of this figure.

Figure 3: Image visualization and data-processing setup using CytoSHOW. (A) Raw diSPIM images opened by CytoSHOW. CytoSHOW is able to open images captured by both camera paths (SPIM A and B). These raw images are opened in multidimensional windows called diSPIM monitor. In diSPIM monitor, a “bowtie pattern” is generated to select the embryo’s anterior, posterior, dorsal and ventral edges (see step 9.1). Bow-tie selections indicate embryo orientation for deconvolution and StarryNite-assisted lineaging tracing. (B) Optimized parameters used to generate isotropic images. In the Deconvolved while acquiring window, set the parameters specified in steps 9.5.1-9.5.8. Please click here to view a larger version of this figure.

Figure 4: diSPIM camera configuration. (A) Photograph of diSPIM camera placements and orientations. (B) Depiction of +90-degree rotations of SPIM A to match SPIM B images collected. (C) Input volumes relative to orientation index +1 based on our diSPIM’s camera configuration (see step 9.5.2). We rotate SPIM A image(s) +90 degrees around Y-Axis before registration to match SPIM B image(s). Scale bars = 10 µm. Images are representative single-view, maximum-intensity projections and deconvolution images of 1.5-fold embryo with labeled nuclei (561-nm, red) and neurons (488-nm, green). Please click here to view a larger version of this figure.

Figure 5: Curation and editing C. elegans embryonic lineage in AceTree. (A) We use AceTree to edit StarryNite’s lineage traces (see references5,6,8; manuscripts are also included in our download bundle). AceTree will display C. elegans systematic names for each nucleus (green rectangle) upon completion of steps 10.1-10.2. This window (A) provides information (black rectangle) about each cell in the lineage trace (ABa, highlighted in blue) that help guide users when tracking and editing the lineage traces. It is recommended that users verify and compare lineaged cells and their positions to the C. elegans embryonic cell lineage previously reported by Sulston et al.1 In addition, if users are interested in locating specific cells in the deconvolved data series (see below, B) enter the C. elegans systematic name in the search bar (orange rectangle). (B) The user’s deconvolved data series also opens automatically upon completion of steps 10.1-10.2. Shown here an isotropically fused image of a four-cell stage embryo with nuclei labeled in red. During tracking of a nuclei, users should change the intensity of the image (red square) and navigate through time and z using the arrow keys on their keyboard (time-left/right, z-up/down). (C) 3D cartoon of the timepoint in (B) with certain functionalities (purple rectangle) that enables rotatable 3D-visualization. For an overview of AceTree and its 3D functionality, see references5,6,8. Please click here to view a larger version of this figure.

Figure 6: Timed developmental dynamics of C. elegans embryos on the diSPIM. Top panel, diSPIM images showing the first half of embryonic development for one of the imaged embryos (Strain BV514 ujIs11324). Embryos were imaged continuously, every minute for 7.5 hours (at 20 °C). The first two images of top panel represent 4- and 8-cell embryos with nuclei (red) and positions of polar bodies (dense red spheres, marked with blue asterisks). Each image represents a single-view maximum-intensity projection of the imaged embryo. Scale bars = 10 µm. The timeline (horizontal bar) represents minutes post fertilization (m.p.f.) of the development of C. elegans embryos. We validated that our protocol's parameters for diSPIM acquisition did not induce any detectable phototoxicity to the imaged embryos as assessed by viability, timing of cell divisions, timing of hatching and timing of developmental milestones (see references1,25,26). We note that the timing of developmental milestones was reproducible across embryos with our imaging parameters (SEM ± 8.174 minutes for 6.4 hour long imaging sessions; n = 10). Please click here to view a larger version of this figure.

Figure 7. Cellular identification and single cell characterization of neurite outgrowth dynamics in developing C. elegans embryos. Dual-color imaging of a strain made by crossing BV514 ujIs11324 (for lineaging) and DCR7692 (olaex4655), a transgenic nematode strain that expresses GFP off the neuropeptide flp-19 promoter in a subset of unidentified cells. (A-H) Following the steps of the protocol outlined here, we determined that the unidentified cells correspond to motor neurons RMDDL and RMDDR (yellow arrows), to the excretory canal cell (blue arrows), and to two muscle cells (white arrows). (I) Quantification of the outgrowth dynamics of the RMDDL and RMDDR neurons by using FIJI plugin “simple neurite tracing” and applying it to 3D reconstructions of isotropically fused volumes. Note how both RMDDL and RMDDR show stereotypic outgrowth dynamics, each extending synchronously for a total length of 11.0±0.6µm (mean ± SEM; n = 12 neurites) and meeting at the dorsal apex of nerve ring (see also Movie S1). Please click here to view a larger version of this figure.

Figure 8: Examination of Isotropic diSPIM images of neuronal morphologies in C. elegans embryos. Isotropic visualization of AVHL and AVHR neurons (yellow arrows). Using the diSPIM, neuronal morphologies can be captured yielding four-dimensional (4D) images with isotropic spatial resolution of approximately 330 nm. The diSPIM allows users to virtually rotate image volumes with identical resolution in all direction. Images in A-D are maximum-intensity projections of the same isotropically fused diSPIM image volume from distinct rotations around the embryo's long axis. Scale bars = 5 µm. Please click here to view a larger version of this figure.
Supplementary Movie S1: C. elegans embryo developing from 280 to 434 minutes post fertilization. Isotropic movie of strain DCR7692 (olaex4655) expressing ujIs113 ubiquitously with DACR2819 sparsely labeling RMDD neurites (Figure 7A-D, yellow arrows). DACR2819 also labels two muscle cells (Figure 7A-D, white arrows) and excretory canal cell (Figure 7A-D, blue arrow) during embryonic development (Figure 7A-D). Scale bars = 10 µm. Please click here to download this file.
Discussion
C. elegans stands out as the only organism with the final positions and connectivity of each adult neuron known27. However, the developmental dynamics leading to organization of the working circuits and networks that makes up the C. elegans connectome remain unknown. Based on opportunities emerging from advances in light microscopy, we can now capture and analyze cell positions, morphogenesis, and neurogenesis throughout C. elegans embryonic development.
The procedure that we have described and that we routinely use in the lab yields 4D-isotropic images of labeled neurons and nuclei for cell-lineaging in C. elegans embryos. More importantly, we have optimized long-term imaging conditions with the diSPIM and coupled semi-automated lineaging capabilities with high-resolution images to improve the speed and precision of analyzing C. elegans embryogenesis. This integrated protocol will enable users to visualize and identify cells and quantitate three-dimensional features such as neurite migration and axon fasciculation through onset of early twitching. This procedure can be readily adapted into any facility with an ASI diSPIM system, and we recommend this system specifically for this protocol. Other SPIM formulations offered commercially may differ from the ASI configuration in the sample chamber and optical properties. However, data exported from other platforms can also be put through our data pipeline. Therefore, appraisal of their value in lineaging, a demanding test of image quality and instrument stability, is feasible. Even though we actively use the diSPIM to regularly image other specimens (such as drosophila and zebrafish embryos), the described and comprehensive lineaging analysis of embryos is still currently limited to the nematode species. For larger or thick samples, we opt to use stage-scanning approaches, which scan the samples through a stationary light sheet. Kumar et al. have previously demonstrated this improved diSPIM sectioning to yield high quality images from thick samples without additional modifications to the diSPIM10.
The critical steps within the protocol include mounting C. elegans embryos on the poly-L-lysine coated coverslip, data acquisition, and data processing. Harvesting and mounting C. elegans embryos on the glass coverslip can be challenging to inexperienced users, but here we provide a detailed protocol of key steps to facilitate learning. If long-term imaging is desired, we obtain best results harvesting four-cell or earlier embryos from 8-10 young adults28. Note that old adults are less desirable to harvest early stage embryos because they tend to contain older embryos in the uterus and unfertilized eggs. In regards to mounting embryos, problems such as blockage in the assembled aspirator (mouth pipette) or a too-large of an opening in the microcapillary pipette may prevent proper mounting and orientation of embryos. To prepare for optimal imaging, we perform pre-acquisition testing on early and late pre-twitching embryos to check the performance of the light sheets, cameras, objectives, and autofocus. We obtain best results when all of these operations are tested and yield high quality images during our pre-acquisition testing. This is particularly relevant for generating images with isotropic spatial resolution, for which raw images acquired from both views (objectives) must be of high-quality. After acquisition, the volumes acquired for each view are processed to yield isotropic images. It is important to use an appropriate graphics processing unit (GPU) card as described in this protocol (see below). This improves the processing speed at which the isotropically fused images are generated, shortening the time to data analyses. It is also imperative that users are running the latest version of CytoSHOW and are using the parameters provided with our download bundle for StarryNite auto-lineaging. If users are interested in using auto-lineaging for other samples (e.g., zebrafish, drosophila etc.) then additional optimization to the parameters used in StarryNite will be required (see references3,4).
Although our integrated protocol provides images and lineaging results in the pre-twitching embryo, users should be aware that automated lineaging in the post-twitching embryo is currently not feasible: nuclear positions changes on the order of seconds in the post-twitching embryo, too rapidly to allow lineage tracking. However, the diSPIM has indeed demonstrated a promising capability to capture neurodevelopmental events and track some cell positions in the post-twitching stages of embryogenesis23,29. If users are interested in examining the post-twitching embryo, the diSPIM does provide the speed to obtain volumetric snapshots and track fine neurodevelopmental events, such as neurite outgrowth, in rapidly moving embryos.
This protocol will be foundational for the cell-by-cell completion of the WormGUIDES atlas30, as it will provide an integrated approach with high resolution isotropic images to identify and capture 3D morphologies of labeled neurons during the first 430 minutes of embryogenesis. As it stands, the prototype WormGUIDES atlas provides nuclear positions of cells in the developing embryo and aims to capture the developmental dynamics of a subset of embryonic neurons. This protocol will be a key for the integration of additional developing neurons into the WormGUIDES atlas30.
Our integrated protocol will also simplify exploring new gene expression profiles in the C. elegans embryo. In transgenic C. elegans, many cell-specific promoters spatially and temporally control transgene expression. While the expression patterns of most genes have been extensively characterized in the adult animal31,32,33,34, nearly all have yet to be characterized in the developing (especially late-stage) embryo. The C. elegans promoterome has been a useful resource to the worm community to drive cell-specific transgene expression, as well as determine whether gene function is cell-autonomous or non-autonomous. Capturing isotropic high-resolution and dynamic expression patterns of genes, and precisely identifying expressing cells via lineaging will be valuable to many in the scientific community.
Embryogenesis comprises two intertwined major processes, cellular differentiation and tissue morphogenesis. A great deal is known about the mechanisms and molecules that define distinct cell types during the development of C. elegans. However, little is known about the mechanisms important for cell migration, cell adhesion, and cell shape in the C. elegans embryo. With the C. elegans invariant cell lineage known, our protocol lets us readily discern the catalogued 3D-microanatomy of the embryo during morphogenesis at new levels of detail: e.g., axon fasciculation, synaptogenesis, and neuronal activity. Ardiel et al. have previously demonstrated the power of the diSPIM to capture calcium transients at the level of a single neurons in C. elegans embryos23. Many other aspects of developmental physiology are ripe for inquiry by these methods.
Finally, this protocol is largely automated and systematically reduces the time it takes to generate deconvolution images and perform cell-lineaging via StarryNite and Acetree. The software strategies used in this protocol can be applied to many questions of biology far-flung from the very specific fields in which we have demonstrated them here.
Details on software compatibility and download access
Information on Micro-Manager and plugins for diSPIM imaging are available at http://dispim.org/software/micro-manager and https://micro-manager.org/wiki/ASIdiSPIM_Plugin.
The data-processing pipeline currently requires a Windows operating system. We have bundled a single archive file to simplify installation of all required data-processing programs and support files. It is available for download at http://dispimlineage.wormguides.org.
CytoSHOW (http://run.cytoshow.org/) is based on the widely used and open source image analysis platform, ImageJ (v1). Java must be installed and up-to-date on the computer to use CytoSHOW, and updates to CytoSHOW are deployed automatically via Java Web Start. Many ImageJ-based functions of CytoSHOW are as described and illustrated at https://imagej.nih.gov/ij/docs/examples/index.html. CytoSHOW has been customized to display multidimensional raw data from the ASI diSPIM, as well as other imaging software that creates TIFF output. In principle, other multi-view SPIM imaging systems could be supported by minor modifications of CytoSHOW to allow this protocol to be carried out on different microscope systems.
SpimFusion was written in CUDA/C++ using Visual Studio 2013 with CUDA toolkit v7.5. Running SpimFusion requires specific computer hardware: a NVIDIA graphics processing unit (GPU) card with CUDA compute capability 1.0 or higher and a minimum of 2 GB graphics card memory. At the time of publication of our protocol, SpimFusion is unpublished (Min Guo and Hari Shroff) but available in the software bundle archive mentioned above.
A specially built command-line driven version of StarryNite requires that the freely available MATLAB Compiler Runtime is installed, but does not require a license for commercial MATLAB software. The MATLAB Compiler Runtime is included in the software bundle archive mentioned above. The code for StarryNite as used in this protocol is essentially unchanged from that used for confocal images6. However, several operational matters in the creation of input images for StarryNite processing and the handling of StarryNite results have been addressed here by methods in CytoSHOW that enable a continuous data processing pipeline for fused isotropic diSPIM volumes. These changes are automated by CytoSHOW code that handles these pre-and post-processing steps. CytoSHOW also edits a pre-optimized diSPIM-specific template StarryNite parameter set to automatically tune the segmentation algorithm to the fluorescence intensity of nuclei in the imaged data. The unique parameters used by StarryNite on each diSPIM data set are then saved in a file along with the output image and lineaging data.
A custom version of AceTree that works with 16-bit images and maintains compatibility with Java3D rendering is best suited for this protocol. It is also included in the software bundle archive mentioned above.
Disclosures
The authors have nothing to disclose.
Acknowledgments
We thank John Murray for integrated strain, ujIs113, to generate lineaging strain BV514; Brandon Harvey (NIBIB) for help with testing the protocol; Jon Daniels and Gary Rondeau (Applied Scientific Instrumentation) for assistance with Micro-Manager and diSPIM instrument; and Andrew York and Hank Eden for their critical feedback on the diSPIM system. We also thank the Research Center for Minority Institutions program and the Instituto de Neurobiología Jose del Castillo (Universidad de Puerto Rico) for providing a meeting and brainstorming platform. Much of this work was conducted at the Marine Biological Laboratory at Woods Hole through the Whitman Program. This work was supported by the Intramural Research Programs of the NIH National Institute of Biomedical Imaging and Bioengineering and by NIH grant No. U01-HD075602 and No. R24-OD016474. Mark W. Moyle was supported by F32-NS098616 and Leighton H. Duncan was supported by a Diversity Supplement to R24-OD016474.
Materials
| Name | Company | Catalog Number | Comments |
| Steps 1-4 | |||
| Concavity slides | ThermoFisher Scientific | 1519006 | 5-18mm diameter, 0.6-0.8mm deep, 1.2-1.5mm |
| Dissecting microscope with 10×–50× zoom range | Motic | SMZ-171 | |
| E. coli (OP50) | Caenorhabditis Genetics Center (CGC) | OP50 | |
| Glass coverslips, no. 1.5, 24 × 50 mm | VWR International | 48393-241 | |
| M9 Buffer | Stiernagle, T. Maintenance of C. elegans. WormBook. 1-11, doi:10.1895/wormbook.1.101.1, (2006). | ||
| Methyl cellulose | Sigma-Aldrich | H7509-25G | |
| Microcapillary pipette aspirator tube | Sigma-Aldrich | A5177 | |
| Microcapillary pipettes, 0.4-mm i.d | Drummond Scientific | 1-000-800 | |
| Needle, no. 18G x 1 ½ (1.2mm x 40mm) | BD Precision Glide | 305196 | |
| NGM plates | prepared as described by Brenner (1974) | ||
| O-ring for imaging chamber | O-Rings West | M1.5X40 | |
| Pasteur pipette | Corning/Sigma-Aldrich | CLS7095D5X | |
| Platinum wire, 0.5-mm diameter | Sigma-Aldrich | 267201 | |
| Poly-L-lysine | Sigma-Aldrich | P1524 | |
| Stainless steel rectangular chamber (76.0 mm x 50.5 mm) | Applied Scientifics Instrumentations (ASI) | I2450 | |
| Worm Eyelash Pick | Hart, A. C. Behavior. WormBook. (2006). | ||
| Worm Pick | Stiernagle, T. Maintenance of C. elegans. WormBook. 1-11, doi:10.1895/wormbook.1.101.1, (2006). | ||
| Name | Company | Catalog Number | Comments |
| Steps 5-6 | |||
| 488 nm long-pass filter | Semrock | LP02-488 RU-2 | |
| 561-nm notch filter | Semrock | NF03-561E-25 | |
| BLP02-561R-25, quantity 2 | Semrock | 561 nm EdgeBasic best-value long-pass edge filter | |
| Control software for bottom camera | Jenoptik | ProgRes CapturePro | |
| diSIPM assembly video | Applied Scientifics Instrumentations (ASI) | https://youtu.be/TAgbr6IrTqw ; http://www.asiimaging.com | |
| diSPIM alignment video | Applied Scientifics Instrumentations (ASI) | https://youtu.be/qnOrg30NNuE | |
| diSPIM imaging PC | Intel | Intel Xeon CPU E5-2630 2.6GHz, 12 cores in total, 64 GB memory, Windows 7 | |
| FF01-525/45-25, quantity 2 | Semrock | 525/45 nm BrightLine single-band bandpass filter | |
| FF555-DI03-25X36, quantity 2 | Semrock | 555 nm edge BrightLine single-edge dichroic beamsplitter | |
| Imaging PC Graphics Card | NVIDIDA | NVIDIA GeForce GTX 1080 Ti graphics cards | |
| Kumar et al diSPIM Setup | Applied Scientifics Instrumentations (ASI) | Instrument setup for this protocol is identical to Kumar et al 10,11 diSPIM, which makes use of 40x 0.8NA water immersion lenses for imaging. (See steps 5.1 and note) | |
| Micro Manager | Micro-Manager | https://micro-manager.org/ | |
| Modifications to Kumar et al diSPIM Setup (see below) | |||
| Optical table with isolators, 4 feet × 6 feet × 12 inches | TMC | 784-651-02DR and 14-416-34 | |
| Name | Company | Catalog Number | Comments |
| Steps 7-10 | |||
| Analysis PC | Intel | Intel Core i7-8700K CPU 3.70GHz, 6 cores in total, 64 GB memory, Windows 10 | |
| Analysis PC Graphics Card | NVIDIDA | NVIDIA GeForce GTX 1080 Ti graphics cards | |
| Installation instructions | Software bundle | http://dispimlineage.wormguides.org/diSPIMlineaging_InstallationInstructions.htm | |
| Software bundle | Software bundle | http://dispimlineage.wormguides.org |
References
- Sulston, J. E., Schierenberg, E., White, J. G., Thomson, J. N. The embryonic cell lineage of the nematode Caenorhabditis elegans. Developmental Biology. 100 (1), 64-119 (1983).
- Bao, Z., et al. Automated cell lineage tracing in Caenorhabditis elegans. Proceedings of the National Academy of Sciences of the United States of America. 103 (8), 2707-2712 (2006).
- Santella, A., Du, Z., Bao, Z. A semi-local neighborhood-based framework for probabilistic cell lineage tracing. BMC Bioinformatics. 15, 217 (2014).
- Santella, A., Du, Z., Nowotschin, S., Hadjantonakis, A. K., Bao, Z. A hybrid blob-slice model for accurate and efficient detection of fluorescence labeled nuclei in 3D. BMC Bioinformatics. 11, 580 (2010).
- Boyle, T. J., Bao, Z., Murray, J. I., Araya, C. L., Waterston, R. H. AceTree: a tool for visual analysis of Caenorhabditis elegans embryogenesis. BMC Bioinformatics. 7, 275 (2006).
- Katzman, B., Tang, D., Santella, A., Bao, Z. AceTree: a major update and case study in the long term maintenance of open-source scientific software. BMC Bioinformatics. 19 (1), 121 (2018).
- Murray, J. I., et al. Automated analysis of embryonic gene expression with cellular resolution in C. elegans. Nature Methods. 5 (8), 703-709 (2008).
- Murray, J. I., Bao, Z., Boyle, T. J., Waterston, R. H. The lineaging of fluorescently-labeled Caenorhabditis elegans embryos with StarryNite and AceTree. Nature Protocols. 1 (3), 1468-1476 (2006).
- Wu, Y., et al. Spatially isotropic four-dimensional imaging with dual-view plane illumination microscopy. Nature Biotechnology. 31 (11), 1032-1038 (2013).
- Kumar, A., et al. Using Stage- and Slit-Scanning to Improve Contrast and Optical Sectioning in Dual-View Inverted Light Sheet Microscopy (diSPIM). The Biological Bulletin. 231 (1), 26-39 (2016).
- Kumar, A., et al. Dual-view plane illumination microscopy for rapid and spatially isotropic imaging. Nature Protocols. 9 (11), 2555-2573 (2014).
- Wu, Y., Christensen, R., Colon-Ramos, D., Shroff, H. Advanced optical imaging techniques for neurodevelopment. Current Opinion in Neurobiology. 23 (6), 1090-1097 (2013).
- Wu, Y., et al. Inverted selective plane illumination microscopy (iSPIM) enables coupled cell identity lineaging and neurodevelopmental imaging in Caenorhabditis elegans. Proceedings of the National Academy of Sciences of the United States of America. 108 (43), 17708-17713 (2011).
- Huisken, J., Stainier, D. Y. Selective plane illumination microscopy techniques in developmental biology. Development. 136 (12), 1963-1975 (2009).
- Stelzer, E. H. Light-sheet fluorescence microscopy for quantitative biology. Nature Methods. 12 (1), 23-26 (2015).
- Winter, P. W., Shroff, H. Faster fluorescence microscopy: advances in high speed biological imaging. Current Opinion in Chemical Biology. 20, 46-53 (2014).
- Lucy, L. B. An iterative technique for the rectification of observed distributions. Astronomical Journal. 76 (6), 745-754 (1974).
- Richardson, W. H. Bayesian-Based Iterative Method of Image Restoration. JOSA. 62 (1), 55-59 (1972).
- Stiernagle, T. Maintenance of C. elegans. WormBook. , 1-11 (2006).
- Hart, A. C. Behavior. WormBook. , (2006).
- Edelstein, A., Amodaj, N., Hoover, K., Vale, R., Stuurman, N. Computer control of microscopes using microManager. Current Protocols in Molecular Biology. Chapter 14, Unit14 20 (2010).
- Gualda, E. J., et al. SPIM-fluid: open source light-sheet based platform for high-throughput imaging. Biomedical Optics Express. 6 (11), 4447-4456 (2015).
- Ardiel, E. L., et al. Visualizing Calcium Flux in Freely Moving Nematode Embryos. Biophysical Journal. 112 (9), 1975-1983 (2017).
- Walton, T., et al. The Bicoid class homeodomain factors ceh-36/OTX and unc-30/PITX cooperate in C. elegans embryonic progenitor cells to regulate robust development. PLoS Genetics. 11 (3), e1005003 (2015).
- Altun, Z. F. WormAtlas. , (2002).
- Wood, W. B. Embryology: In the nematode C. elegans. Cold Spring Harbor Laboratory Press. Chapter 8, 215-241 (1988).
- White, J. G., Southgate, E., Thomson, J. N., Brenner, S. The structure of the nervous system of the nematode Caenorhabditis elegans. Philosophical Transactions of the Royal Society B: Biological Sciences. 314 (1165), (1986).
- Bao, Z., Murray, J. I. Mounting Caenorhabditis elegans embryos for live imaging of embryogenesis. Cold Spring Harb Protoc. (9), (2011).
- Christensen, R. P., et al. Untwisting the Caenorhabditis elegans embryo. eLife. 4, (2015).
- Santella, A., et al. WormGUIDES: an interactive single cell developmental atlas and tool for collaborative multidimensional data exploration. BMC Bioinformatics. 16, 189 (2015).
- Dupuy, D., et al. A first version of the Caenorhabditis elegans Promoterome. Genome Research. 14 (10B), 2169-2175 (2004).
- Reece-Hoyes, J. S., et al. Insight into transcription factor gene duplication from Caenorhabditis elegans Promoterome-driven expression patterns. BMC Genomics. 8 (27), (2007).
- WormBase. , Available from: https://www.wormbase.org (2019).
- Lee, R. Y. N., et al. WormBase 2017: molting into a new stage. Nucleic Acids Research. 46 (D1), D869-D874 (2018).
