
INTRODUCTION
In the United States, human immunodeficiency virus (HIV) accounts for >16 000 deaths per year and a substantial burden on the >1.1 million people living with HIV (PLWH).1,2 Improved antiretroviral (ARV) therapies have increased the life expectancy of PLWH,3 increasing the proportion of PLWH ≥50 years old from 42% to 50% from 2013 to 2016.4 Elderly PLWH are at greater risk of developing chronic diseases such as hypertension and diabetes, and these conditions are increasingly prevalent in PLWH.5–7 Furthermore, metabolic disease risk factors such as obesity may interact with HIV or ARV-related factors, thereby worsening existing comorbidities and/or complicating patient care.8
Recent studies have shown that initiating ARV therapy leads to weight gain, from a few kilograms to >20% of original bodyweight, especially within the first year.9–11 Integrase strand transfer inhibitor (INSTI)-based regimens are commonly prescribed for the management of HIV12 but have recently been associated with greater weight gain compared with protease inhibitor (PI)-based13 or non-nucleoside reverse transcriptase inhibitor (NNRTI)-based regimens.14,15 Impacts on weight vary, with dolutegravir and bictegravir demonstrating greater weight gain than other INSTIs.14,16 Recent evidence also suggests greater risk of weight gain in females using INSTI-based regimens compared with males;17 however, few studies have compared weight gain with INSTI-based regimens versus other regimens in females.18 Therefore, the current study aimed to compare weight gain among treatment-naïve PLWH who initiated INSTI-based versus PI-based ARV regimens, including the subpopulation of female patients.
METHODS
Data Source(s)
Patient-level records were obtained from the Optum® deidentified EHR database, containing deidentified longitudinal data for 80 million US patients (≥7 million patients from each Census region). The database includes information on outpatient visits, diagnostic procedures, medications, laboratory results, hospitalizations, clinical notes, and patient outcomes, primarily from integrated delivery networks.
Study Period and Population
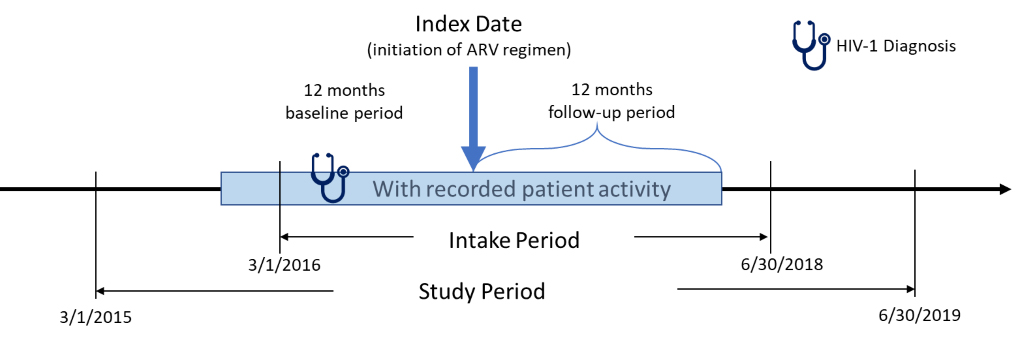
This retrospective, observational, matched-cohort study was conducted using data from March 1, 2015 to June 30, 2019 (Figure 1). PLWH who had ≥1 written prescription for INSTI- or PI-based ARV regimens between March 1, 2016 and June 30, 2018 were included. The date of the earliest written ARV prescription during this study intake period was considered the index date. Additional study inclusion criteria were: age ≥18 years at index; ≥365 days of EHR activity both pre- and post-index; ≥1 diagnosis for HIV-1 during the year prior to the index date (baseline period); ≥1 baseline (between 12 months pre- and 30 days post-index) and follow-up (between months 4 and 12 post-index) measure for either weight or body mass index (BMI). Exclusion criteria were: HIV-2 diagnosis or evidence of pregnancy during the study; ≥1 prescription for any ARV during baseline period; and inconsistent/missing data on gender or birth year.

Identification of Index Regimen
For treatment-naïve HIV-1 patients, an ARV regimen generally consists of two nucleoside reverse transcriptase inhibitors (NRTIs) in combination with a third ARV agent from other ARV drug classes (INSTI, PI, or NNRTI). ARV regimens are currently available in two types of formulations: fixed dose combinations (FDC), which contain a combination of two or more ARV agents in a single tablet, and multi-tablet regimen formulations. For this study, INSTI- or PI-based regimens identified on the index date were defined as the index regimen. Patients were classified as INSTI initiators if the index ARV regimen included dolutegravir, raltegravir, bictegravir, or elvitegravir, with no prescription for PIs or NNRTIs within ±14 days of the index date. Patients were classified as PI initiators if the index ARV regimen included atazanavir, darunavir, fosamprenavir, ritonavir, saquinavir, tipranavir, amprenavir, indinavir, or nelfinavir, with no prescription for INSTIs or NNRTIs within ±14 days of the index date. Patients not taking an FDC INSTI or PI were required to have prescriptions for ≥2 distinct NRTIs or ≥1 NRTI FDC within 14 days of the index date.
Outcomes
The primary outcomes were change in weight and BMI within 12 months post-initiation of INSTI- versus PI-based regimens in treatment-naïve (1) males and females and (2) females. Change in weight and BMI from baseline measure to follow-up measure were reported as absolute change and percent change. The proportion of patients with weight gain ≥10 kg, ≥5%, ≥10%, or extreme gain (i.e., weight gain above the ≥95th percentile for the overall study population) were also determined, as were the proportion with BMI increases ≥5%, ≥90th percentile or ≥95th percentile of the overall study population, or who shifted their BMI category. All outcomes were also determined by index BMI value category (<25 kg/m2 vs ≥25 kg/m2).
Variables
Variables included demographic characteristics (age, gender, race, region, insurance type, and index year), clinical characteristics (Quan Charlson Comorbidity Index [QCI] score; comorbidities such as diabetes, hypertension, and obesity [see medication and diagnostic codes in the Supplementary Material], and medication use [see medication and diagnostic codes in the Supplementary Material]).
Data Analysis
Demographic characteristics, clinical characteristics, and outcomes of interest were analized descriptively using univariate statistics. Frequencies and percentages were reported for categorical variables; means and SDs were reported for continuous variables. All analyses used SAS Enterprise Guide, version 7 (SAS Institute Inc., Cary, NC).
Propensity Score Matching
Propensity score (PS) matching was applied to control for selection bias and improve cohort comparability. Logistic regression was employed to fit a PS model where the outcome was initiation of INSTI-based versus PI-based regimens. Independent variables in the model included: age, race, region, index year, weight and BMI, clinical characteristics, various comorbidities associated with weight gain (prediabetes/glucose intolerance, Type II diabetes, cardiovascular disease, myocardial infarction, peripheral vascular disease, congestive heart failure, hypertension, hyperlipidemia, obesity, nonalcoholic steatohepatitis [NASH], AIDS, and cancer) and commonly used medications that are associated with weight gain (diabetes medications, psychiatric/neurologic medications, chronic oral corticosteroids [≥2 consecutive written prescriptions for steroid with days’ supply ≥60 days during baseline period], hormone therapy/contraception, appetite stimulants/suppressants, and antihypertensives).
Each INSTI-based regimen user was matched to a PI-based regimen user with similar predicted probability using greedy nearest neighbor 1:1 matching (with no replacement), and a caliper with width of 0.2 of the pooled SD of the logit (PS) was used. Random numbers were assigned to all the patients in the INSTI-based regimen cohort using random number generation with a specified seed so that if two or more patients in the PI-based regimen cohort had the same PS and were considered the best match for a patient in the INSTI-based regimen cohort, the patient with the numerically lowest random number would be chosen as a match. Separate matching was conducted for the overall analysis and the female analysis to provide optimally balanced variables and maximum possible sample size for each.
Outcome Models
Outcomes of interest were compared between PS-matched cohorts using multivariable regression models. Confounders not balanced by PS-matching were controlled in the multivariable models as a covariate. Ordinary least squares models were used to model absolute and expected percent change in weight and BMI, as a function of the independent variable (INSTI- vs PI-based regimens) and covariates. 95% CIs and P values were calculated. Logistic regression was used to model the expected proportion of patients having weight/BMI increases, as a function of the independent variable (INSTI- vs PI-regimens) and covariates. P < 0.05 was considered statistically significant for all analyses.
RESULTS
Baseline Demographic and Clinical Characteristics
Of the 28 782 patients with ≥1 prescription for an INSTI or PI-based regimen during the intake period and ≥1 HIV-1 diagnosis within the prior 12 months, 5117 patients met all inclusion and exclusion criteria (INSTI, 4306; PI, 811). After matching (see patient attributes pre/post matching in the Supplementary Material), 1588 patients remained (794 per cohort). At baseline, the mean age was 49 years, 93% were ≤65 years of age, 26% were females, 64% had an AIDS diagnosis, 12% had Type II diabetes and 30% had hypertension. The mean baseline weight was 83 kg (183 lb) and 82 kg (181 lb) (P = 0.3); mean time to follow-up weight measure was 291 days and 286 days (P = 0.2) for the INSTI-based and PI-based cohorts, respectively (Table 1).
Among INSTI initiators, 25 (3.1%) were underweight at baseline (BMI <18.5 kg/m2), 269 (33.9%) had normal bodyweight (BMI 18.5–24.9 kg/m2), 261 (32.9%) were overweight (BMI 25.0–29.9 kg/m2), and 239 (30.1%) were obese (BMI ≥30 kg/m2). Among PI initiators, 18 (2.3%) were underweight at baseline, 304 (38.3%) had normal bodyweight, 243 (30.6%) were overweight, and 229 (28.8%) were obese (Table 1).
Overall Weight and BMI Changes
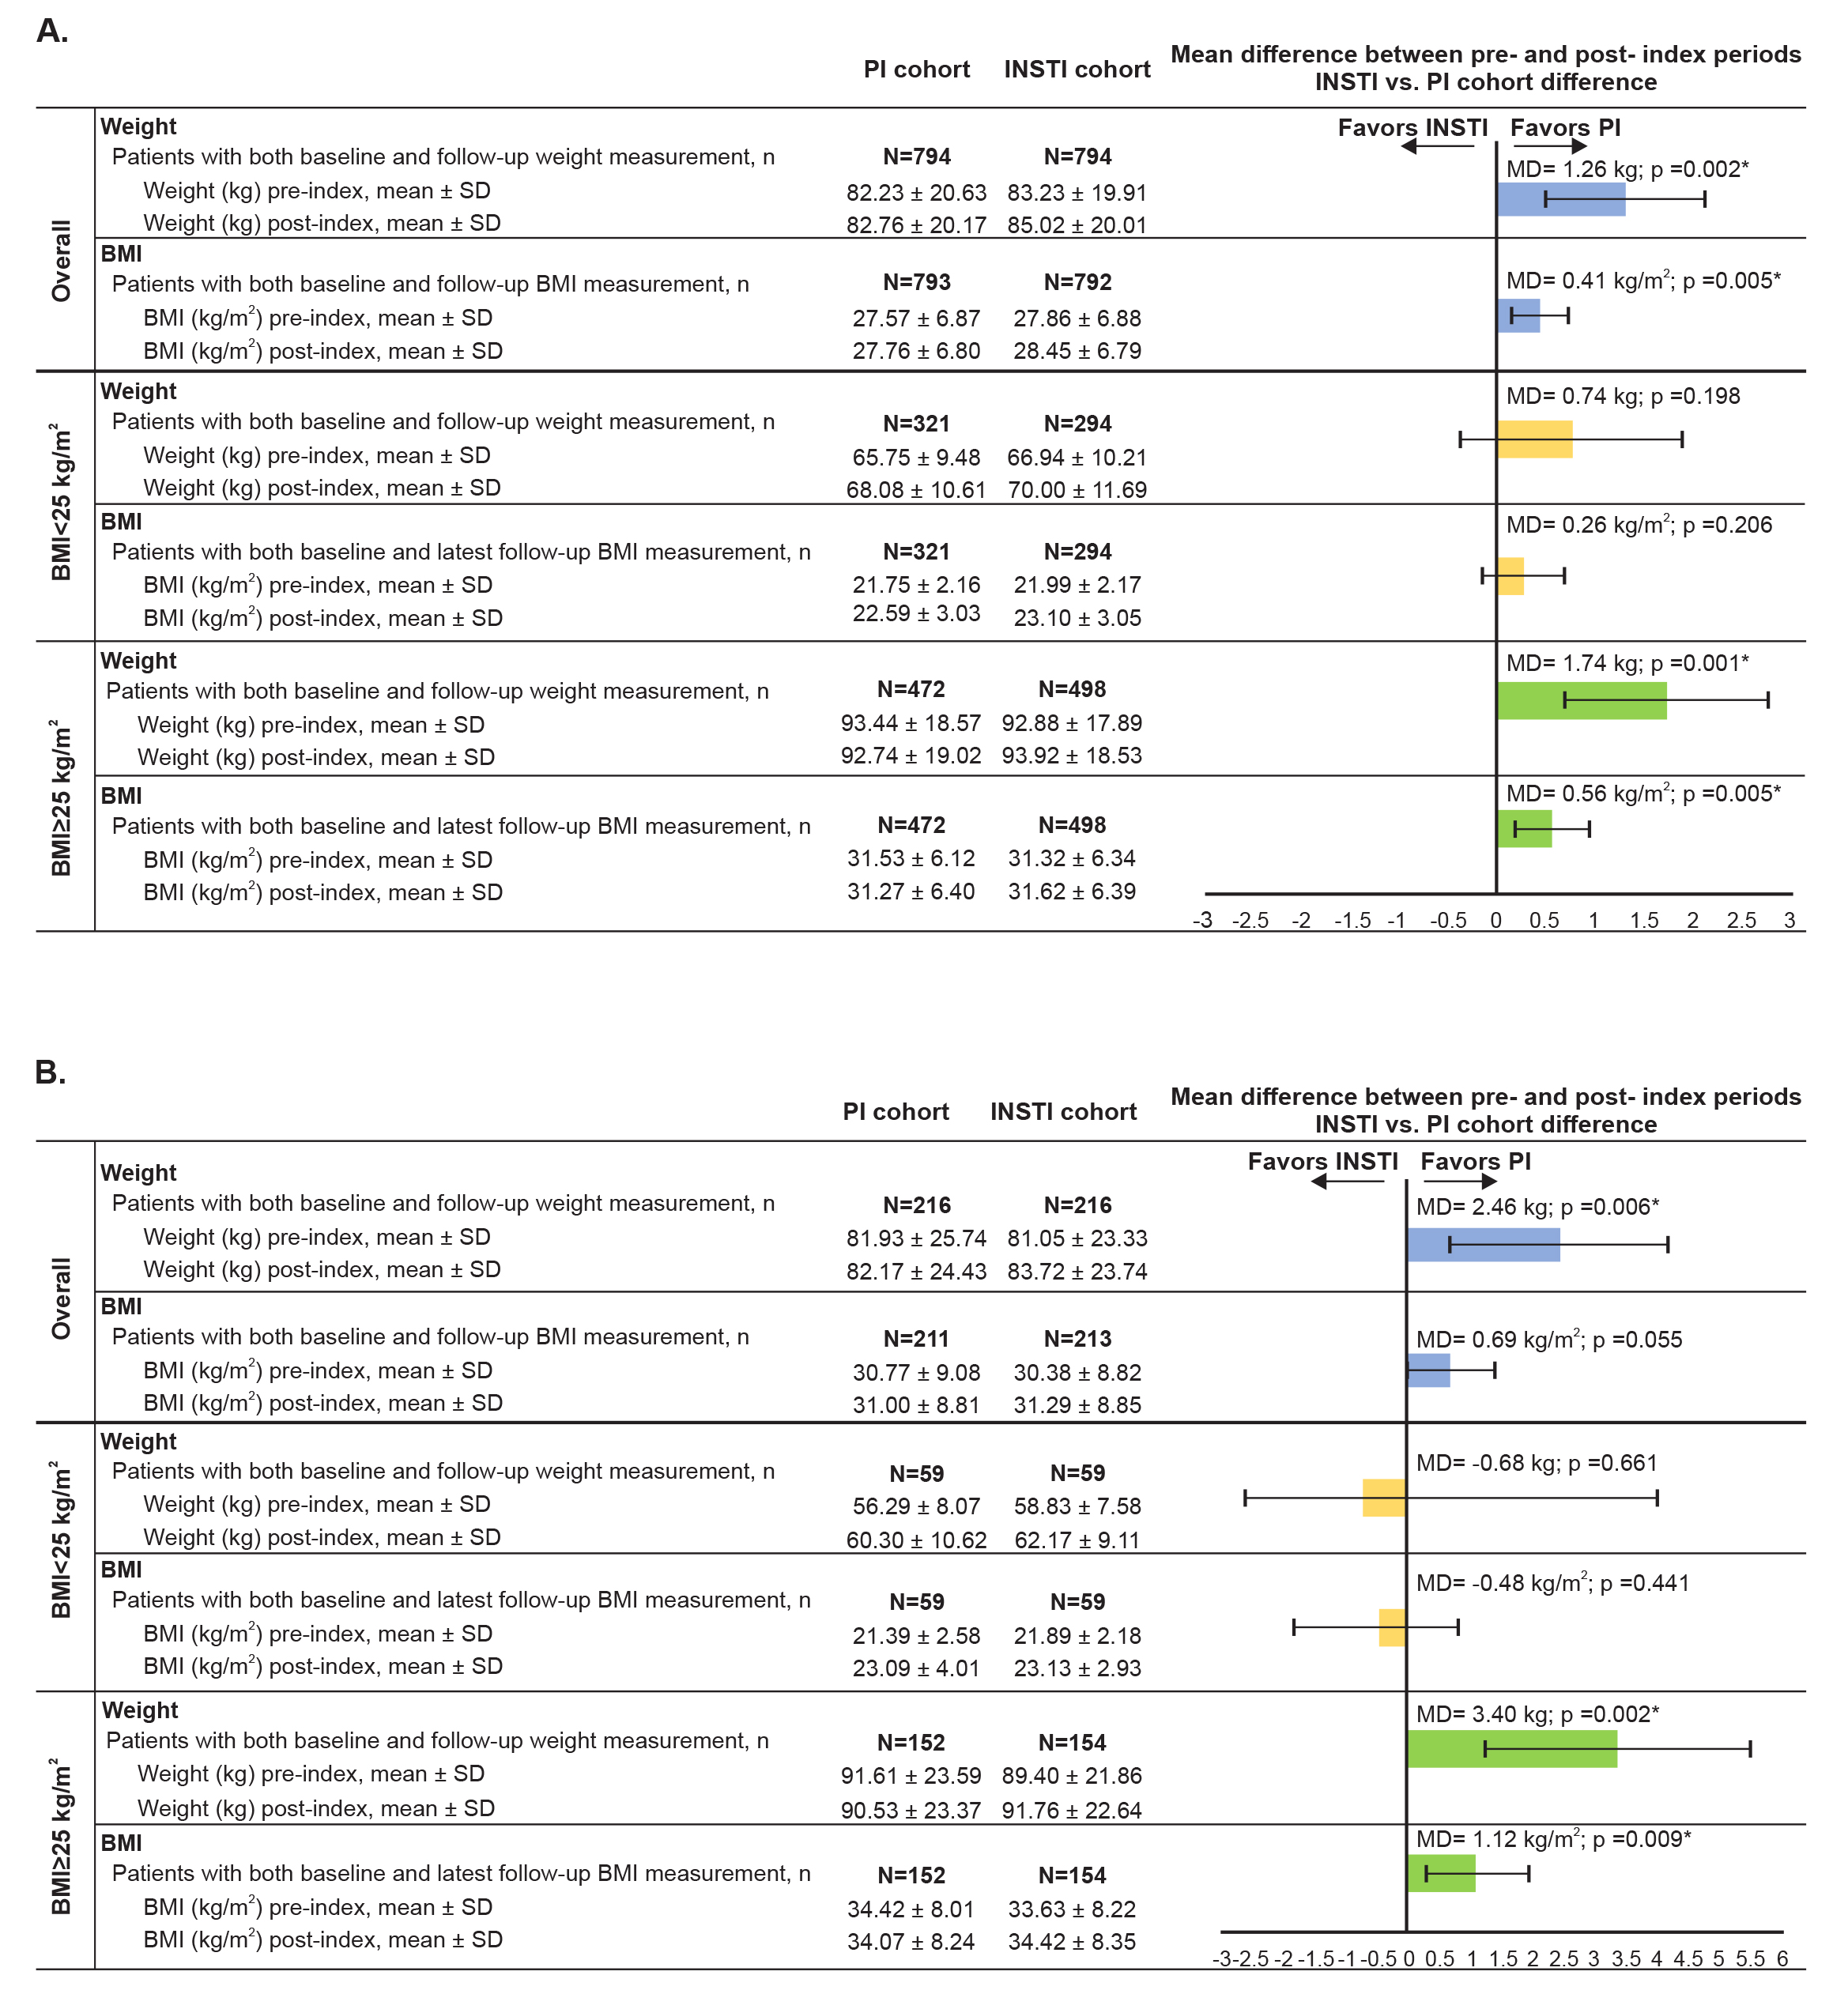
After a mean ~9.3-month follow-up, INSTI initiators had a 1.3 kg (2.9 lb) greater mean weight gain (1.8 kg [4.0 lb] vs 0.5 kg [1.1 lb]; 95% CI [0.5–2.0]) compared with PI initiators (Figure 2A). Similarly, a greater proportion of INSTI initiators experienced ≥5% (30.7% vs 26.1%; OR=1.3; 95% CI [1.0–1.6]), ≥10 kg (22 lb) weight gain (10.8% vs 6.3%; OR=1.9; 95% CI [1.3–2.8]), and extreme weight gain (i.e., weight gain ≥95th percentile for the overall study population; ≥13.6 kg [29.9 lb]; 6.4% vs 3.7%; OR=2.0; 95% CI [1.2–3.2]) (Figure 3A).
INSTI initiators had a greater mean BMI increase (0.4 kg/m2) compared with PI initiators and a higher proportion experienced BMI increases ≥5% (33.1% vs 26.2%; OR=1.4; 95% CI [1.1–1.7]) or ≥90th percentile (3.3 kg/m2) (11.7% vs 8.3%; OR=1.5; 95% CI [1.1–2.0]), compared with PI initiators.
Overall Weight and BMI Changes by Baseline BMI
Among patients with baseline BMI ≥25 kg/m2, INSTI initiators experienced a 1.7 kg (3.7 lb) greater weight gain (1.0 kg [2.2 lb] vs -0.7 kg [-1.5 lb]; 95% CI [0.7–2.8)]) than PI initiators (Figure 2A). Similarly, a greater proportion of INSTI initiators with baseline BMI ≥25 kg/m2 experienced ≥5% weight gain (27.1% vs 18.9%; OR=1.6; 95% CI [1.2–2.6]), ≥10% weight gain (i.e., 8.3 kg [18.3 lb]; 11.2% vs 6.4%; OR=1.9; 95% CI [1.2–3.0]), ≥10 kg (22 lb) weight gain (9.0% vs 4.9%; OR=1.9; 95% CI [1.2–3.3]), or extreme weight gain (i.e., weight gain ≥95th percentile for the overall study population; 5.2% vs 2.5%; OR=2.1; 95% CI [1.1–4.2]; Figure 3A). Among patients with baseline BMI <25 kg/m2, differences in mean weight gain between cohorts were not statistically significant (Figure 2A), although a greater proportion of INSTI initiators experienced ≥10 kg (22 lb) weight gain (13.6% vs 8.4%; OR=1.7; 95% CI [1.0–2.9]; Figure 3A).
Among patients with baseline BMI ≥25 kg/m2, INSTI initiators had a significantly greater BMI increase (0.6 kg/m2) and a significantly greater proportion with BMI increases ≥5% (28.9% vs 19.5%; OR=1.7; 95% CI [1.3–2.3]), compared with PI initiators, but there were no statistically significant differences in BMI changes among patients with baseline BMI <25 kg/m2 (Figure 2A).
Among INSTI initiators with normal weight at baseline, 22.3% and 3.3% became overweight or obese, respectively. Among overweight INSTI initiators, 17.4% shifted to obese. Among normal weight PI initiators, 19.1% and 1.7% became overweight or obese, respectively. Among overweight PI initiators, 13.6% shifted to obese (Table 2).
Baseline Demographic and Clinical Characteristics for Females
Of the 5117 patients who met all inclusion and exclusion criteria, 1212 were females. Separate matching was conducted for the female analysis. After matching, 432 patients remained (N = 216 matched pairs). Index year, baseline AIDS and steroid use remained unbalanced after matching. Thus, they were adjusted as covariates in the regression models. At baseline, the mean age was 49 years, 93% were ≤65 years of age, 16% had Type II diabetes, and 37% had hypertension. The most commonly reported race among females was African American (55%), followed by white (37%). The mean baseline weight was 81 kg (179 lb) and 82 kg (181 lb) (P = 0.7); mean time to follow-up weight measure was 295 days and 286 days (P = 0.3) for the INSTI-based and PI-based cohorts, respectively.
Weight and BMI Change in Females
Female INSTI initiators had a 2.5 kg (5.3 lb) greater weight gain (2.7 vs 0.2 kg; 95% CI [0.7–4.2]) compared with PI initiators (Figure 2B). Among female INSTI initiators, a higher proportion experienced ≥5% weight gain (37.5% vs 26.4%; OR=1.7; 95% CI [1.1–2.6]) or ≥10 kg (22 lb) weight gain (13.0% vs 6.0%; OR=2.3; 95% CI [1.1–2.3]; Figure 3B).
Female INSTI initiators had a 0.7 kg/m2 greater mean BMI increase (mean baseline BMI 30.4 kg/m2) compared with female PI initiators, but the difference was not statistically significant (3.5% vs 3.8%; mean difference=0.69; 95% CI [-0.02–1.4]) (Figure 2B). A significantly higher proportion of female INSTI initiators experienced BMI increases ≥5% (37.1% vs 26.5%; OR=1.7; 95% CI [1.1–2.5]) compared with female PI initiators.
Weight and BMI Changes in Females by Baseline BMI
Among females with baseline BMI ≥25 kg/m2, INSTI initiators had a 3.4 kg (7.5 lb) greater weight gain (2.4 kg [5.3 lb] vs -1.1 kg [-2.4 lb]; 95% CI [1.3–5.5]) compared with PI initiators (Figure 2B) and a higher proportion of INSTI initiators experienced a ≥5%, ≥10%, or extreme weight gain (Figure 3B). Among females with baseline BMI <25 kg/m2, the absolute differences in weight gain or BMI (Figure 2B) and the proportion of patients who experienced weight gain or BMI changes (Figure 3B) were not statistically significant between regimens.


DISCUSSION
After a mean ~9.3-month follow-up, we observed a mean 1.3 kg (2.9 lb) greater weight gain among INSTI initiators versus PI initiators, with INSTI initiators having 30% greater odds of ≥5% weight gain. Based on the mean baseline weight for this study population, 5% weight gain for a typical patient would be ≥4.1 kg (9.0 lb). INSTI initiators also experienced 0.4 kg/m2 greater BMI increase versus PI initiators. Other outcomes showed increased weight and BMI for INSTI initiators versus PI initiators, with generally larger differences for females and overweight patients. These findings are consistent with previous studies reporting greater weight gain with INSTIs versus other regimens,11,14,19 and among ARV-experienced patients who switch to INSTI-based regimens.13
Similar differences in weight gain were reported by Bourgi et al. (dolutegravir vs raltegravir vs PI-based regimens, 6.1 vs 3.4 vs 4.1 kg)14 and Norwood et al. (INSTI-based vs PI-based regimen, 2.9 vs 0.7 kg),13 both after 18 months. Also, Bakal et al. reported larger BMI increases (INSTI-based vs PI-based regimen [1.6 vs 0.4 kg/m2, per year]), with higher risk among females and overweight patients.11 In an open-label clinical trial, Venter et al. reported greater weight gain and treatment-emergent obesity at 48 weeks for subjects taking dolutegravir/emtricitabine/TDF (3.2 kg, 7%) versus efavirenz/emtricitabine/TDF (1.7 kg, 6%), with significantly higher gain among females.19 In a pooled analysis of eight clinical trials, Sax et al. reported that INSTIs were associated with approximately 1.5 kg and 1.3 kg greater weight gain than PIs or NNRTIs, respectively, with female and African American patients having the greatest risk of weight gain.16
Notably, weight gain has been associated with an increased risk of chronic diseases such as hypertension and diabetes,10,20 which are increasingly prevalent among older PLWH,21 who in turn represent a growing proportion of PLWH.4 Approximately 50% of patients in our study were ≥50 years old at baseline, 30% had hypertension and approximately 60% were overweight, underscoring the potential importance of our findings. Furthermore, INSTIs are commonly prescribed, so even small increases in mean weight gain may have important implications for population health management, and risks regarding INSTI-related weight gain have recently been noted in guidelines for HIV treatment.12
Differences in weight gain between regimens may be related to “return-to-health,” a common phenomenon in PLWH.16,22 However, our cohorts were well matched on demographic/clinical variables and only 2% to 3% were underweight at baseline. Additionally, this study only included the last follow-up weight/BMI measures that were ≥90 days post-index, whereas return-to-health is most likely to occur shortly after ARV initiation. Lastly, there is no reason to expect differences between regimens related to the return-to-health phenomenon, given the high efficacy of these contemporary ARVs. Nevertheless, it would be valuable to assess weight changes over a longer follow-up time, but this would have required an earlier patient intake period, which would have limited the ability of this study to focus on currently prescribed regimens.
This study has several strengths, including a large and diverse population of real-world PLWH from multiple provider networks in the United States, with a substantial proportion having comorbidities such as hypertension, obesity, and Type II diabetes. Inclusion of a diverse population increases the external validity and generalizability of this study, although future studies should include larger numbers of high-risk patients (e.g., women, African Americans). The Optum EHR database includes data (e.g., bodyweight, BMI) that are usually absent in administrative claims data. Another strength of this study is the PS matching approach, which was designed to reduce selection biases from measured confounders and improve internal validity of estimates. Lastly, this study assessed various clinically meaningful thresholds such as proportion with weight gain ≥5%, extreme weight gain (weight gain ≥95th percentile for the overall study population), or ≥90th or 95th percentile BMI increase.
This study also has limitations. Prescription records from EHR do not necessarily indicate whether the patient received or took the medication. The first HIV diagnosis or prescription for ARV observed may not correspond to the patient’s first diagnosis, since patients may have returned to care after a gap or switched from a provider that does not provide data to the Optum EHR database. Lastly, we observed that a higher proportion of INSTI-based versus PI-based regimens included tenofovir alafenamide fumarate (TAFs) (27.8% vs 2.4%), which has been associated with weight gain, especially in combination with INSTIs.19 Despite use of PSM analysis, the small number of PI initiators whose regimen included TAF prevented us from determining the relative contribution of TAF versus INSTIs. However, as the ADVANCE trial demonstrated,19 INSTI-based regimens without TAF also lead to greater weight gain than otherwise identical PI-based regimens, suggesting that greater use of TAF by INSTI initiators is unlikely to fully account for the differences we observed. Nevertheless, further studies are warranted.
CONCLUSIONS
Relative to patients newly initiating PI-based regimens, patients initiating INSTI-based regimens were more likely to experience weight gain within 12 months of initiation and had a greater mean weight gain. Increased weight and BMI for INSTI-based regimens were especially noteworthy among females and patients with baseline BMI ≥25 kg/m2. These findings may help health care providers choose optimal treatments for HIV management.
Acknowledgments: Ayush Srivastava and Ajaybir Singh, Mu Sigma Business Solutions Pvt. Ltd., Bengaluru, India, provided data programming support. Leo J. Philip Tharappel, SIRO Clinpharm, Mumbai, India, provided writing support. This work was funded by Janssen Scientific Affairs, LLC, USA.
Author Contributions: Drs. Y-WC, HH, CDP, and WC were involved in study design, analysis and interpretation. Y-WC performed the statistical analyses. All authors had full access to all study data and take responsibility for data integrity and accuracy of data analysis. All authors meet ICMJE criteria and all those fulfilling criteria are listed as authors. All authors provided input on the manuscript, made the final decision about where to publish these data, and approved submission to this journal.
Conflicts of Interest: Drs. Y-WC, CDP, and WC are employees of Janssen Scientific Affairs, LLC. HH is an employee of Janssen Research & Development, LLC. All authors hold stock in Johnson & Johnson, of which Janssen Scientific Affairs and Janssen Research & Development are wholly owned subsidiaries.
Funding: This work was funded by Janssen Scientific Affairs, LLC, USA.