

Connecting the Dots: A Comprehensive Modeling and Evaluation Approach to Assess the Performance and Robustness of Charging Networks for Battery Electric Trucks and Its Application to Germany


Abstract
:1. Introduction
2. Related Work
2.1. Electric Vehicle Charging Infrastructure Planning
2.2. Research Gap and Contributions
- 1
- Quantification of time loss and spatial coverage.
- 2
- Greater modeling detail.
- 3
- A case study examining two networks published by Speth et al. [19] in detail.
- 4
- Newly derived networks to quantify required network density and robustness to outages.
- 5
- Charging strategy adaptation behavior.
- 6
- Microscopic resolution of a charging site’s role within a network.
- 7
- Identification of control levers to optimize system performance.
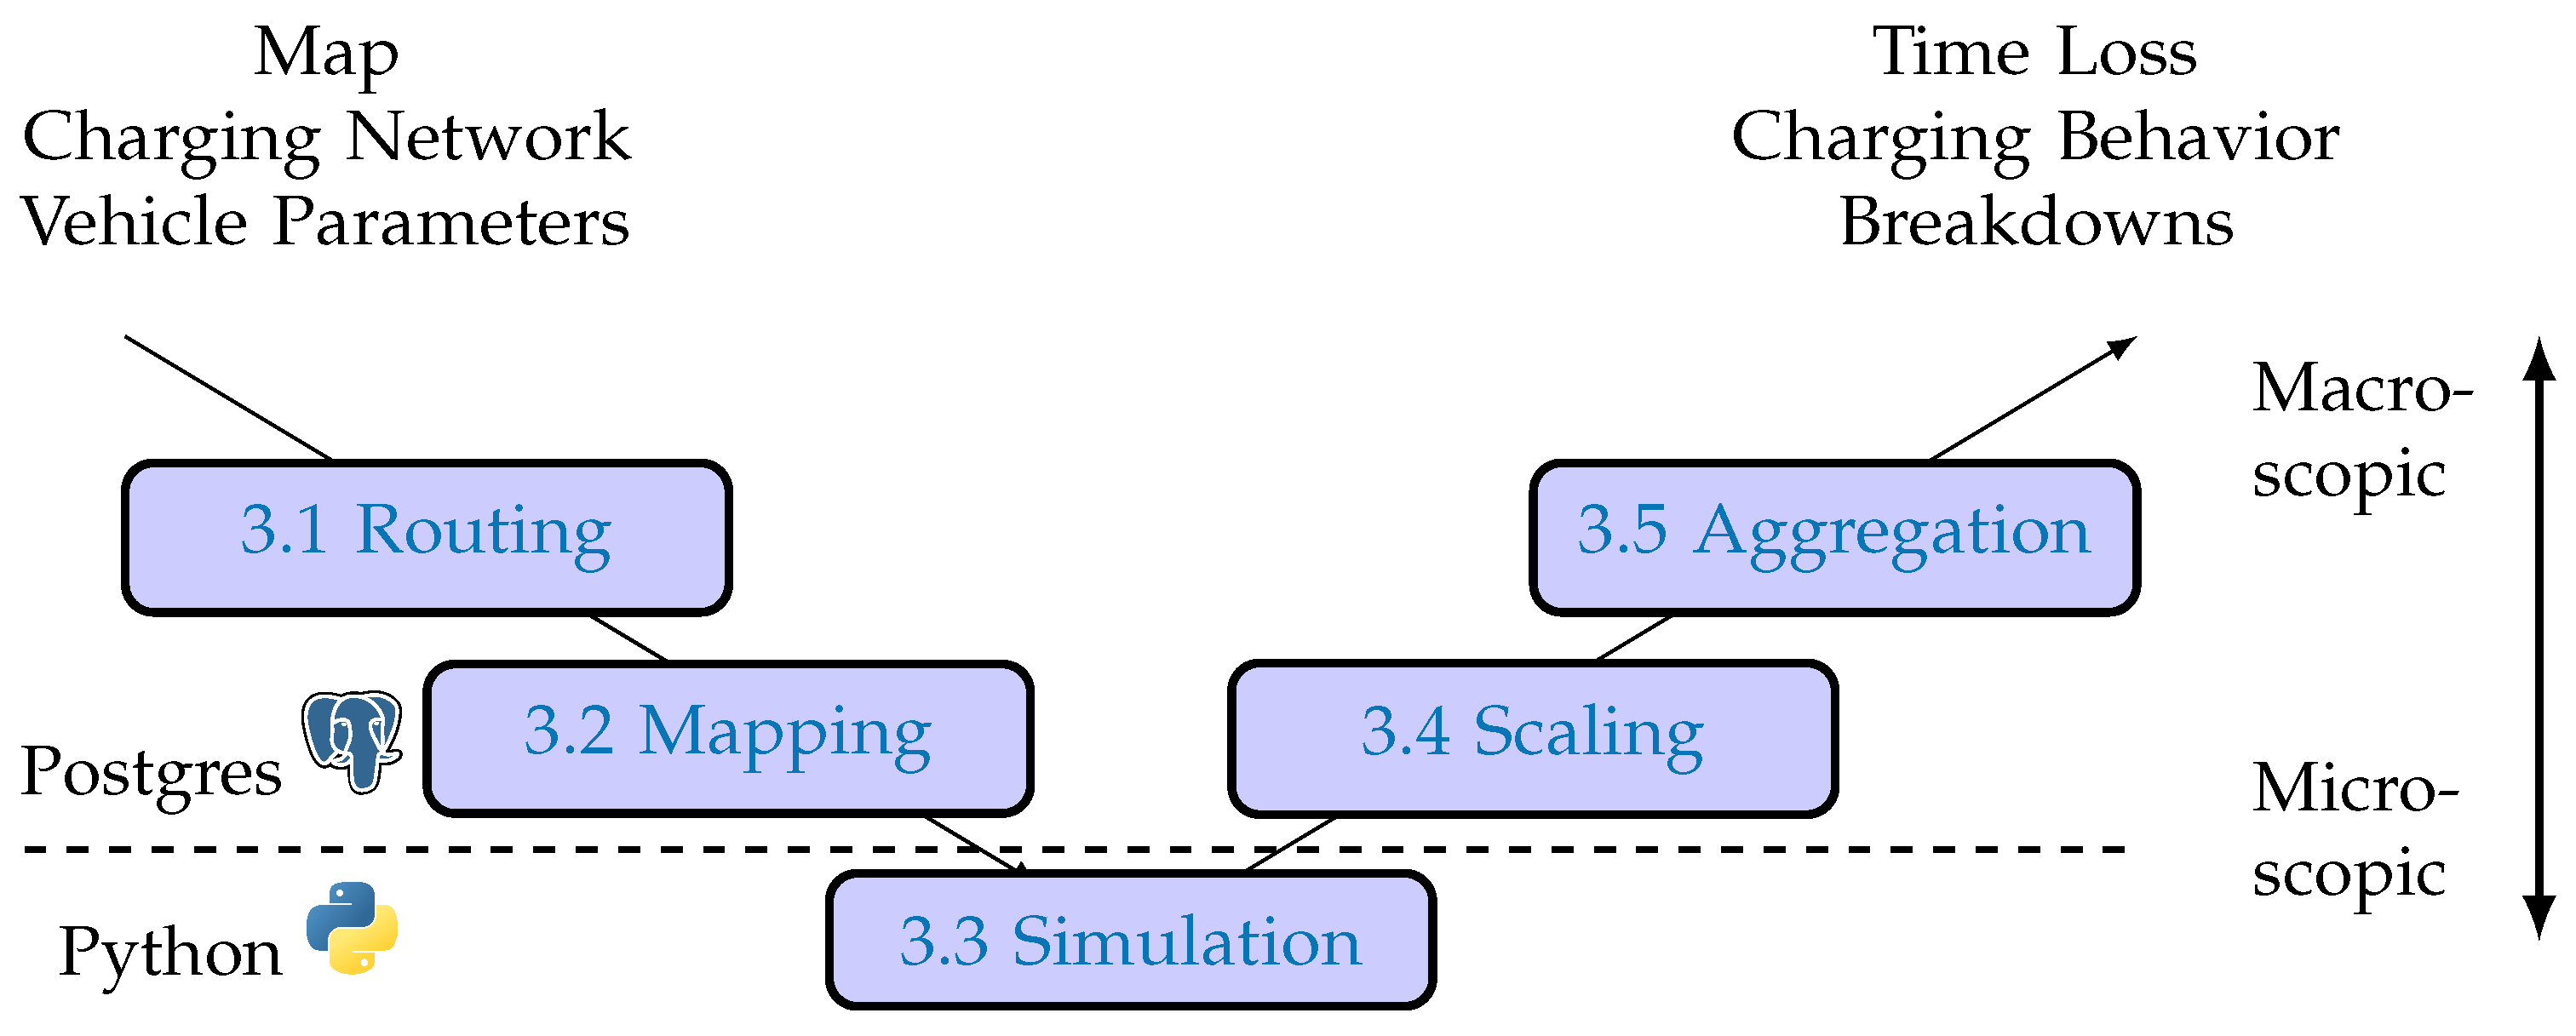
3. Methodology
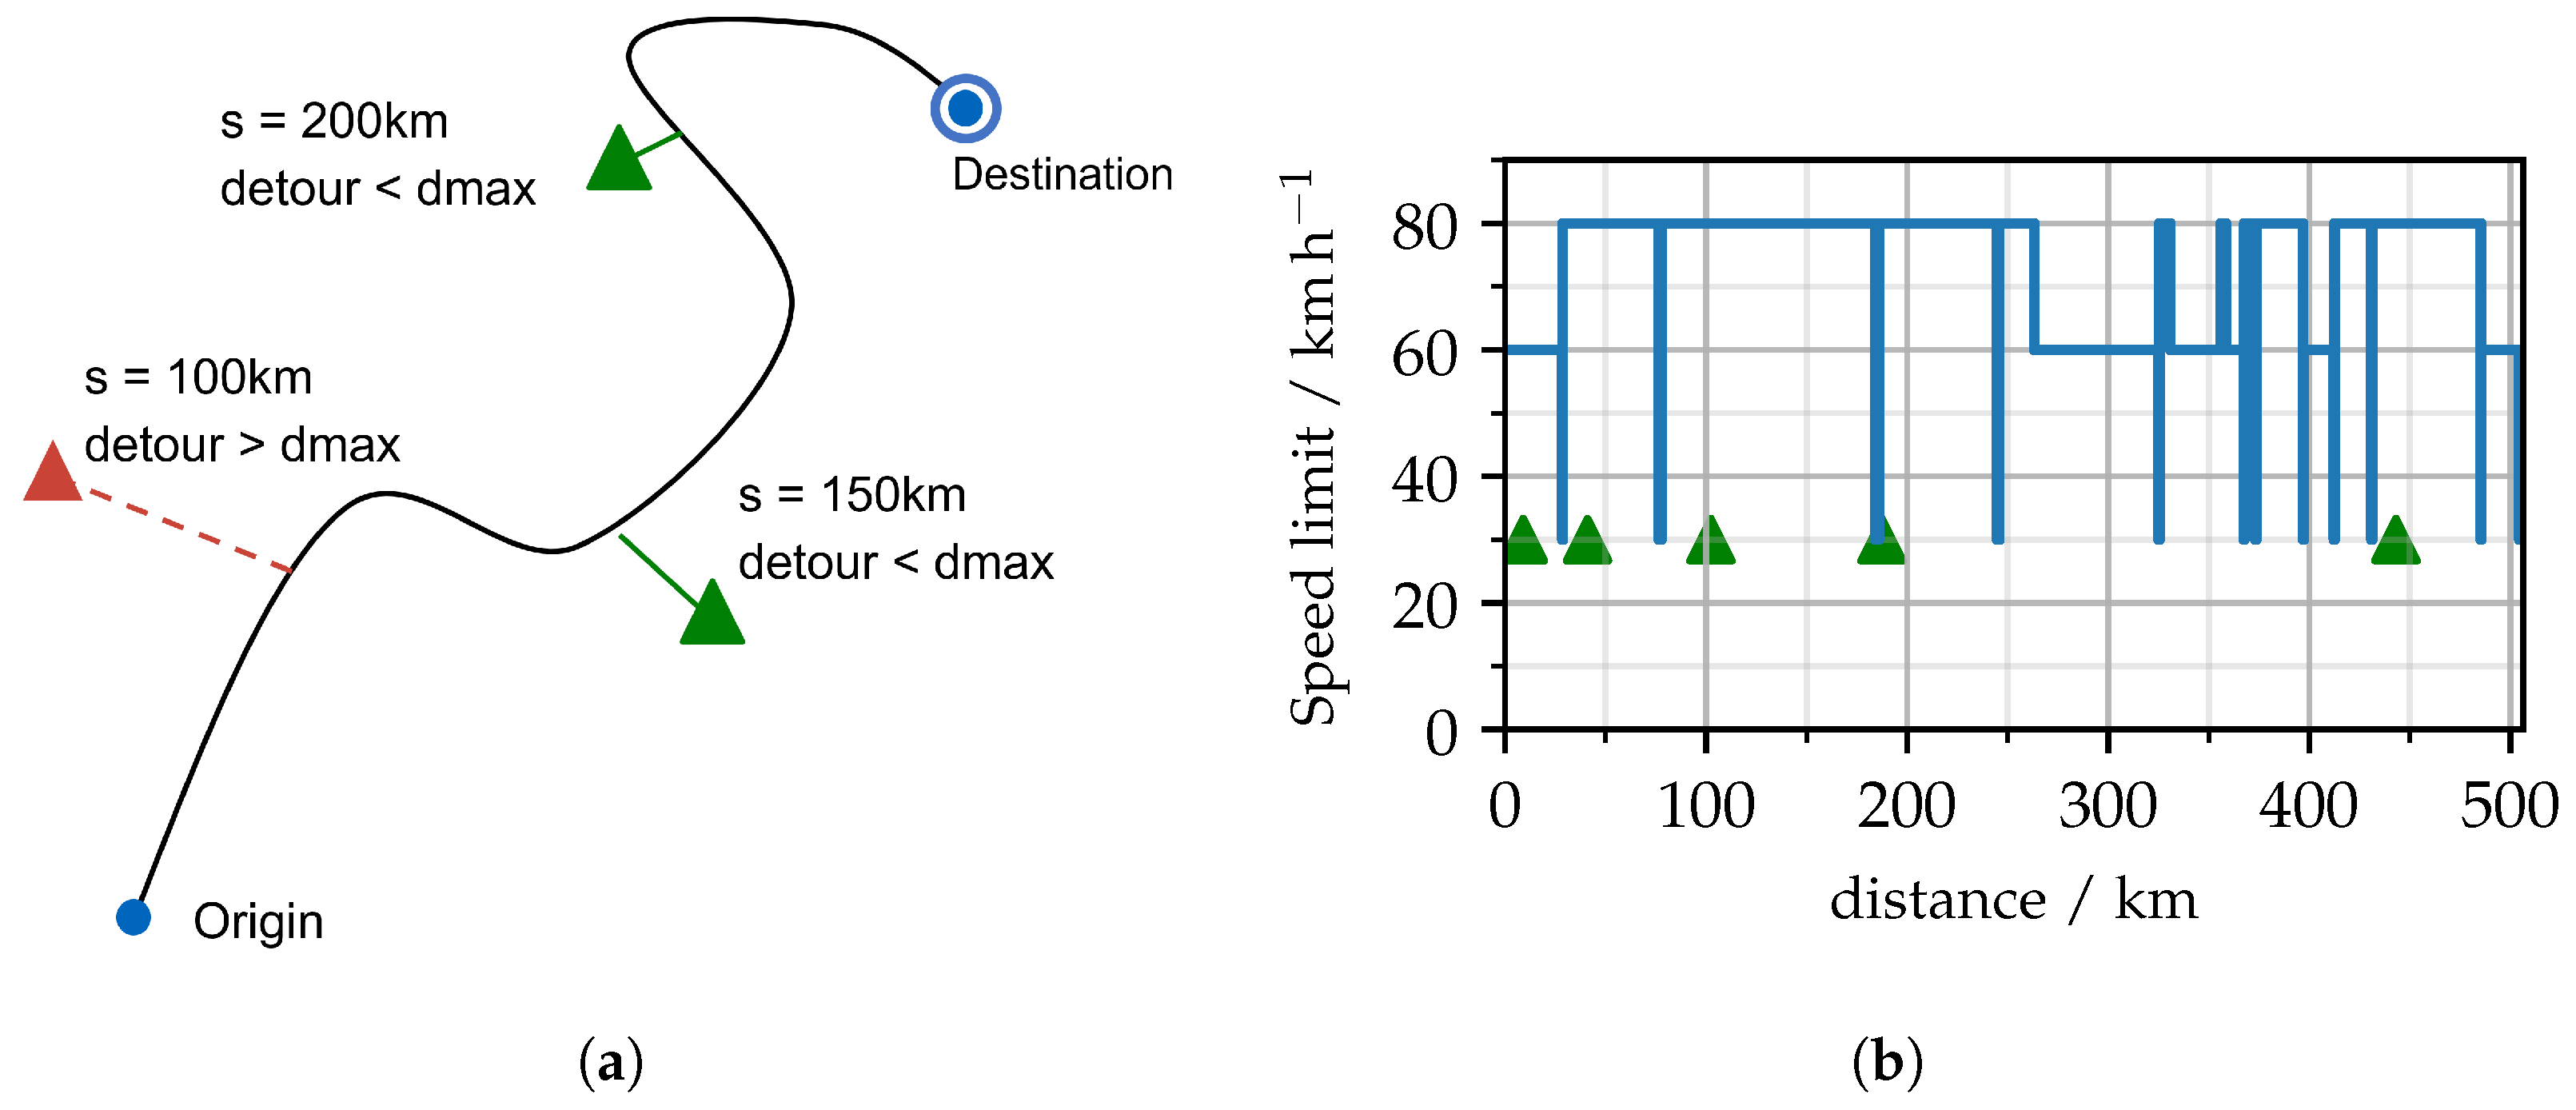
3.1. Routing
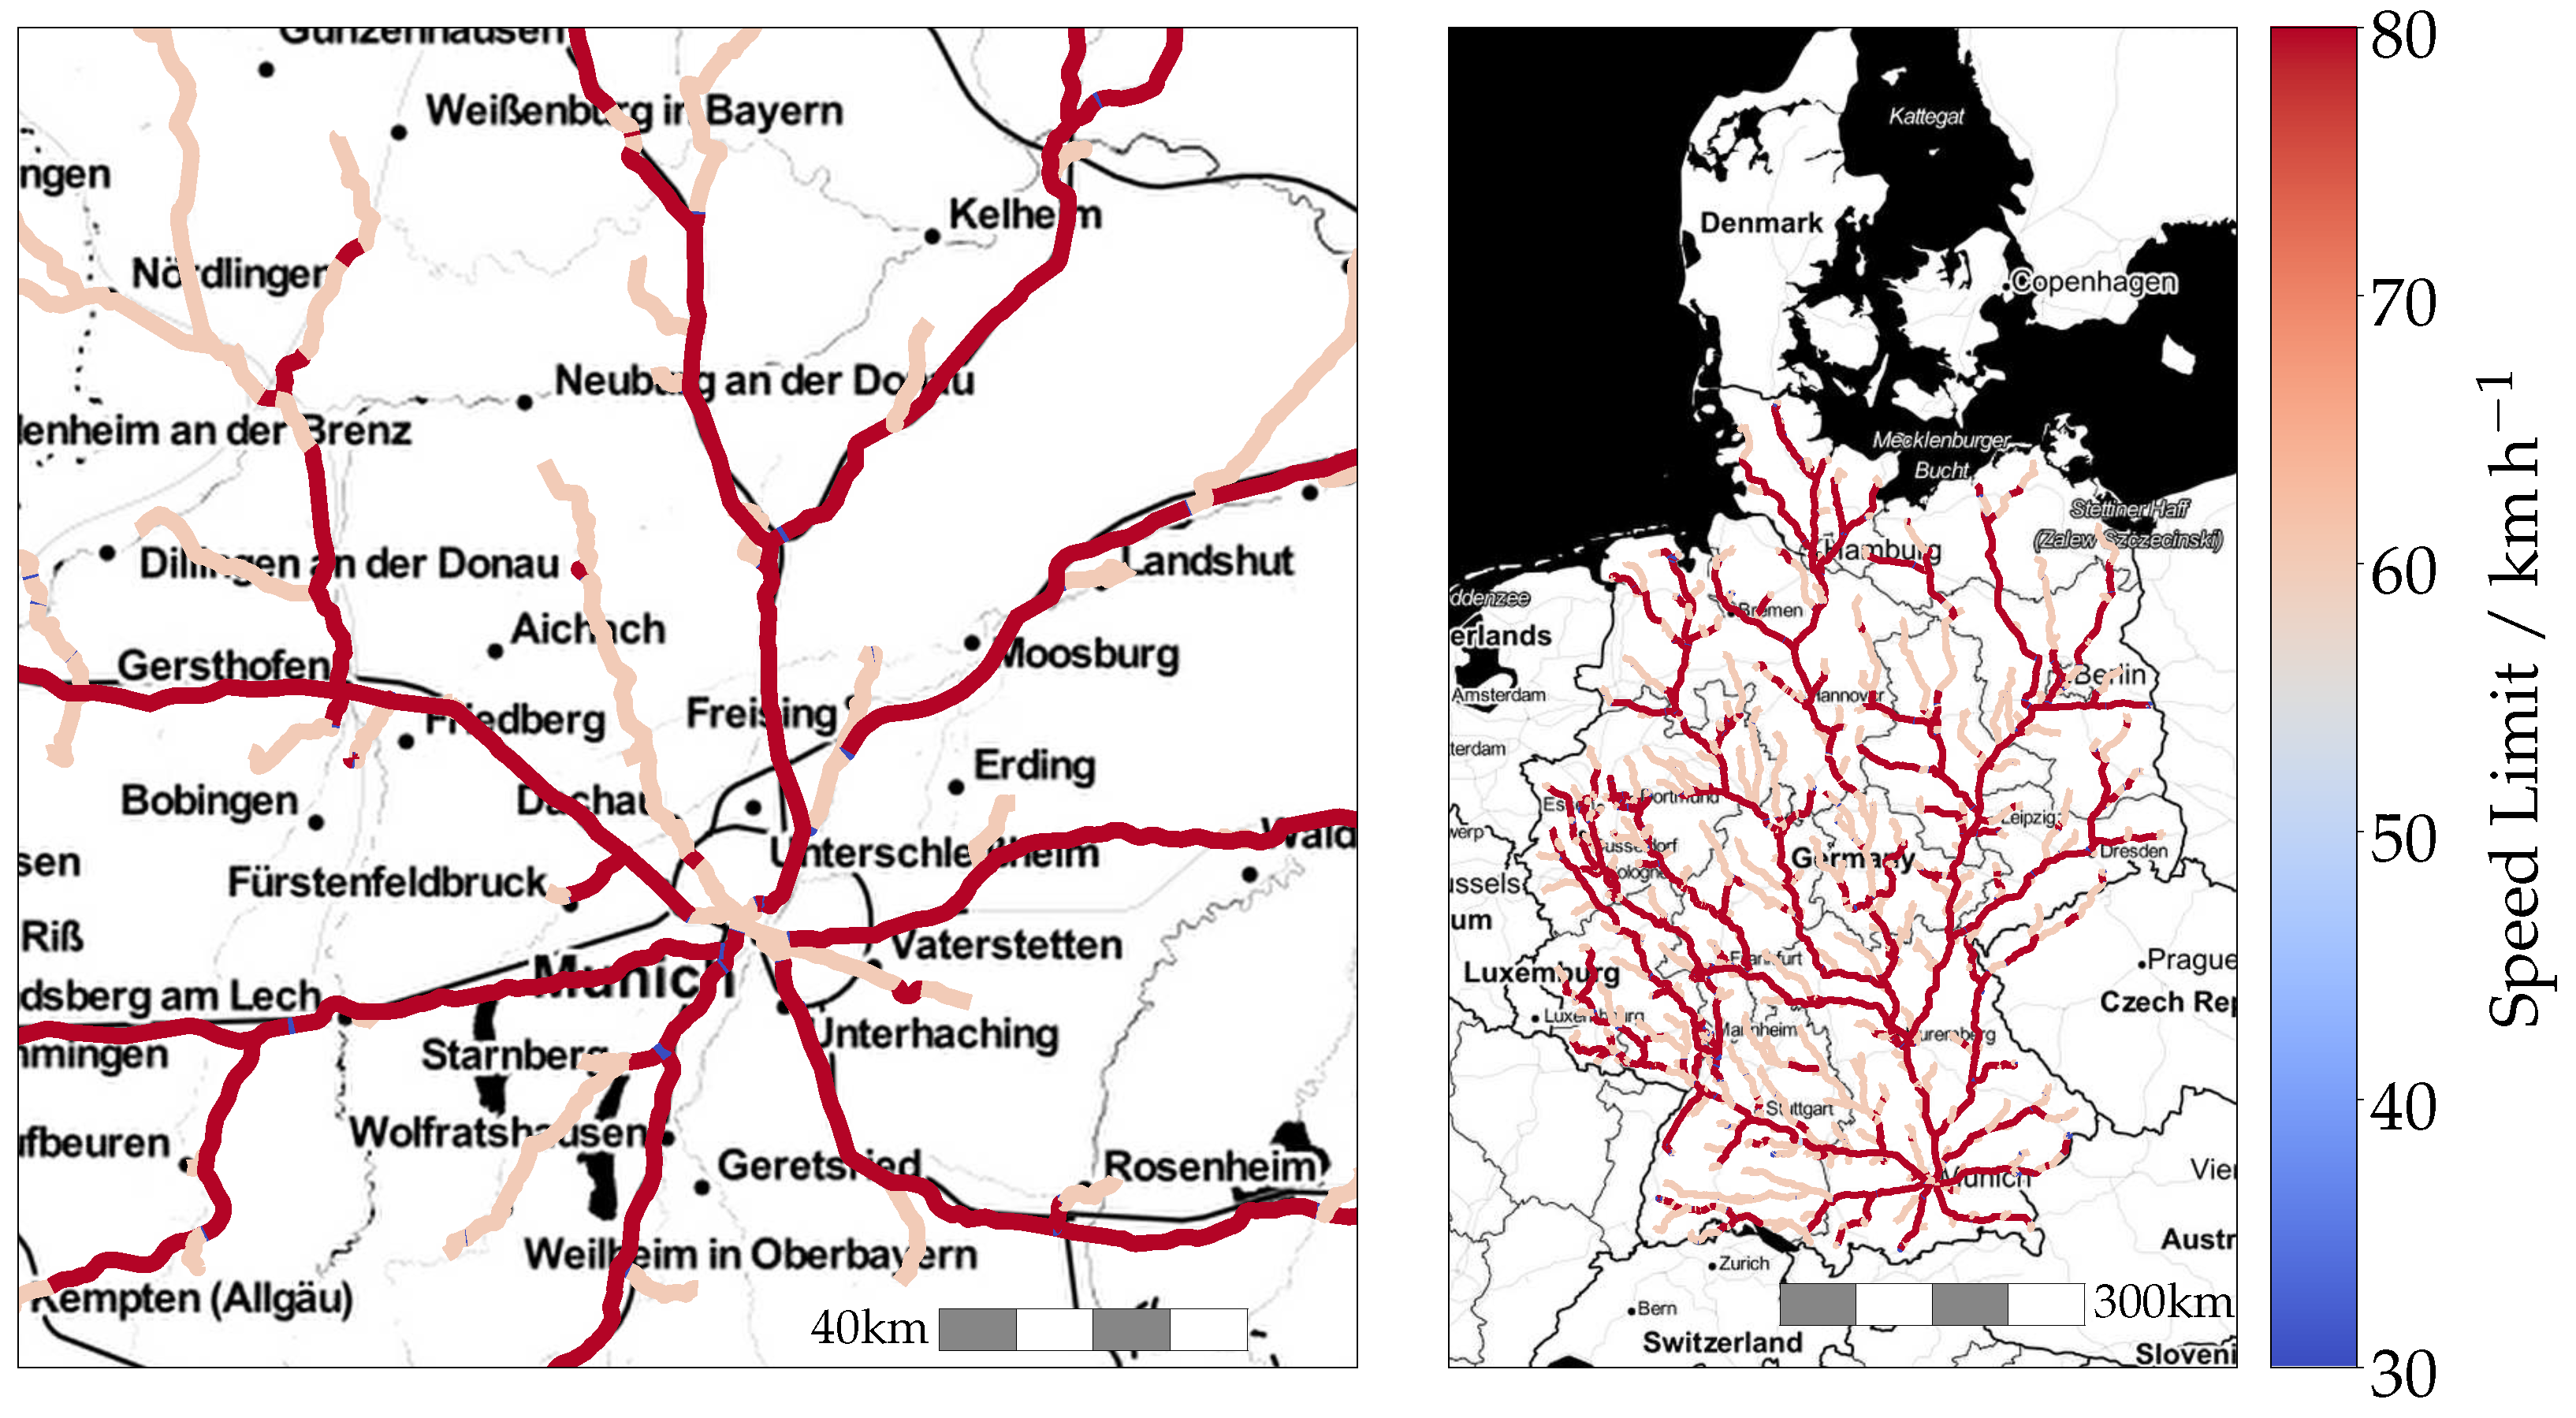
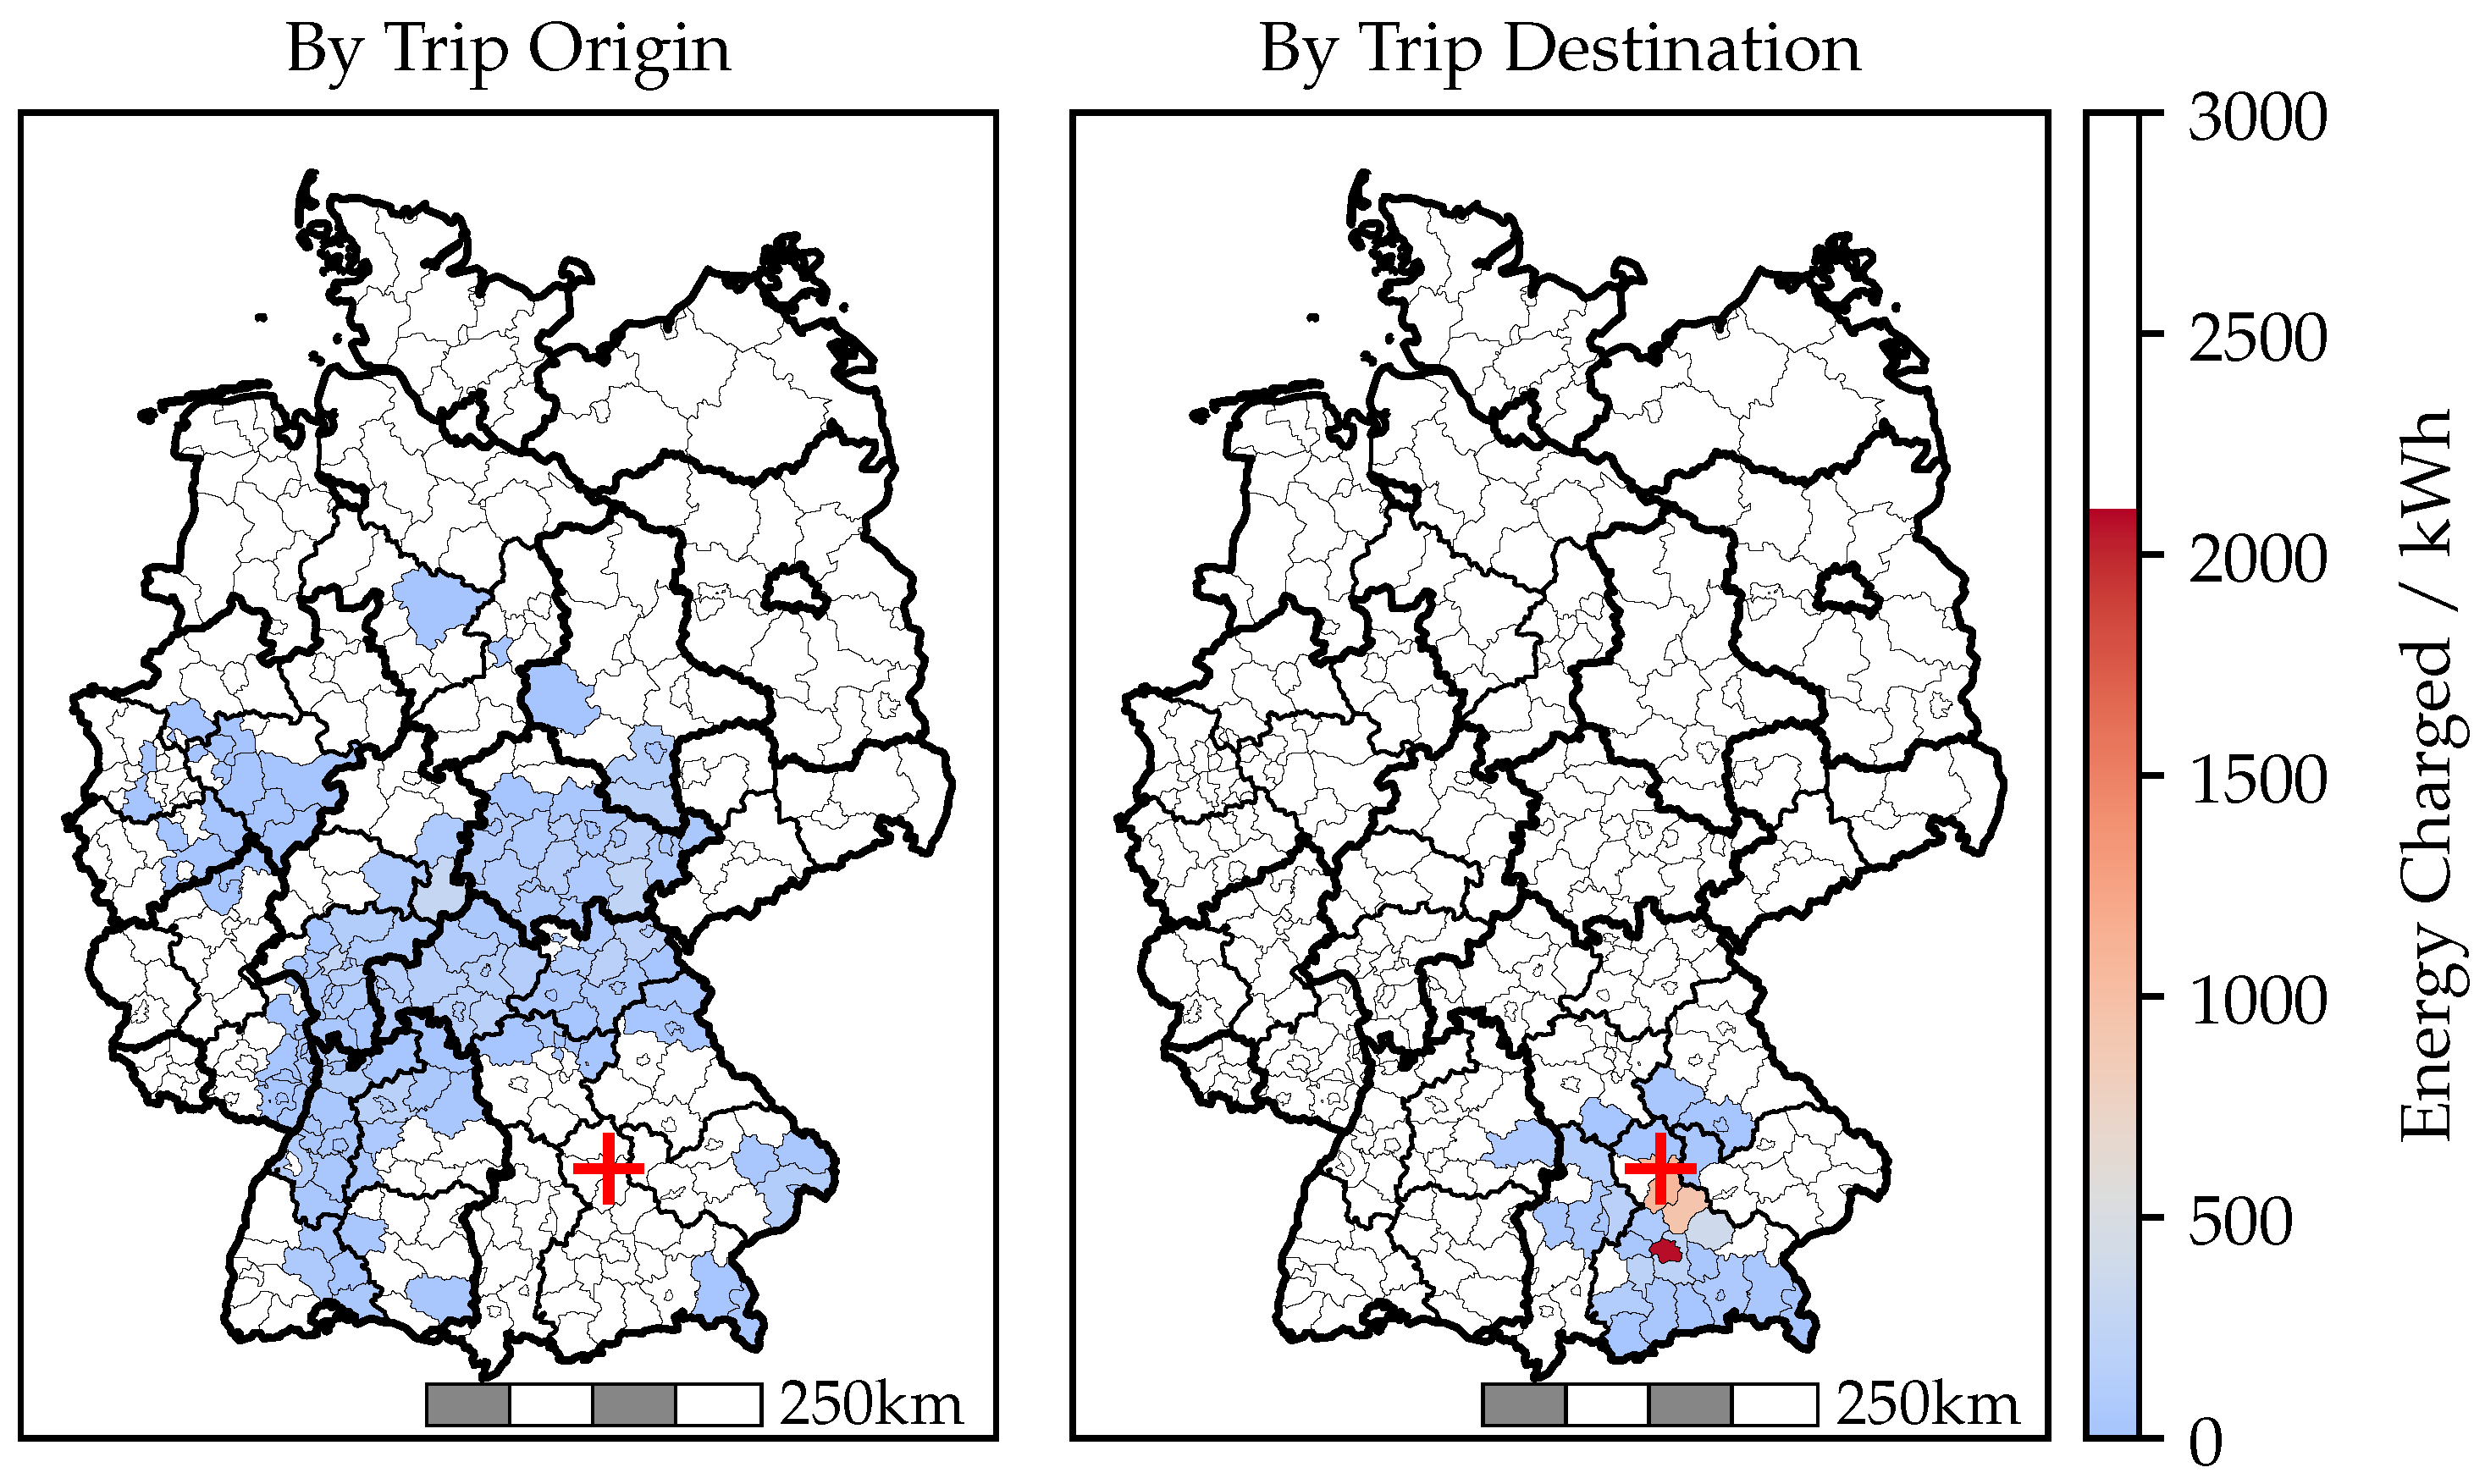
3.2. Mapping
3.3. Simulation
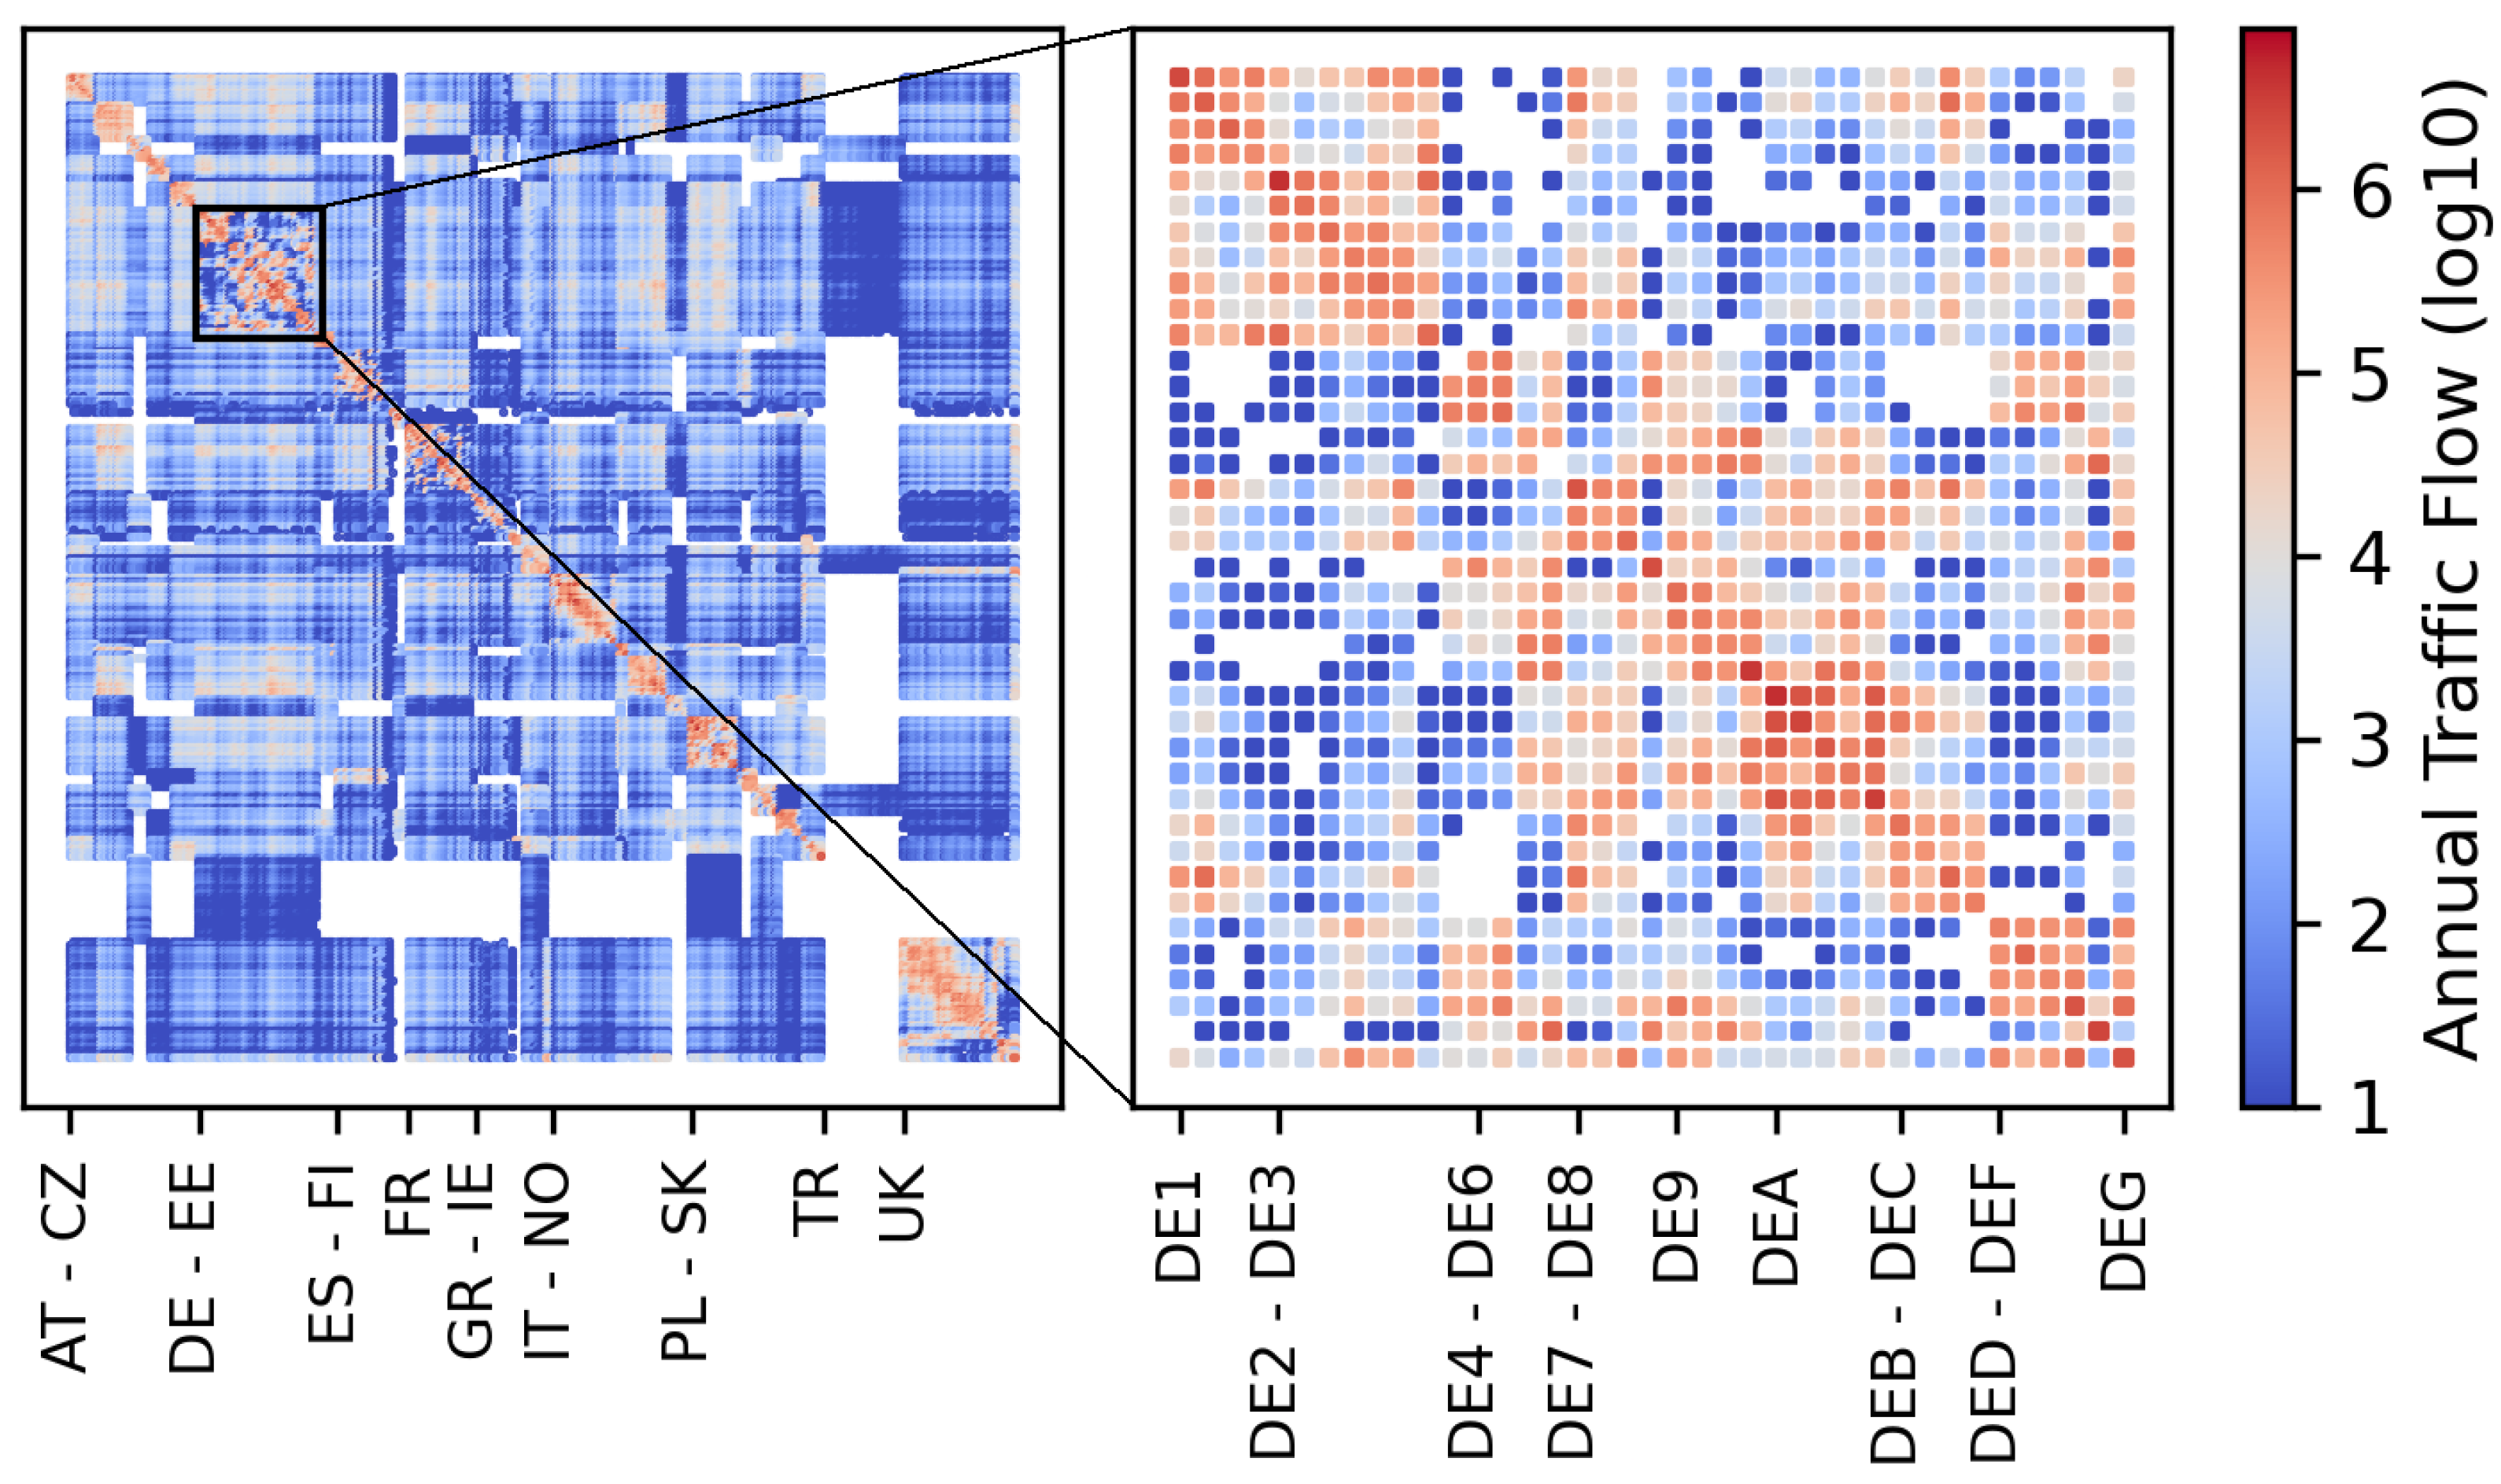
3.4. Scaling
3.5. Aggregation
4. Results
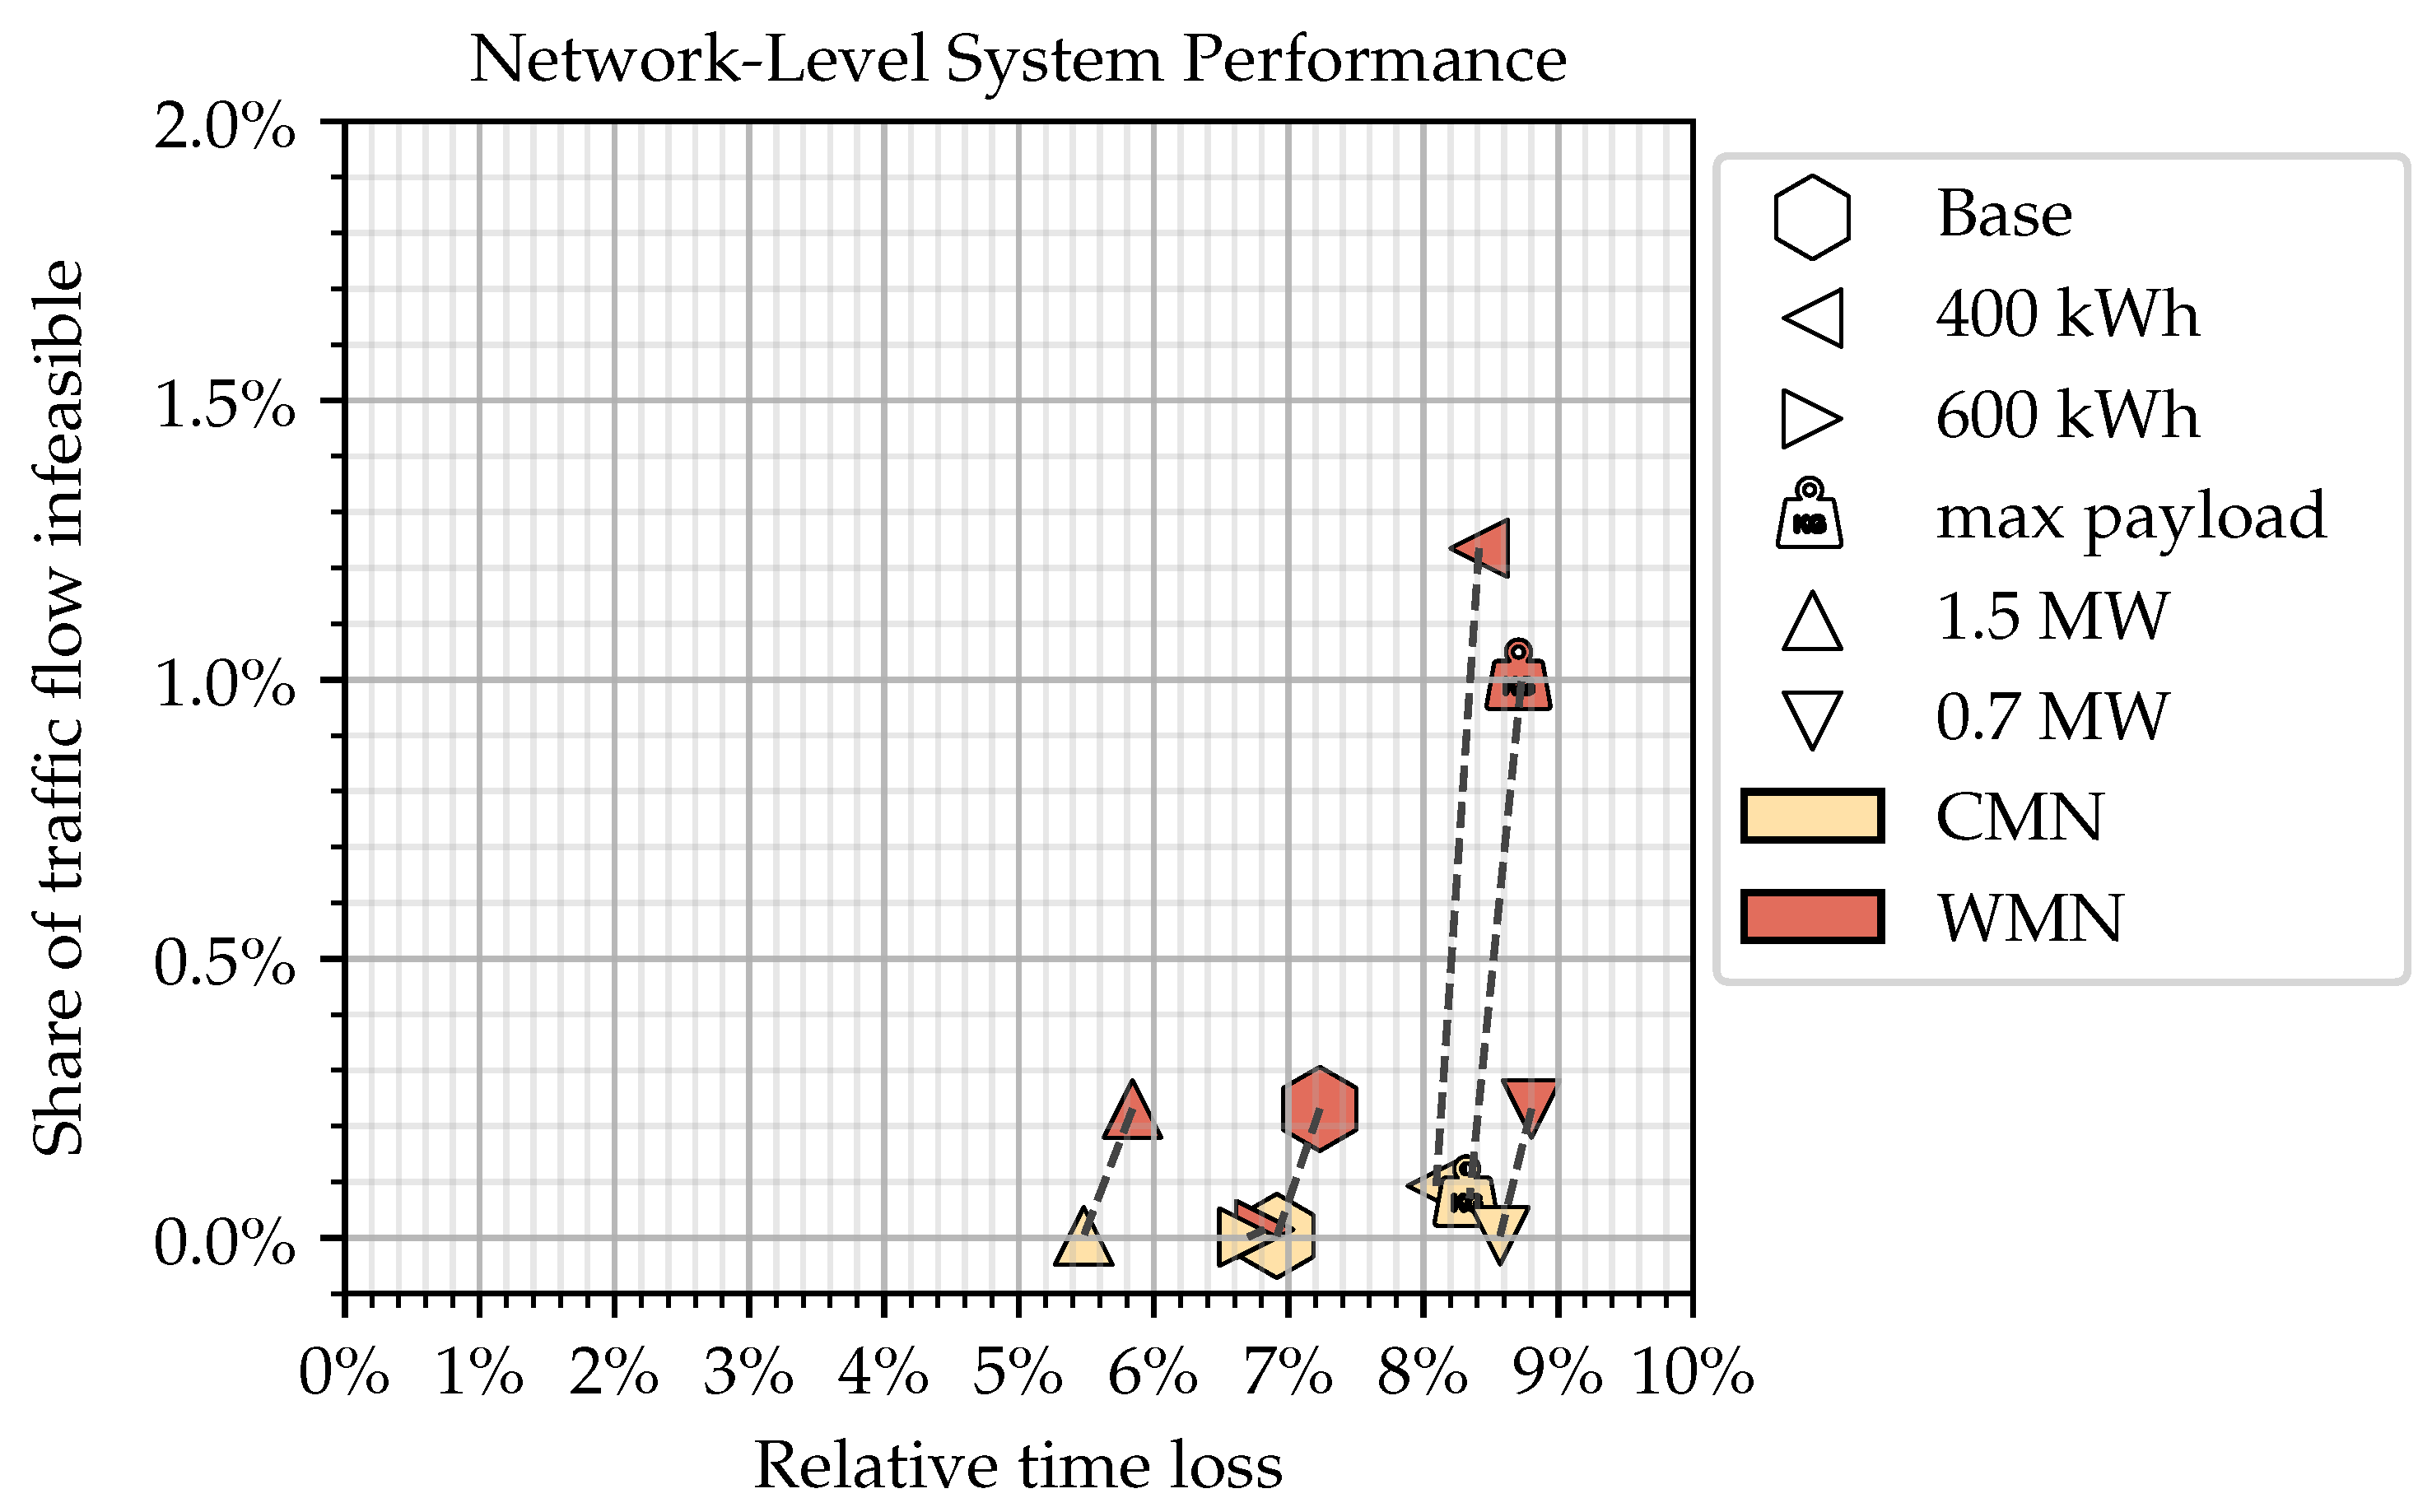
4.1. Network Performance
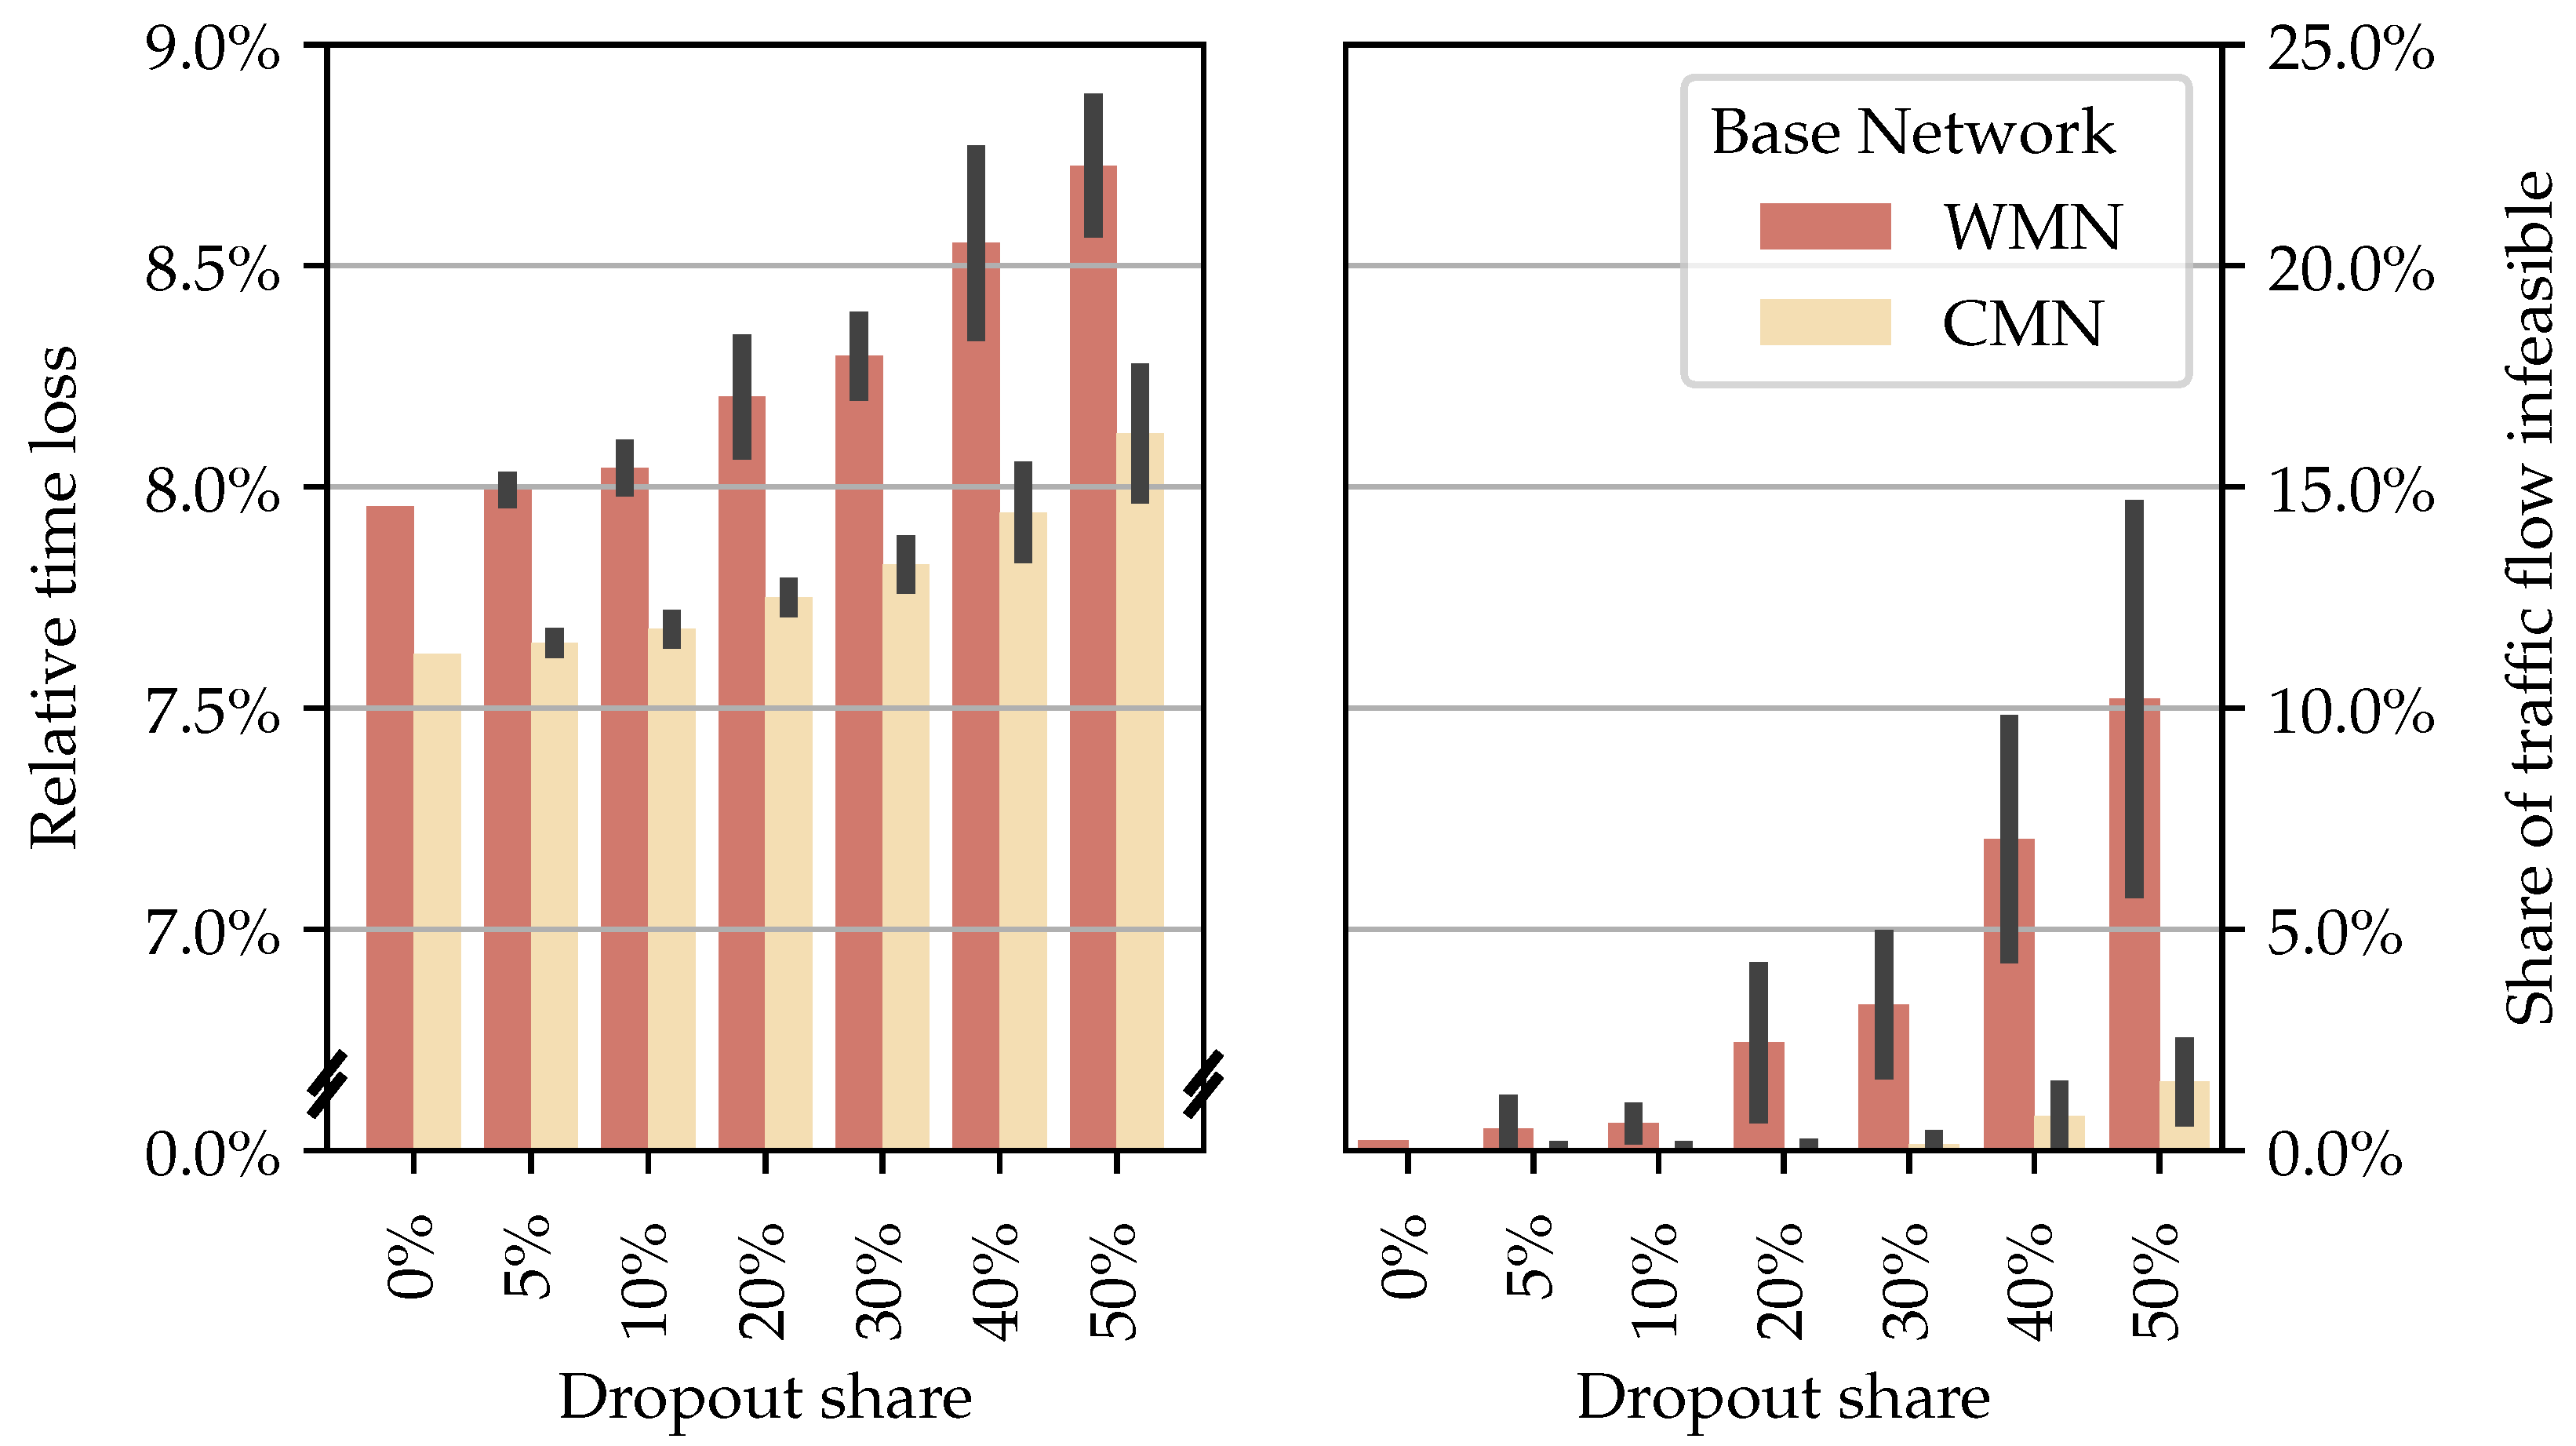
4.2. Network Resilience
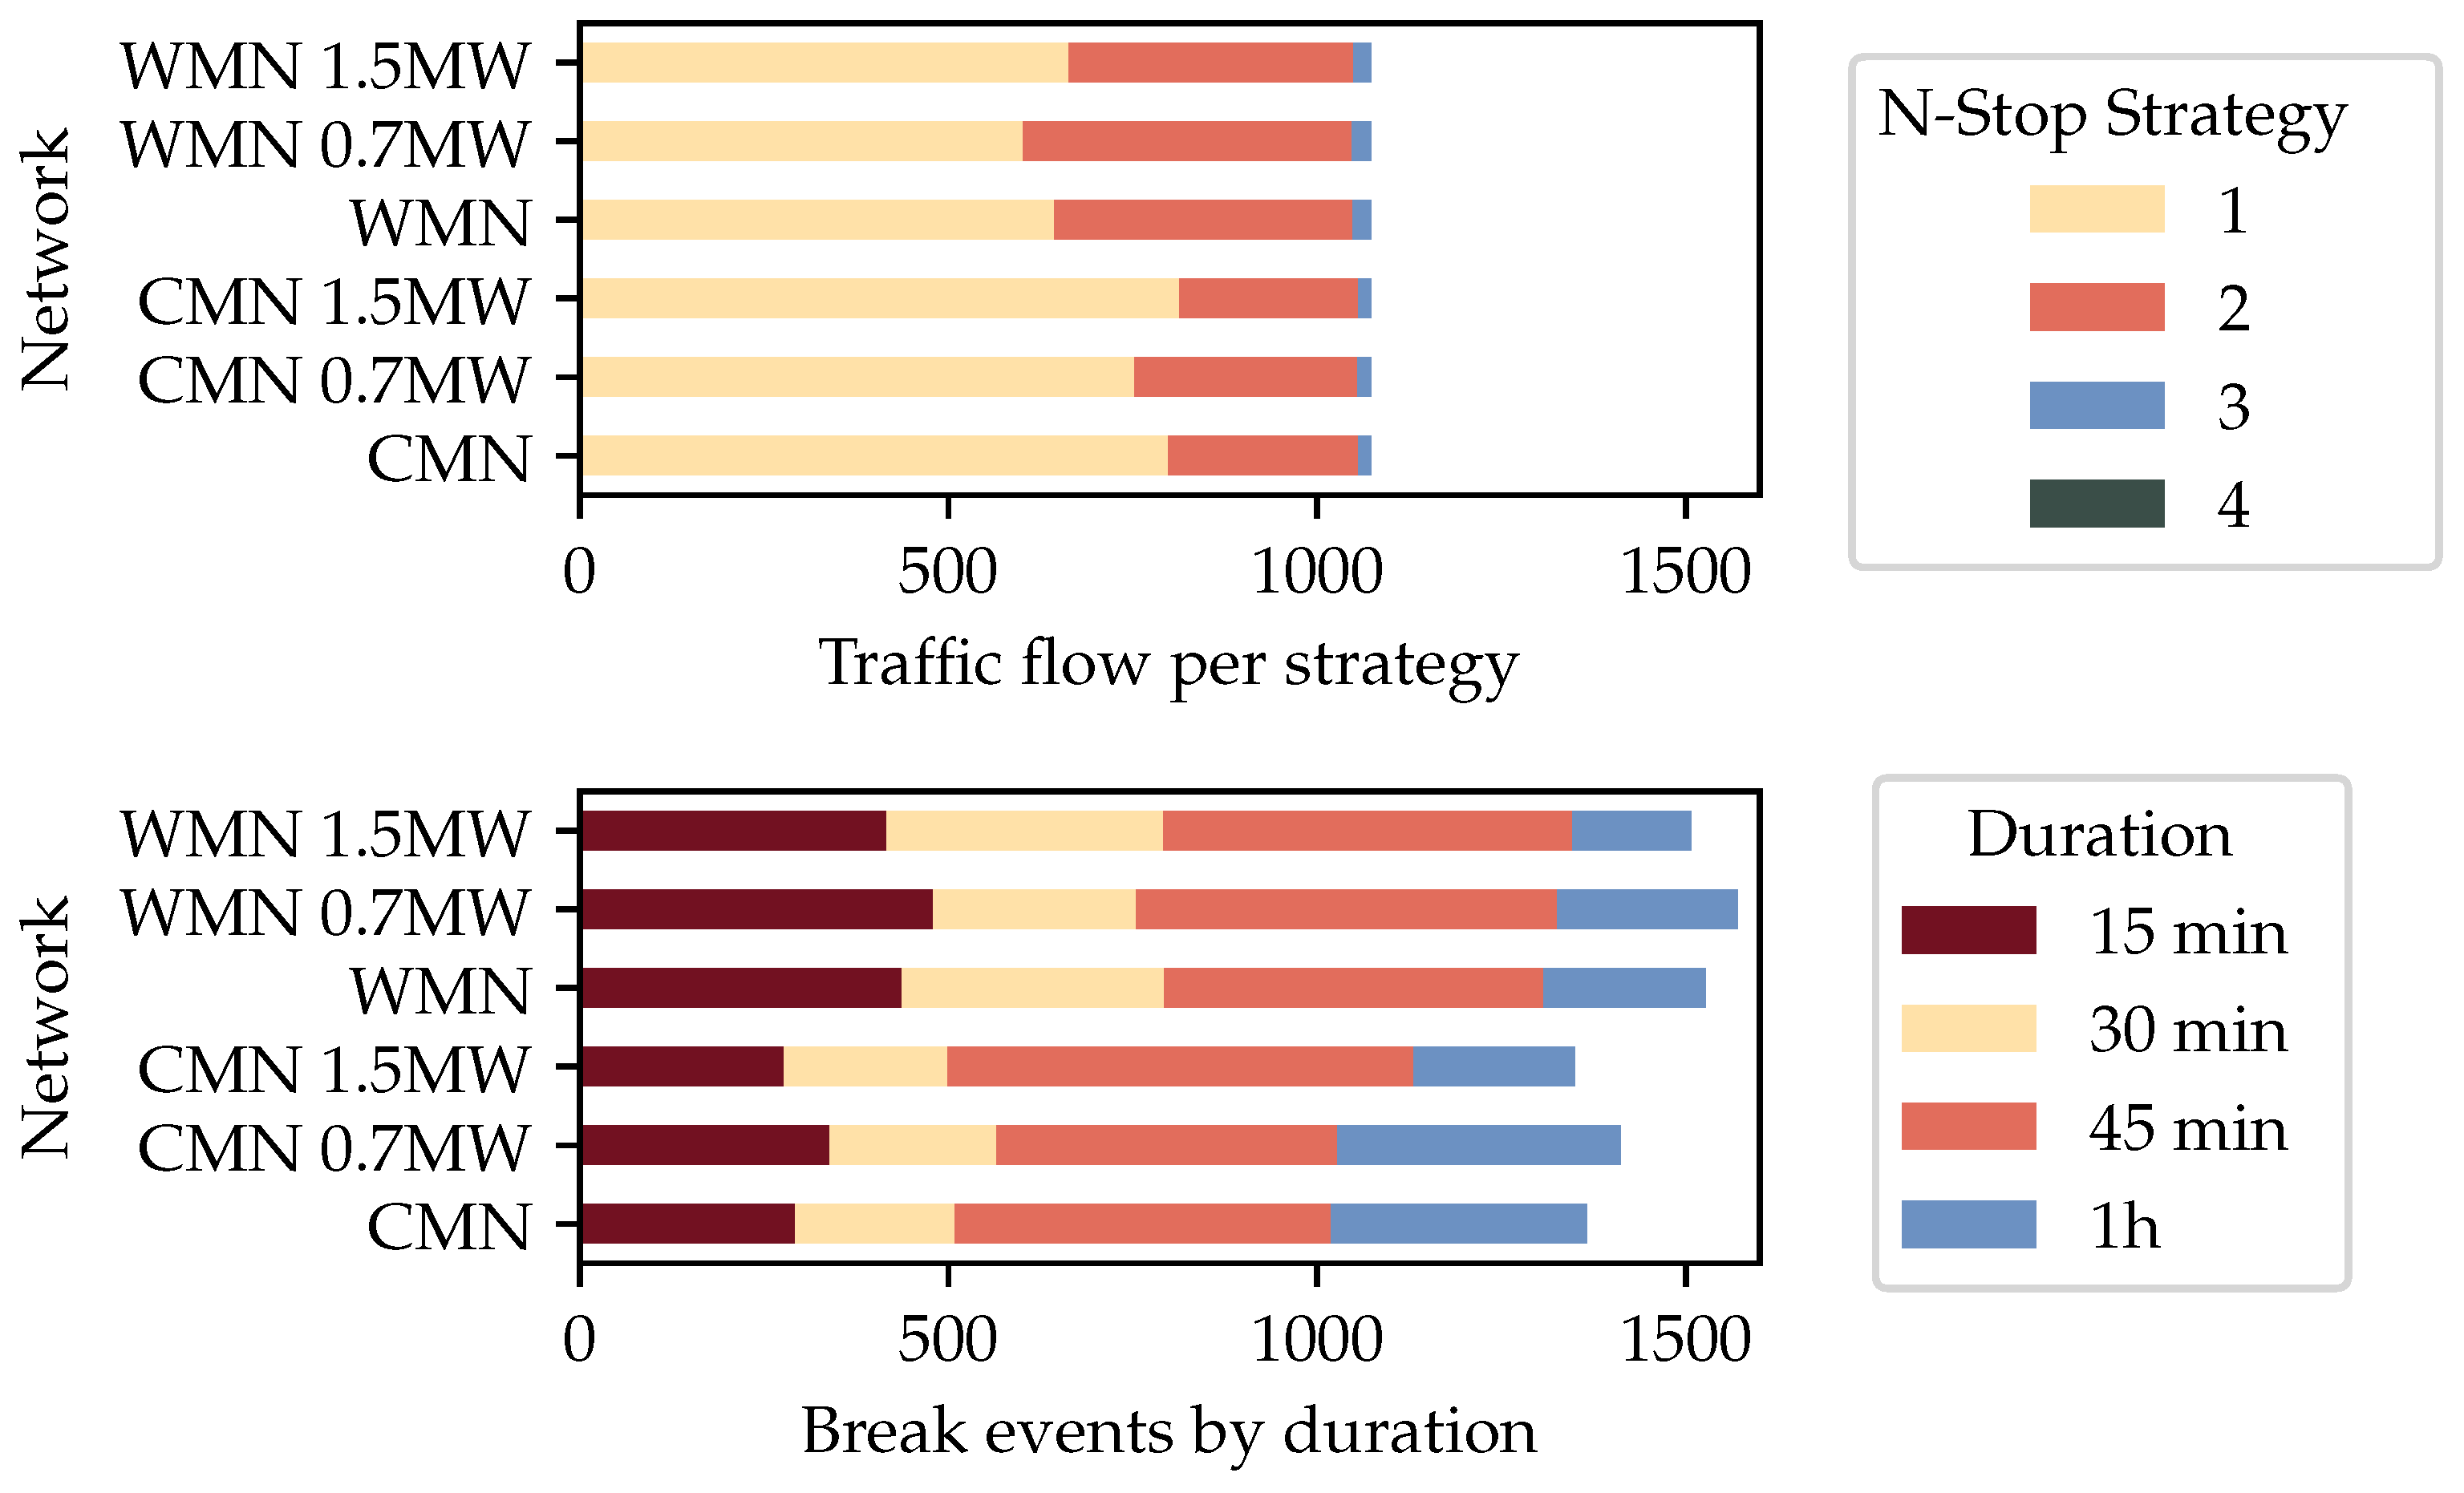
4.3. Strategy
5. Discussion
6. Conclusions
Author Contributions
Funding
Data Availability Statement
Conflicts of Interest
Abbreviations
| AFIR | Alternative Fuel Infrastructure Regulation |
| BET | Battery Electric Truck |
| BETOS | Battery Electric Truck Operational Strategy |
| CMN | Close-meshed Network |
| CP | Charging points |
| GIS | Geographic Information Systems |
| MCS | Megawatt Charging System |
| NUTS | Nomenclature of Territorial Units for Statistics |
| OSM | Open Street Maps |
| POI | Points of Interest |
| SOC | State of Charge |
| TEN-T | Trans-European Transport Network |
| WMN | Wide-meshed Network |
Appendix A. Details of the Presented Model
Appendix A.1. Charging Network


Appendix A.2. Highway Network

| Values of “Highway” Key | Max Speed | Specific Edge Cost in h km |
|---|---|---|
| motorway, trunk | 80 km h−1 | |
| primary, secondary, tertiary | 60 km h−1 | |
| motorway_link, trunk_link, primary_link, secondary_link, tertiary_link motorway_junction | 30 km h−1 | |
| road | 50 km h−1 |
Appendix A.3. Simulation Parameters
| Parameter | Values |
|---|---|
| Base network | WMN * CMN * |
| Battery capacity | 400 500 * 600 |
| Charging power (max.) | 700 1000 * 1500 |
| SOC at start/end | 100%/50% 100%/15% 50%/50% * |
| Payload | * 24 |
| Outage | Random 50% Random 40% Random 30% Random 20% Random 10% Random 5% 0% * |
References
- Razmjoo, A.; Ghazanfari, A.; Jahangiri, M.; Franklin, E.; Denai, M.; Marzband, M.; Astiaso Garcia, D.; Maheri, A. A Comprehensive Study on the Expansion of Electric Vehicles in Europe. Appl. Sci. 2022, 12, 11656. [Google Scholar] [CrossRef]
- European Automobile Manufacturers’ Association (ACEA). New Medium and Heavy Commercial Vehicle Registrations by Fuel Type, European Union. Available online: https://www.acea.auto/files/ACEA_Trucks_by_fuel_type_full-year-2022.pdf (accessed on 8 March 2023).
- Wolff, S.P. Eco-Efficiency Assessment of Zero-Emission Heavy-Duty Vehicle Concepts. Ph.D. Thesis, Technische Universität München, Munich, Germany, 2023. [Google Scholar]
- Daimler Truck AG. Der Man Etgx Elektrifiziert Den Fernverkehr. Available online: https://www.man.eu/de/de/lkw/alle-modelle/der-man-tgx/der-man-etgx/uebersicht.html (accessed on 27 November 2023).
- MAN Truck & Bus SE. Der neue eActros|600 Charged to Change. Available online: https://eactros600.mercedes-benz-trucks.com/de/de/eactros-600/showroom.html (accessed on 27 November 2023).
- Sugihara, C.; Hardman, S.; Kurani, K. Social, technological, and economic barriers to heavy-duty truck electrification. Res. Transp. Bus. Manag. 2023, 51, 101064. [Google Scholar] [CrossRef]
- Aral Aktiengesellschaft. Dekarbonisierung des Schwerlastverkehrs: Aral Eröffnet Europas Ersten Ladekorridor für Elektrische Lkw. Available online: https://www.aral.de/de/global/retail/presse/pressemeldungen/pm-2023-aral-eroeffnet-europas-ersten-ladekorridor-fuer-elektrische-lkw.html (accessed on 27 November 2023).
- Commercial Vehicle Charging Europe B.V. Milence and Port of Antwerp-Bruges Reach an Agreement to Develop a 30-Bay Charging Hub for Heavy-Duty Vehicles. Available online: https://milence.com/press-release/milence-and-port-of-antwerp-bruges-reach-an-agreement-to-develop-a-30-bay-charging-hub-for-heavy-duty-vehicles/ (accessed on 22 November 2023).
- Council of the EU and the European Council. Fit for 55: Towards More Sustainable Transport—Consilium. Available online: https://www.consilium.europa.eu/en/infographics/fit-for-55-afir-alternative-fuels-infrastructure-regulation/ (accessed on 14 August 2023).
- NOW GmbH—National Centre for Charging Infrastructure. Einfach Laden an Rastanlagen | Auslegung des Netzanschlusses für E-Lkw-Lade-Hubs. Available online: https://nationale-leitstelle.de/wp-content/uploads/2022/09/Leitstelle_LKW-Netzstudie.pdf (accessed on 27 November 2023).
- Zähringer, M.; Wolff, S.; Schneider, J.; Balke, G.; Lienkamp, M. Time vs. Capacity—The Potential of Optimal Charging Stop Strategies for Battery Electric Trucks. Energies 2022, 15, 7137. [Google Scholar] [CrossRef]
- PostGIS Project Steering Committee and Others: PostGIS, Spatial and Geographic Objects for postgreSQL. Software Version 3.3.2. Available online: https://postgis.net (accessed on 7 April 2023).
- pgRouting Project—Open Source Routing Library. Software Version 3.5.0. Available online: https://pgrouting.org/ (accessed on 14 August 2023).
- Deb, S.; Tammi, K.; Kalita, K.; Mahanta, P. Review of recent trends in charging infrastructure planning for electric vehicles. WIREs Energy Environ. 2018, 7, e306. [Google Scholar] [CrossRef]
- Metais, M.; Jouini, O.; Perez, Y.; Berrada, J.; Suomalainen, E. Too much or not enough? Planning electric vehicle charging infrastructure: A review of modeling options. Renew. Sustain. Energy Rev. 2022, 153, 111719. [Google Scholar] [CrossRef]
- Al-Hanahi, B.; Ahmad, I.; Habibi, D.; Masoum, M.A.S. Charging Infrastructure for Commercial Electric Vehicles: Challenges and Future Works. IEEE Access 2021, 9, 121476–121492. [Google Scholar] [CrossRef]
- Hecht, C.; Victor, K.; Zurmühlen, S.; Sauer, D.U. Electric vehicle route planning using real-world charging infrastructure in Germany. eTransportation 2021, 10, 100143. [Google Scholar] [CrossRef]
- Speth, D.; Sauter, V.; Plötz, P. Where to Charge Electric Trucks in Europe—Modelling a Charging Infrastructure Network. World Electr. Veh. J. 2022, 13, 162. [Google Scholar] [CrossRef]
- Speth, D.; Plötz, P.; Funke, S.; Vallarella, E. Public fast charging infrastructure for battery electric trucks—A model-based network for Germany. Environ. Res. Infrastruct. Sustain. 2022, 2, 025004. [Google Scholar] [CrossRef]
- Borlaug, B.; Moniot, M.; Birky, A.; Alexander, M.; Muratori, M. Charging needs for electric semi-trailer trucks. Renew. Sustain. Energy Transit. 2022, 2, 100038. [Google Scholar] [CrossRef]
- Shoman, W.; Yeh, S.; Sprei, F.; Plötz, P.; Speth, D. Battery electric long-haul trucks in Europe: Public charging, energy, and power requirements. Transp. Res. Part D Transp. Environ. 2023, 121, 103825. [Google Scholar] [CrossRef]
- Hurtado-Beltran, A.; Rilett, L.R.; Nam, Y. Driving Coverage of Charging Stations for Battery Electric Trucks Located at Truck Stop Facilities. Transp. Res. Rec. 2021, 2675, 850–866. [Google Scholar] [CrossRef]
- Danese, A.; Garau, M.; Sumper, A.; Torsæter, B.N. Electrical Infrastructure Design Methodology of Dynamic and Static Charging for Heavy and Light Duty Electric Vehicles. Energies 2021, 14, 3362. [Google Scholar] [CrossRef]
- Çabukoglu, E.; Georges, G.; Küng, L.; Pareschi, G.; Boulouchos, K. Battery electric propulsion: An option for heavy-duty vehicles? Results from a Swiss case-study. Transp. Res. Part Emerg. Technol. 2018, 88, 107–123. [Google Scholar] [CrossRef]
- Speth, D.; Sauter, V.; Plötz, P.; Signer, T. Synthetic European road freight transport flow data. Data Brief 2022, 40, 107786. [Google Scholar] [CrossRef] [PubMed]
- Menter, J.; Fay, T.A.; Grahle, A.; Göhlich, D. Long-Distance Electric Truck Traffic: Analysis, Modeling and Designing a Demand-Oriented Charging Network for Germany. World Electr. Veh. J. 2023, 14, 205. [Google Scholar] [CrossRef]
- Schneider, J.; Teichert, O.; Zähringer, M.; Balke, G.; Lienkamp, M. The novel Megawatt Charging System standard: Impact on battery size and cell requirements for battery-electric long-haul trucks. eTransportation 2023, 17, 100253. [Google Scholar] [CrossRef]
- Balke, G.; Adenaw, L. Heavy commercial vehicles’ mobility: Dataset of trucks’ anonymized recorded driving and operation (DT-CARGO). Data Brief 2023, 48, 109246. [Google Scholar] [CrossRef] [PubMed]
- Asamer, J.; Reinthaler, M.; Ruthmair, M.; Straub, M.; Puchinger, J. Optimizing charging station locations for urban taxi providers. Transp. Res. Part D Policy Pract. 2016, 85, 233–246. [Google Scholar] [CrossRef]
- Moeller, C. Osm2po-OpenStreetMap Converter and Routing Engine for Java. Software Version 5.5.6. Pinneberg, Germany. Available online: https://osm2po.de/ (accessed on 14 August 2023).
- Zähringer, M.; Wolff, S.; Schneider, J.; Balke, G.; Lienkamp, M. Essential for battery electric long-haul trucks: An optimal dynamic charging strategy. eTransportation 2024. under review. [Google Scholar]
- Bundesanstalt für Straßenwesen BaSt. Automatische Dauerzählstellen auf Autobahnen und Bundesstraßen. Available online: https://www.bast.de/DE/Verkehrstechnik/Fachthemen/v2-verkehrszaehlung/Verkehrszaehlung.html (accessed on 2 November 2023).


Disclaimer/Publisher’s Note: The statements, opinions and data contained in all publications are solely those of the individual author(s) and contributor(s) and not of MDPI and/or the editor(s). MDPI and/or the editor(s) disclaim responsibility for any injury to people or property resulting from any ideas, methods, instructions or products referred to in the content. |
© 2024 by the authors. Licensee MDPI, Basel, Switzerland. This article is an open access article distributed under the terms and conditions of the Creative Commons Attribution (CC BY) license (https://creativecommons.org/licenses/by/4.0/).
Share and Cite
Balke, G.; Zähringer, M.; Schneider, J.; Lienkamp, M. Connecting the Dots: A Comprehensive Modeling and Evaluation Approach to Assess the Performance and Robustness of Charging Networks for Battery Electric Trucks and Its Application to Germany. World Electr. Veh. J. 2024, 15, 32. https://doi.org/10.3390/wevj15010032
Balke G, Zähringer M, Schneider J, Lienkamp M. Connecting the Dots: A Comprehensive Modeling and Evaluation Approach to Assess the Performance and Robustness of Charging Networks for Battery Electric Trucks and Its Application to Germany. World Electric Vehicle Journal. 2024; 15(1):32. https://doi.org/10.3390/wevj15010032
Chicago/Turabian StyleBalke, Georg, Maximilian Zähringer, Jakob Schneider, and Markus Lienkamp. 2024. "Connecting the Dots: A Comprehensive Modeling and Evaluation Approach to Assess the Performance and Robustness of Charging Networks for Battery Electric Trucks and Its Application to Germany" World Electric Vehicle Journal 15, no. 1: 32. https://doi.org/10.3390/wevj15010032