Article

Tracing the Nitrate Sources of the Yili River in the Taihu Lake Watershed: A Dual Isotope Approach

State Key Laboratory of Lake Science and Environment, Nanjing Institute of Geography and Limnology, Chinese Academy of Sciences, 73 East Beijing Road, Nanjing 210008, China
*
Author to whom correspondence should be addressed.
Water 2015, 7(1), 188-201; https://doi.org/10.3390/w7010188
Submission received: 22 September 2014 / Accepted: 24 December 2014 / Published: 31 December 2014

Abstract

:
As the third largest freshwater lake in China, Taihu Lake has experienced severe cyanobacterial blooms and associated water quality degradation in recent decades, threatening the human health and sustainable development of cities in the watershed. The Yili River is a main river of Taihu Lake, contributing about 30% of the total nitrogen load entering the lake. Tracing the nitrate sources of Yili River can inform the origin of eutrophication in Taihu Lake and provide hints for effective control measures. This paper explored the nitrate sources and cycling of the Yili River based on dual nitrogen (δ15N) and oxygen (δ18O) isotopic compositions. Water samples collected during both the wet and dry seasons from different parts of the Yili River permitted the analysis of the seasonal and spatial variations of nitrate concentrations and sources. Results indicated that the wet season has higher nitrate concentrations than the dry season despite the stronger dilution effects, suggesting a greater potential of cyanobacterial blooms in summer. The δ15N-NO3 values were in the range of 4.0‰–14.0‰ in the wet season and 4.8‰–16.9‰ in dry, while the equivalent values of δ18O were 0.5‰–17.8‰ and 3.5‰–15.6‰, respectively. The distribution of δ15N-NO3 and δ18O-NO3 indicated that sewage and manure as well as fertilizer and soil organic matter were the major nitrate sources of the Yili River. Atmospheric deposition was an important nitrate source in the upper part of Yili River but less so in the middle and lower reaches due to increasing anthropogenic contamination. Moreover, there was a positive relationship between δ18O-NO3 and δ15N-NO3 in the wet season, indicating a certain extent of denitrification. In contrast, the δ18O-δ15N relationship in the dry season was significantly negative, suggesting that the δ15N and δ18O values were determined by a mixing of different nitrate sources.

1. Introduction

The rapid development of agricultural and industrial sectors in recent decades has caused a sharp increase of nitrogen accumulation in main water bodies in the world [1,2]. As the dominant form of nitrogen contamination, excess nitrate loading triggered eutrophication, red tides, hypoxia and associated water quality degradation [3,4]. Moreover, high nitrate concentrations are believed to be a health hazard because it may cause Methemoglobinemia in infants and be responsible for increases in stomach cancer in others [5]. Hence, a limit on nitrate concentration (10 mgN/L) in drinking water has been set by WHO (World Health Organization) and USEPA (United States Environmental Protection Agency) [6]. Consequently, nitrate pollution has been a matter of great concern throughout the world.
Identifying the sources of nitrogen is the first step towards remediation of nutrient pollution in aquatic ecosystems. Traditional analysis of nitrate sources is conducted by determining nitrate concentrations in freshwater systems and potential nitrate sources of water supplies. However, there are many deficiencies in this method, such as the possibility of multiple nitrate sources and some biogeochemical processes. Nitrogen isotopes (specifically δ15N) can inform the sources of nitrate due to the distinct isotopic characteristics of main nitrate, sources such as septic systems, animal waste, commercial fertilizer and decaying organic matter [7,8]. However, it is very difficult to differentiate these sources using nitrogen isotope data alone because of some significant overlaps in δ15N-NO3 ranges. Moreover, fractionation processes may constrain the accuracy of NO3 source identification. For example, kinetic isotope effects during microbial denitrification caused an enrichment of the heavy isotopes in the remaining NO3 [9]. Recent studies have suggested the employment of oxygen isotopic composition as an additional marker of nitrate sources due to the large variations of δ18O ranges among different sources [10,11]. The dual isotopic approach has been used to investigate the nitrate sources of Mississippi River and the Illinois River in the U.S. [12,13], as well as the Yangtze River in China and the Han River in Korea [14,15]. These studies have reported a high level of sensitivity and reliability of using dual isotopic technique for tracking nitrate sources. But few studies are focused on isotopic compositions of δ15N- and δ18O-NO3 in tributaries or small rivers, which limit the development as well as its implementation of site-specific management practices in NO3-N reduction [16].
As the third largest freshwater lake in China, Taihu Lake plays an extremely important role in the social and economic development of the Yangtze River Delta. However, it has experienced aggravating cyanobacterial blooms in recent years due to excessive nutrient input, threatening the human health and sustainable development of cities in the watershed. Nitrogen (N) and phosphorus (P) are the key nutrients of concern. Phosphorus has been implicated traditionally as having a central role in the control of cyanobacterial blooms, since they may satisfy their own N requirements [3]. However, N loading has increased dramatically in many watersheds during recent years, promoting blooms of non-N2 fixers. Combined N and P additions led to maximum stimulation of growth in Tai Lake, suggested that reducing both N and P inputs are needed to control cyanobacterial bloom in this hyper-eutrophic system [3,17,18]. Seeking effective strategies to mitigate nitrogen input and eutrophication of Taihu Lake has become a national challenge. The Yili River is a main river of Taihu Lake, contributing 30% of the total nitrogen loading entering the lake [19,20,21,22]. Understanding the sources and biogeochemical cycling of nitrate in the Yili River can throw light on proper eutrophication control measures for Taihu Lake. Previous studies have largely focused on phosphorus, heavy metal, and POPs, with few applications of isotopic approaches [16,23,24]. This study adopted the dual isotopic approach to trace the nitrate dynamics and source of the Yili River with two specific objectives: (1) investigate the spatial and seasonal variations of nitrate concentrations in the Yili River; and (2) identify the nitrate sources of the Yili River based on nitrogen and oxygen isotopic compositions. The results of the study should greatly assist the management of land-use and water conservation in the protected watershed.

2. Materials and Methods
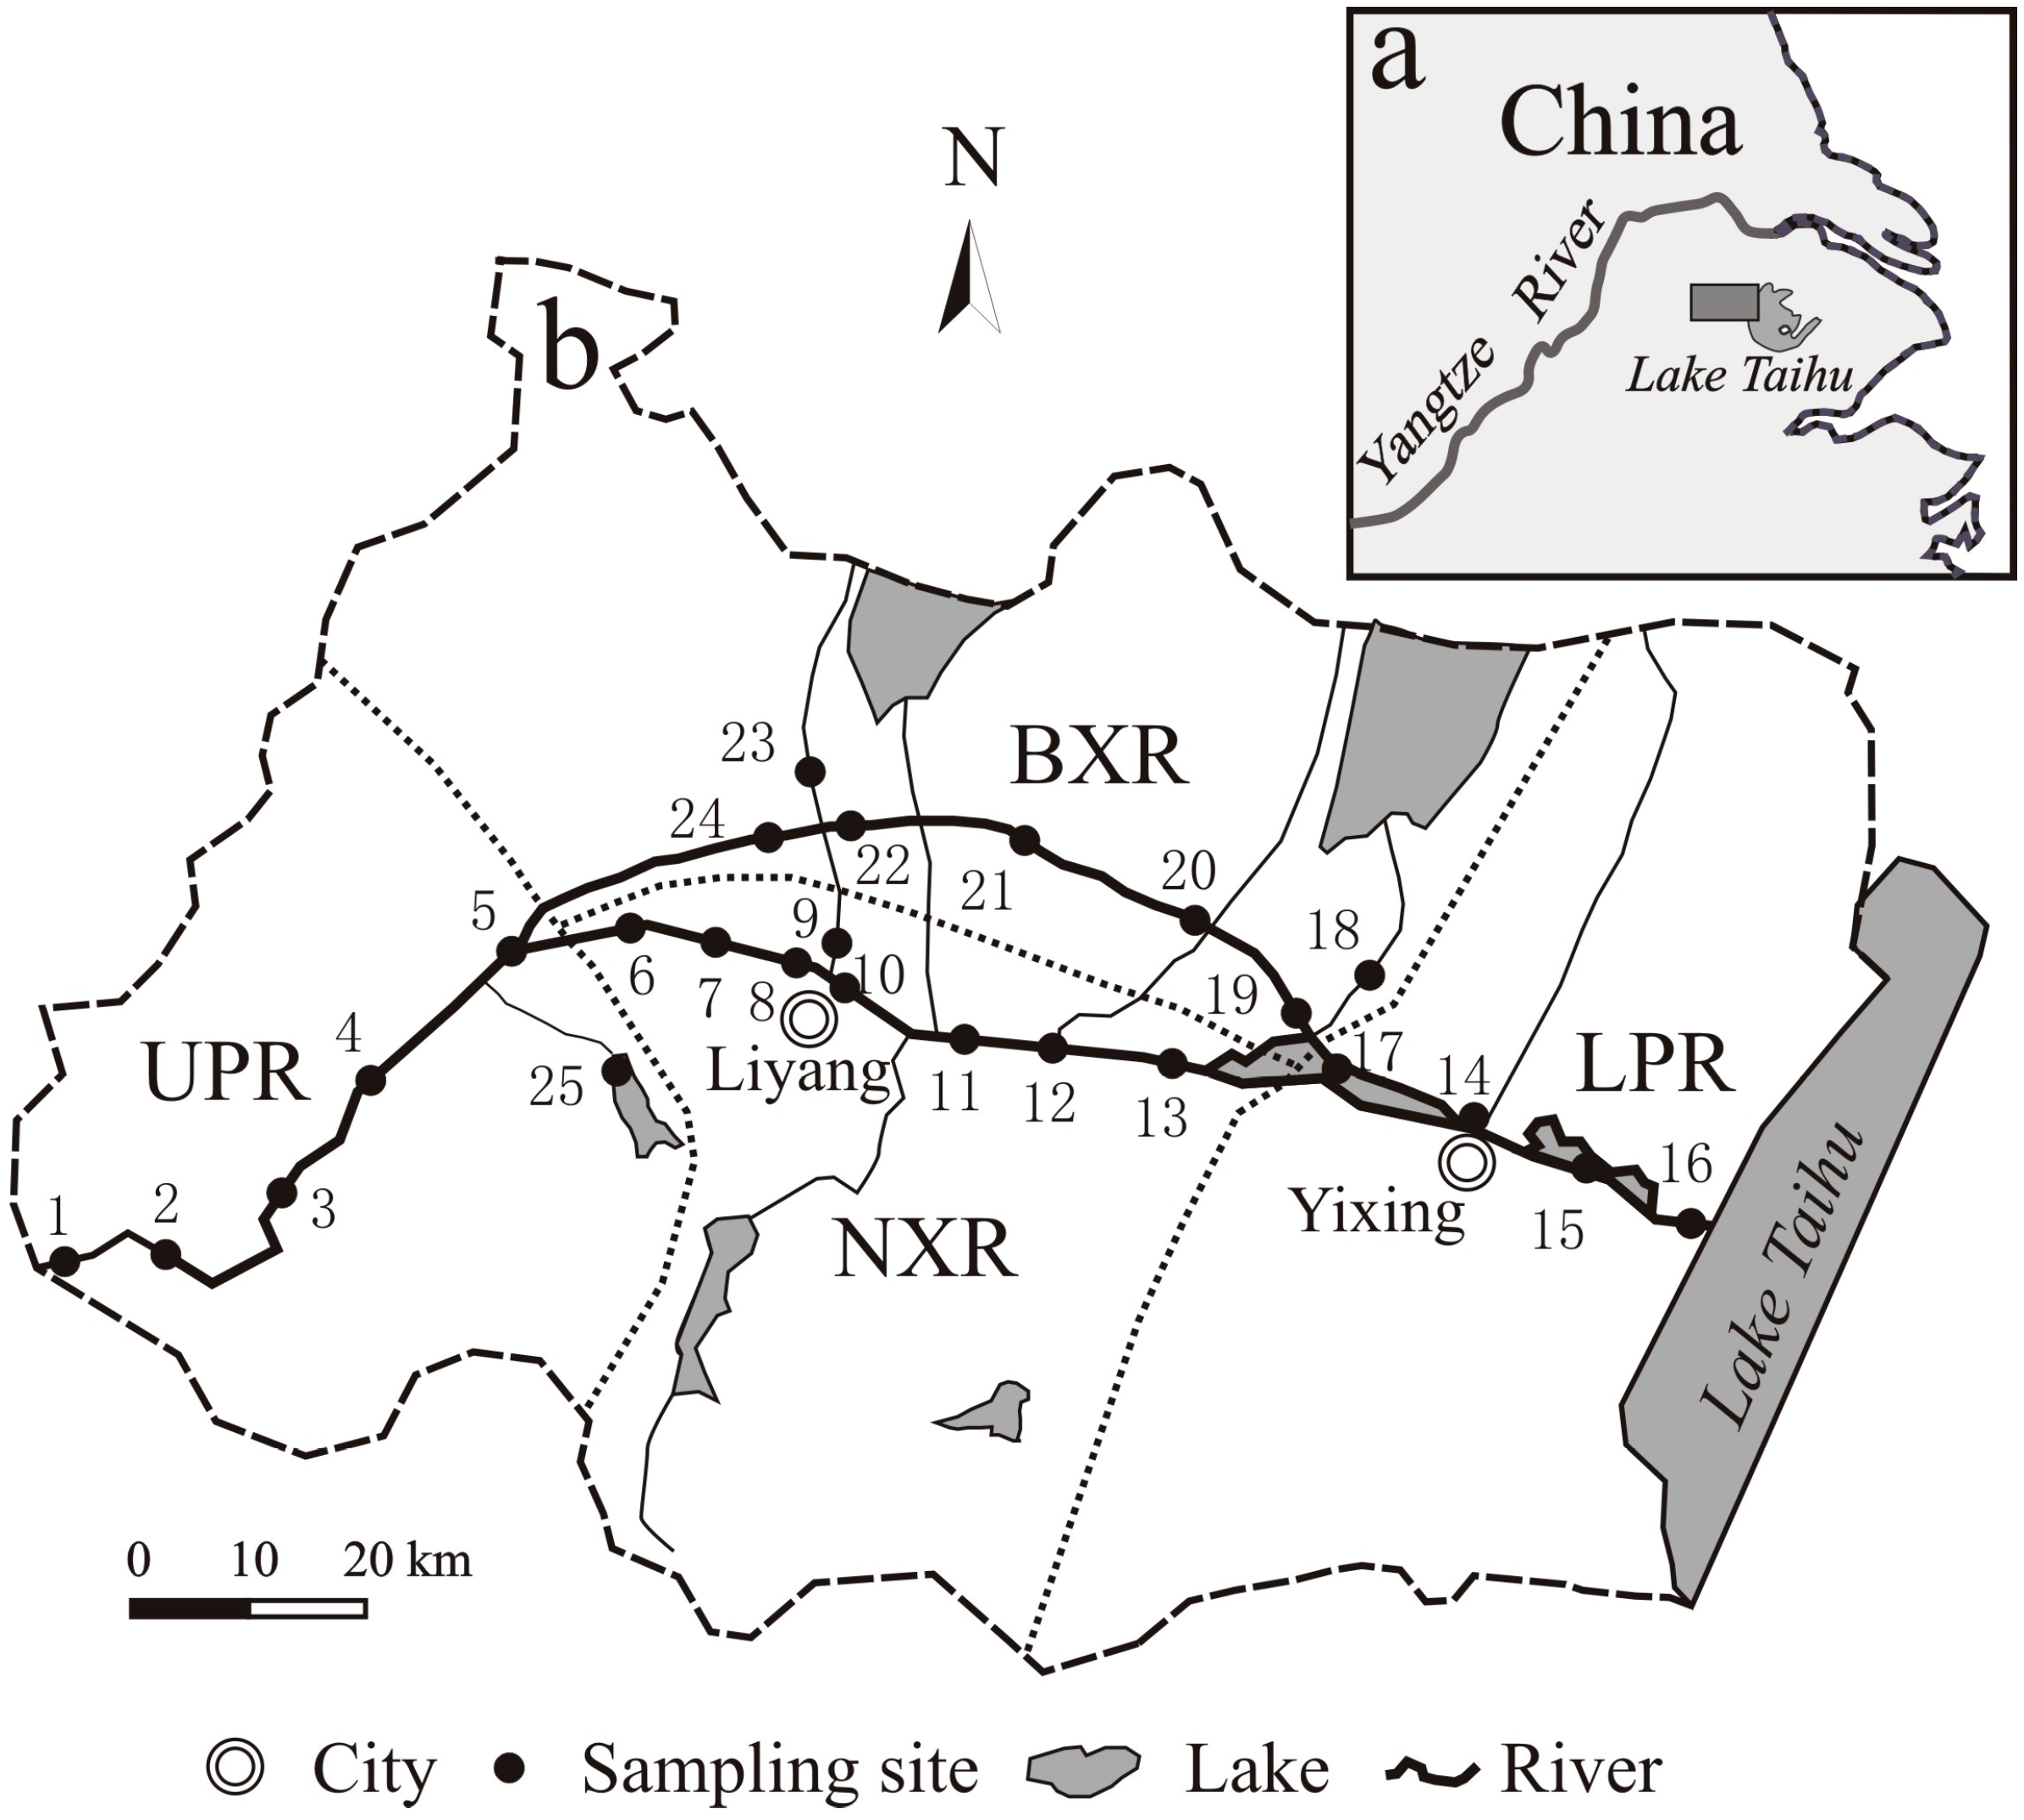
2.1. Study Area

Taihu Lake is located in the highly developed and densely populated Yangtze River Delta, with a surface area of 2238 km2 and average depth of 1.89 m. It provides multiple services for the region, including floodwater storage, irrigation and navigation, drinking and industrial water supply, as well as recreational and touristic functions. The tremendous economic and population growth of cities in the watershed has generated an annual discharge of 30,635 t total nitrogen (TN) and 1751 t total phosphorus (TP) into the lake, resulting in lake-wide eutrophication in recent decades [20,25].
The Yili River basin is located in the humid subtropical zone and has a typical East Asian monsoon climate. Both monthly and yearly precipitation is subject to strong variation. The highest precipitation occurs from June to September (wet season), to account for 45%–55% of the annual total rainfall. Meanwhile, the least precipitation falls between January and March (dry season). The average annual temperature and precipitation are 15.5 °C and 1465.8 mm, respectively [20]. The Yili River is a main river of Taihu Lake, contributing 30% of the total nitrogen load entering the lake. It originates from the Maoshan mountain area and has a basin area of 3091 km2. Most water produced in the west of the basin flows firstly into the Nanxi river and Beixi river, then into three small lakes, and finally into Lake Taihu. There are small canals that cross the Nanxi and Beixi rivers (Figure 1). The dominant land use patterns are forest, arable land and urban area, accounted for around 20.56%, 36.24% and 11.9% of the entire watershed, respectively. The total population of the watershed is 229.96 × 10⁴ and about 6.93 × 10⁴ ton fertilizer was used for agriculture in 2013 [26].
Figure 1. Locations of Taihu Lake (a); Yili River and water sampling sites (b) (the blank rectangle in (a)). The Yili River is divided into four parts: the upper stream (UPR); the lower stream (LPR); and two river branches in the middle stream, namely Nanxi River (NXR) and Beixi River (BXR).
Water 07 00188 g001

2.2. Sampling and Analytical Methods

To investigate the seasonal and spatial variations of the nitrate content and isotopic composition in the Yili River, water samples were collected from twenty-five sites by two sampling campaigns conducted in March (the dry season) and July (the wet season) in 2010. The sampling sites (Figure 1) were selected to avoid anthropogenic point-source contamination and direct influences from small tributaries. At each site, a depth-integrated sample was taken from the center of the river. Samples for chemical and isotopic analyses were passed through a 0.45-μm membrane filter and kept refrigerated at approximately 4 °C until analysis, within one month. Concentrated HgCl2 solution was added to water samples for the determination of nitrate-nitrogen and nitrate-oxygen isotopic compositions to prevent N and O isotopic fractionation caused by microbial activities during storage.
Cl and NO3 were analyzed by ion chromatography and the detect limits were 0.01 mg/L. Water isotopes of δ18O were determined using off axis integrated-cavity output laser spectroscopy (Model DLT-100; Los Gatos Research Inc., San Francisco, CA, USA) [27]. All samples were normalized to internal laboratory water standards that were previously calibrated relative to VSMOW (0‰). Our analytical precision was ±0.1‰ for δ18O [28]. Nitrate δ15N and δ18O were analyzed from the mixed samples using the azide method [29]. Briefly, a sample containing NO3 was converted to nitrous oxide (N2O) by using sodium azide. The N2O was stripped from the sample vial using helium carrier gas, purified using cryogenic trapping (Thermo Fisher Precon System), chromatographically separated (Thermo Fisher Gas Bench), and analyzed using mass spectrometry (Thermo MAT 253). The ratios of 15N:14N and 18O:16O were expressed relative to atmospheric nitrogen for nitrogen and Vienna Standard Mean Ocean Water (V-SMOW) for oxygen. Isotope values were calibrated using the United States Geological Society (USGS) and International Atomic Energy Agency (IAEA) internationally recognized nitrate standards: USGS-34, USGS-35, IAEA-N1, IAEA-N2 and IAEA-NO3. Based on replicate measurements of standards and samples (n = 40), the analytical precisions for δ18O-NO3 and δ15N-NO3 were better than ±0.3‰ and ±0.3‰, respectively. The nitrogen isotope ratio for powdered samples was determined by mass spectrometry interfaced with a Carbon-Nitrogen-Sulfur elemental analyzer (Thermo Fisher Flash 2000, Thermo Fisher Scientific Inc., Kansas City, MO, USA). Analytical precision of the analysis was better than ±0.15‰.

3. Results and Discussion

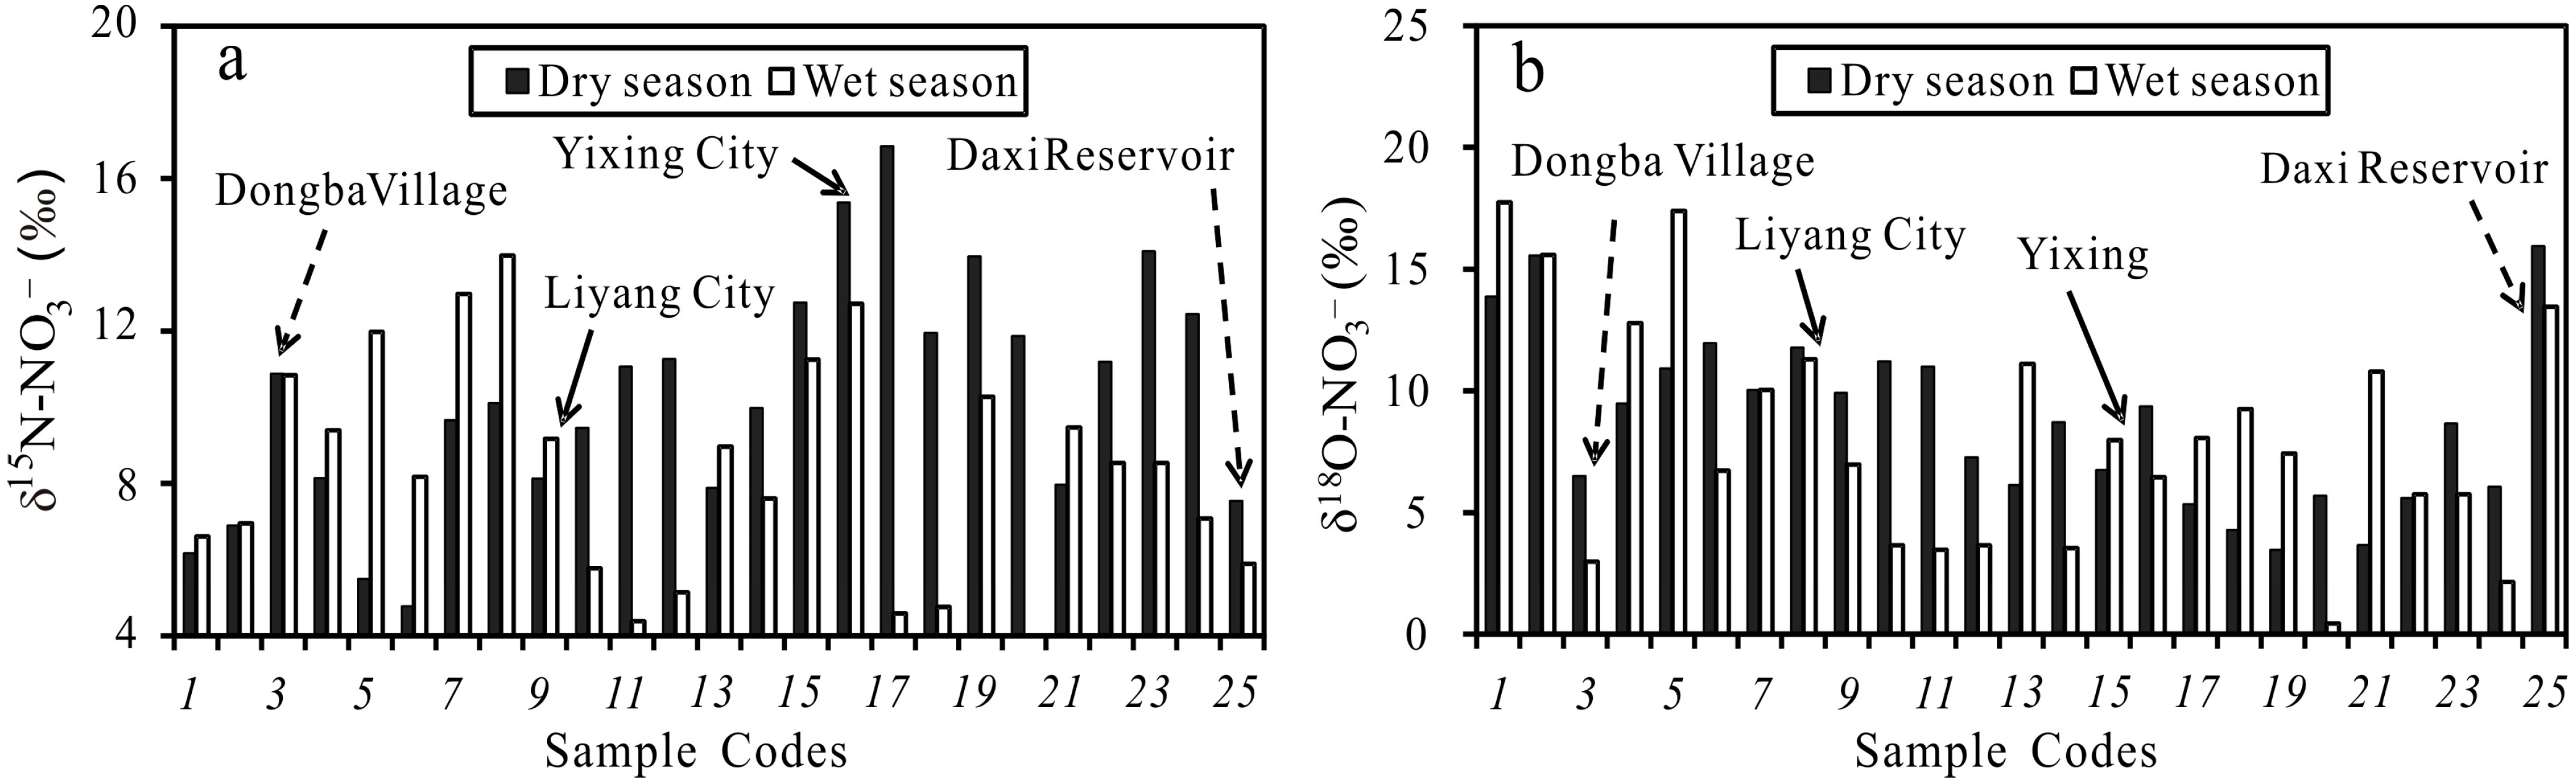
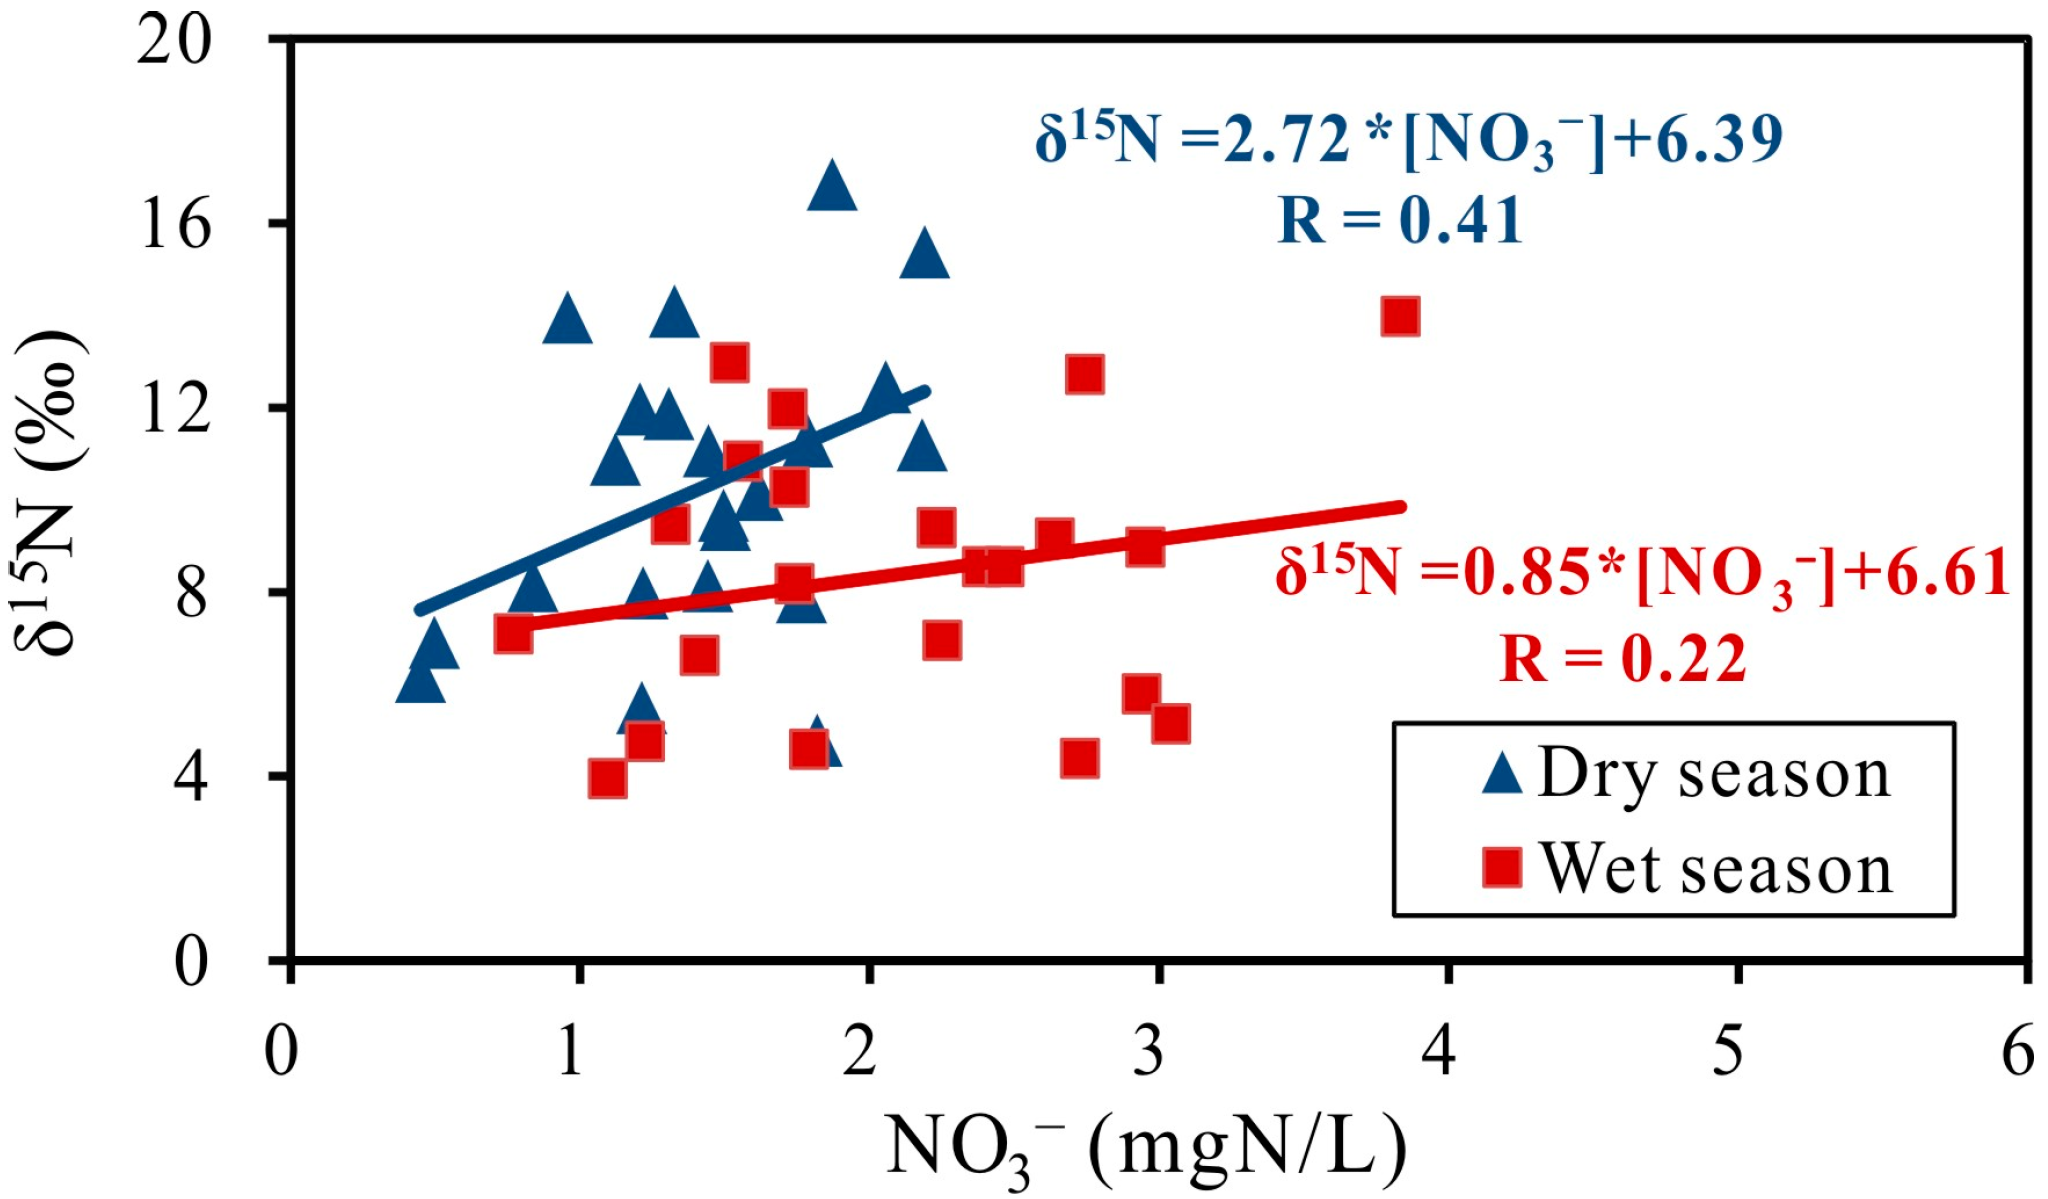
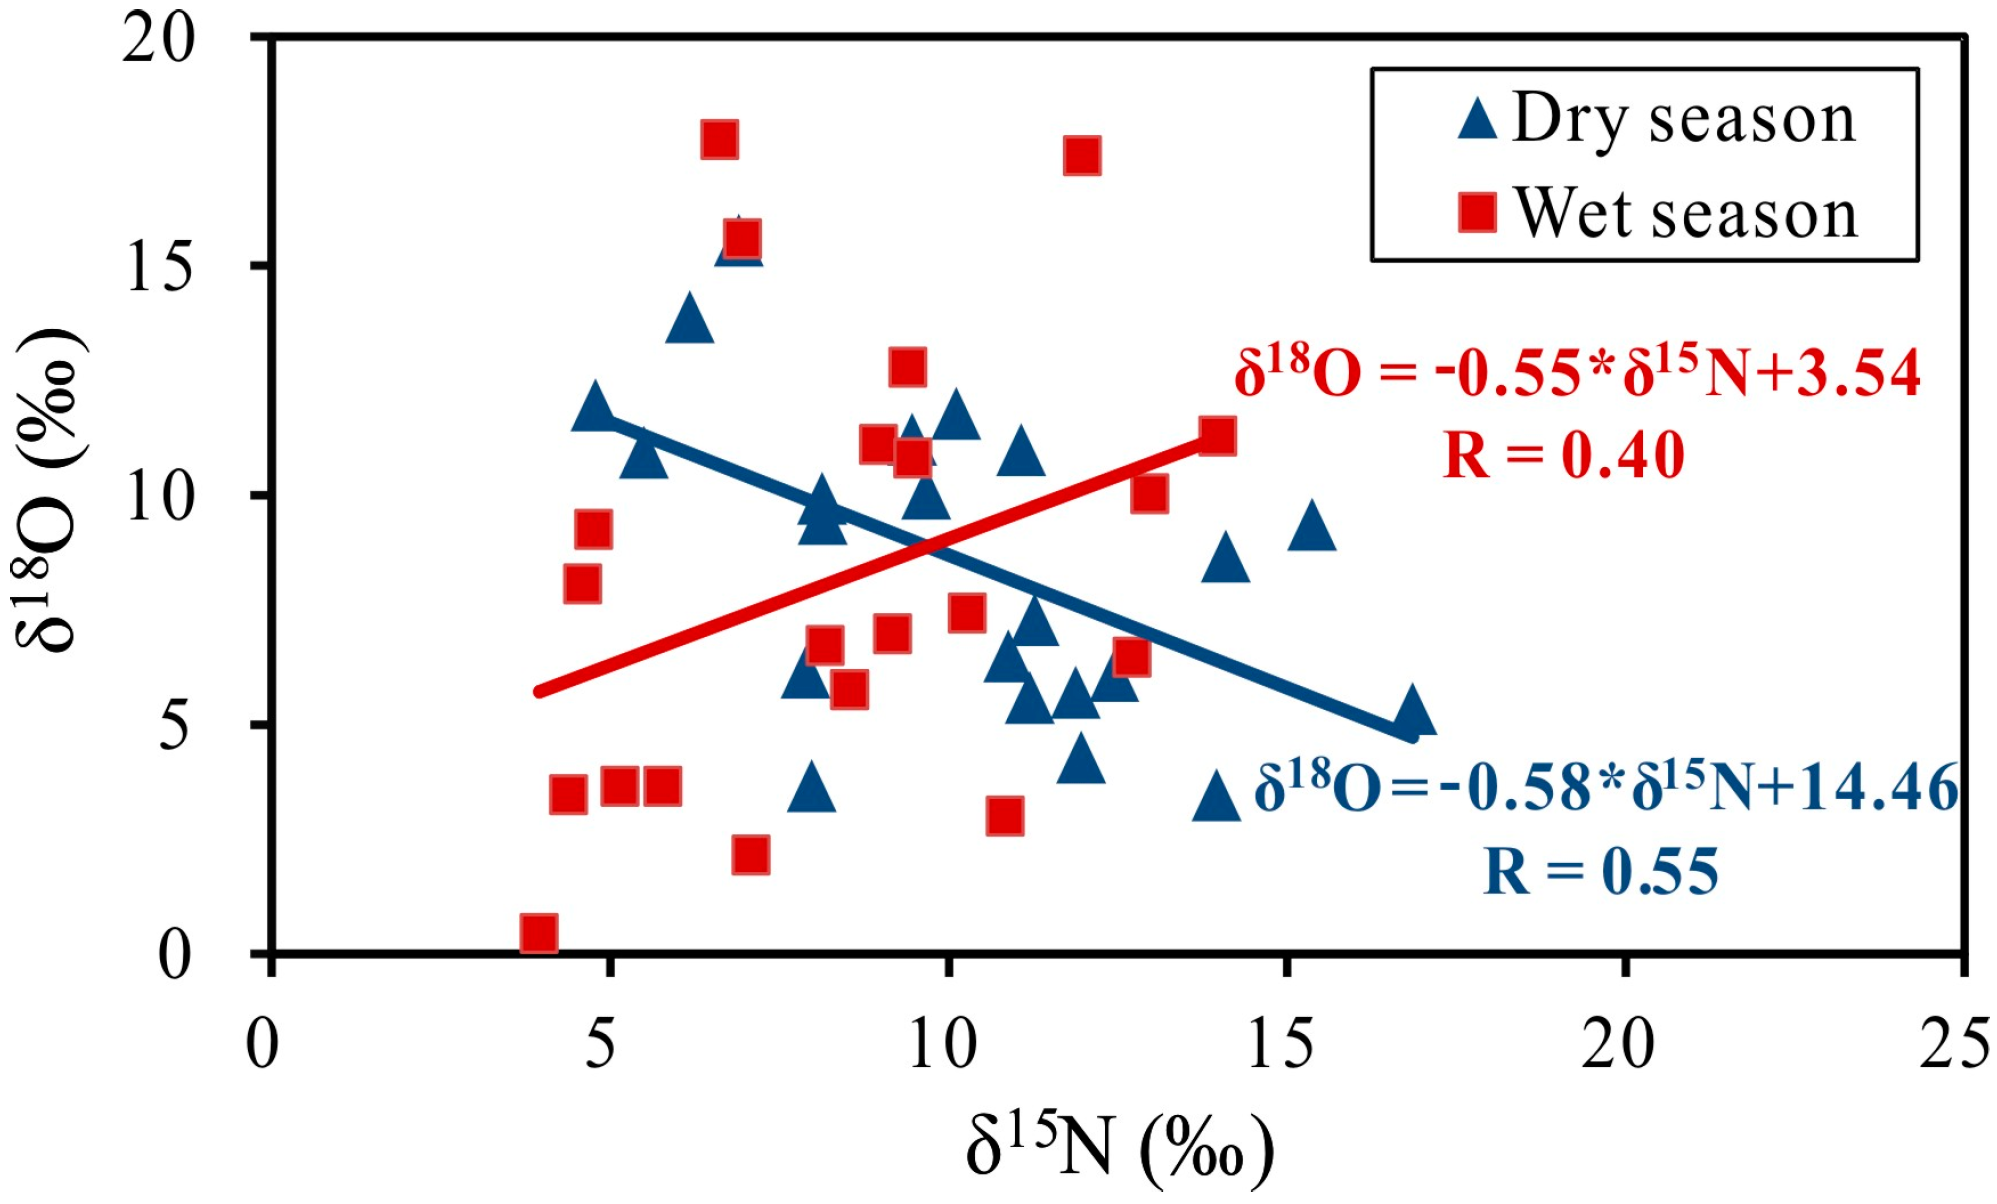
3.1. Major Elements and Isotopic Composition

Table 1 shows the average anion concentrations and isotopic compositions of samples in different parts of the Yili River. The concentration of Cl ranges from 11.03 to 53.04 mg/L in the wet season (July 2010) and 13.47 to 337.40 mg/L in dry (March 2010), with average values of 29.95 and 113.88 mg/L, respectively. The results implied potential dilution effects by rainwater in the wet season. In contrast, the NO3 concentration has marginal seasonal differences, ranging from 0.77 to 3.83 mg/L in the wet season, and 0.45 to 2.19 mg/L in dry. The even larger concentration in the wet season despite of the dilution effect might be explained by the more intensive agricultural and industrial activities as well as nitrification of organic matter and NH4+-N. The results point to a higher potential of cyanobacterial blooms in summer due to increased nitrate flux. The mean concentrations of Cl and NO3 in UPR were notably lower in comparison with NXR, BXR and LPR during both seasons, suggesting an increase of anthropogenic contamination from upstream downward along the Yili River.
Table 1. Anion contents and isotopic compositions in different parts of the Yili River during the wet and dry seasons.
LocationClNO3δ15N-NO3δ18O-NO3δ18O
mg/LmgN/L
Wet season (July 2010)
UPR(n = 6)15.02 ± 7.361.62 ± 0.398.6 ± 2.113.3 ± 6.1−7.6 ± 0.3
NXR(n = 8)31.75 ± 4.892.58 ± 0.748.7 ± 3.56.9 ± 3.4−7.9 ± 0.1
BXR(n = 7)39.67 ± 8.591.57 ± 0.427.5 ± 3.75.9 ± 2.1−8.0 ± 0.2
LPR(n = 4)30.28 ± 10.972.61 ± 0.6510.5 ± 2.46.0 ± 3.7−8.0 ± 0.1
Mean(n = 25)29.95 ± 11.382.07 ± 0.748.4 ± 2.98.2 ± 4.7−8.0 ± 0.2
Dry season (March 2010)
UPR(n = 6)28.70 ± 17.750.75 ± 0.357.5 ± 2.112.1 ± 3.6−3.1 ± 0.4
NXR(n = 8)120.14 ± 55.671.69 ± 0.1610.6 ± 2.19.1 ± 2.1−4.2 ± 1.8
BXR(n = 7)176.18 ± 18.861.46 ± 0.4111.9 ± 3.05.4 ± 1.8−5.8 ± 0.3
LPR(n = 4)150.31 ± 77.301.84 ± 0.4612.7 ± 2.18.3 ± 1.8−5.4 ± 1.7
Mean(n = 25)113.88 ± 73.191.40 ± 0.4710.2 ± 3.18.8 ± 3.2−4.4 ± 1.8
The water samples from Daxi Reservoir were analyzed to obtain the background values of δ15N-NO3 and δ18O-NO3 in Yili River basin. Daxi Reservoir is a major drinking water resource in the Yili River basin with high water quality due to constrained human activities in its surrounding mountain area. The δ15N-NO3 and δ18O-NO3 values were 5.9‰ and 13.5‰ in the wet season, and 7.5‰ and 16.0‰ in the dry season, respectively (Figure 2). The higher δ18O-NO3 and lower δ15N-NO3 value indicated that atmospheric deposition is a major source of nitrate [10].
Figure 2. Seasonal and spatial variations of nitrogen and oxygen isotopic compositions in the Yili River basin. (a) The distribution of δ15N-NO3 values in dry and wet seasons; (b) The distribution of δ18O-NO3 values in dry and wet seasons.
Water 07 00188 g002
The δ15N-NO3 value ranged from 4.0‰ to 14.0‰ in the wet season and 4.8‰ to 16.9‰ in the dry, with average values of 8.4‰ and 10.2‰, respectively. The higher δ15N-NO3 values in the dry season is reasonable due to the dilution effects of precipitation on sewage and livestock effluent. The average δ15N-NO3 value in NXR is 7.5‰, which was closed to UPR and BXR (8.6‰ and 8.7‰, respectively) but much lower than that of LPR (10.5‰). The higher values were also found in water samples near Dongba Village, Liyang City and Yixing City, confirming the increasing loading of anthropogenic contamination in these areas.
The seasonal variation of δ18O-NO3 was smaller than that of δ15N-NO3, ranging from 0.5‰ to 17.8‰ in the wet season and 3.5‰ to 15.6‰ in dry, with average values of 8.2‰ and 8.8‰, respectively. Spatially, the highest δ18O-NO3 value occurred in UPR (12.1‰), which is much higher than those of NXR, BXR and LPR (9.1‰, 5.4‰ and 8.3‰, respectively). Lower values were found in the water samples near Dongba Village and in BXR, probably affected by the nitrification of sewage.
The stable oxygen (18O) and hydrogen (D) isotopes have been used as ideal conservative tracers for identifying water sources because they constitute water molecules [30]. The δ18O-H2O value of Yili River water ranged from 7.6‰ to 8.4‰ in the wet season, with the average value of 8.0‰ and the standard variation of 0.2‰ (Table 1). This suggested that there were same water sources from the upper to lower reaches of the Yili River in wet season. However, the δ18O-H2O value of Yili River water ranged from 2.4‰ to 7.3‰ in the dry season, with the average value of 4.4‰ and the standard variation of 1.8‰ (Table 1). Moreover, the δ18O-H2O values did not positively relate to the concentration of Cl in the Yili River, The large variation for δ18O-H2O values in dry season suggested that the water source of UPR and NXR were different with BXR and LPR.

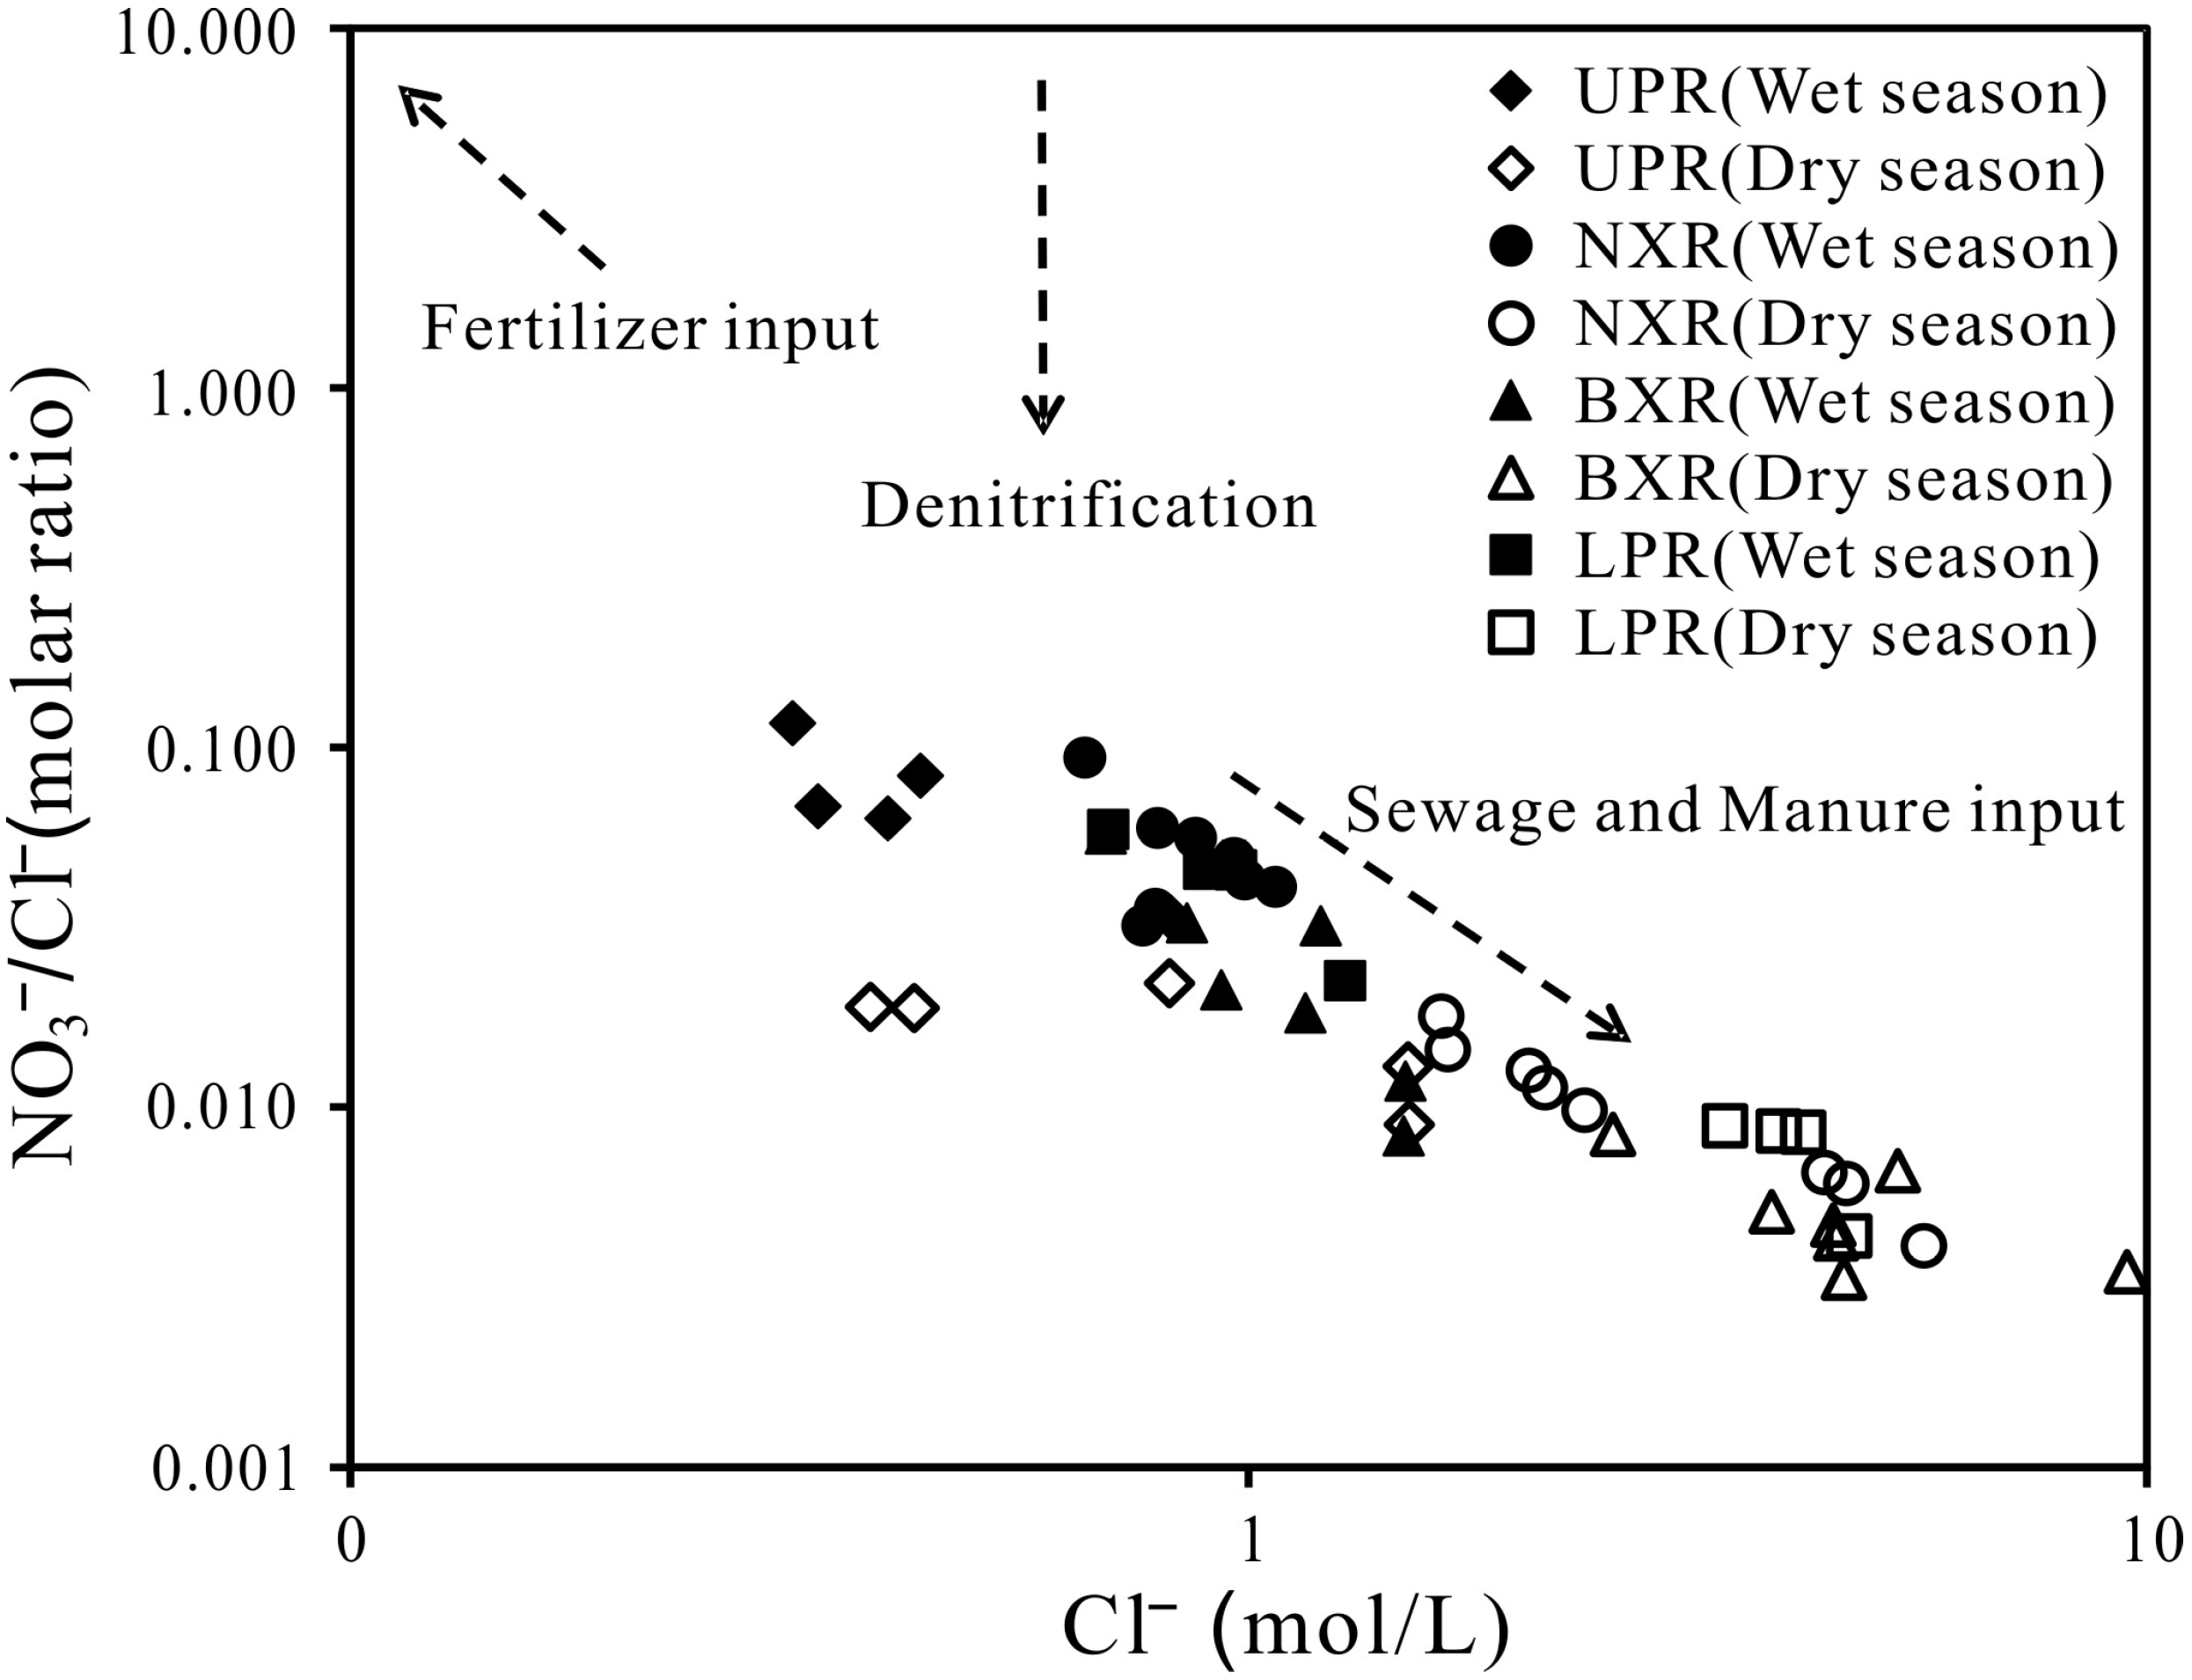
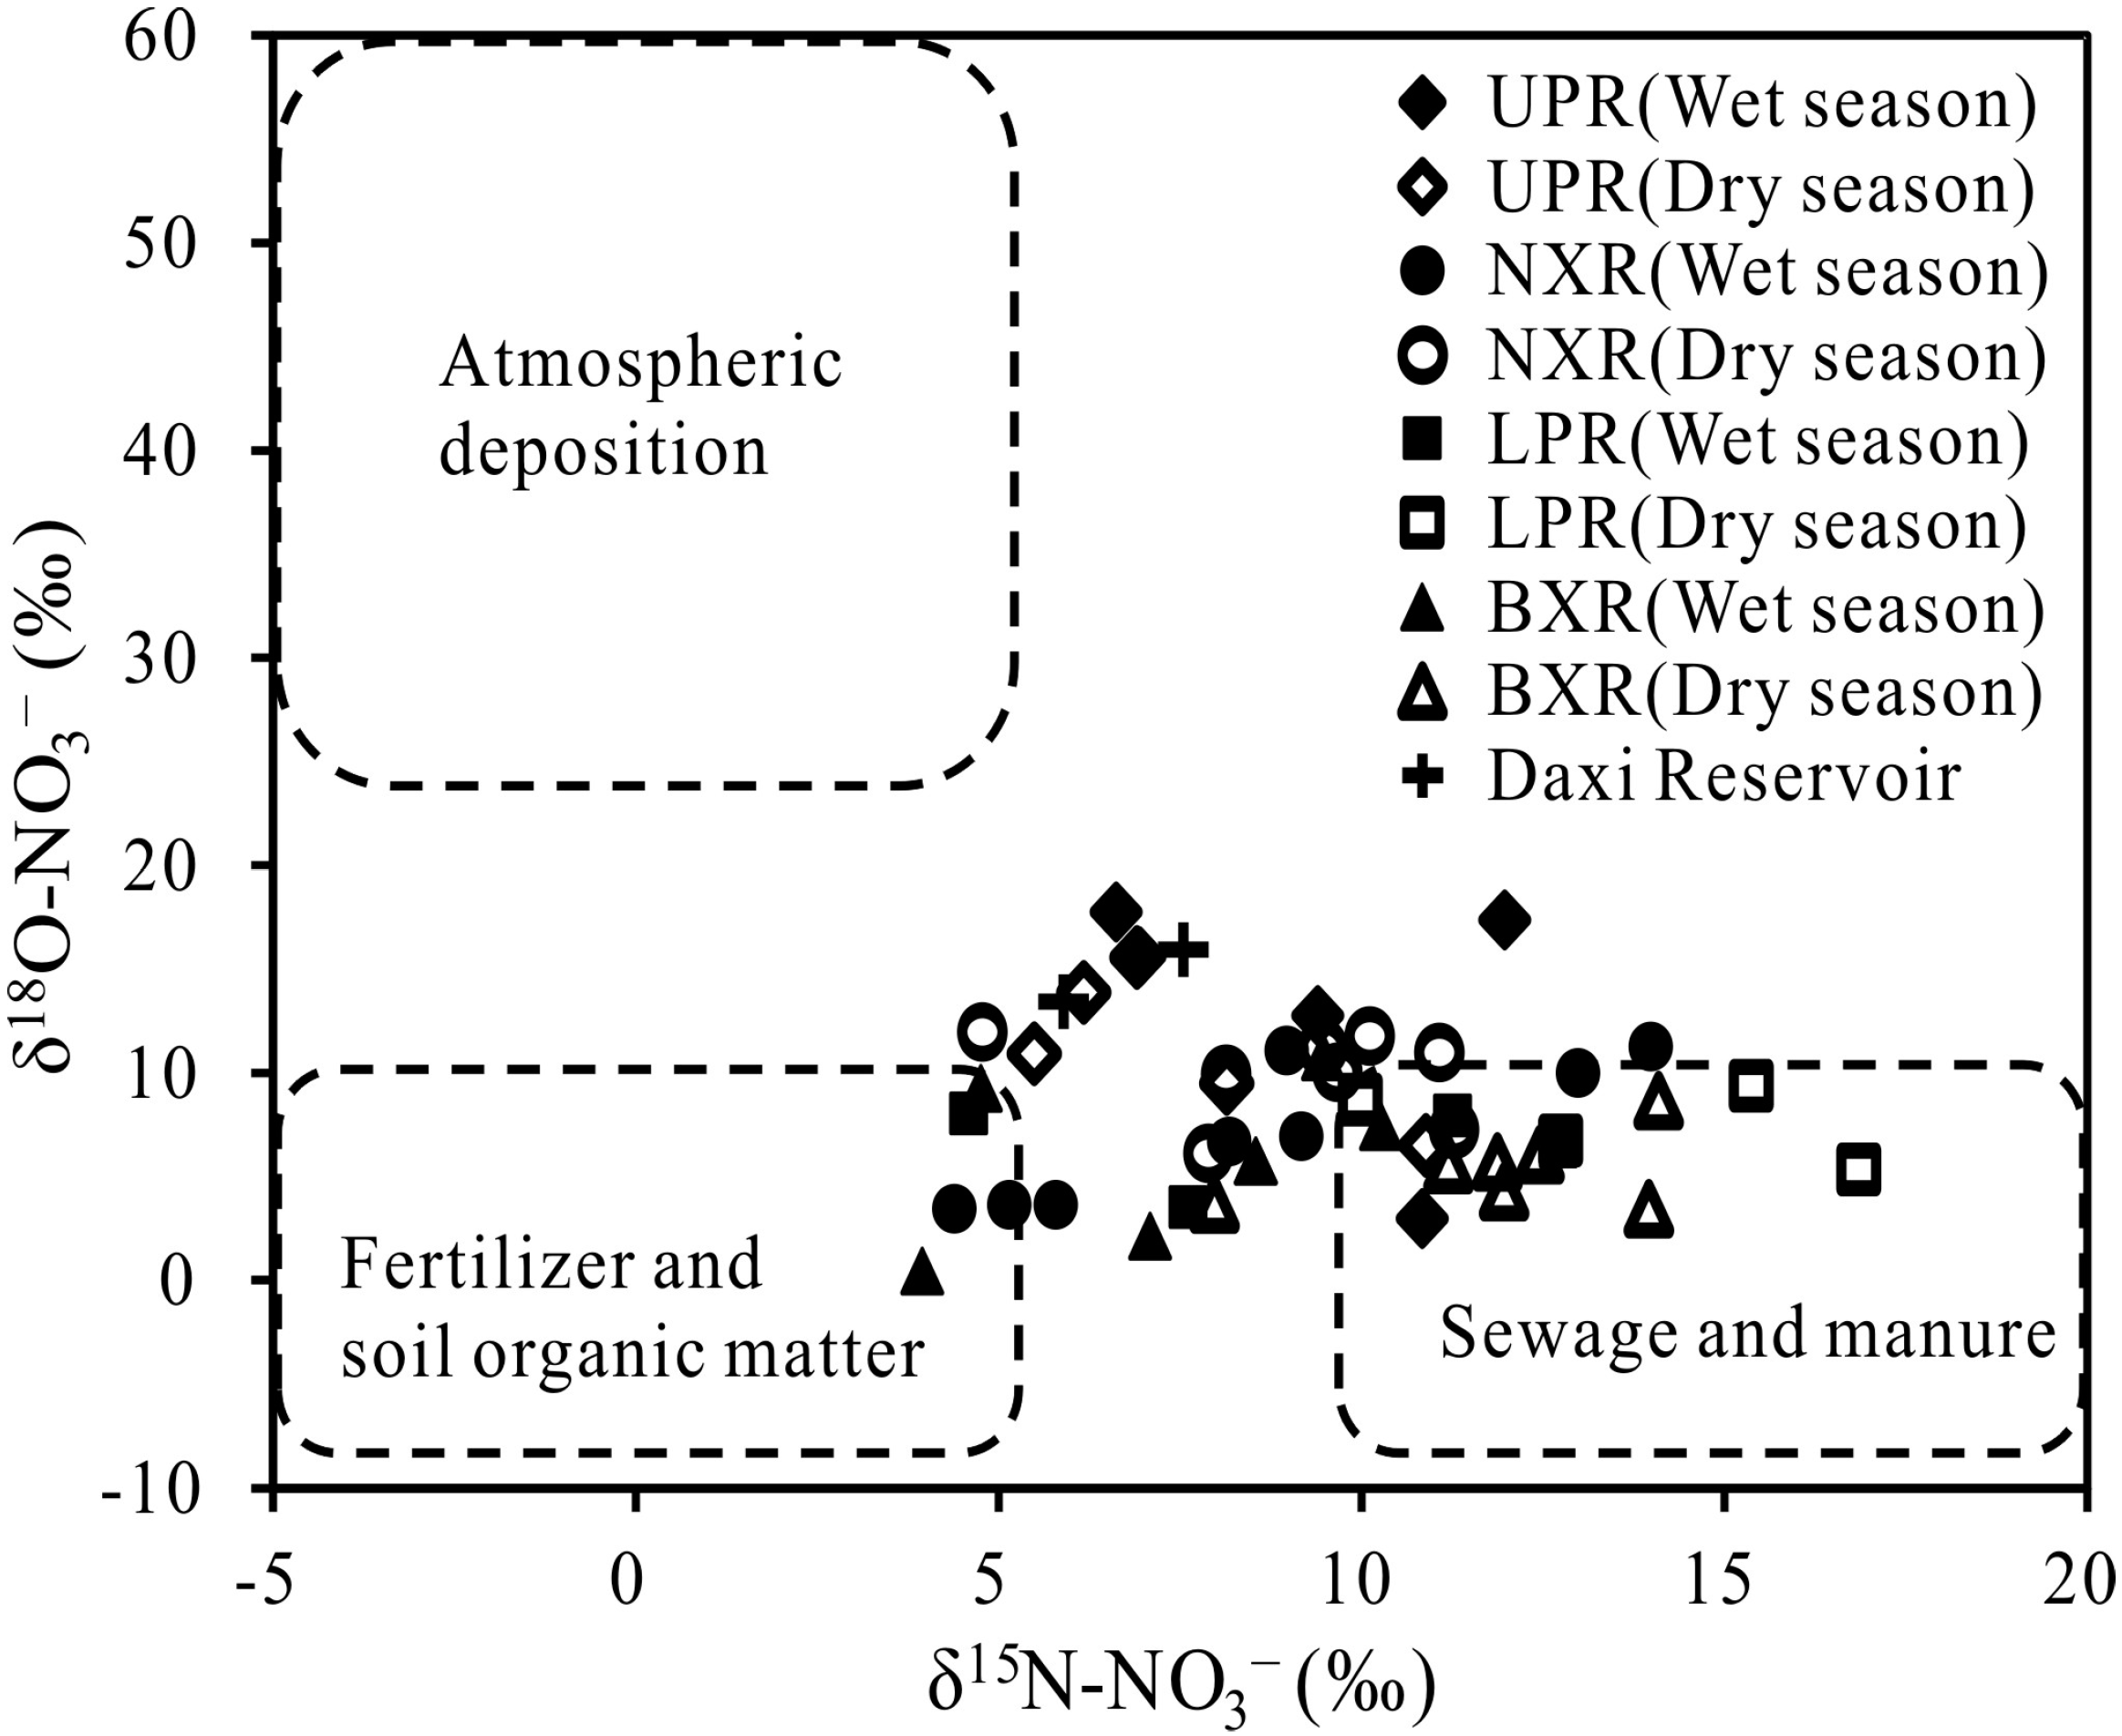
3.2. Identification of Nitrate Sources

Chloride is an effective indicator of sewage and dilution impacts because it is hardly affected by physical, chemical, and biological processes. Thus, the ratio of NO3/Cl has been considered to be more accurate for the study of N dynamics and sources [15]. Figure 3 shows the co-variation of NO3/Cl molar ratios with Cl molar concentrations in Yili River.
Figure 3. Relationships between NO3/Cl and Cl concentrations for two seasons and four parts of the Yili River.
Water 07 00188 g003
Overall, the samples in the wet and dry seasons overlapped the ranges of sewage and manure except for some samples from UPR with low Cl concentrations and high NO3/Cl molar ratios. The lower NO3/Cl ratios in sewage and livestock waste were partly because that the nitrogen in them is ammonium and has not yet been converted to nitrate [31]. No rock salts or evaporate sediments have been found in the Yili River basin. The results suggest that sewage or manure is a major contributor to nitrate inputs into the Yili River. In addition, the NO3/Cl ratios were high in the wet season and less so in dry, suggesting the great contribution of sewage and manure in the dry season.
The combined use of δ15N and δ18O values of NO3- can provide a diagnostic tool for discerning among major nitrate sources [10,32]. Figure 4 shows the typical ranges of δ15N and δ18O for various natural and anthropogenic nitrate sources. Nitrate from animal manure and human sewage is characterized by high δ15N-NO3 values (7‰–20‰) and low δ18O-NO3 (−10‰–10‰) [10]. In contrast, nitrate from atmospheric deposition has very low δ15N-NO3 (−5‰–5‰) and high δ18O-NO3 values (25‰–75‰) [33]. For nitrate originated from synthetic fertilizer and soil organic matter, both δ15N and δ18O values are low, ranging from −5‰ to 5‰ and −10‰ to 10‰, respectively [10]. During nitrification, in addition to preferential utilization of 14N, NO3 generally utilizes one-third of the O from dissolved oxygen and two-thirds from the water itself. Therefore, nitrate derived from nitrification has δ18O-NO3 values between −15‰ and +15‰, including the soil organic N, and NH4+ from sewage and manure [34].
Figure 4. Ranges of δ15N and δ18O values for different nitrate sources and measured in the Yili River.
Water 07 00188 g004
Using this rule of NO3-O sources during nitrification and range of the Yili River water δ18O of −9.1‰ to −2.0‰, an expected narrower range of nitrate δ18O of 1.8‰ to 6.5‰ can be obtained for the reduced N sources of NO3. In our results, δ18O values of many water samples exceeded the typical upper limit of δ18O for nitrate from nitrified reduced N (Figure 4). The greater δ18O values might be due to the contribution of NO3 from atmospheric, synthetic NO3 fertilizer sources of NO3. The greater δ15N values might be a result of NO3 contribution from sewage and manure. In China, urea and ammonium salt are the major components of synthetic nitrogen fertilizer. The contribution of synthetic NO3 can be eliminated as it accounts for less than 2% of the synthetic N fertilizer applied in China. So the main sources of Yili River are atmospheric, nitrification of organic matter or fertilizer and sewage and manure. For the water samples in UPR and Daxi Reservoir in wet and dry seasons, their δ15N and δ18O values closed to the range of atmospheric deposition, suggest atmospheric deposition was an important nitrate source. The nitrification of organic matter or fertilizer was the main source of NXR in wet season and the nitrate in LPR derives mainly from manure and sewage.
Although the δ15N and δ18O values of nitrate depends mainly on its sources, biologically mediated reactions, such as assimilation and denitrification, are important factors causing the nitrogen and oxygen isotopes to fractionate and leaving heavier isotopes (15N and 18O) in residuals [10,35]. In this study, there was no significant relationship between δ15N-NO3 and NO3 concentration in wet and dry seasons (Figure 5). While, the positive relationship between δ15N-NO3 and NO3 concentration in wet and dry seasons were found, suggested that denitrification did not or slightly occur in Yili River. The addition of nitrate from manure and sewage may produce elevations of both the nitrate concentration and the δ15N-NO3 value in water [34]. The combined NO3 concentration and isotope data, plotted in Figure 5, indicate that the nitrate in the Yili River derives mainly from manure and sewage, with a minor contribution from soil organic matter or atmospheric deposition.
Figure 5. The relationship between δ15N and NO3 concentration in the wet and the dry seasons.
Water 07 00188 g005
The fractionation factors for δ15N and δ18O during denitrification vary with the local conditions and rates of reaction. However, the ratio of the changes in δ15N and δ18O is typically close to 1:2 [36]. There have been few studies of the effects of O fractionations during assimilation on the δ18O of the residual NO3, nitrate assimilation by marine phytoplankton seems to cause ca. 1:1 changes in the δ15N and δ18O of nitrate, regardless of species or the magnitude of the isotope effect [37]. A positive correlation between δ15N-NO3 and δ18O-NO3 during July were found, that is δ18O = 0.55 × δ15N + 3.54, R = 0.40, n = 24. But the slope is 0.55 (Figure 6), which is lower than the range of previously reported values 1.3–2.1 [10,38,39]. These indicated that denitrification occurred in the wet season but less significantly. A significantly negative correlation between the two isotopes during March (δ18O = −0.58 × δ15N + 14.46, R = 0.55, P < 0.05, n = 24) was found, indicating a mixing of different nitrate sources. River sediment denitrification processes were observed in Taihu Basin by using N-15 isotope pairing technology. But the denitrification rates of river sediment were small in Yili River, especially in winter [40]. Therefore, our results proved that denitrification did not occur or only slightly occurred in the dry season and was less significant in the wet season. The results suggested that the combined δ15N and δ18O values were good tracers to quantify the contribution of different nitrate sources.
Figure 6. The relationship between δ15N and δ18O concentration in the wet and the dry seasons.
Water 07 00188 g006
To estimate the contribution of the nitrate sources to the Yili River a mixing-model based on mass balance equations was used [41]. The equations are:
δ15NW = fAδ15NA + fOδ15NO + fMδ15NM
δ18OW = fAδ18OA + fOδ18OO + fMδ18OM
1 = fA + fO + fM
The subscripts A, O and M represent the three sources: atmospheric deposition (A), organic matter or fertilizer (O), and manure and sewage (M); f is defined as the fraction of the respective source. Because we did not collect the sample for the nitrate sources, the nitrate isotope values of each source were considered as atmospheric deposition (δ15N:0‰, δ18O:25‰), organic matter or fertilizer (δ15N:3‰, δ18O:5‰), manure and sewage (δ15N:20‰, δ18O:5‰) [9,10,14,16].
The results showed that atmospheric deposition was the main nitrate source of UPR, which contributed 35.5% in dry season and 48.0% in wet season (Table 2). Manure and sewage was the main nitrate source in LPR, which contributed 59.9% in dry season and 46.8% in wet season. Manure and sewage was the main nitrate source of BXR and NXR in dry season, which contributed 52.9% and 48.3%, respectively. While the main nitrate source of BXR and NXR in wet season was organic matter or fertilizer, which contributed 55.9% and 44.1%, respectively. However, the spatial and temporal variation in isotopic composition should be considered in order to get accurate contribution of different sources. Furthermore, incorporation of hydrochemistry and government statistical data (such as waste discharge, fertilizer use, and population) may help to confirm NO3 source identification [10].
Table 2. The contribution of nitrate sources in different parts of the Yili River.
LocationContribution of Different Nitrate Source (%)
Atmospheric DepositionOrganic Matter or FertilizerManure and Sewage
Dry season
UPR35.531.732.8
BXR3.543.652.9
NXR20.531.248.3
LPR16.523.659.9
Wet season
UPR48.010.641.4
BXR15.055.929.1
NXR19.044.136.9
LPR15.038.146.8

4. Conclusions

This study investigated the nitrate sources of the Yili River based on dual nitrogen and oxygen isotopic compositions. Water samples at 25 sites along the river were collected and analyzed for the wet and dry seasons in 2010. Overall, the wet season had higher nitrate concentrations than the dry one despite the dilution effects, suggesting larger nitrate loading and greater potential of cyanobacterial blooms in the wet season. The mean concentrations of Cl and NO3 were higher in NXR, BXR and LPR, but less so in UPR, indicating an increase of anthropogenic contamination from upstream downward along the Yili River.
The nitrate sources also displayed notable seasonal variations. In the dry season, high Cl concentrations and low NO3/Cl ratios combined with high δ15N-NO3 and low δ18O-NO3 values suggested significant nitrate input from manure and sewage in Yili River. In the wet season, the nitrification of fertilizer and soil organic matter was found to be a major nitrate source due to the augmenting fertilizer application and rising precipitation and surface runoff. The δ18O-δ15N relationship was positive in the wet season but significantly negative in dry, implying the certain extent of denitrification in the Yili River, but the δ15N and δ18O values of nitrate depends mainly on its sources. Atmospheric deposition contributed 35.5% in dry season and 48.0% in wet season in UPR. Manure and sewage contributed 59.9% in dry season and 46.8% in wet season in LPR. The results indicated that the dual-isotopic approach can be an effective tool to trace the biogeochemical cycle of nitrogen and identify the contribution of different nitrate sources.

Acknowledgments

We acknowledge with gratitude the research grant support provided by National Natural Science Foundation of China (41103003, 41073010, 41373017) and the State Key Laboratory of Lake Science and Environment of China (2008SKL012). The kind assistance and advice offered by Longsheng Xu, Guoliang Lei and Lihua Peng are gratefully appreciated.

Author Contributions

All authors were involved in designing and discussing the study. Haiao Zeng and Jinglu Wu collected the water samples. Haiao Zeng analyzed the samples and drafted and finalized the manuscript. Jinglu Wu coordinated the group and designed scenarios. All authors contributed substantially to revisions.

Conflicts of Interest

The authors declare no conflict of interest.

References

  1. McIsaac, G.F.; David, M.B.; Gertner, G.Z.; Goolsby, D.A. Eutrophication: Nitrate flux in the Mississippi River. Nature 2001, 414, 166–167. [Google Scholar] [CrossRef] [PubMed]
  2. Galloway, J.N.; Dentener, F.J.; Capone, D.G.; Boyer, E.W.; Howarth, R.W.; Seitzinger, S.P.; Asner, G.P.; Cleveand, C.C.; Green, P.A.; Holland, E.A.; et al. Nitrogen cycles: Past, present, and future. Biogeochemistry 2004, 70, 153–226. [Google Scholar] [CrossRef]
  3. Paerl, H.W.; Xu, H.; McCarthy, M.J.; Zhu, G.; Qin, B.; Li, Y.; Gardner, W.S. Controlling harmful cyanobacterial blooms in a hyper-eutrophic lake (Lake Taihu, China): The need for a dual nutrient (N&P) management strategy. Water Res. 2010, 45, 1973–1983. [Google Scholar] [CrossRef] [PubMed]
  4. Daisuke, K.; Takashi, O.; Nobutake, N.; Masanobu, M.; Kazuhiko, T. Utilization of ion-exclusion chromatography for water quality monitoring in a suburban river in Jakarta, Indonesia. Water 2014, 6, 1945–1960. [Google Scholar] [CrossRef]
  5. Norman, G.H. Dietary nitrates, nitrites, and cardiovascular disease. Curr. Atheroscler. Rep. 2011, 13, 484–492. [Google Scholar] [CrossRef] [PubMed]
  6. Chen, Z.X.; Yin, X.B.; Liu, G.; Liu, G.J. Tracing nitrogen sources and cycle in freshwater through nitrogen and oxygen isotopic research. In Wastewater Reuse and Management; Sharma, S.K., Sanghi, R., Eds.; Springer: Dordrecht, Netherlands, 2013; p. 339. [Google Scholar]
  7. Durka, W.; Schulze, E.D.; Gebauer, G.; Voerkelius, S. Effects of forest decline on uptake and leaching of deposited nitrate determined from 15N and 18Omeasurements. Nature 1994, 372, 765–767. [Google Scholar] [CrossRef]
  8. Mayer, B.; Boyer, E.W.; Goodale, C.; Jaworski, N.A.; Breemen, N.V.; Howarth, R.W. Sources of nitrate in rivers draining sixteen watersheds in the northeastern U.S.: Isotopic constraints. Biogeochemistry 2002, 57/58, 171–197. [Google Scholar] [CrossRef]
  9. Xue, D.; Bottea, J.; de Baets, B.; Accoe, F.; Nestler, A.; Taylor, P.; van Cleemput, O.; Berglund, M.; Boeckx, P. Present limitations and future prospects of stable isotope methods for nitrate source identification in surface and groundwater. Water Res. 2009, 43, 1159–1170. [Google Scholar] [CrossRef] [PubMed]
  10. Kendall, C.; Elliott, E.M.; Wankel, S.D. Tracing anthropogenic inputs of nitrogen to ecosystems. In Stable Isotopes in Ecology and Environmental Science, 2nd ed.; Michener, R., Lajtha, K., Eds.; Blackwell Publishing Ltd.: Oxford, UK, 2007; pp. 375–449. [Google Scholar]
  11. Eddy, M.; Robbie, G.; Catherine, E.C.; Robert, M.K.; Wolfram, M. Simplifying and improving the extraction of nitrate from freshwater for stable isotope analyses. J. Environ. Monit. 2011, 13, 2062–2066. [Google Scholar] [CrossRef] [PubMed] [Green Version]
  12. Panno, S.V.; Hackley, K.C.; Kelly, W.R.; Hwang, H.H. Isotopic evidence of nitrate sources and denitrification in the Mississippi River, Illinois. J. Environ. Qual. 2006, 35, 495–504. [Google Scholar] [CrossRef] [PubMed]
  13. Panno, S.V.; Kelly, W.R.; Hackley, K.C.; Hwang, H.H.; Martinsek, A.T. Sources and fate of nitrate in the Illinois river basin, Illinois. J. Hydrol. 2008, 359, 174–188. [Google Scholar] [CrossRef]
  14. Lee, K.S.; Bong, Y.S.; Lee, D.H.; Kim, Y.J.; Kim, K.J. Tracking the sources of nitrate in the Han River watershed in Korea, using δ15N-NO3 and δ18O-NO3 values. Sci. Total Environ. 2008, 395, 117–124. [Google Scholar] [CrossRef] [PubMed]
  15. Li, S.; Liu, C.; Li, J.; Liu, X.; Chetelat, B.; Wang, B.; Wang, F. Assessment of the sources of nitrate in the Changjiang River, China using a nitrogen and oxygen isotopic approach. Environ. Sci. Technol. 2010, 144, 1573–1578. [Google Scholar] [CrossRef]
  16. Liang, X.Q.; Nie, Z.Y.; He, M.M.; Guo, R.; Zhu, C.Y.; Chen, Y.X.; Stephan, K. Application of 15N-18O double stable isotope tracer technique in an agricultural nonpoint polluted river of the Yangtze Delta Region. Eenviron. Sci. Pollut. Res. 2013, 20, 6972–6979. [Google Scholar] [CrossRef]
  17. Paerl, H.W. Nutrient and other environmental controls of harmful cyanobacterial blooms along the freshwater-marine continuum. Adv. Exp. Med. Biol. 2008, 619, 216–241. [Google Scholar]
  18. Smith, V.H. Nitrogen, phosphorus, and nitrogen fixation in lacustrine and estuarine ecosystems. Limnol. Oceanogr. 1990, 35, 1852–1859. [Google Scholar] [CrossRef]
  19. Chen, Y.; Qin, B.; Teubner, K.; Dokulil, M.T. Longterm dynamics of phytoplankton assemblages: Microcystis-domination in Lake Taihu, a large shallow lake in China. J. Plankton Res. 2003, 25, 445–453. [Google Scholar] [CrossRef]
  20. Qin, B.; Xu, P.; Wu, Q.; Luo, L.; Zhang, Y. Environmental issues of Lake Taihu, China. Hydrobiologia 2007, 581, 3–14. [Google Scholar] [CrossRef]
  21. Qin, B.; Zhu, G.; Gao, G.; Zhang, Y.; Li, W.; Paerl, H.W.; Carmichael, W.W. A drinking water crisis in Lake Taihu, China: Linkage to climatic variability and lake management. Environ. Manag. 2010, 45, 105–112. [Google Scholar] [CrossRef]
  22. Huang, W.; Zhang, X.; Zhu, Z.; Hao, Y. Monitoring pollutant ingoing gross of rivers in Taihu valley of Jiangsu province. Environ. Monit. China 2005, 21, 52–55. (In Chinese) [Google Scholar]
  23. Townsend-Small, A.; McCarthy, M.J.; Brandes, J.A.; Yang, L.; Zhang, L.; Gardner, W.S. Stable isotopic composition of nitrate in Lake Taihu, China, and major inflow rivers. Hydrobiologia 2007, 581, 135–140. [Google Scholar] [CrossRef]
  24. Chen, Z.; Liu, G.; Liu, W.; Lam, M.H.W.; Liu, G.; Yin, X. Identification of nitrate sources in Taihu Lake and its major inflow rivers in China, using δ15N-NO3 and δ18O-NO3 values. Water Sci. Technol. 2012, 66, 536–542. [Google Scholar] [CrossRef] [PubMed]
  25. Yang, S.; Liu, P. Strategy of water pollution prevention in Taihu Lake and its effects analysis. J. Great Lakes Res. 2010, 36, 150–158. [Google Scholar] [CrossRef]
  26. The Statistical Bureau of Jiangsu Province. Jiangsu Statistical Yearbook. 2013. Available online: http://www.jssb.gov.cn/2014nj/nj20.htm (accessed on 25 November 2014). [Google Scholar]
  27. Lis, G.P.; Wassenaar, L.I.; Hendry, M.J. High-precision laser spectroscopy D/H and 18O/16O measurements of microliter natural water samples. Anal. Chem. 2008, 80, 287–293. [Google Scholar] [CrossRef] [PubMed]
  28. Wassenaar, L.I.; van Wilgenburg, S.L.; Larson, K.; Hobson, K.A. A groundwater isoscape (δD, δ18O) for Mexico. J. Geochem. Explor. 2009, 102, 123–136. [Google Scholar] [CrossRef]
  29. McIlvin, M.R.; Altabet, M.A. Chemical conversion of nitrate and nitrite to nitrous oxide for nitrogen and oxygen isotopic analysis in freshwater and seawater. Anal. Chem. 2005, 77, 5589–5595. [Google Scholar] [CrossRef] [PubMed]
  30. Lee, K.S.; Kim, J.M.; Lee, D.R.; Kim, Y.; Lee, D. Analysis of water movement through an unsaturated soil zone in Jeju Island, Korea using stable oxygen and hydrogen isotopes. J. Hydrol. 2007, 345, 199–211. [Google Scholar] [CrossRef]
  31. Chen, F.; Jia, G.; Chen, J. Nitrate sources and watershed denitrification inferred from nitrate dual isotopes in the Beijiang River, South China. Biogeochemistry 2009, 94, 163–174. [Google Scholar] [CrossRef]
  32. Chang, C.C.Y.; Kendall, C.; Silva, S.R.; Battaglin, W.A.; Campbell, D.H. Nitrate stable isotopes: Tools for determining nitrate sources among different land uses in the Mississippi River Basin. Can. J. Fish. Aquat. Sci. 2002, 59, 1874–1885. [Google Scholar] [CrossRef]
  33. Silva, S.R.; Ging, P.B.; Lee, R.W.; Ebbert, J.C.; Tesoriero, A.J.; Inkpen, E.L. Forensic applications of nitrogen and oxygen isotopes in tracing nitrate sources in urban environments. Environ. Forensics 2002, 3, 125–130. [Google Scholar] [CrossRef]
  34. Mayer, B.; Bollwerk, S.M.; Mansfeldt, T.; Hutter, B.; Veizer, J. The oxygen isotope composition of nitrate generated by nitrification in acid forest floors. Geochim. Cosmochim. Acta 2001, 65, 2743–2756. [Google Scholar] [CrossRef]
  35. Mayer, B.; Wassenaar, L.I. Isotopic characterization of nitrate sources and transformations in Lake Winnipeg and its contributing rivers, Manitoba, Canada. J. Great Lakes Res. 2012, 38, 135–146. [Google Scholar] [CrossRef]
  36. Mengis, M.; Schiff, S.L.; Harris, M.; English, M.C.; Aravena, R.; Elgood, R.J.; MacLean, A. Multiple geochemical and isotopic approaches for assessing groundwater NO3 elimination in a riparian zone. Ground Water 1999, 37, 448–457. [Google Scholar] [CrossRef]
  37. Granger, J.; Sigman, D.M.; Needoba, J.A.; Harrison, P.J. Coupled nitrogen and oxygenisotope fractionation of nitrate during assimilation by cultures of marine phytoplankton. Limnol. Oceanogr. 2004, 49, 1763–1773. [Google Scholar] [CrossRef]
  38. Fukada, T.; Hiscock, K.M.; Dennis, P.F.; Grischek, T. A dual isotope approach to identify denitrification in groundwater at a river-bank infiltration site. Water Res. 2003, 37, 3070–3078. [Google Scholar] [CrossRef] [PubMed]
  39. Böttcher, J.; Strebel, O.; Voerkelius, S.; Schmidt, H.L. Using isotope fractionation of nitrate-nitrogen and nitrate-oxygen for evaluation of microbial denitrification in a sandy aquifer. J. Hydrol. 1990, 114, 413–424. [Google Scholar] [CrossRef]
  40. Zhang, B.; Du, Y.Y.; Chen, Y.W.; Zhang, L. Denitrification in sediments of typical rivers in Taihu Basin. Acta Sci. Circumstantiae 2012, 32, 1866–1873. (In Chinese) [Google Scholar]
  41. Phillips, D.L.; Koch, P.L. Incorporating concentration dependence in stable isotope mixing models. Oecologica 2002, 130, 114–125. [Google Scholar] [CrossRef]

