3.1. Hydraulic Function
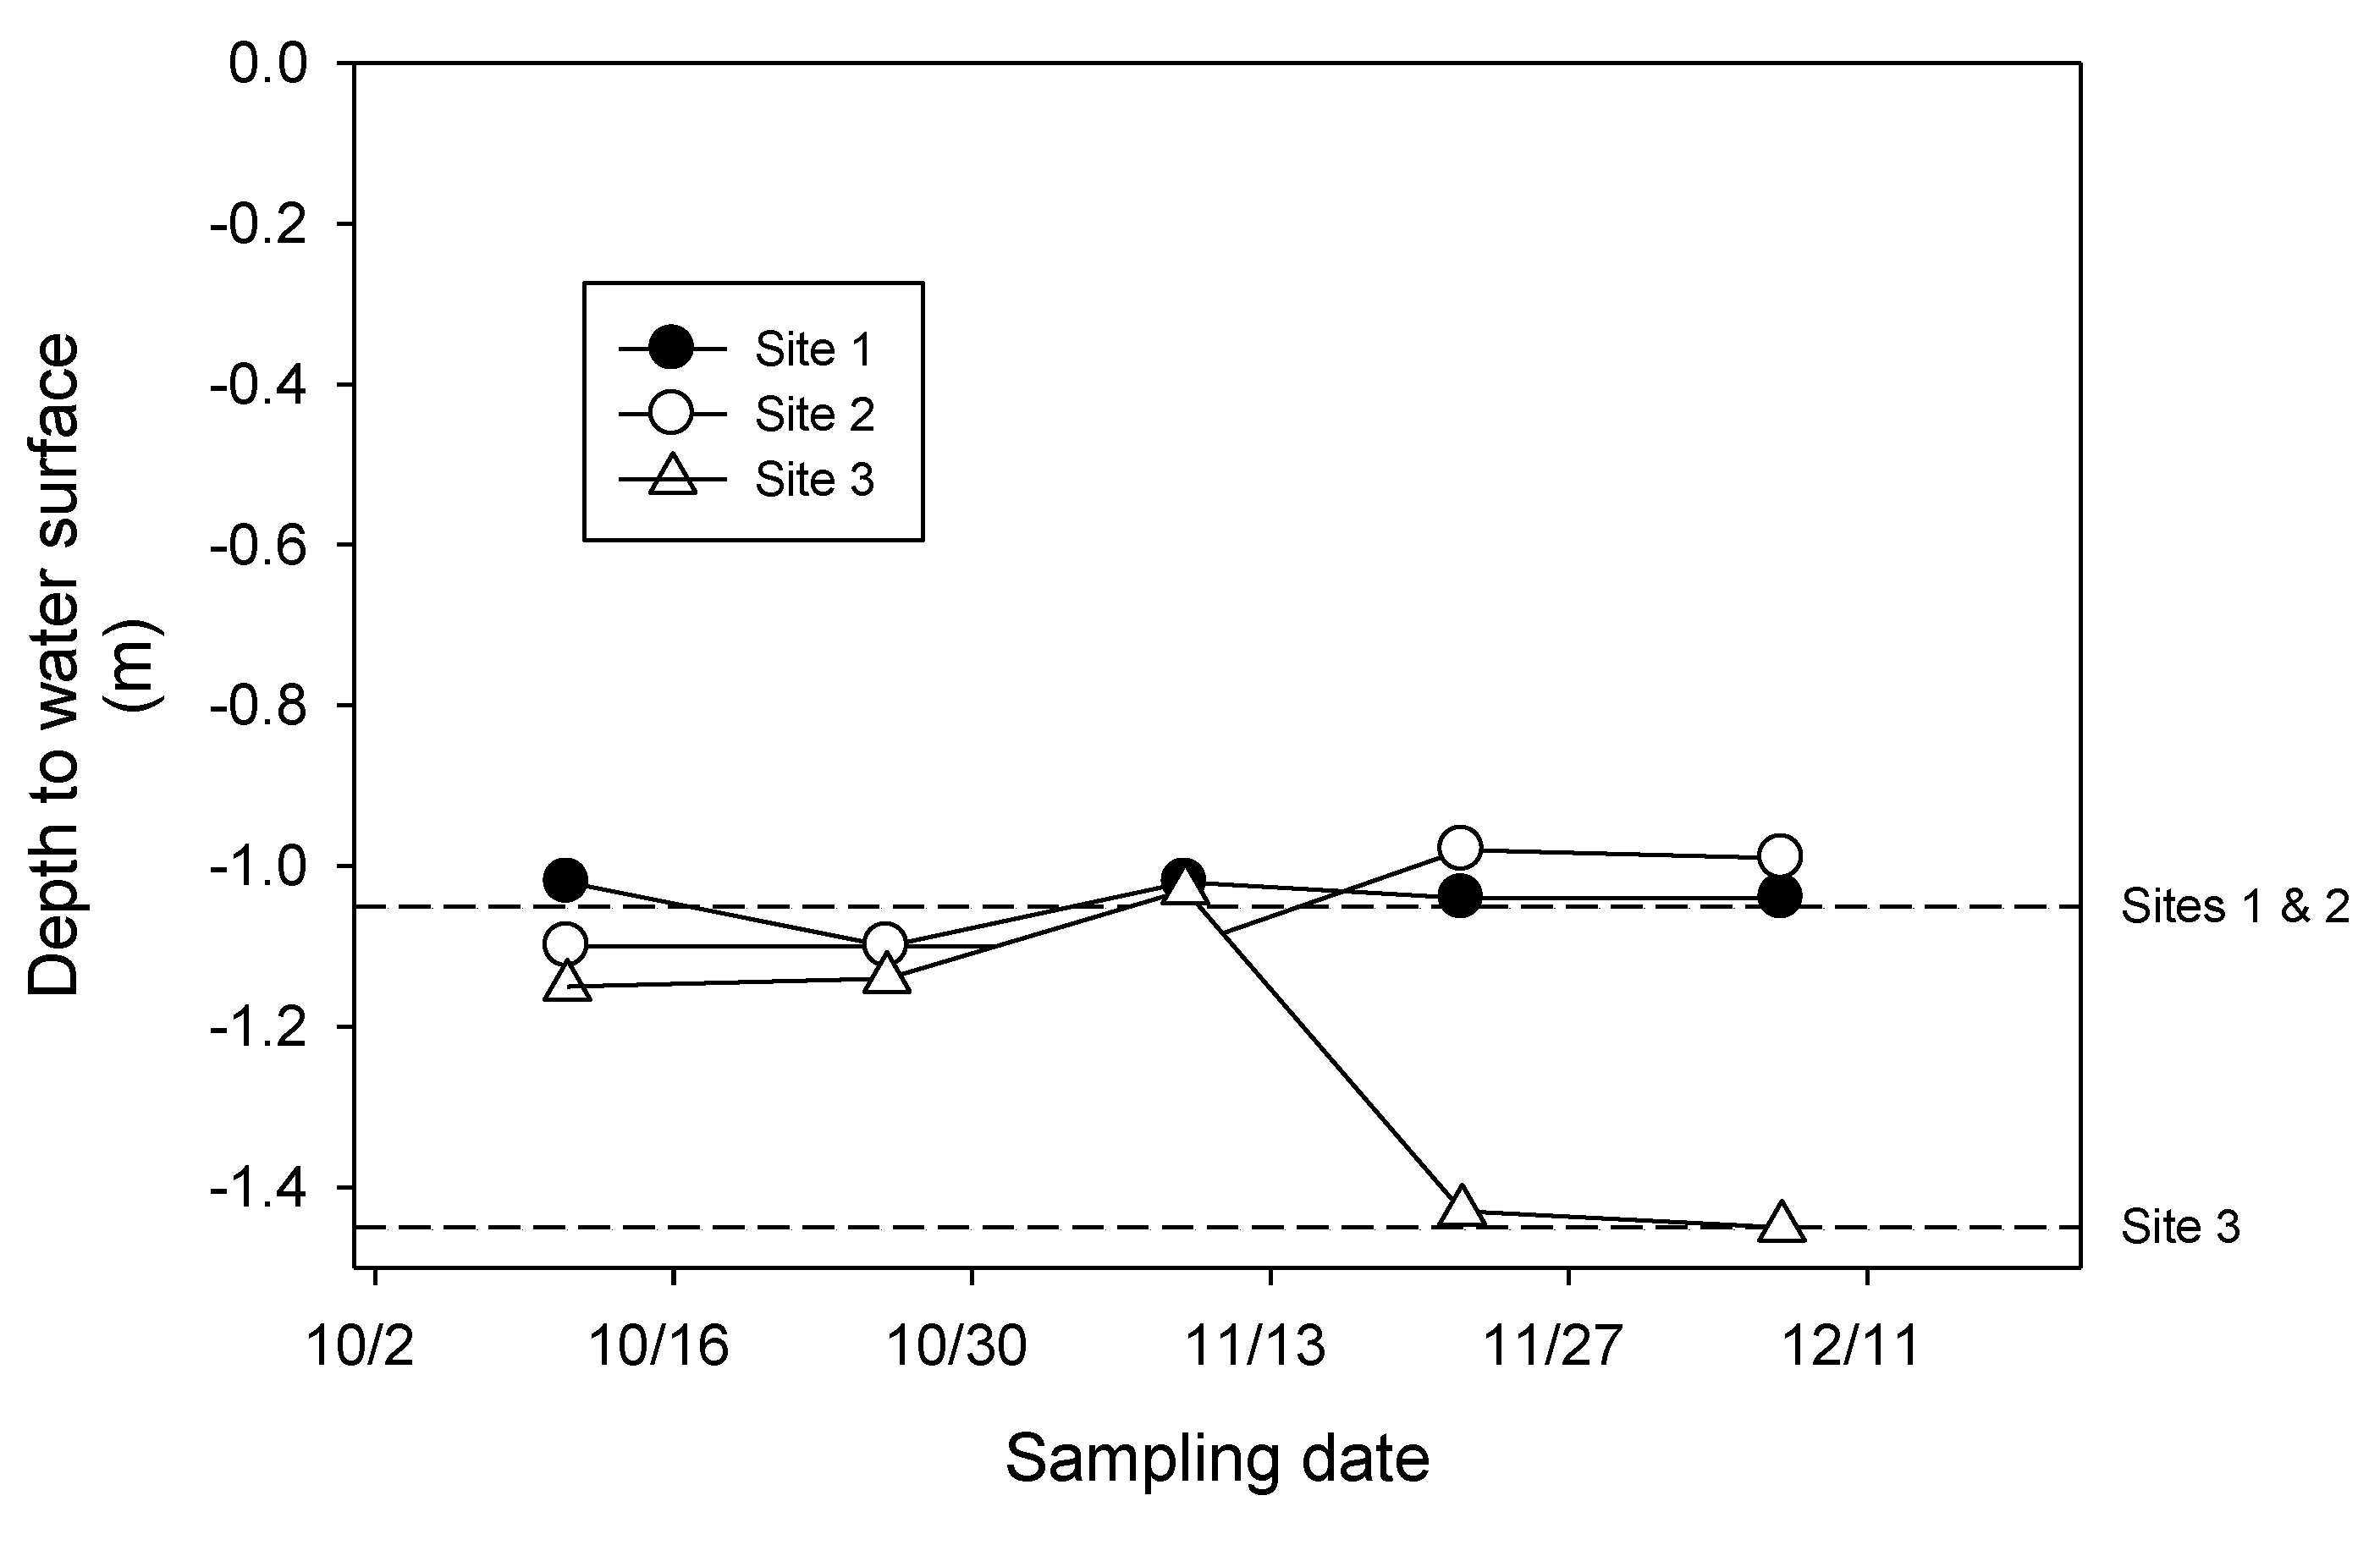
All three systems were in hydraulic failure during Phase I, as indicated by STE levels that were considerably above the outlet pipe invert in the D-box and/or the STA not accepting effluent from the septic tank. Once ISA was in operation, measurements of depth to the water surface within the D-box suggest that the hydraulic load at all three sites infiltrated readily, as indicated by the relatively constant values of depth to water surface (
Figure 3). Levels of STE were at the D-box outlet pipe inverts during Phase II in all cases. Depth values for Site 3 during the early part of Phase II were affected by an increased hydraulic load from a leaking toilet. Variations in depth to the water surface within a site are the result of differences in timing of measurements relative to dosing events.
Hydraulic failure, which was experienced at all three sites prior to implementation of ISA, results from a combination of factors, including hydraulic overload and/or longer periods of saturation resulting from overloading, which results in a biomat that is increasingly restrictive to STE infiltration. The biomat is thought to form from accumulation of suspended solids and organic debris released by microorganisms under anaerobic conditions, which results in a shift towards smaller pore sizes, restricting infiltration [
2]. Fine mineral particles present in STE are trapped within this organic matrix, further restricting infiltration. The thickness of the biomat, and thus its infiltrative capacity, is the net result of microbial processes that produce organic polymers and those that consume it, with production favored under saturated, anaerobic conditions, and consumption favored under unsaturated, aerobic conditions. As such, intermittent aeration of the STA would be expected to enhance infiltration by promoting aerobic conditions that support microbial oxidation of organic polymers in the biomat.
Figure 3.
Depth to water surface in the distribution box (D-box) at Sites 1, 2 and 3 during operation of the intermittent soil aeration system. Values indicate distance below the ground surface. Dashed line indicates depth to invert at each site. Depth values for Site 3 during the early part of Phase II were affected by an increased hydraulic load from a leaking toilet.
3.2. Water Quality
Levels of DO in STE were below detection limits at all three sites. Mean (n = 27) values of BOD
5 were 309, 365 and 202 mg/L for Sites 1, 2 and 3. These and other water quality parameter values for STE (
Table 3) were in the range of those reported by others [
11].
The pH of water below the infiltrative surface was not significantly different between Phase I and Phase II regardless of sampling depth or location at any of the test sites (
Table 3). In those instances where Fe
2+ was present prior to intermittent soil aeration (Phase I), the levels decreased while the ISA was operational, with statistically significant differences observed in most cases (
Table 3). Levels of sulfate were not significantly different between Phase I and Phase II at any of the test sites, regardless of sampling depth or position (data not shown).
There was no statistically significant difference in concentration of total P (
Table 3) and PO
4 (data not shown) in soil pore water before and during intermittent soil aeration. No significant differences in DOC concentration were observed between Phase I and Phase II at Site 1 or Site 3 (
Table 3). By contrast, the concentration of DOC was significantly lower in water from 30 and 90 cm below the infiltrative surface at Site 2 during Phase II (
Table 3).
The concentration of total N responded differently to intermittent soil aeration at the three sites. At Site 1 there was a significant increase in total N in soil pore water at 90 cm between Phase I and Phase II, from 12 to 24 and 9 to 20 mg N/L for C2 and C3, respectively (
Table 3). These increases were observed despite the fact that the concentration of total N in STE inputs did not change (
Table 3), although the load of N per unit area was higher as a result of increase hydraulic load. By contrast, there were no significant differences between Phase I and II in total N levels at 30 or 90 cm in either Site 2 or Site 3 (
Table 3). Levels of NO
3 and NH
4 in soil pore water below the infiltrative surface were not significantly different between Phase I and Phase II regardless of sampling depth, position or test site. The relative distribution of inorganic N species differed among study sites during both phases of the experiment. Nitrate generally accounted for >90% of inorganic N at Sites 1 and 2, whereas at Site 3, NH
4 accounted for the bulk of the inorganic N in soil pore water. Previous studies of the composition of soil pore water below the infiltrative surface of conventional OWTS report that NO
3 accounts for 80 to 90% of inorganic N [
12,
13].
Table 3.
Values (mean ± S.D.) of Cl-, pH, Fe(II), total N, NO3, total P and dissolved organic carbon (DOC) in STE and in soil pore water at Site 1, 2 and 3 prior to (Phase I) and during (Phase II) operation of intermittent aeration. n ≤ 12 for Phase I; n ≤ 15 for Phase II. Units are mg/L except for pH. Values in bold indicate significant difference between Phase I and Phase II.
| Site | Parameter | Phase | STE | C2-30 | C2-90 | C3-30 | C3-90 |
|---|
| 1 | Cl- | I | 341 ± 129 | 27 ± 35 | 46 ± 31 | 27 ± 23 | 19 ± 13 |
| | | II | 323 ± 128 | 39 ± 45 | 135 ± 40 | 96 ± 93 | 115 ± 77 |
| | pH | I | 6.7 ± 0.2 | 6.2 ± 0.5 | 6.2 ± 0.5 | 6.2 ± 0.6 | 6.2 ± 0.6 |
| | | II | 6.7 ± 0.3 | 6.1 ± 0.6 | 5.8 ± 0.5 | 6.0 ± 0.5 | 5.9 ± 0.5 |
| | Fe2+ | I | 0 ± 0 | 1 ± 1 | 1 ± 0 | 0 ± 0 | 1 ± 0 |
| | | II | 0 ± 0 | 0 ± 0 | 0 ± 0 | 0 ± 0 | 0 ± 0 |
| | Total N | I | 41 ± 8 | 14 ± 3 | 12 ± 7 | 15 ± 6 | 9 ± 1 |
| | | II | 47 ± 7 | 14 ± 9 | 24 ± 9 | 20 ± 13 | 20 ± 7 |
| | NH4 | I | 23 ± 7 | 3 ± 3 | 1 ± 1 | 1 ± 1 | 1 ± 1 |
| | | II | 26 ± 5 | 0 ± 0 | 0 ± 0 | 1 ± 1 | 1 ± 3 |
| | NO3 | I | 0 ± 0 | 8 ± 6 | 8 ± 6 | 12 ± 5 | 7 ± 1 |
| | | II | 1 ± 1 | 8 ± 7 | 12 ± 6 | 9 ± 8 | 11 ± 7 |
| | Total P | I | 12 ± 5 | 2 ± 1 | 2 ± 1 | 2 ± 1 | 2 ± 1 |
| | | II | 13 ± 2 | 3 ± 2 | 3 ± 1 | 3 ± 2 | 4 ± 2 |
| | DOC | I | 106 ± 24 | 12 ± 11 | 4 ± 2 | 5 ± 3 | 2 ± 3 |
| | | II | 118 ± 20 | 3 ± 3 | 2 ± 5 | 2 ± 3 | 6 ± 5 |
| 2 | Cl- | I | 49 ± 20 | 42 ± 6 | 41 ± 5 | 2 ± 2 | 14 ± 14 |
| | | II | 45 ± 5 | 42 ± 16 | 41 ± 13 | 5 ± 7 | 15 ± 9 |
| | pH | I | 6.6 ± 0.1 | 6.7 ± 0.2 | 6.5 ± 0.1 | 6.7 ± 0.2 | 6.5 ± 0.3 |
| | | II | 6.6 ± 0.2 | 6.5 ± 0.2 | 6.5 ± 0.2 | 6.9 ± 0.1 | 6.5 ± 0.5 |
| | Fe2+ | I | 0 ± 0 | 9 ± 1 | 0 ± 0 | 0 ± 0 | 0 ± 0 |
| | | II | 0 ± 0 | 2 ± 1 | 0 ± 0 | 0 ± 0 | 0 ± 0 |
| | Total N | I | 41 ± 7 | 37 ± 8 | 30 ± 6 | 14 ± 9 | 21 ± 9 |
| | | II | 40 ± 7 | 32 ± 11 | 33 ± 4 | 18 ± 15 | 14 ± 9 |
| | NH4 | I | 21 ± 4 | 20 ± 9 | 1 ± 1 | 0 ± 0 | 0 ± 0 |
| | | II | 22 ± 4 | 20 ± 8 | 1 ± 1 | 0 ± 0 | 0 ± 0 |
| | NO3 | I | 0 ± 0 | 9 ± 4 | 22 ± 7 | 9 ± 7 | 12 ± 6 |
| | | II | 0 ± 0 | 1 ± 1 | 19 ± 6 | 5 ± 4 | 5 ± 4 |
| | Total P | I | 9 ± 4 | 7 ± 4 | 2 ± 1 | 2 ± 1 | 2 ± 1 |
| | | II | 12 ± 3 | 9 ± 2 | 3 ± 2 | 3 ± 1 | 4 ± 3 |
| | DOC | I | 105 ± 23 | 63 ± 11 | 37 ± 9 | 36 ± 3 | 6 ± 3 |
| | | II | 100 ± 16 | 67 ± 6 | 16 ± 4 | 16 ± 3 | 1 ± 2 |
| 3 | Cl- | I | 42 ± 11 | 27 ± 13 | 44 ± 10 | 41 ± 6 | 44 ± 11 |
| | | II | 115 ± 88 | 93 ± 77 | 88 ± 79 | 102 ± 88 | 117 ± 75 |
| | pH | I | 6.7 ± 0.1 | 6.5 ± 0.2 | 6.5 ± 0.1 | 6.8 ± 0.1 | 6.7 ± 0.1 |
| | | II | 6.8 ± 0.3 | 6.6 ± 0.2 | 6.6 ± 0.2 | 6.8 ± 0.2 | 6.7 ± 0.2 |
| | Fe2+ | I | 0 ± 0 | 15 ± 7 | 17 ± 9 | 4 ± 2 | 7 ± 5 |
| | | II | 0 ± 0 | 5 ± 6 | 8 ± 6 | 0 ± 0 | 0 ± 0 |
| | Total N | I | 38 ± 7 | 20 ± 3 | 26 ± 4 | 32 ± 3 | 30 ± 5 |
| | | II | 36 ± 6 | 27 ± 6 | 29 ± 9 | 27 ± 11 | 31 ± 7 |
| | NH4 | I | 24 ± 11 | 15 ± 5 | 19 ± 6 | 22 ± 7 | 21 ± 8 |
| | | II | 19 ± 6 | 18 ± 5 | 20 ± 8 | 18 ± 8 | 19 ± 9 |
| | NO3 | I | 0 ± 0 | 0 ± 0 | 0 ± 0 | 0 ± 1 | 0 ± 0 |
| | | II | 0 ± 0 | 1 ± 3 | 2 ± 1 | 1 ± 2 | 1 ± 2 |
| | Total P | I | 6 ± 2 | 3 ± 1 | 4 ± 1 | 5 ± 1 | 5 ± 2 |
| | | II | 9 ± 2 | 6 ± 2 | 6 ± 1 | 7 ± 2 | 7 ± 1 |
| | DOC | I | 77 ± 13 | 42 ± 6 | 56 ± 10 | 58 ± 6 | 57 ± 7 |
| | | II | 91 ± 25 | 58 ± 16 | 68 ± 16 | 67 ± 23 | 70 ± 15 |
Previous mesocosm-scale evaluation of the effects of intermittent soil aeration of STAs on nitrogen transformations have shown high levels of NO
3 and nearly complete absence of NH
4 in water draining below 30 cm of sand or soil, in contrast to unaerated mesocosms [
8,
14,
15]. Furthermore, drainage water from intermittently aerated mesocosms had a considerably lower pH than unaerated treatments [
8,
14,
15]. We did not observe these effects in the present study. Mesocosms provide a much greater degree of control over variables such as penetration of air, homogeneity of soil properties, movement of STE through soil—and the reproducibility of these conditions—all of which can affect the dynamics of NH
4 and NO
3 production and consumption. The effects of ISA on nitrate dynamics may have taken place at shallow depths, such that the concentrations of NH
4 and NO
3 measured at 30 or 90 cm do not provide an accurate representation of inorganic N dynamics as a result of other production and consumption processes that can take place deeper within the soil profile, such as plant uptake, and microbial mineralization and/or immobilization. Using experimental mesocosms we have shown that total N removal appears to take place within the top 7.5 cm of aerated sand [
15]. In addition, spatial and temporal variability may mask the effects of aeration on speciation of inorganic N below the STAs.
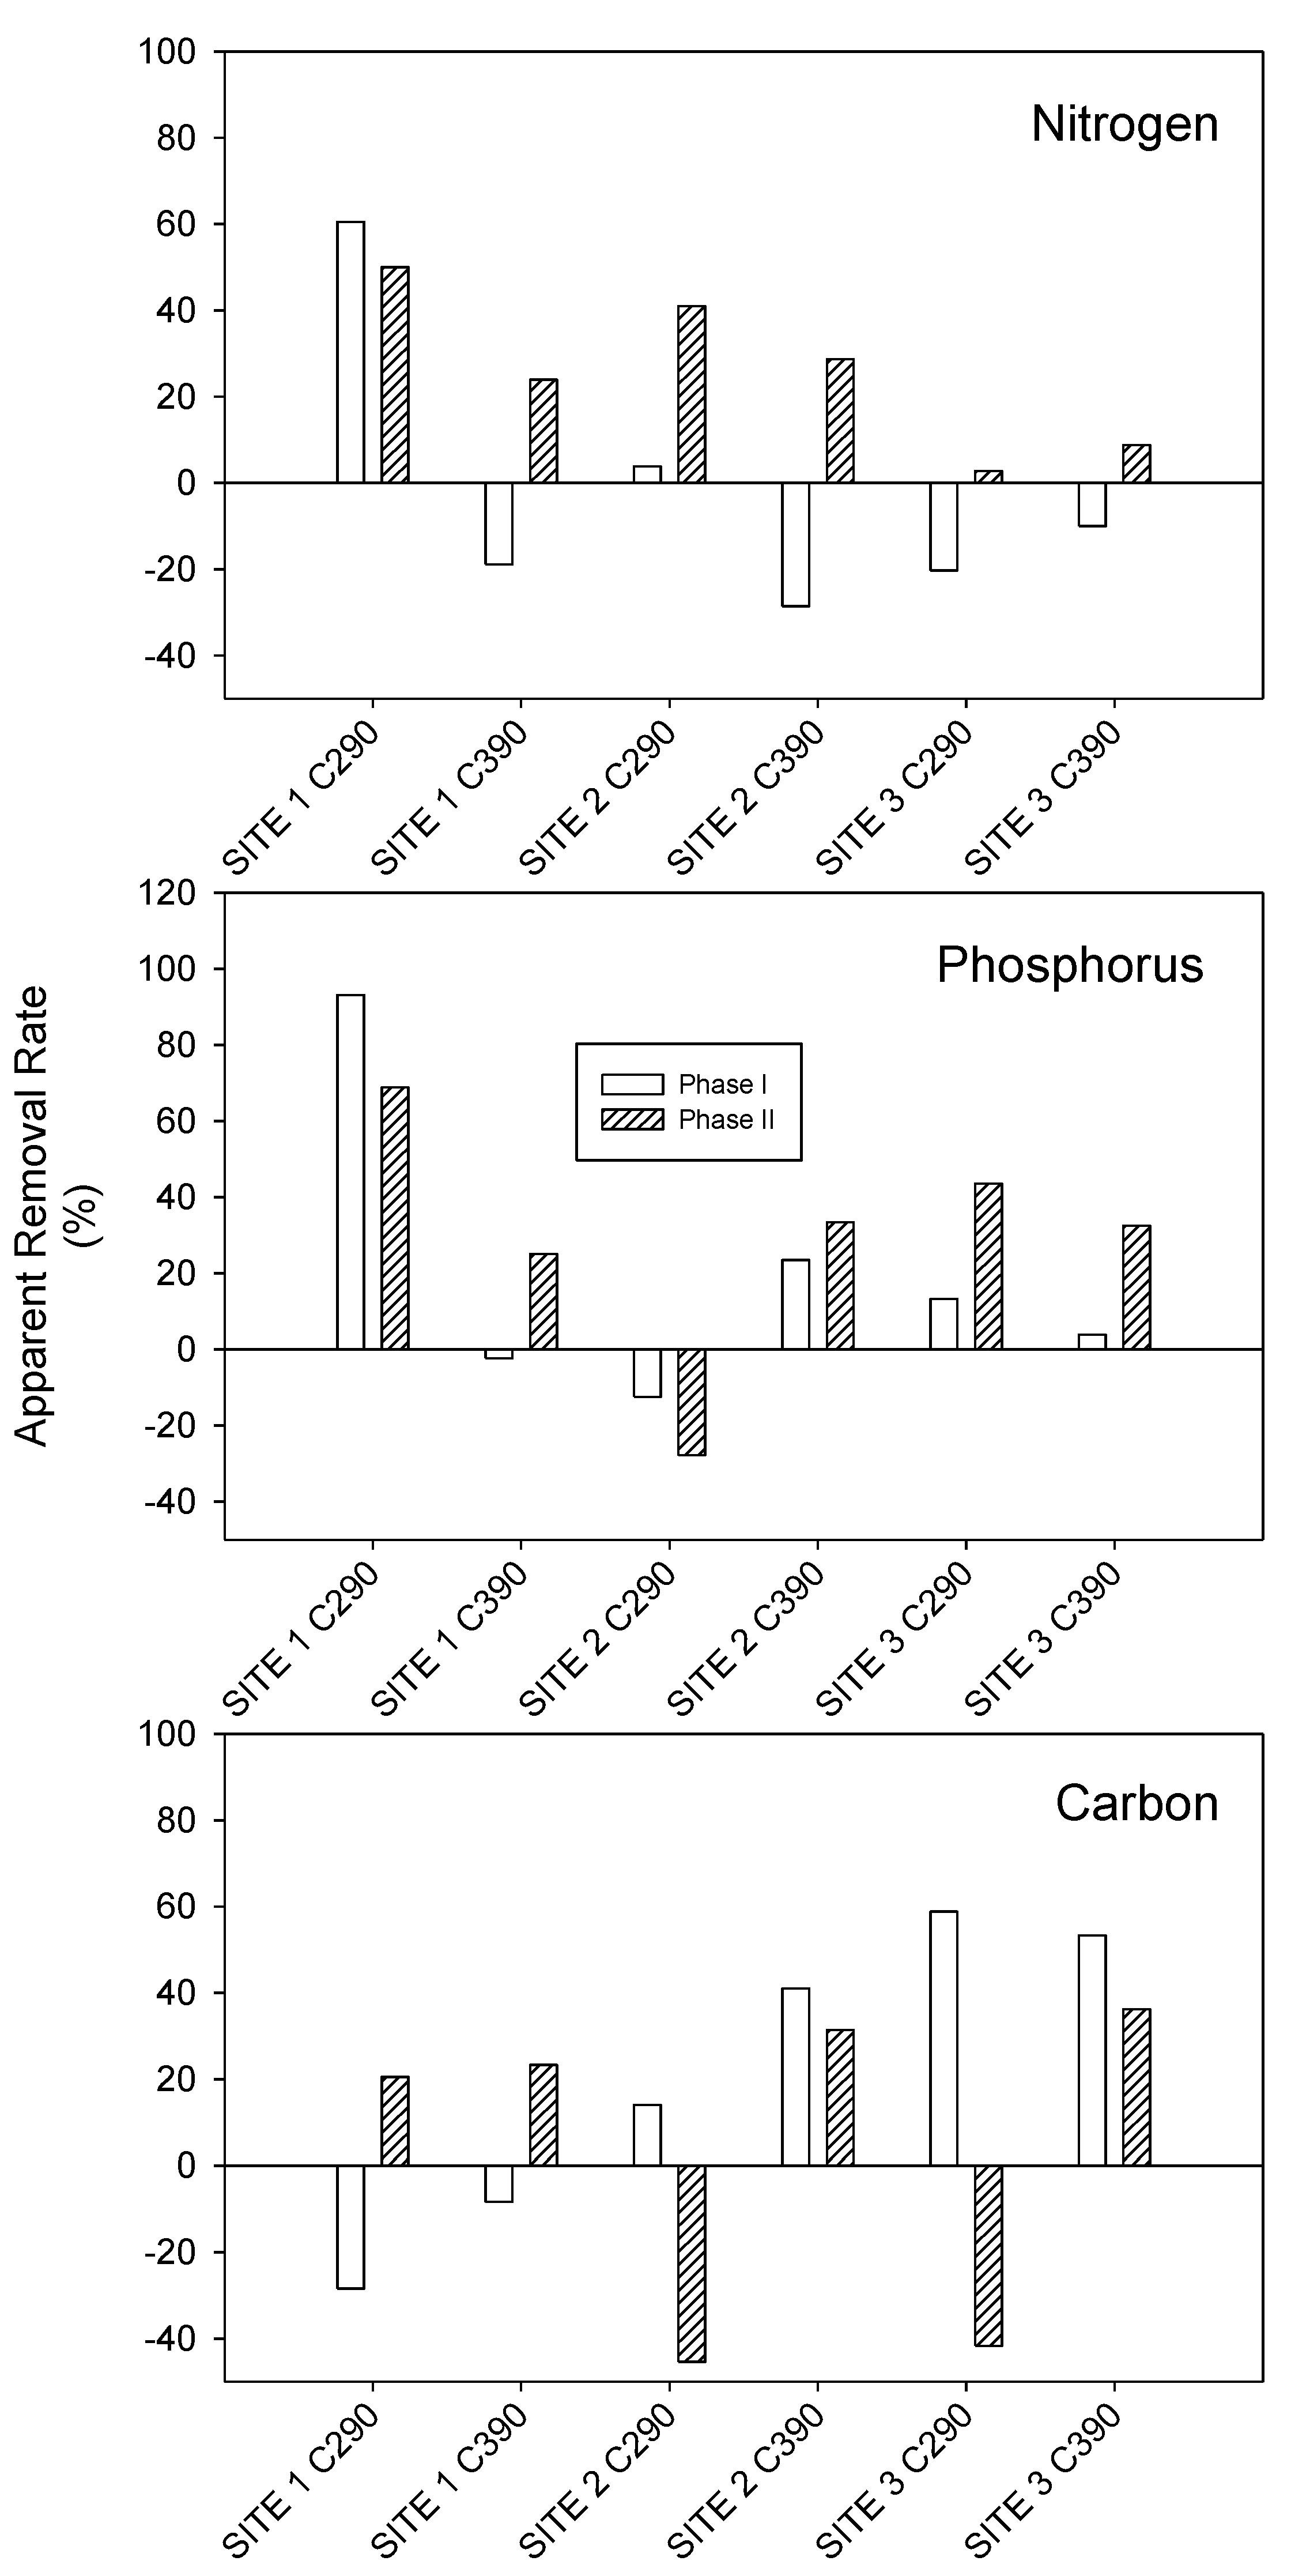
3.3. Apparent and Actual Removal of N, P and DOC
Intermittent soil aeration generally enhanced the apparent removal rates (
Rx) of N, P and DOC at all three sites (
Figure 4) despite marked reductions in nominal infiltration area (
Table 2). In most instances, mean values of
RX for total N at 90 cm below the infiltrative surface were negligible or negative (higher N levels in soil pore water relative to STE inputs) during Phase I, and became positive (lower N levels in soil pore water relative to STE inputs) during Phase II (
Figure 4). Intermittent soil aeration also increased apparent removal rates for total P, as indicated by higher values of
RX during Phase II (
Figure 4). The exception was observed at Site 2, C2, where apparent removal rates were negative during the ISA phase. Intermittent soil aeration had mixed effects on apparent rates of DOC removal (
Figure 4). During Phase I there was a higher concentration of DOC in soil pore water relative to STE inputs, whereas during intermittent soil aeration apparent removal of DOC was observed. By contrast, at Sites 2 and 3 ISA resulted in lower apparent removal rates for DOC, stemming from a higher concentration of DOC in soil pore water than in STE inputs.
Apparent removal rates do not account for two potentially important factors that affect contaminant removal in the STA: (i) differences in size of STA utilized, and (ii) dilution by ground water, precipitation or snowmelt. In the present study, reductions in treatment area (
Table 2), which would be expected to influence the effectiveness of these systems, were implemented to test the robustness of the ISA system with respect to its ability to restore hydraulic flow. Dilution of contaminants results in lower apparent concentrations, which overestimates the effectiveness of contaminant removal in the STA. Differences in Cl
− concentrations between STE and soil pore water suggest that dilution needs to be accounted for (
Table 3). To address these two issues, we calculated an actual removal rate (mass removed/area/time) using Equation 2.
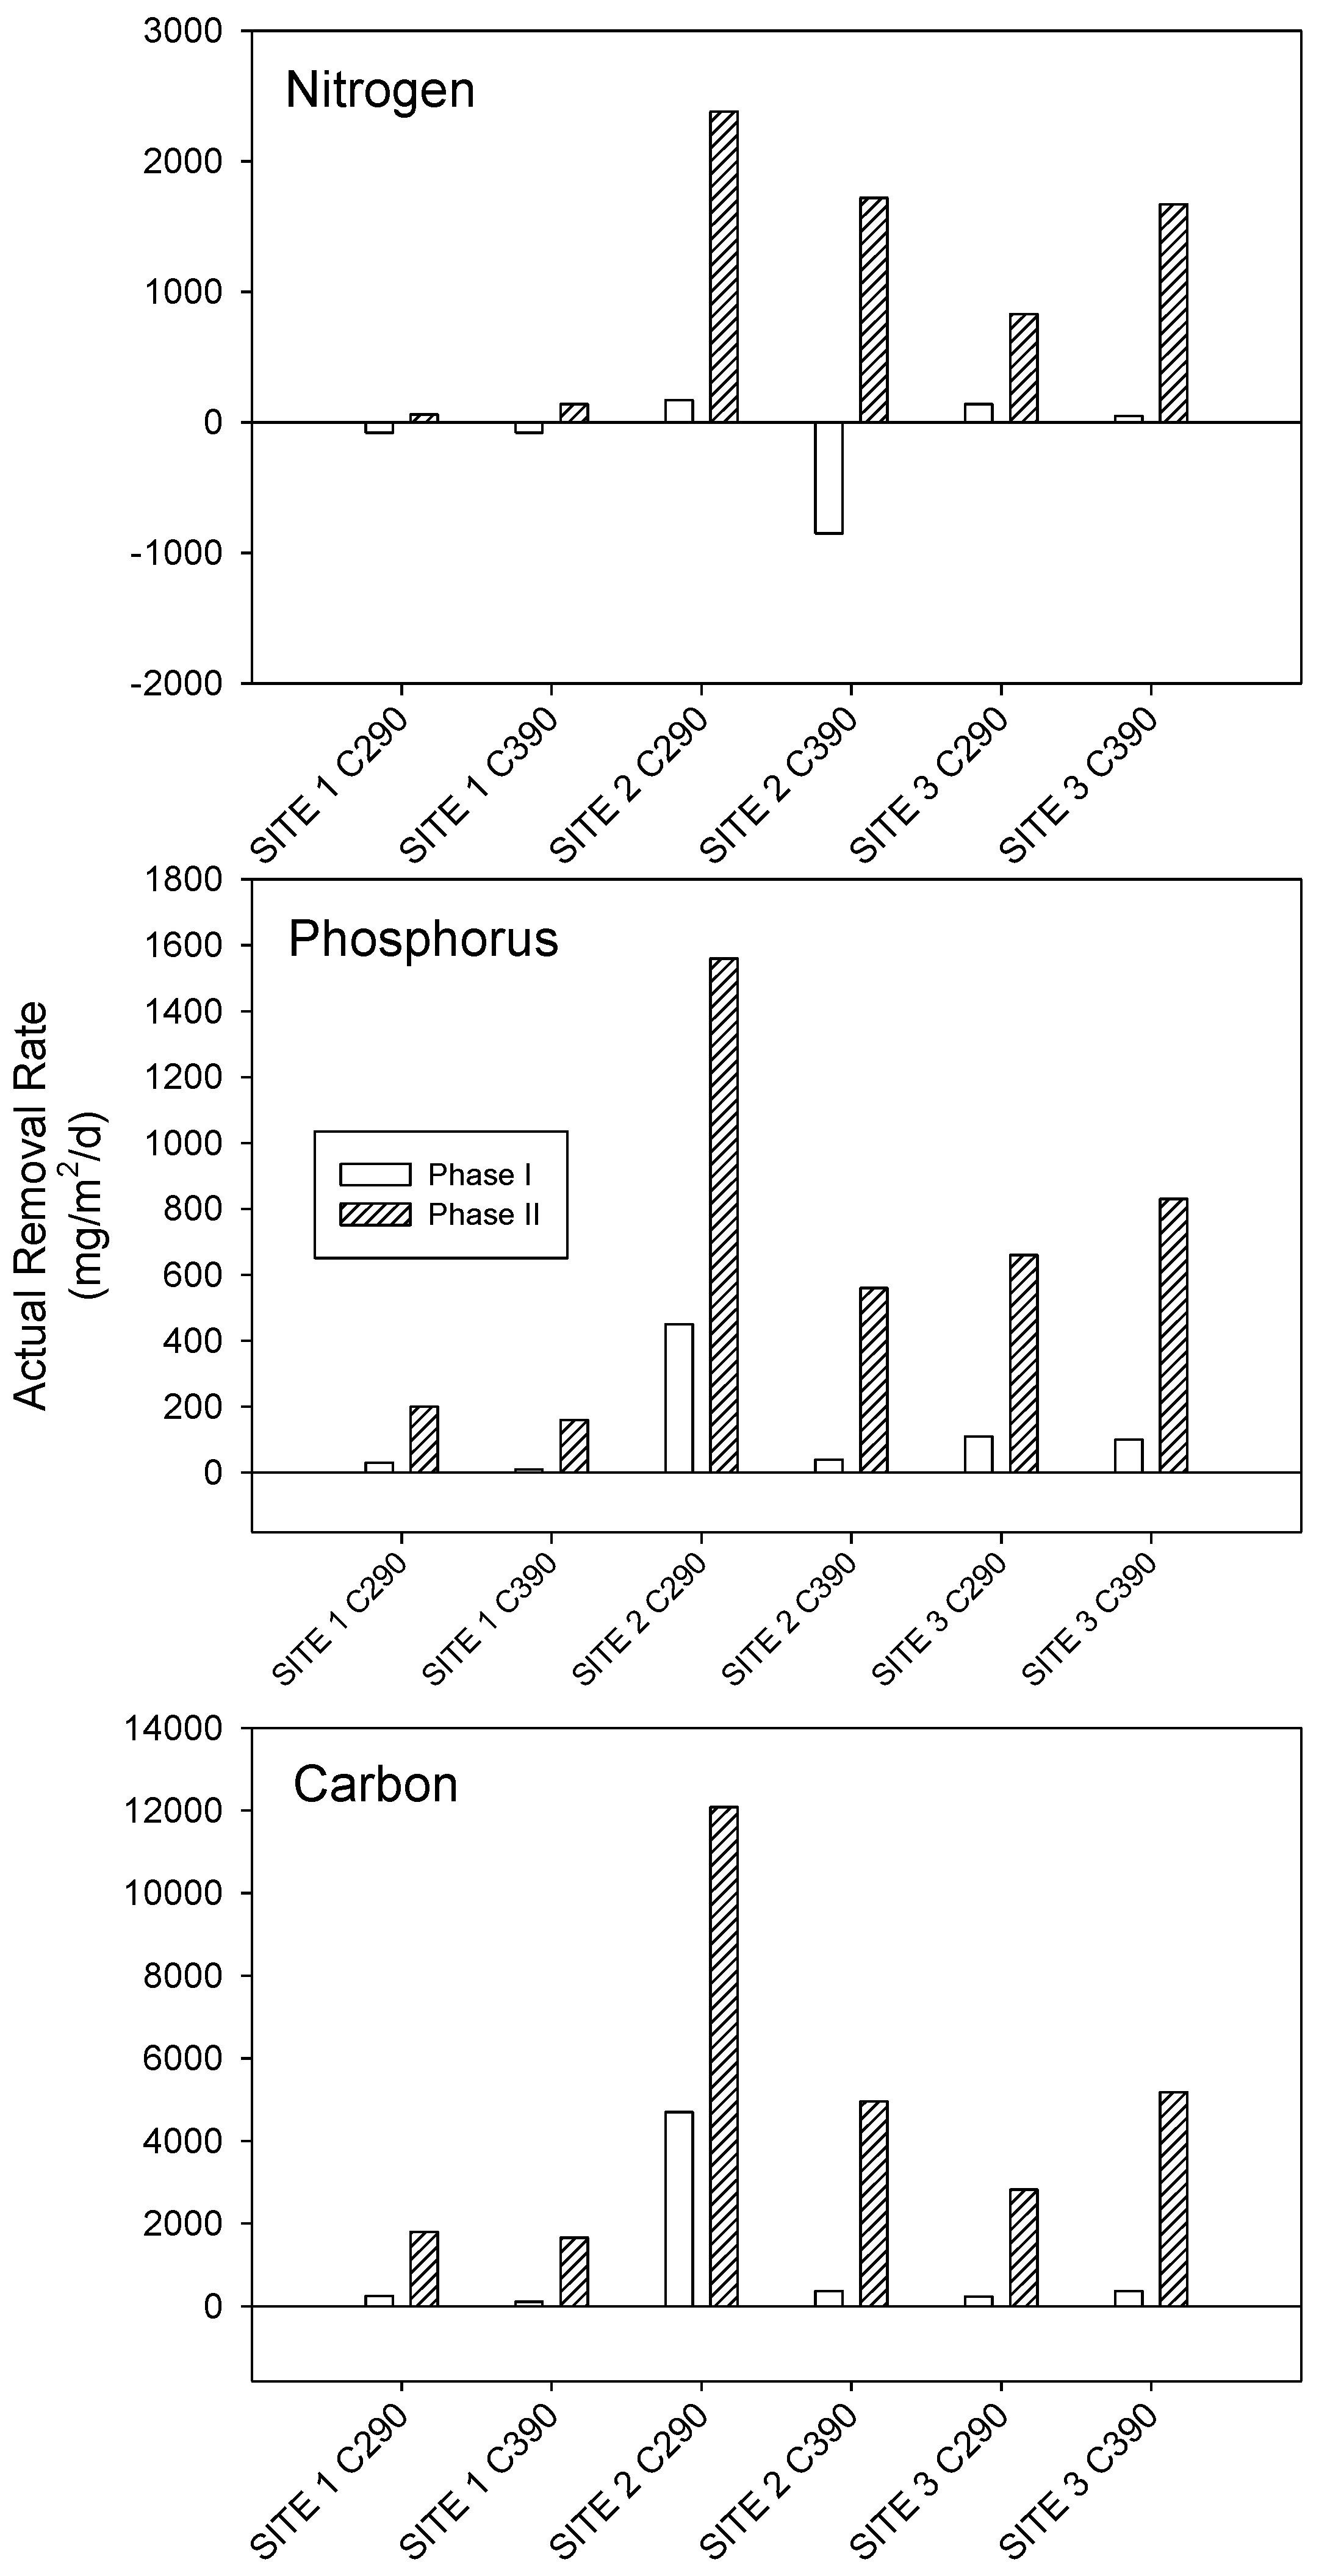
Actual removal rates for N during Phase I were relatively small, with both net production (negative values) and net removal (positive values) observed at a depth of 90 cm under the infiltrative surface (
Figure 5). By contrast, actual removal rates for N at 90 cm below the leachfield during Phase II were consistently positive and up to two orders of magnitude higher at all sites (
Figure 5). Intermittent soil aeration also resulted in higher actual P removal rates at all three sites, with values that were between 2 and 15 times higher than those observed during Phase I (
Figure 5). Similarly, actual rates of DOC removal were 4 to 10 times higher during the ISA phase than during Phase I at all three sites (
Figure 5).
Removal of total N in STA of conventional OWTS is generally low [
16,
17], owing to poor denitrification [
17]. The results of our study show that apparent N removal rates in our systems prior to intermittent aeration ranged widely, from removal of up to 60% to increases in N concentration in soil pore water of 5 to 30% above the levels in STE inputs. Literature reports on apparent N removal rates for conventional systems vary considerably, from 21% [
18], to 35% [
12], to 50% [
13]. These values are for systems receiving normal hydraulic loads, and are within the range of those observed by us prior to intermittent aeration in some instances. By contrast, the net increases in total N levels below the infiltrative surface relative to STE inputs during Phase I may be due to mineralization of nitrogenous exopolymers and dead microbial biomass accumulated within the STA, likely due to an increased hydraulic load.
The intermittent aeration of the STA (Phase II) resulted in an increase in both apparent and actual removal rates for N, P and C (
Figure 4 and
Figure 5). Actual removal values for N, P, and C under field conditions during intermittent aeration (Phase II) were comparable to those observed for mesocosm scale experiments [
8,
14]. Furthermore, values of actual N removal rates during Phase II were comparable to those observed for wood-based denitrification reactors used to treat drainage water (950 to 2500 mg N/m
2/day) [
19]. The positive effects of intermittent aeration are unlikely to be due to differences in temperature between Phase I and Phase II, inasmuch as mean temperature (as reflected in values for STE) was higher during Phase I (20.1 to 22.7
oC)) than during Phase II (16.8–17.4
oC). The rate of microbial processes, which are presumed to be involved in removal of N, P and C in these systems, is expected to decrease as temperature decreases [
20].
Figure 4.
Apparent removal rate for nitrogen, phosphorus and dissolved organic carbon at the three study sites prior to (Phase I) and during (Phase II) operation of intermittent soil aeration. Values are for lysimeters at 90 cm below the infiltrative surface placed between (C2) and downstream from (C3) leachfield trenches. Apparent removal rates were calculated according to Equation (1).
Figure 5.
Actual removal rates for nitrogen, phosphorus and dissolved organic carbon at the three study sites prior to (Phase I) and during (Phase II) operation of intermittent soil aeration. Values are for lysimeters at 90 cm below the infiltrative surface placed between (C2) and downstream from (C3) leachfield trenches. Actual removal rates were calculated using Equation (2). Negative values indicate net constituent production.
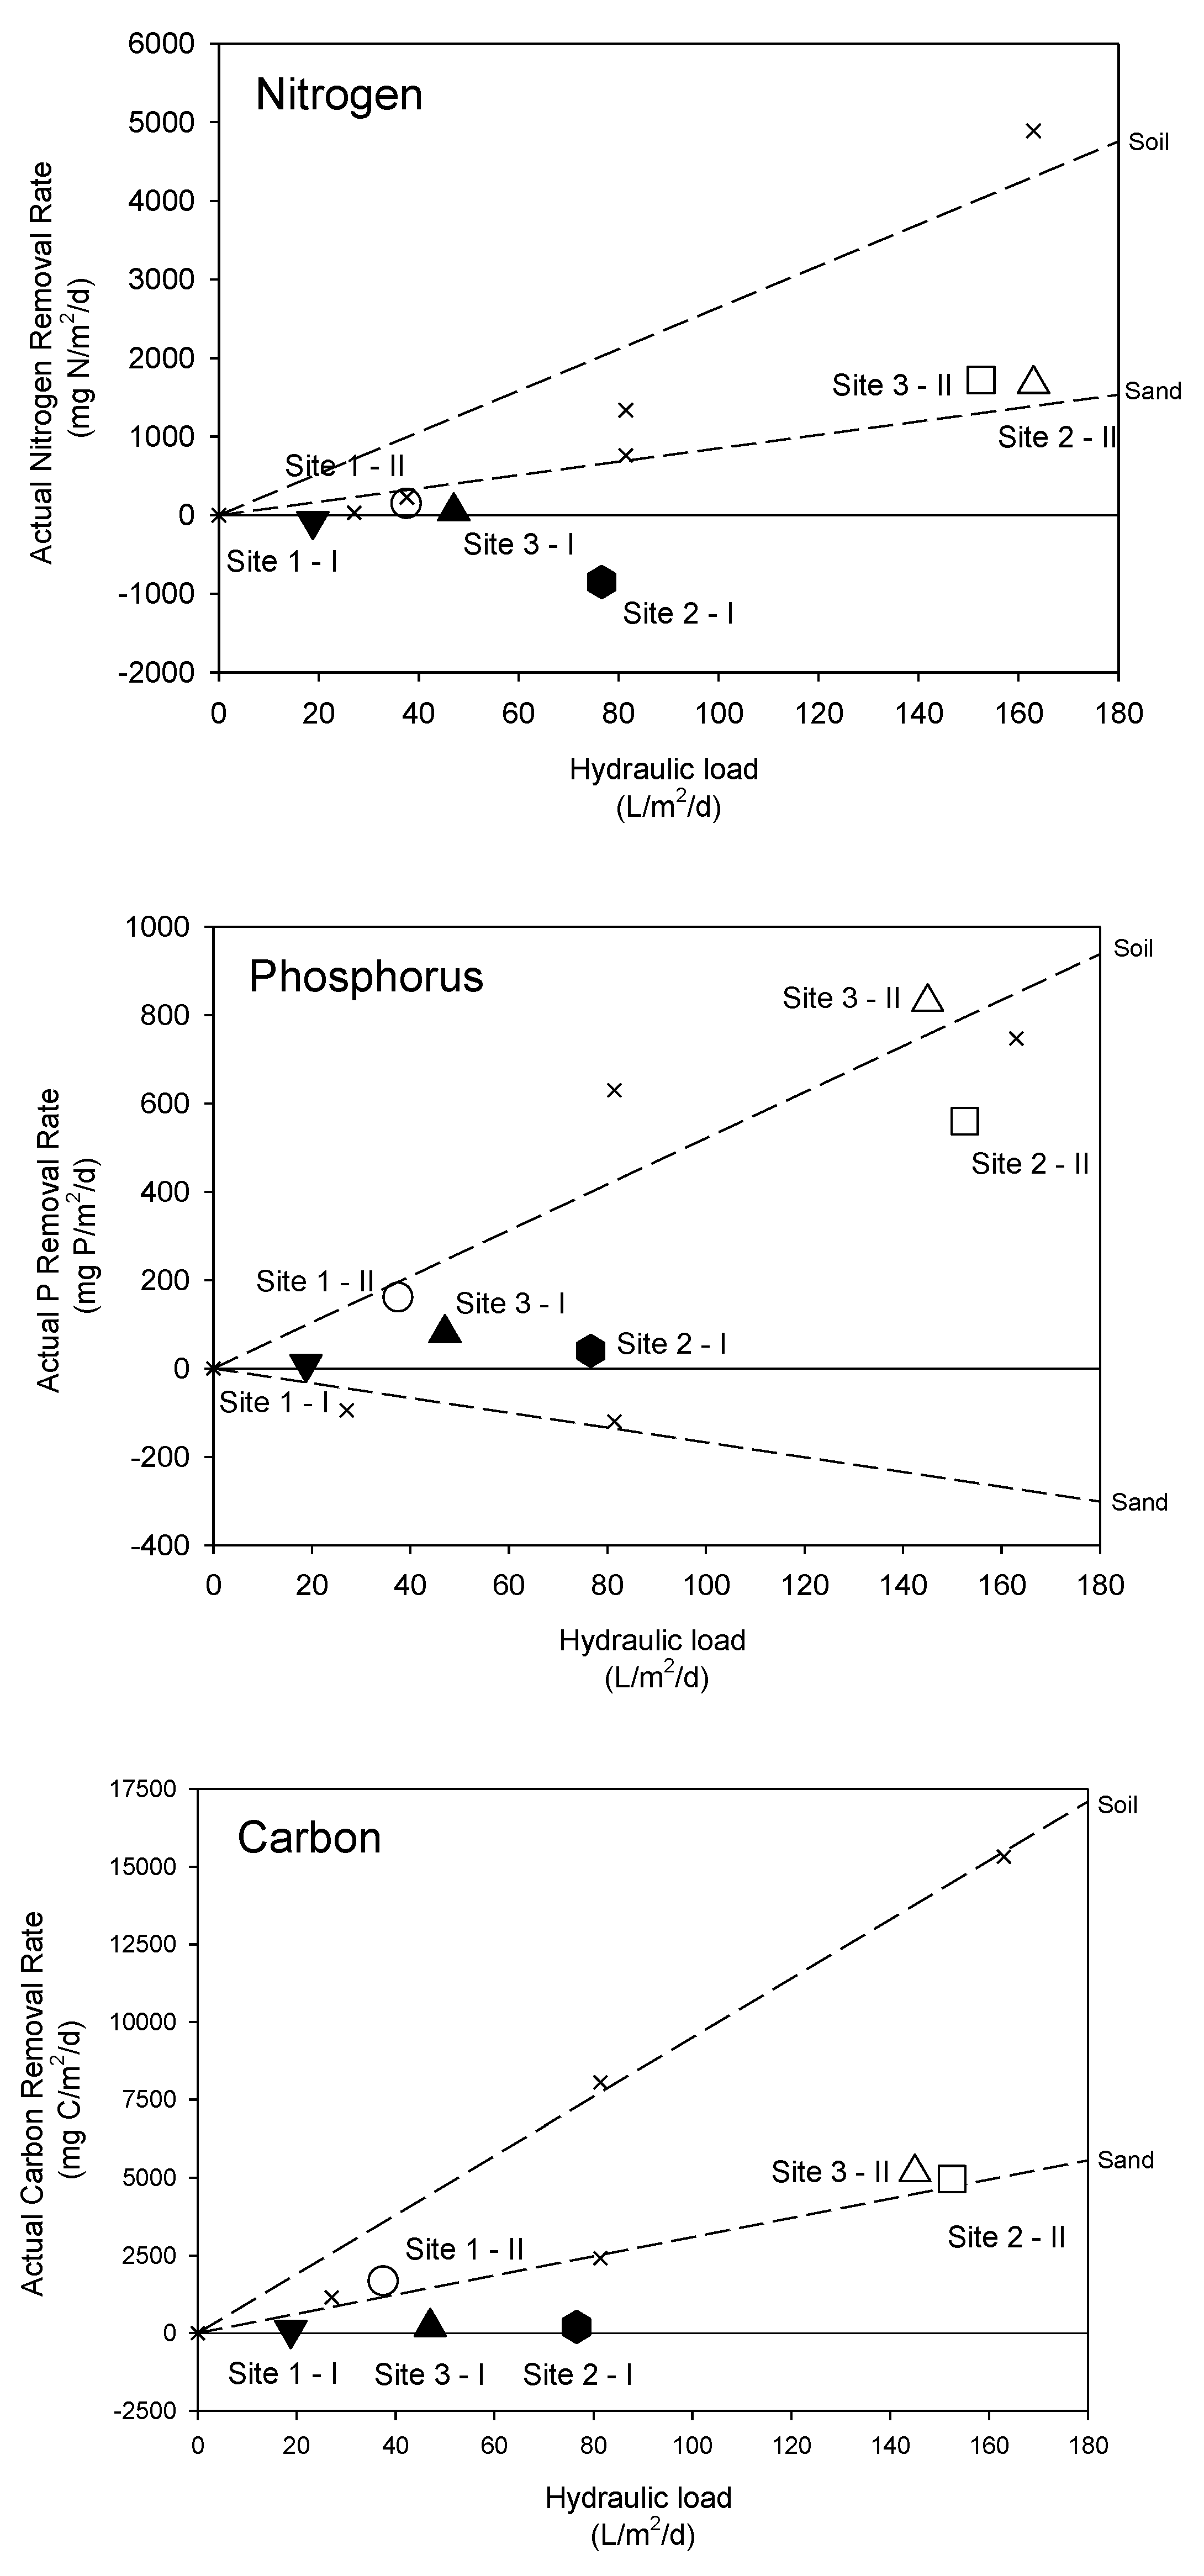
3.4. Relationship between Hydraulic Load and Removal of N, P and DOC
Differences in the effects of ISA on actual removal rates of N, DOC and P among test sites (
Figure 5) led us to examine the possibility that these effects are related to hydraulic load. In previous studies we have observed that actual nitrogen removal from STE in intermittently aerated mesocosms increased with increasing hydraulic load [
8,
14]. The differences in hydraulic load at the three sites in the present study provided an opportunity to examine the applicability of pilot-scale results to field systems.
A plot of hydraulic load
vs. actual N removal rate shows that prior to intermittent aeration, actual removal rates for N, P and C remained the same or decreased as a function of hydraulic load (
Figure 6). By contrast, actual N removal rates increased with increasing hydraulic load at the field sites. Furthermore, the actual removal rates for N were similar to those for sand-filled mesocosms. Actual removal rates for DOC for the field sites exhibited a similar relationship with hydraulic load to that observed for nitrogen, with DOC removal rates increasing with hydraulic load, and field removal rates values that were close to those reported for sand mesocosms (
Figure 6). Actual removal rates for P at the field sites also increased with hydraulic load; however, unlike N and C, these values were closer to those for soil-filled mesocosms (
Figure 6). By contrast, actual removal rates for C and P during Phase I changed little with increasing hydraulic load, and rates of N removal appeared to decrease as hydraulic load increased (
Figure 6).
In general, actual removal rates for N, P and C are expected to be inversely proportional to hydraulic loading rate because frequent saturation of the STA for long periods of time is expected to lead to anaerobic processes that are less efficient at C and nutrient removal [
21]. In our study, actual removal rates under field conditions increased with increasing hydraulic load at all sites. The response of actual removal rates to hydraulic load in the present study suggests that removal mechanisms may be similar under field and laboratory conditions. We have previously suggested that enhanced N removal with intermittent aeration of the STA stems from a sequence in which aeration promotes ammonia oxidation to nitrate in soil, with the subsequent addition of STE to soils promoting removal of N via denitrification, by providing anaerobic conditions as well as organic C sources [
8,
14]. This is similar to the processes involved in N removal from wastewater using sequencing batch reactors (SBR) [
22]. Recent studies of SBR have shown that simultaneous nitrification/denitrification can also take place in SBR [
23]. Increases in removal of N with increased hydraulic load during the ISA phase in the present study suggest that N removal is enhanced by a longer period of anaerobic conditions and/or a larger volume of anaerobic soil. Because denitrification consumes organic C, intermittent aeration of STAs should also increase C removal, and this removal should increase with increasing hydraulic load, as was the case under both field and mesocosm conditions. Phosphate removal is also enhanced in SBR, apparently as a result of phosphate uptake by polyphosphate-accumulating microorganisms during the aerobic phase [
24], which may explain enhanced P removal with increased hydraulic load.
Both C and N removal under field conditions were more similar to values observed for sand-filled mesocosms, whereas values for P removal were closer to those observed for soil-filled mesocosms (
Figure 6). This difference may be explained by differences in removal mechanisms for these three constituents. Both C and N removal—assuming it takes place primarily via denitrification—involve gaseous losses (as CO
2, N
2, and N
2O) and do not require reaction with soil minerals. By contrast, net removal of P from STE likely involves the reaction of PO
4 (released during the anaerobic phase of enhanced biological phosphorus removal) with soil minerals, which were absent in the synthetic sand used in mesocosm studies [
8].
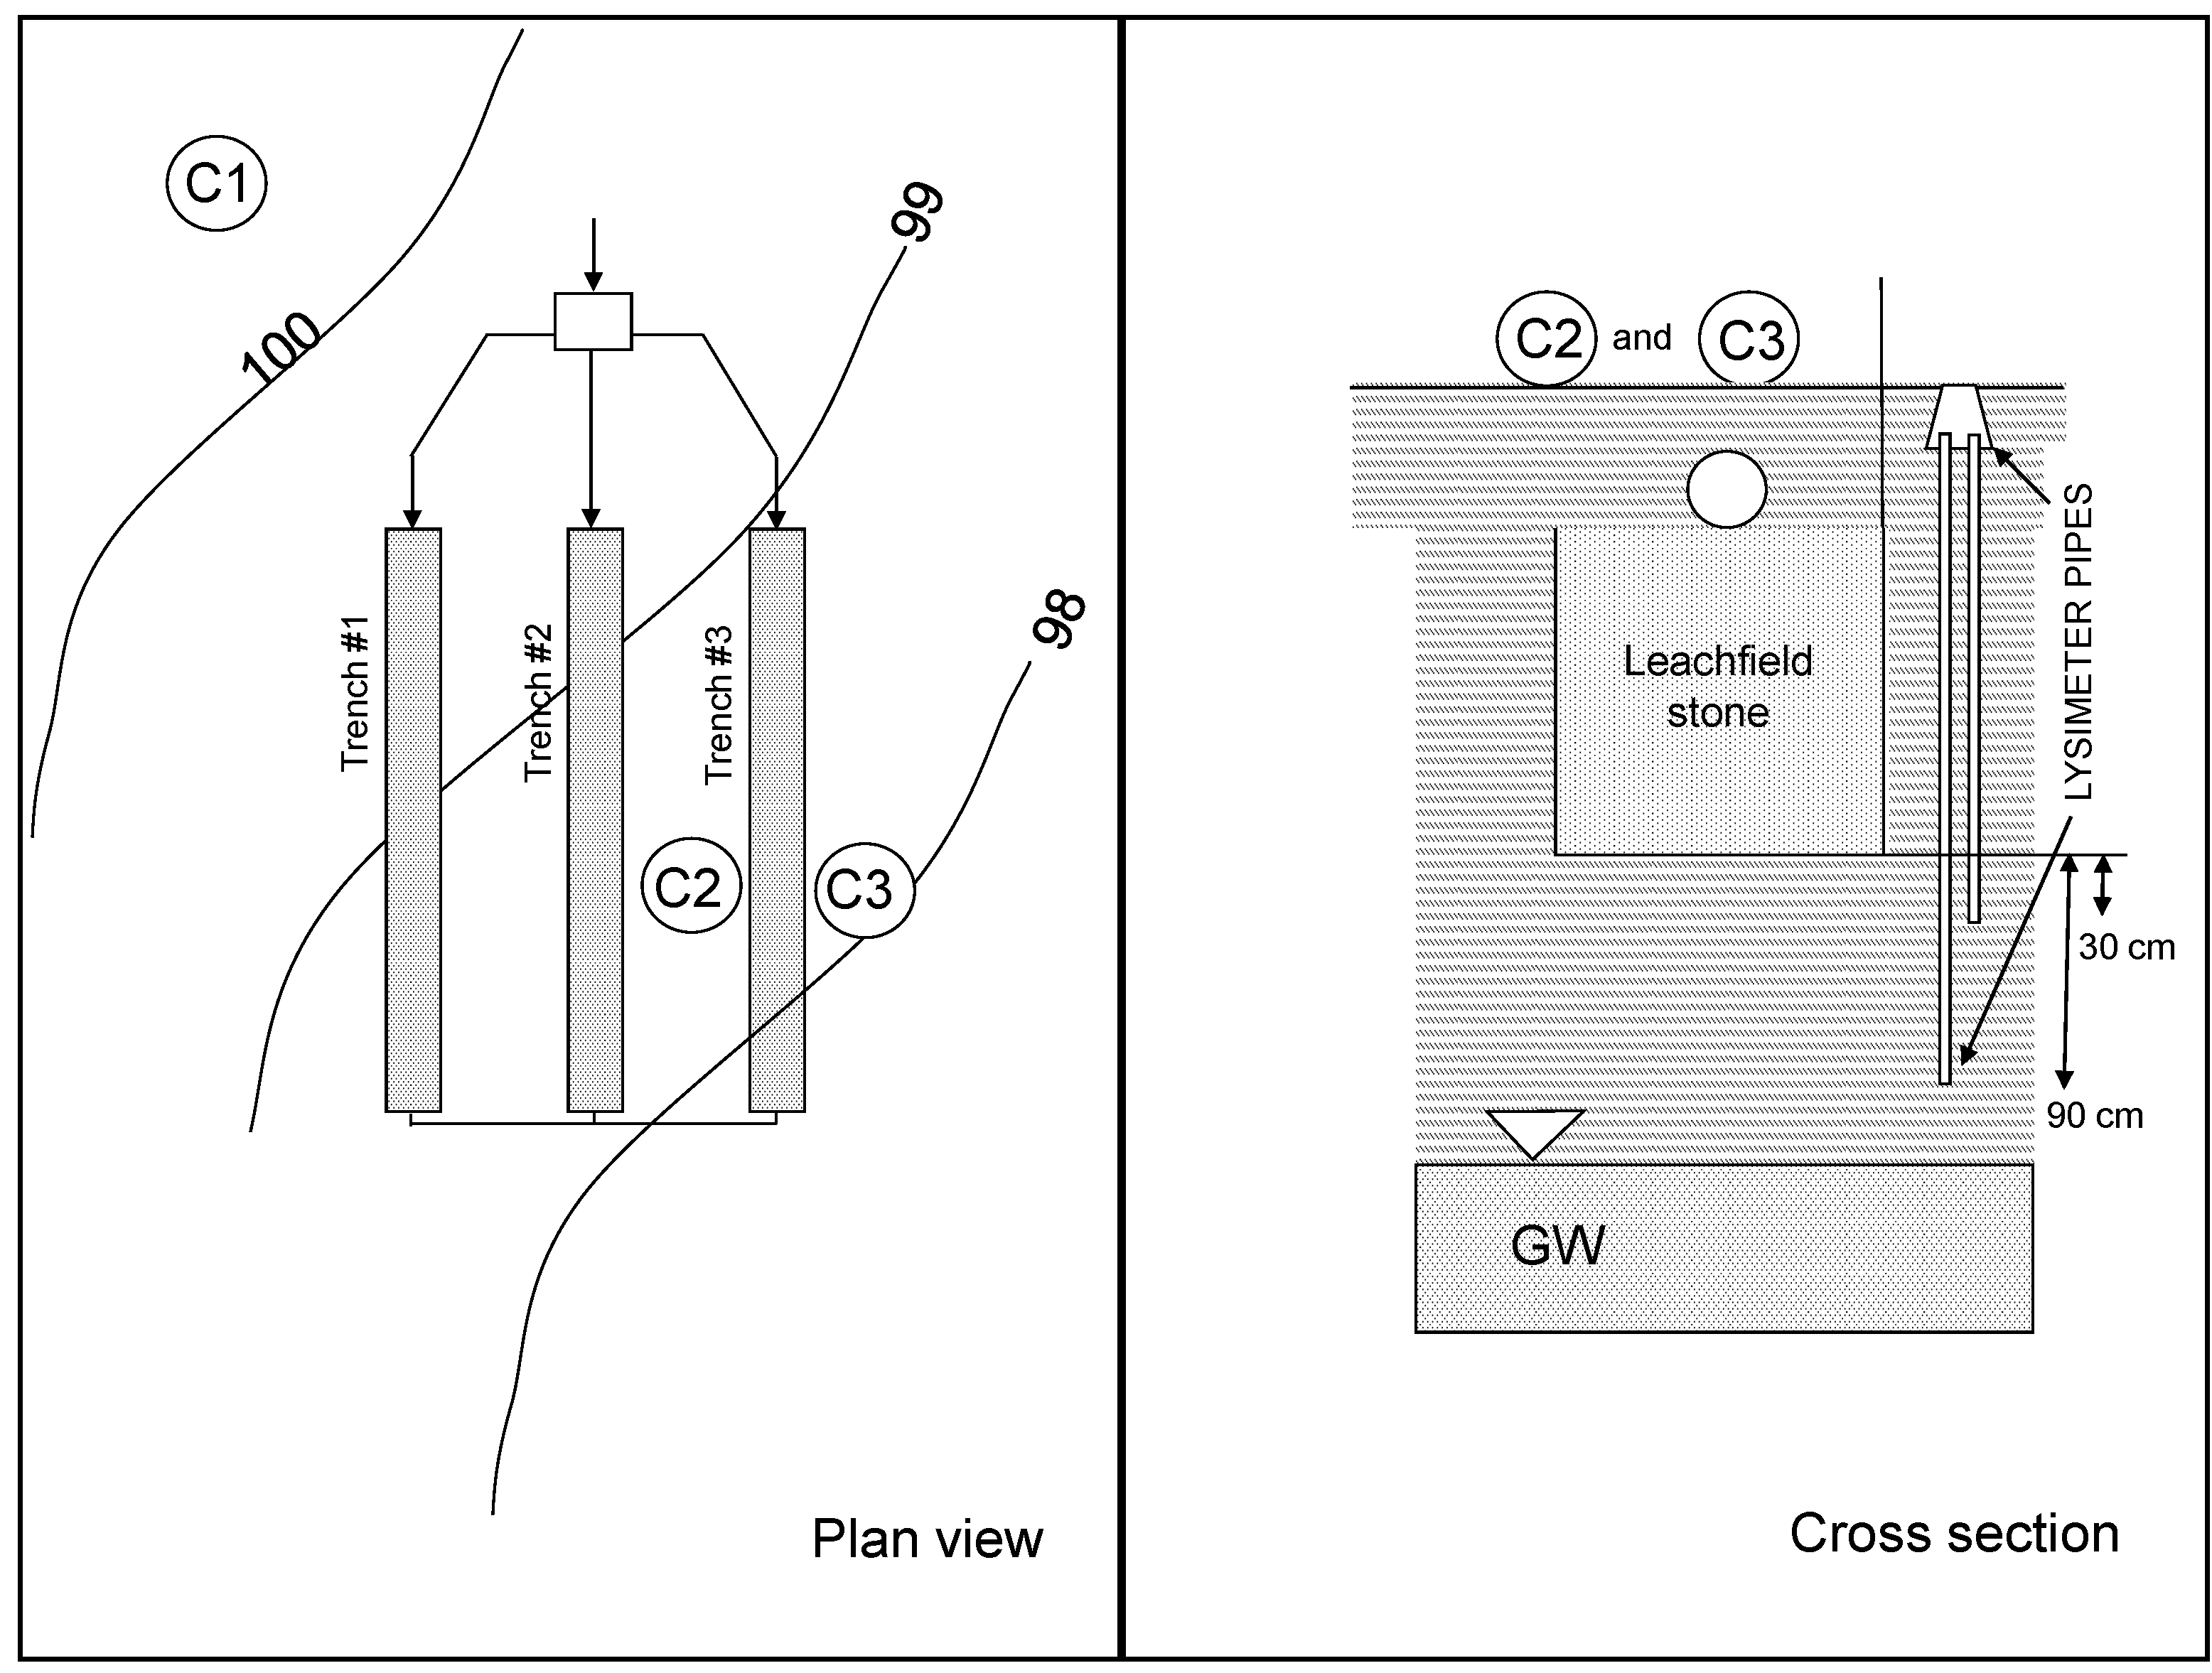
Figure 6.
Relationship between hydraulic load and actual removal rates for nitrogen, carbon and phosphorus at position C3 (downstream from leachfield trench;
Figure 1) for the three field sites evaluated in the present study and for mesocosms containing 30 cm of sand [
8] or soil [
14]. Dashed lines represent linear regressions for soil and sand mesocosms data. Solid symbols represent values for Phase I (prior to intermittent soil aeration); open symbols represent values for Phase II (during intermittent soil aeration).


