Article

Chitosan/Graphite/Polyvinyl Alcohol Magnetic Hydrogel Microspheres for Decontamination of Reactive Orange 16 Dye

1
Department of Chemistry, RTM Nagpur University, Nagpur 440033, India
2
Department of Chemistry, College of Natural Science, Yeungnam University, 280 Daehak-ro, Gyeongsan 38541, Korea
*
Authors to whom correspondence should be addressed.
Water 2022, 14(21), 3411; https://doi.org/10.3390/w14213411
Submission received: 28 September 2022 / Revised: 18 October 2022 / Accepted: 23 October 2022 / Published: 27 October 2022
(This article belongs to the Section Wastewater Treatment and Reuse)

Abstract

:
A rapid gelation method was used to fabricate magnetic chitosan/graphite/polyvinyl alcohol (m-CGPA) hydrogel beads crosslinked with glutaraldehyde. A thorough characterization was carried out by FTIR, SEM-EDX, XRD, VSM, and TGA. Studies with batch experiments indicated that m-CGPA removes more than 95% of reactive orange 16 (RO 16) dye with a Langmuir monolayer adsorption capacity of 196.3 mg/g at pH 4.0 in just 90 min of contact time. Langmuir isotherm model fitted well with the experimental data. Pseudo-second order kinetics was proposed for the adsorption process. Adsorption thermodynamics evidenced the fact that the process was spontaneous, exothermic, and enthalpy-driven in nature. The saturation magnetization of the material as obtained from VSM analysis was found to be 7.2 emu/g in comparison with that of pure Fe3O4 at 66.4 emu/g. In light of its excellent decontamination efficiency, low cost, and rapid adsorption, this material was found to be an excellent decontaminant for RO16. In addition to enhanced adsorption capacity, the magnetic behavior was an added advantage as it could be easily separated with the help of an external magnet. Fixed bed column studies revealed that the column method can be applied to large-volume treatment. Also, it was possible to regenerate m-CGPA using a 5% NaOH solution and reuse it in multiple cycles.

1. Introduction

A wide variety of industries use dyes, including textiles, pharmaceuticals, food, paint, cosmetics, carpeting, leather, and rubber. Textile dyes have been widely used in textile industries for decades. Simultaneously, dyes have been recognized for their valuable applications in cutting-edge applications like Gratzel cells [1,2]. Dyes are thermally stable molecules because of the existence of intricate aromatic structures in them. Approximately 20% of dyes are directly discharged into natural waterways [3,4]. A lethal threat to an entire ecosystem is posed by the growing problem of water pollution caused by the excessive release of these carcinogenic dyes [5,6]. It is important to develop effective methods for removing carcinogenic dyes from wastewater to address this issue. So far, numerous attempts have been made to remove dye contaminants. Elimination of organic dyes from industrial wastewater can be done by a variety of methods like catalytic oxidation [7,8], electrochemistry [9], photocatalysis degradation [10,11,12], catalytic reduction [13], electron beam radiation [14], and adsorption [15,16,17,18]. Adsorption is an easy, inexpensive, and efficient way to remove the dye, having the benefit of being easy to apply [19]. This leads to the use of several adsorbents to remove dye from industrial wastewater [20,21]. Biopolymers are being utilized for synthesizing adsorbents because of their environmentally sound nature. Increased thermal stability, pollutant selectivity, and adsorption capacity can be achieved by chemically modifying these biopolymers [22]. In this context, the most often used biopolymers include chitosan, cellulose, and alginate [23]. Due to the simplicity of modification, chitosan is most often utilized as a biopolymer [24]. Over the last few years, we have reported modifications of chitosan to remove patent blue V, methyl orange, brilliant green [25], Congo Red [26], indigo carmine [27], and crystal violet [28]. Most recently, malachite green and methylene blue [29], and reactive red [22] have been removed by chitosan-modified adsorbents.
Reactive orange 16 dye is highly used in textile industries and is a kind of reactive azo dye. Because of its mutagenic properties, this dye is one of the most harmful dyes. In many biomaterial applications, polyvinyl alcohol has proven to be effective due to its attributes of being simple to prepare, having biodegradability, strong chemical resistance, and acceptable mechanical quality nature [30]. Binding of two polymers has shown enhancement in the performance of adsorbents [31]. Difficulty in the separation of adsorbent from industrial wastewater acts as a bottleneck for its practical application. If the material synthesized is magnetic, the adsorbent can easily be separated from the aqueous solution for reusability. This can be done by the incorporation of Fe3O4 nanoparticles. Adsorbents consisting of Fe3O4 can be effectively separated from dye-contaminated water. Magnetic adsorbents are usually synthesized by techniques of calcination, pyrolysis, and coprecipitation [32]. Of these, the coprecipitation method is generally used. This method synthesizes Fe3O4 nanoparticles using nitrogen atmosphere [33]:
Fe2+ + 2Fe3+ + 8OH → Fe3O4 + 4H2O
As an adsorbent in water treatment, graphite does not perform well. However, its uniform carbonaceous structure makes it very suitable for studying several fundamental mechanisms of adsorption. So, graphite could be added to provide a surface for adsorption. Chitosan/Polyvinyl alcohol-based adsorbents are being widely applied as adsorbents because of their biodegradable nature. There are a variety of contaminants that harm the environment, so it is necessary to synthesize adsorbents that have good adsorption capacity and can be easily separated from contaminated water.
The aim of this study is to synthesize magnetic chitosan/graphite/polyvinyl alcohol hydrogel microspheres (m-CGPA) with excellent adsorption capacities toward RO 16 dye-laden wastewater treatment. A magnetic, reusable, and large sample volume adsorbent, it offers a potential solution to wastewater-related environmental problems caused by dye discharges in natural waters.

2. Materials and Methods

2.1. Reagents and Materials

Analytically pure chemicals and reagents were used for carrying out all adsorption experiments. Chitosan powder with low molecular weight having a deacetylation degree of 90% and Reactive Orange 16 (Remazol brilliant orange 3R-C20H17N3Na2O11S3, 617.54 g mol−1) were obtained from Sisco Research Laboratories Private Limited, Mumbai, India. Polyvinyl alcohol having 89% degree of hydrolysis was procured from Molychem. Ferric chloride and Ferrous sulfate were purchased from Merck, India. Glutaraldehyde 25% (C5H8O2-100.12) and Graphite fine powder 98% (C, 12.01) were purchased from Loba Chemie, Mumbai, India. Millipore deionized water was used for synthesizing the adsorbent and carrying out all adsorption experiments. A 1000 mg L−1 stock solution of RO 16 was prepared by dissolving the dry dye in 100 mL Millipore water and dilutions were made as per requirement. Then, 0.5 M FeCl2 solution and 0.1 M FeCl3 solutions were prepared in Millipore water during synthesis of magnetic nanoparticles.

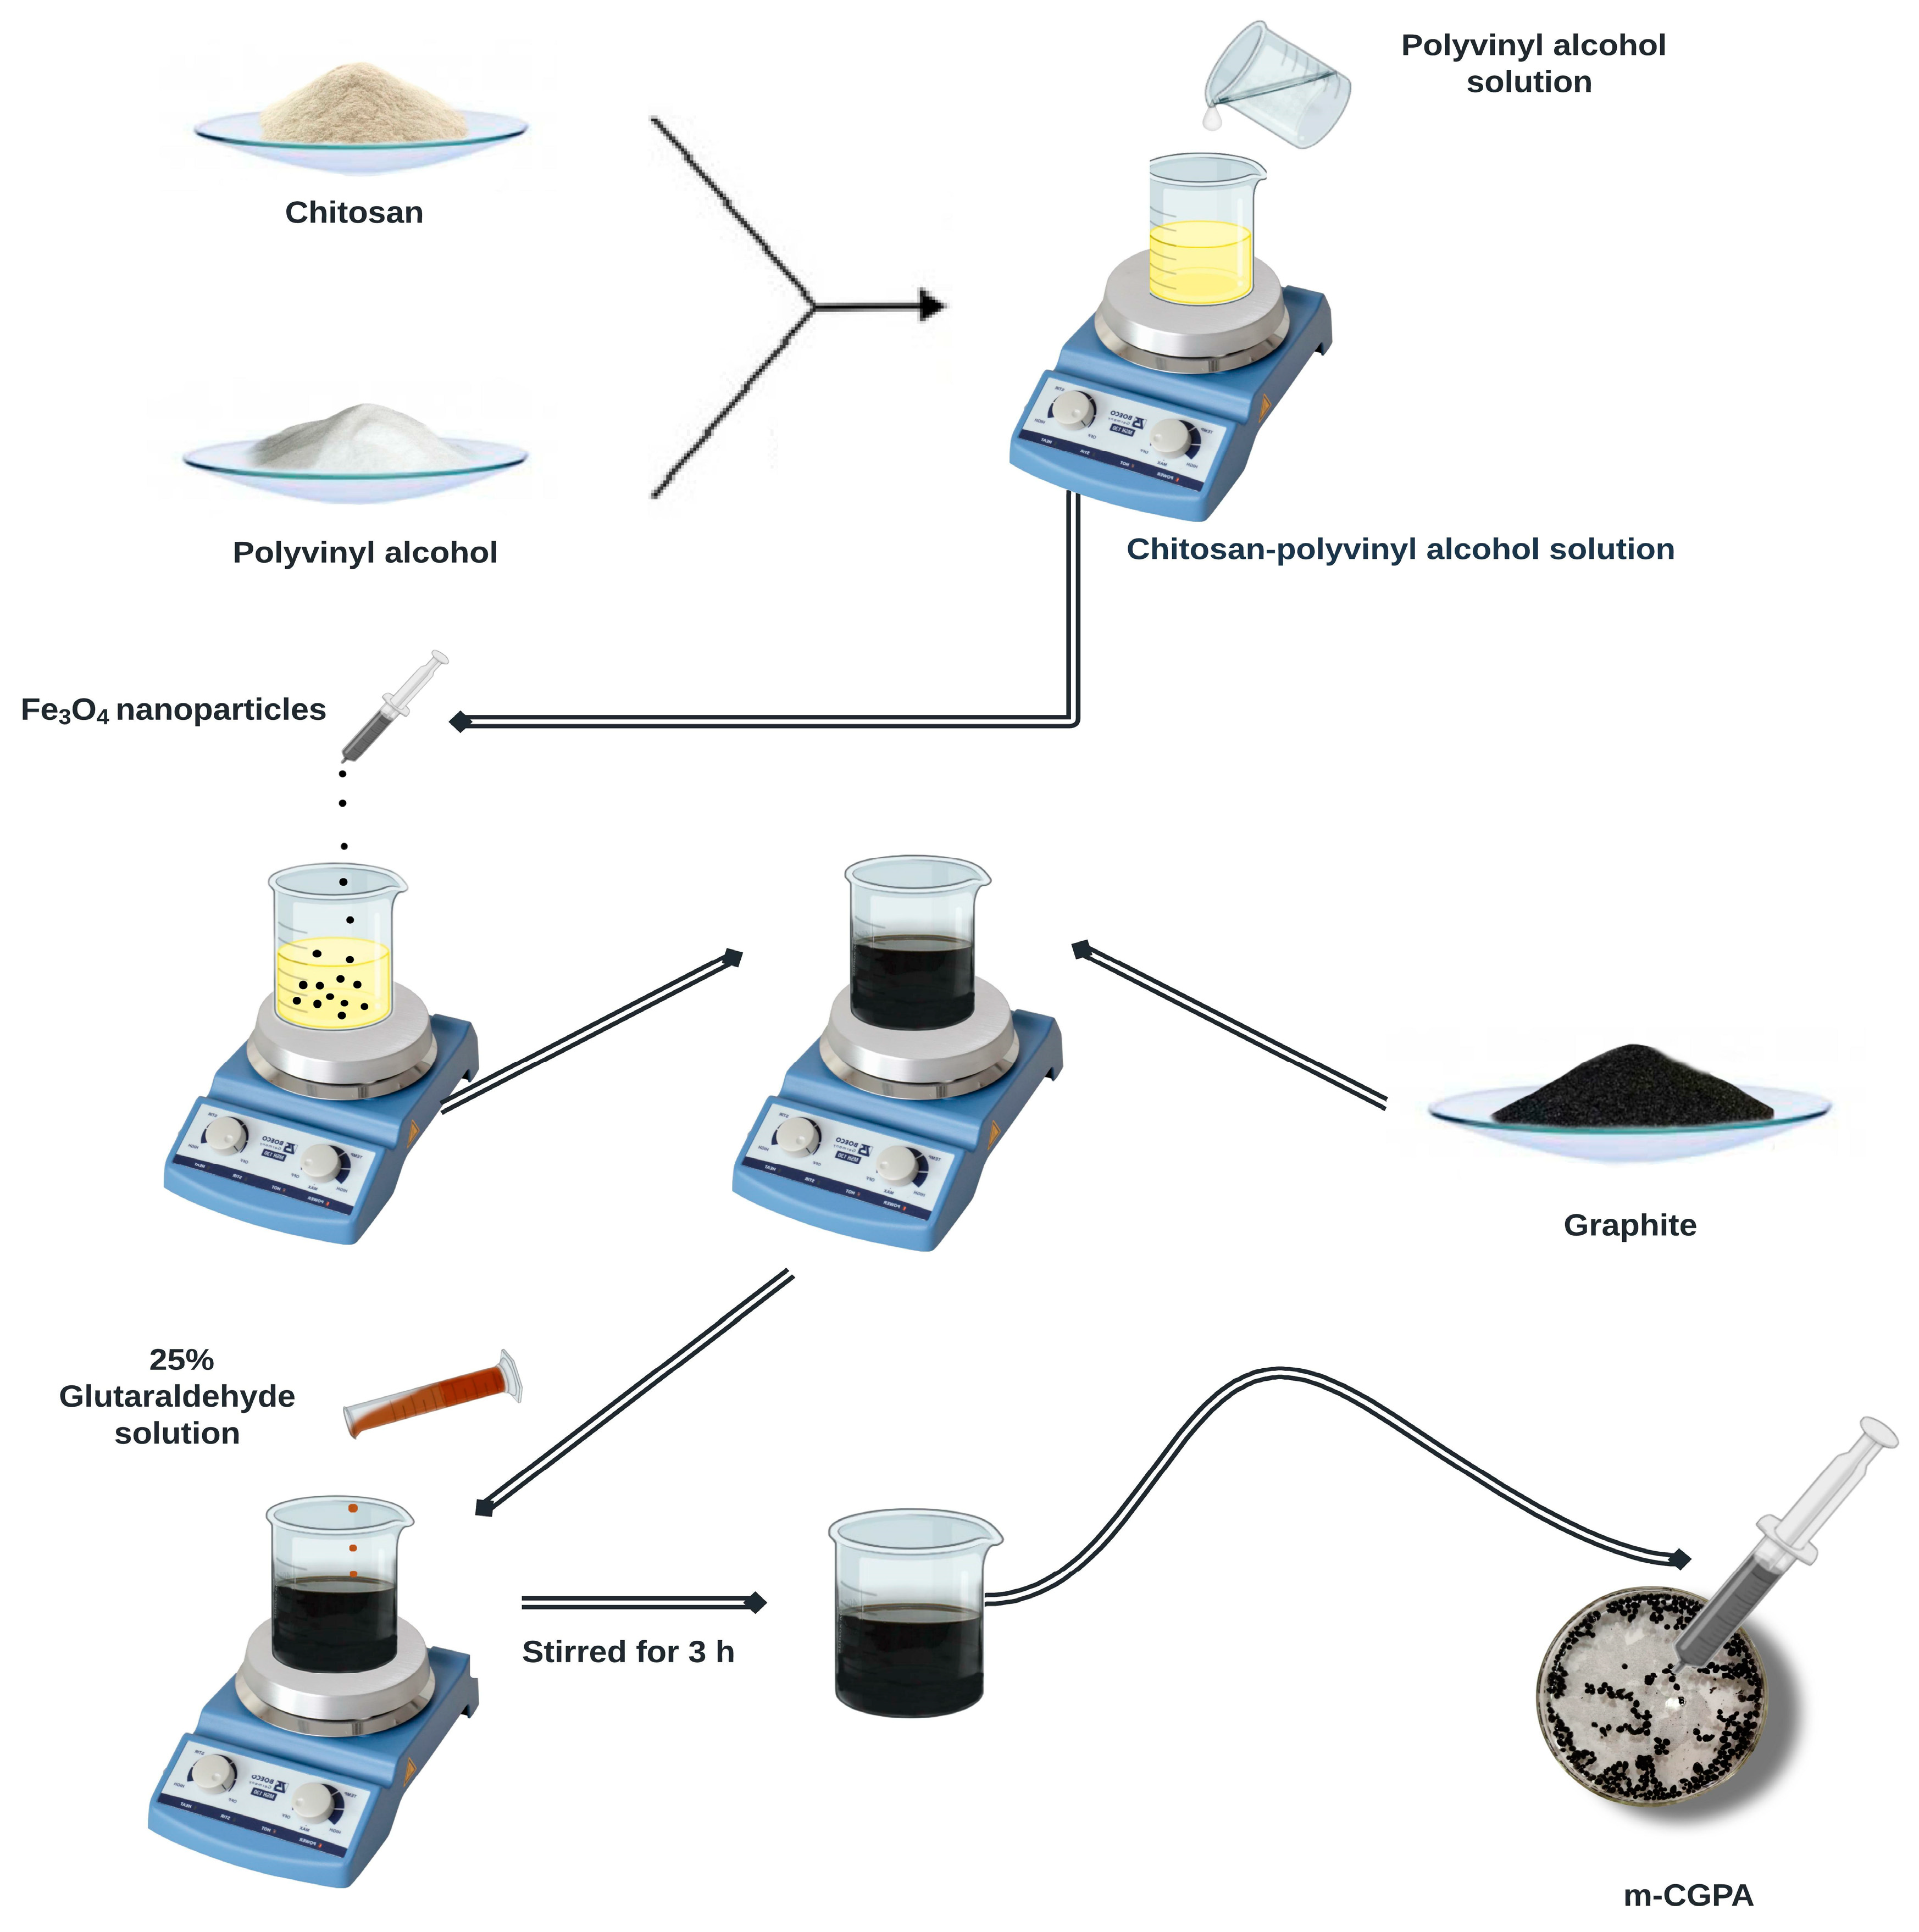
2.2. Synthesis of m-CGPA Microspheres

The m-CGPA hydrogel microspheres were synthesized by taking inspiration from the instantaneous gelation method already reported in the literature [34]. In a typical synthesis, 2 g of low molecular weight chitosan was dissolved in 100 mL of 2% acetic acid solution. 2 g of Polyvinyl alcohol was dissolved in 100 mL of Millipore deionized water at 313 K with the help of temperature controlled magnetic stirrer for 3 h. Then at room temperature, the PVA solution was added dropwise to the chitosan solution with constant stirring. Fe3O4 nanoparticles were prepared by coprecipitation of 0.5 M FeCl2 and 0.1 M FeCl3 using 2 M NaOH to pH 12. To it, 2 g of Fe3O4 nanoparticles and 1 g of fine powder graphite were added one by one and the solution was vigorously stirred. Finally, 0.5 mL of glutaraldehyde solution was added and the solution was kept on stirring for 3 h to form the final mixed solution. This mixed solution was dropped with a syringe into 10% ammonia solution to form magnetic hydrogel microspheres. These microspheres were then washed using Millipore deionized water and were stored in an aqueous medium for further applications. Schematic representation for the synthesis of m-CGPA is exhibited in Figure 1 while the as-formed microspheres have been depicted in Supplementary Figure S1.

2.3. Equipment

The synthesized magnetic hydrogel microspheres were characterized by techniques such as SEM-EDX, XRD, FTIR, VSM, and TGA. The surface morphology of synthesized magnetic hydrogel microspheres was examined by SEM (JEOL, Tokyo, Japan Model: JSM 6610LV). The elemental distribution of magnetic hydrogel microspheres was investigated by the EDX technique equipped with SEM (Secondary, backscattered, and LN2-free EDX detector). The presence of functional groups and elemental structure before and after adsorption on adsorbent was observed by FTIR technique with wavenumbers scanned from the range of 400 cm−1 to 4000 cm−1. The magnetic properties of hydrogel microspheres at room temperature were measured by Vibrating Sample Magnetometer (VSM, Microsense, Massachusette, USA, Model ADE-EV9). The phase structure of the hydrogel was analyzed by the XRD technique (XRD, Bruker, Elk Grove, USA, D8 Discover, X-ray source Cu, 3 KW). The thermal stability of magnetic hydrogel microspheres was determined by simultaneous DTA-TG apparatus (Shimadzu DTG-60). The magnetic stirrer (MAC MSW-313) was used for dissolving PVA at moderately high temperature. The absorbance of solutions was recorded by UV Visible Spectrophotometer model (Shimadzu UV-1900i). The shaker (REMI RS-12R DX) model was used for shaking the solutions while performing adsorption experiments. The pH of solutions was measured by a pH meter (Equiptronics EQ-615).

2.4. Investigation by Batch Experimental Studies

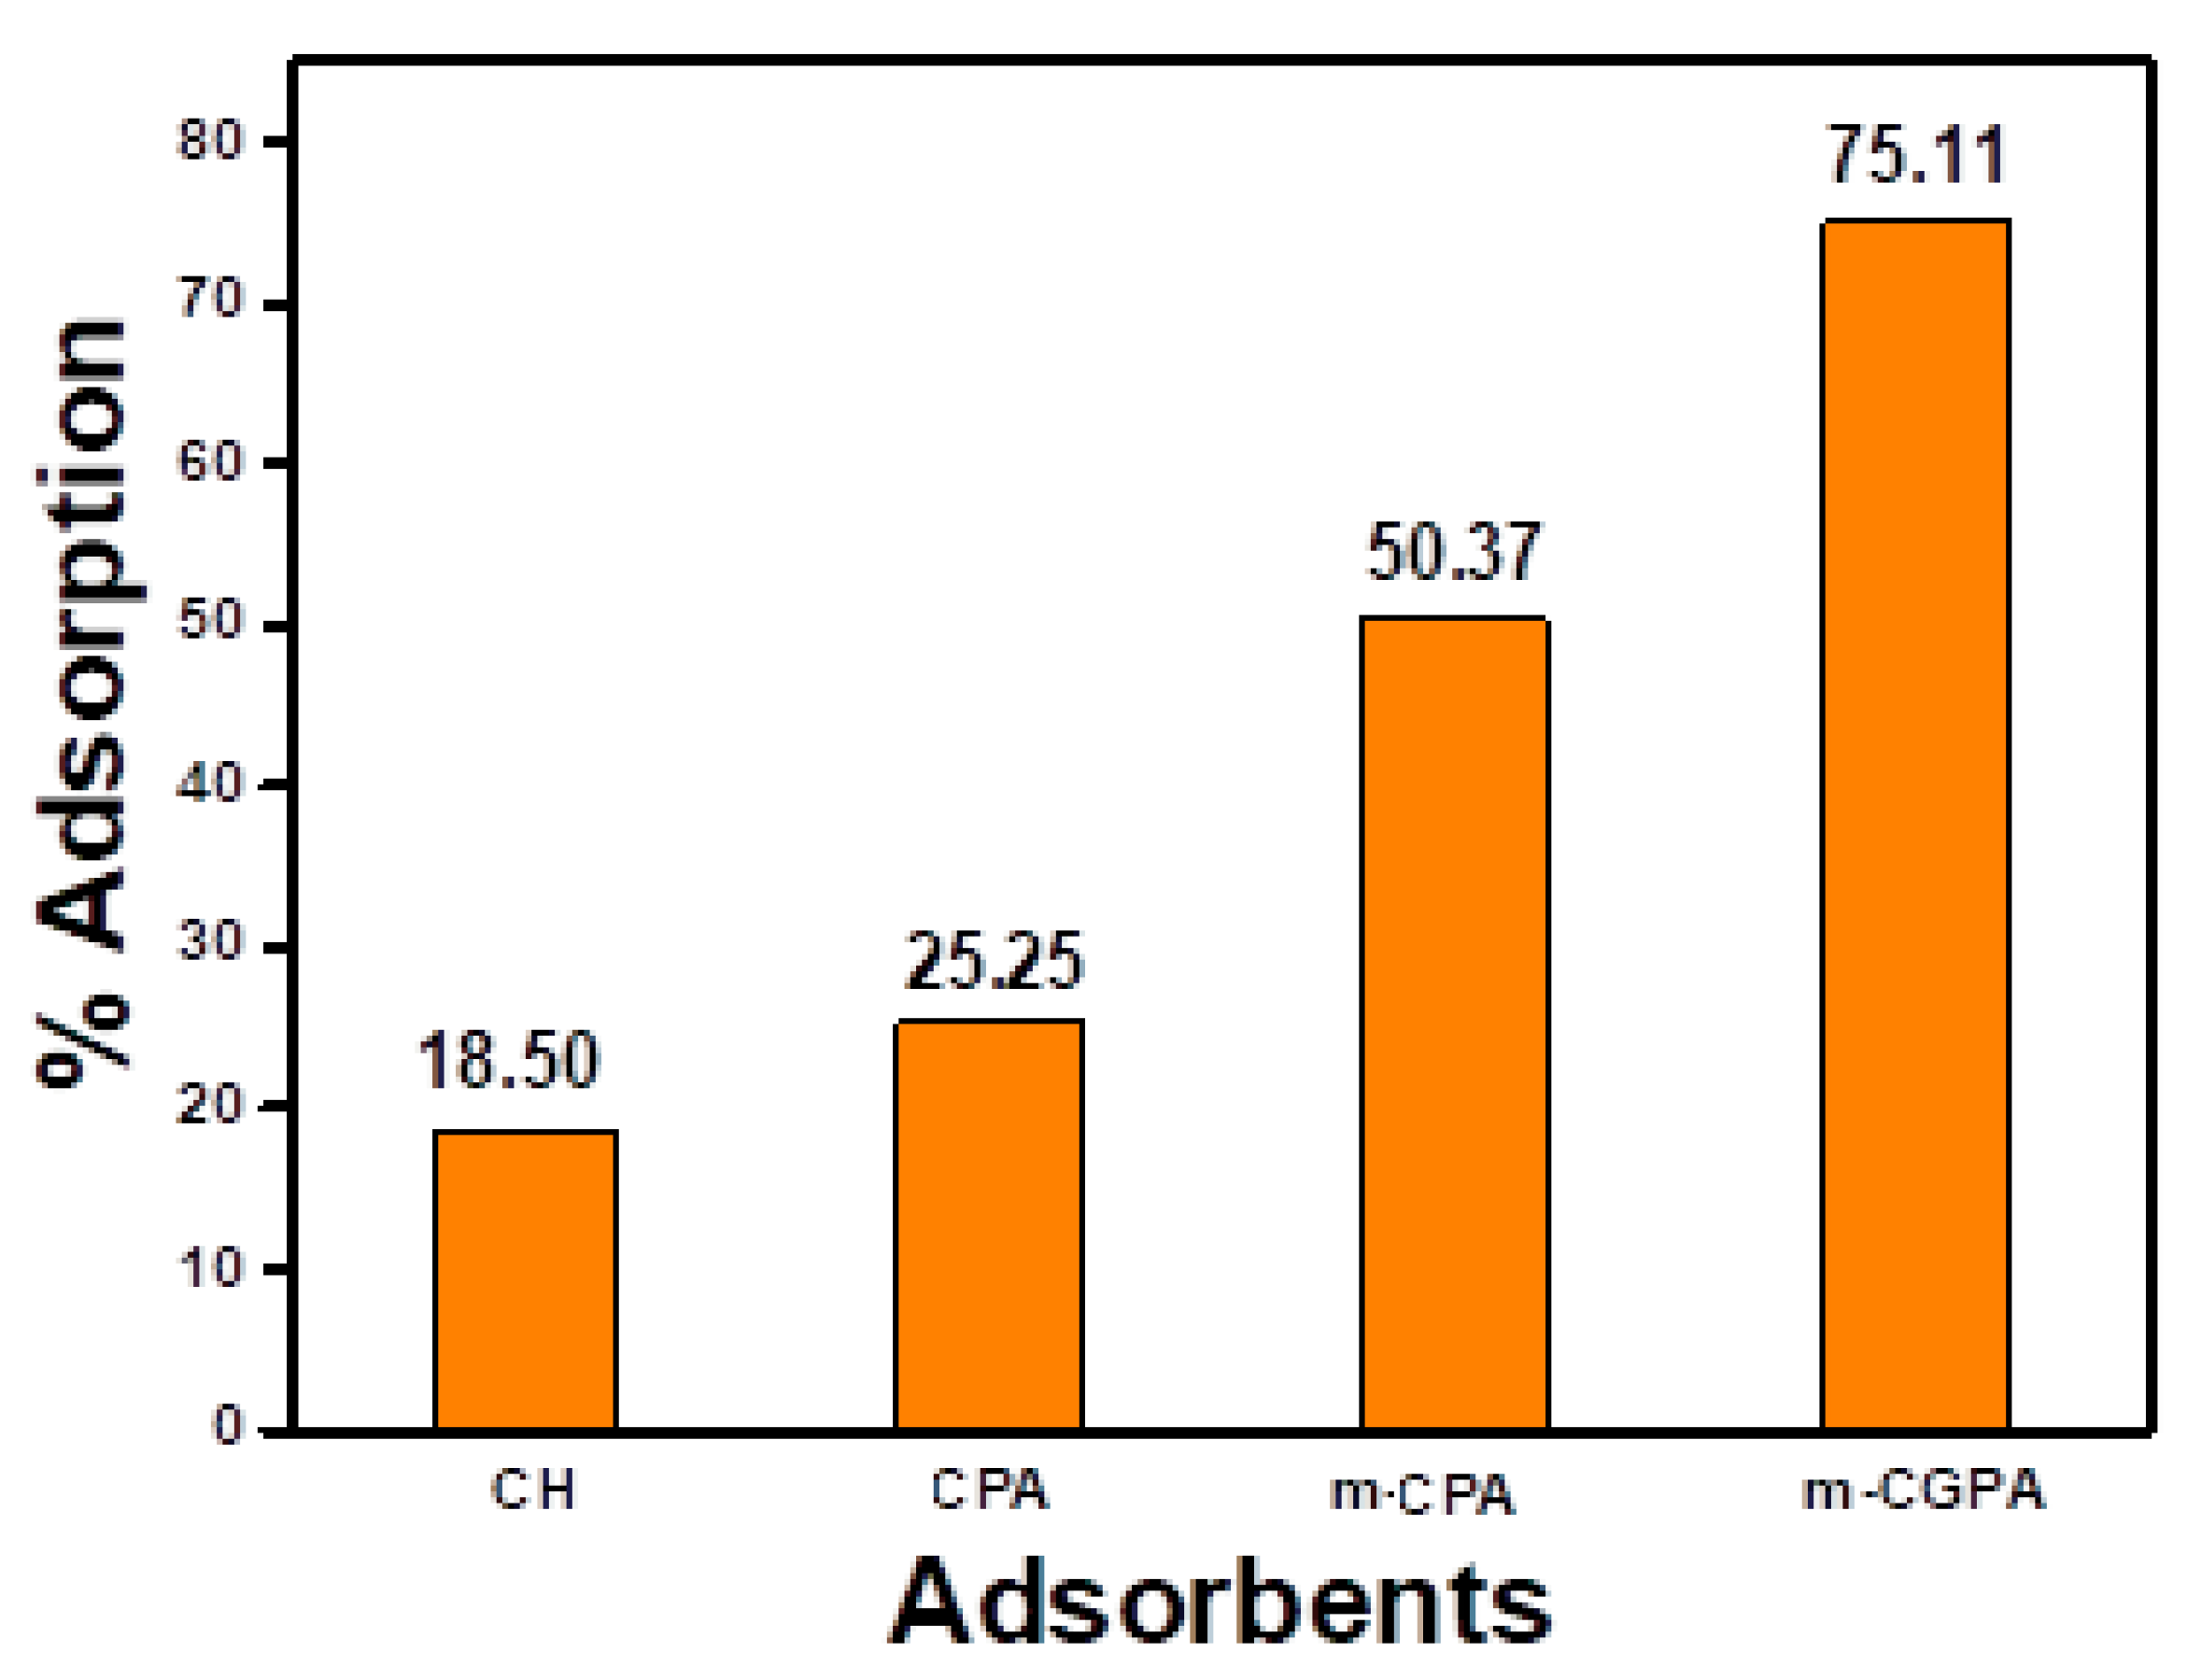
2.4.1. Screening Experiments

In order to compare the adsorption efficiencies of various unmodified and partially modified chitosan with m-CGPA, four materials were selected. These were, chitosan powder (CH), glutaraldehyde crosslinked chitosan-polyvinyl alcohol beads (CPA)), magnetic glutaraldehyde crosslinked chitosan/polyvinyl alcohol beads (m-CPA), and magnetic glutaraldehyde crosslinked chitosan/graphite/polyvinyl alcohol hydrogel microspheres (m-CGPA) were initially tested for adsorption. For this, 0.1 g of specific adsorbent was added to 25 mL of 50 mg L−1 RO 16 dye solutions taken in different 50 mL stoppered conical flasks, and then the solutions were kept on the shaker for a time period of 30 min. After 30 min of contact time, the supernatant liquid was decanted with the help of a circular magnet kept below a conical flask, and the amount of dye adsorbed was calculated. These screening experiments established that m-CGPA hydrogel microspheres have shown the maximum amount of dye adsorption. Figure 2 collates the % adsorption removal and different type of adsorbents used. It was observed that the native chitosan has a very low adsorption tendency toward RO 16. With the incorporation of PVA, Fe3O4, and graphite in the chitosan matrix, the adsorption capacity has been enhanced by about four times within just 30 min. Also, among the native chitosan as well as successive modifications, the final modification was most efficient for the removal of RO 16 dye.

2.4.2. Experimental Studies

Static batch adsorption experiments were put into practice to analyze the adsorption capacity of hydrogel microspheres using the REMI RS-12R DX shaker model at 180 rpm in 50 mL stoppered conical flasks. This experiment studied the influence of pH (3.0–9.0), contact time (5–150 min), m-CGPA dosage (10–400 mg), initial concentration of RO 16 dye (25–400 mg L−1), and temperature (303–318 K). The optimized dose was added to 50 mL of an initial 50 mg L−1 fixed concentration of dye solutions. The mixtures were kept on a shaker with an agitation speed of 180 rpm with optimized pH, time, and temperature. The adsorption isotherm studies were carried out using 0.05 g of m-CGPA and 50 mL of RO 16 with varying concentrations from 25–300 mg L−1 dye solutions. After equilibration, the supernatant solution was decanted and the final concentration of dyes was calculated using UV Spectrophotometer UV-1900i by recording the absorbance at λmax of RO 16 dye solution, that is, 493 nm. The adsorption capacity of RO 16 in mg/g (qe) and % dye removal (% R) were evaluated with the help of equations given below:
q e = C 0 C e V W
%   R = C 0 C e C 0 × 100
where C0 and Ce refer to initial and equilibrium concentrations of dye solution, respectively, in mg L−1; W is the weight of hydrogel microspheres in g; and V is the volume of dye solution in L. For ensuring reliability, batch adsorption experiments were repeated three times, and each observation was averaged and reported.
The pHpzc was computed by the method of batch equilibration. In eight separate conical flasks, 50 mL of NaCl with 0.1 M concentration was taken, and dilute HCl or NaOH solutions were used to set the pH from 2.0 to 9.0. To these flasks, 100 mg of m-CGPA was added and solutions were kept on shaking for 24 h. The solutions were then decanted with help of an external magnet and the final value of pH was determined. The graph was plotted ΔpH versus pH of the initial solution.

3. Results and Discussion

3.1. Characterization

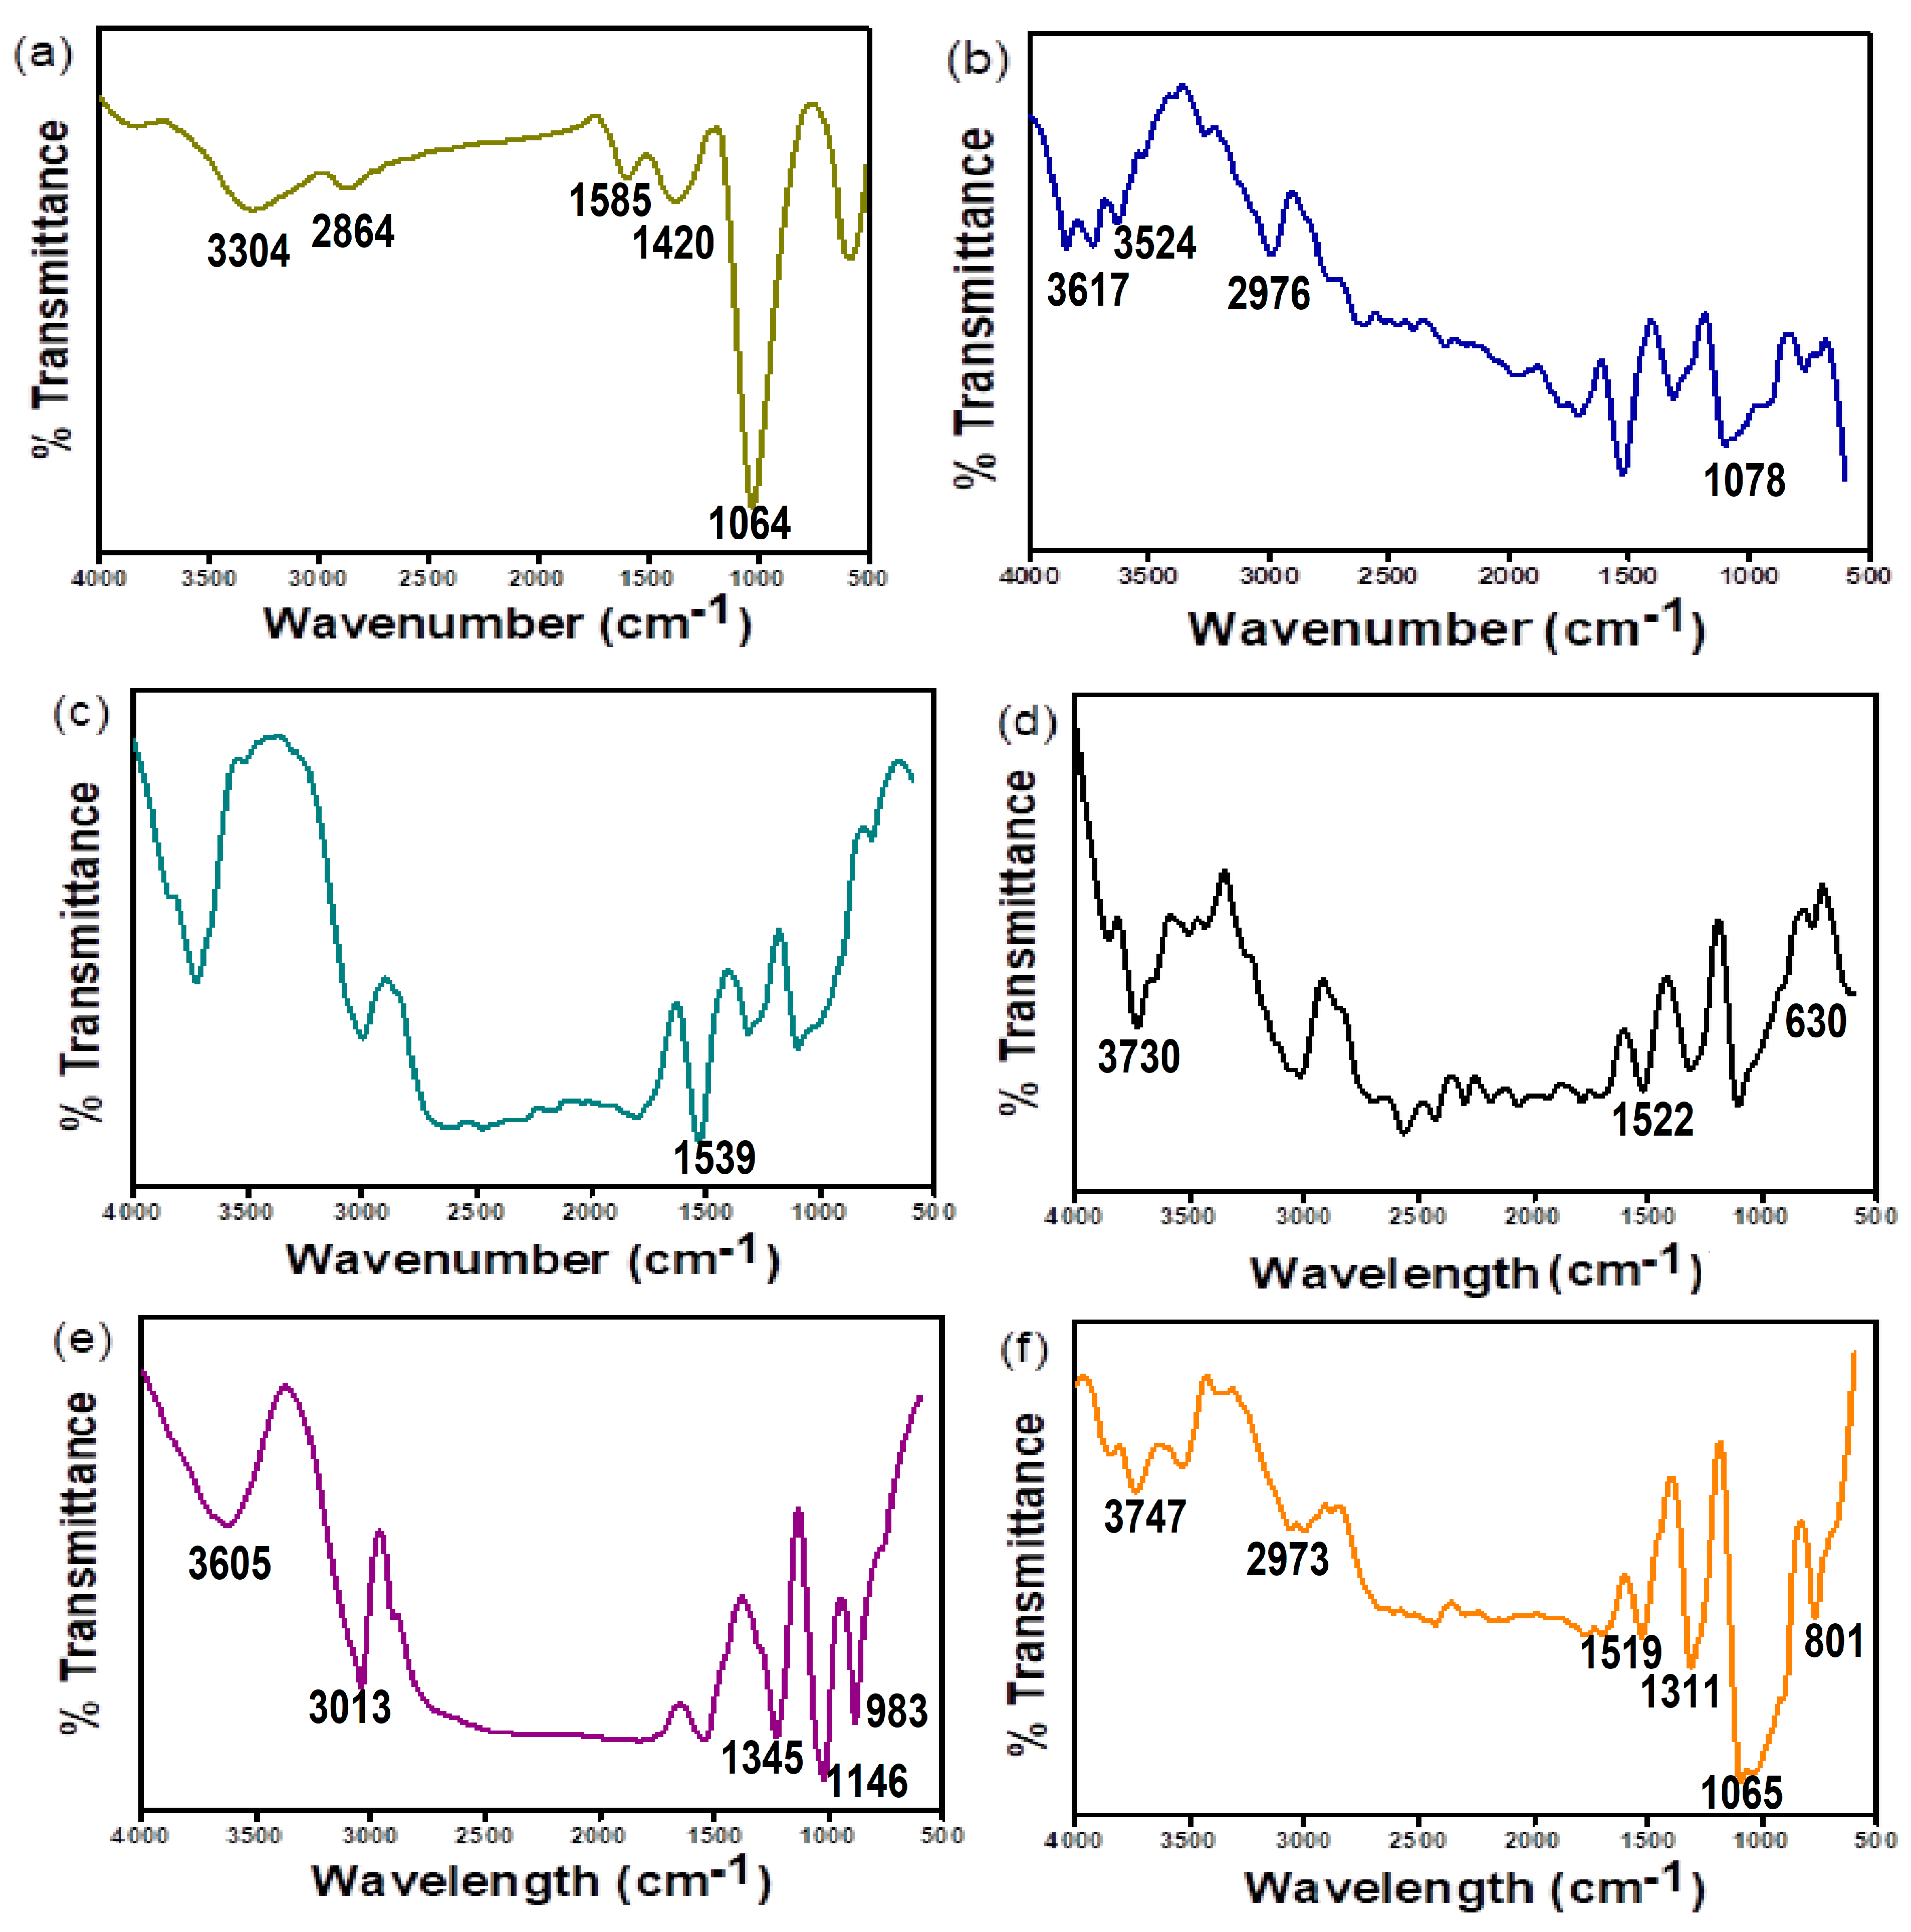
3.1.1. FT-IR Analysis

In order to understand the interaction between adsorbents and adsorbates, FTIR spectra are analyzed before and after adsorption. Figure 3a–f represents FTIR spectra of chitosan, polyvinyl alcohol, graphite, Fe3O4, and m-CGPA before and after adsorption respectively. Native chitosan (Figure 3a) exhibits a broad peak (3200–3500 cm−1) which corresponds to N-H and O-H stretching vibrations. The strong peak of the C-O bond was observed at 1064 cm−1 [35]. C-H stretching vibrations were observed at 2864 cm−1. C-N bending vibration and C=O stretching vibration were observed at 1420 and 1585 cm−1 respectively. The peak at 1585 cm−1 confirms the existence of residual N-acetyl moiety. Pure PVA (Figure 3b) showed a strong peak at 3617 cm−1 related to the -OH group for free alcohol. The peak at 3524 cm−1 has been assigned to H- bonded band. The peak at 2976 cm−1 corresponds to the broad alkyl C-H stretching band [36]. The distinctive peak at 1078 cm−1 corresponds to the C-O stretching band. This vibrational absorption band is because of the semicrystalline nature of PVA and so can be used for determining PVA [37]. In the case of graphite (Figure 3c), the peak at 1539 cm−1 corresponds to (C=C) vibration [38] while Fe3O4 nanoparticles (Figure 3d) exhibit a peak at 630 cm−1 related to stretching of the Fe-O bond, which is the characteristic peak of ferrites [39]. Furthermore, the peak at 1522 cm−1 was due to the bending of O-H groups and the broad peak at 3730 cm−1 corresponds to the stretching vibration of -OH groups [40]. The final adsorbent m-CGPA (Figure 3e) showed most of the peaks present in precursors indicating synthesis of the composite. These peaks have been shifted after the adsorption of RO 16 dye indicating an interaction between the functional groups of m-CGPA with the dye molecules.

3.1.2. SEM-EDS Analysis
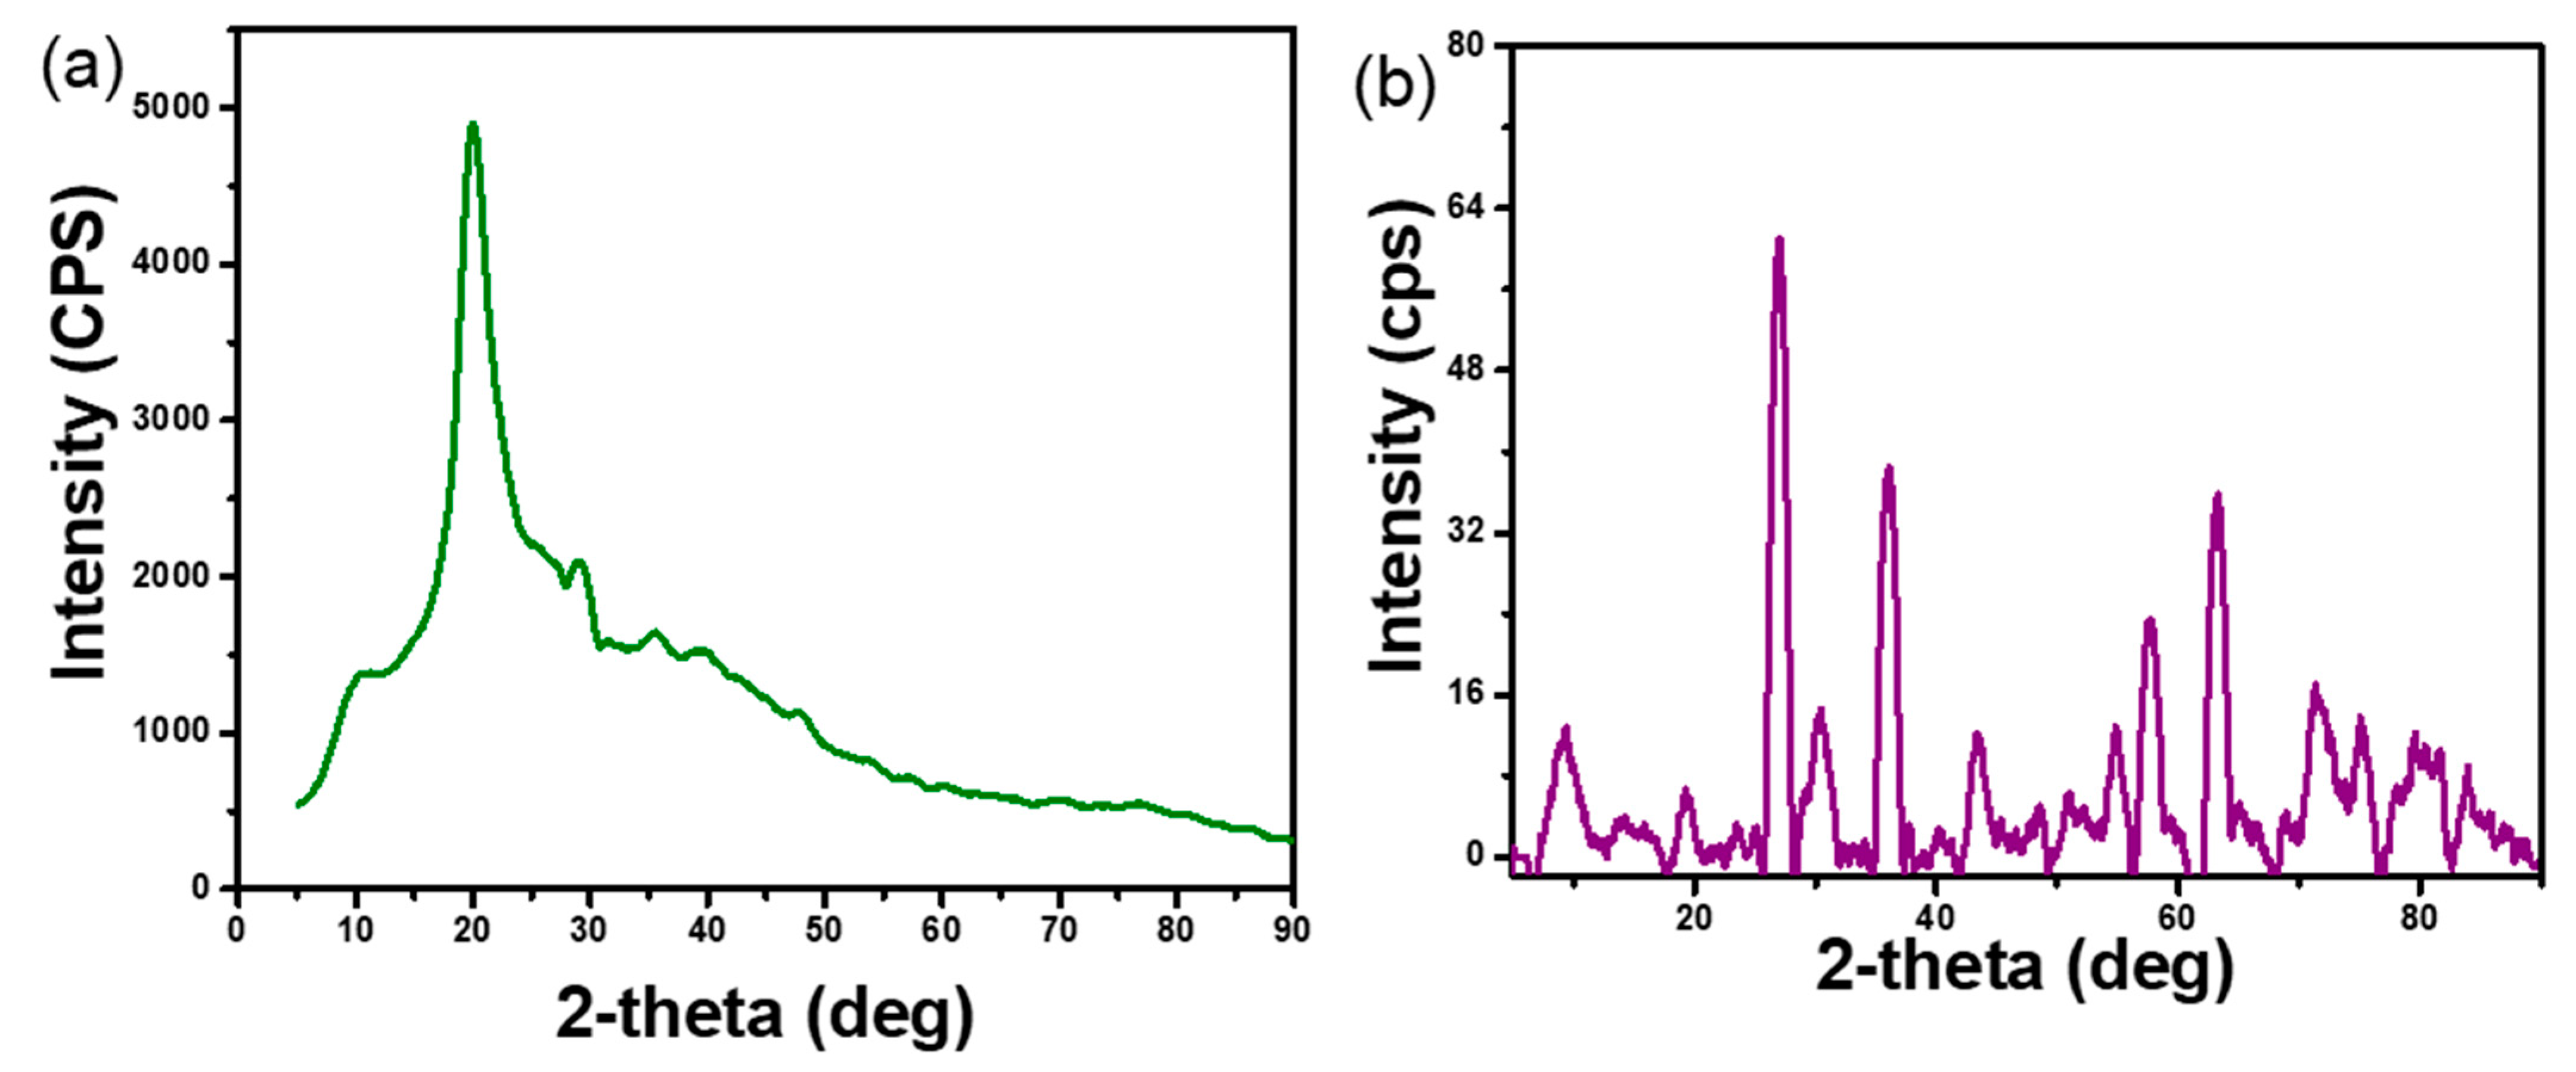
Adsorbents are characterized by SEM-EDS to determine their surface morphology and elemental composition. The surface of m-CGPA shows sphere-like structures and a rough surface thereby leading to greater surface area and enhanced adsorption. EDS image shows the presence of C, O, and Fe peaks. Figure 4 displays the SEM image and EDS analysis of m-CGPA. EDS signals that iron has been incorporated into the matrix of the adsorbent based on the presence of Fe peak in the spectrum. Similar results have been reported by Korde et al. [41].

3.1.3. XRD Analysis

Figure 5 displays characteristic peaks present in chitosan and m-CGPA. In order to determine the crystalline phase of an adsorbent, XRD analysis is necessary. The XRD spectrum of chitosan (Figure 5a) showed characteristic peaks of chitosan at 2θ = 10.74° and 20.02°. In the case of m-CGPA (Figure 5b), the peaks at 2θ = 26.83°, 36.05°, 43.77°, 57.53°, and 63.04° correspond to diffraction peaks of Fe3O4 and planes (220), (311), (400), (511), and (440). The peak at 2θ = 10.00° corresponds to the shifted peak of chitosan. Possibly, this shift in peak is caused by crosslinking of starting materials resulting in reduced crystallinity of microspheres. In microspheres, Fe3O4 peaks indicate that the crystal structure was unaltered [32,34,41].

3.1.4. VSM Analysis

VSM analysis helps in determining the specific saturation magnetization (σs) of the adsorbent. The Fe3O4 nanoparticles had shown σs of 66.4 emu g−1 while m-CGPA had shown σs of 7.2 emu g−1. This is obvious because the amount of Fe3O4 nanoparticles is low in the adsorbent synthesized. Further, results indicated that the magnetic properties of Fe3O4 nanoparticles remained in the adsorbent. The paramagnetic property of m-CGPA may be because of the incorporation of Fe3O4 nanoparticles into the reaction mixture. Because of this magnetic property, the m-CGPA microspheres can be easily removed from the aqueous solution of dye. With a magnet 1 cm from the sidewall, the adsorbent can be completely retracted from the aqueous solution within 10 s, leaving a clear and colorless supernatant behind. Figure 6 represents the magnetic hysteresis curve of m-CGPA in comparison with Fe3O4. Supplementary Figure S3 shows the magnetic separation of m-CGPA.

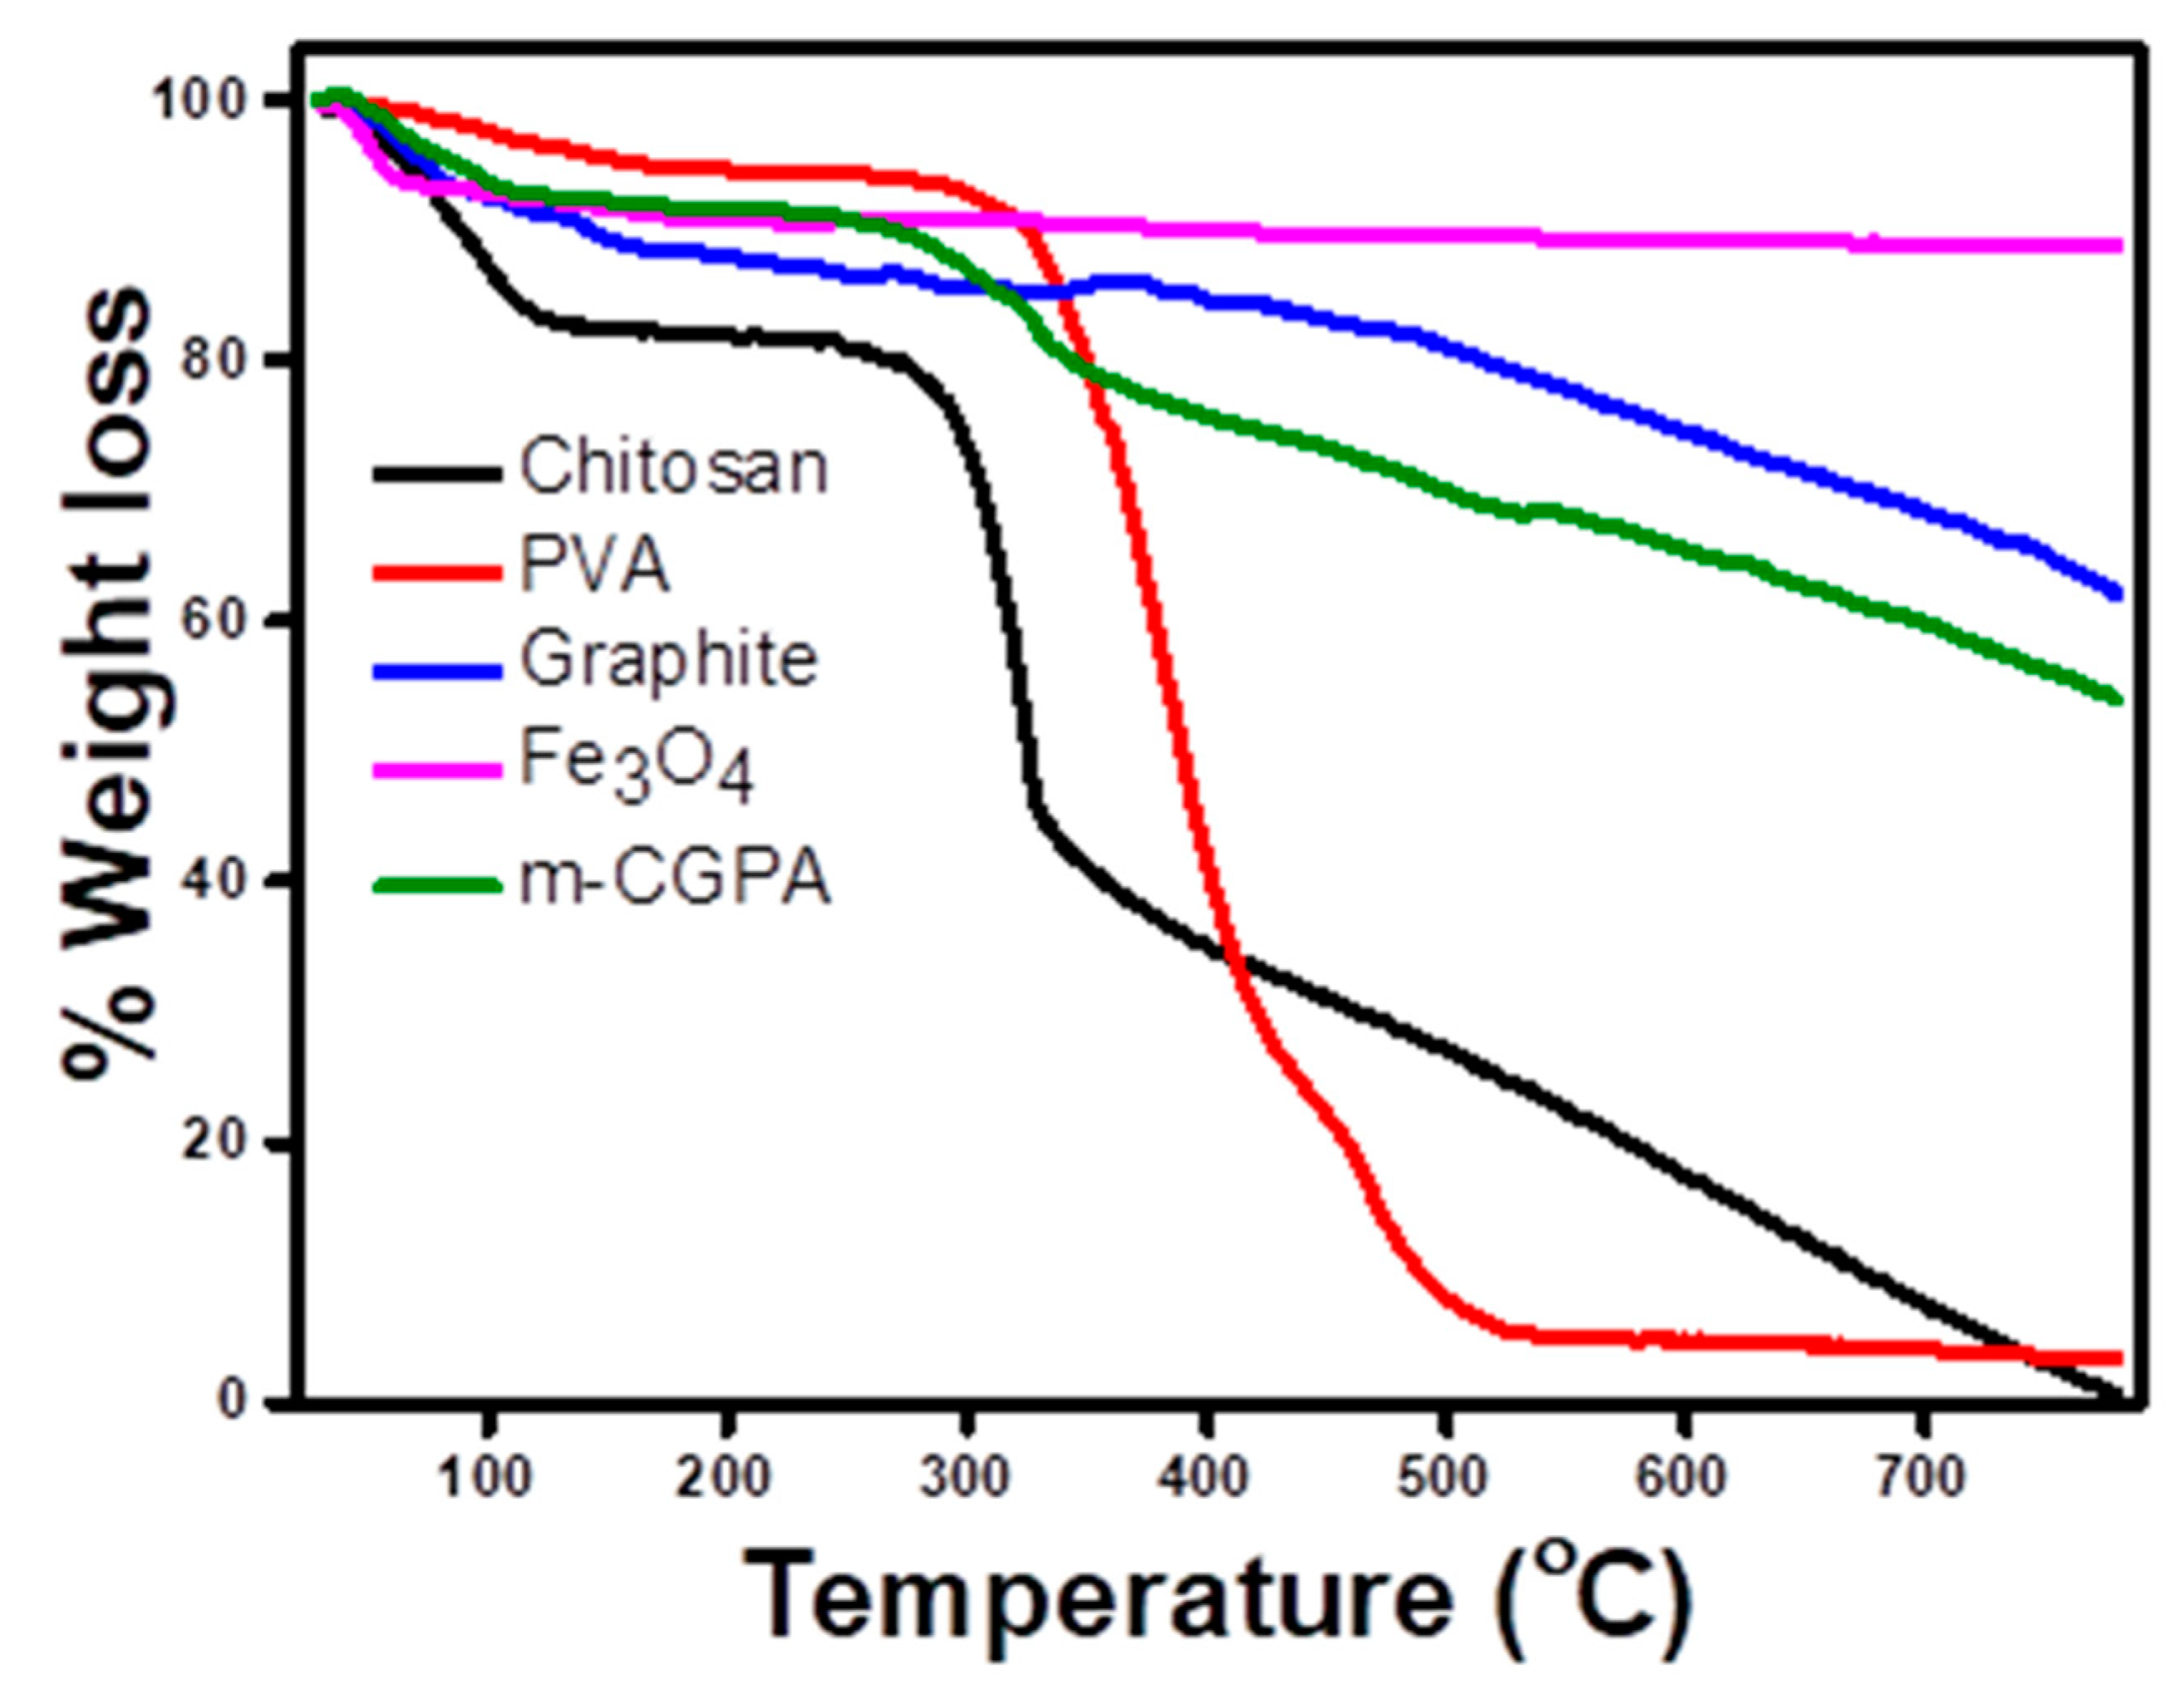
3.1.5. Thermogravimetric Analysis

Thermogravimetric analysis helps in determining the stability of adsorbents at higher temperatures. A TGA curve for the starting material and a TGA curve for the final material is shown in Figure 7. Pure chitosan was found to show rapid degradation in the temperature range of 250–320 °C while pure PVA degraded rapidly between 250 to 500 °C. When highly stable oxide of iron Fe3O4 was introduced into the matrix along with graphite, the m-CGPA so formed showed properties intermediate between the organic polymers and the inorganic components. The thermal degradation of these polymers was found to reduce from 100% to 36.26% up to 800 °C in m-CGPA [42].

3.2. Optimization of Parameters

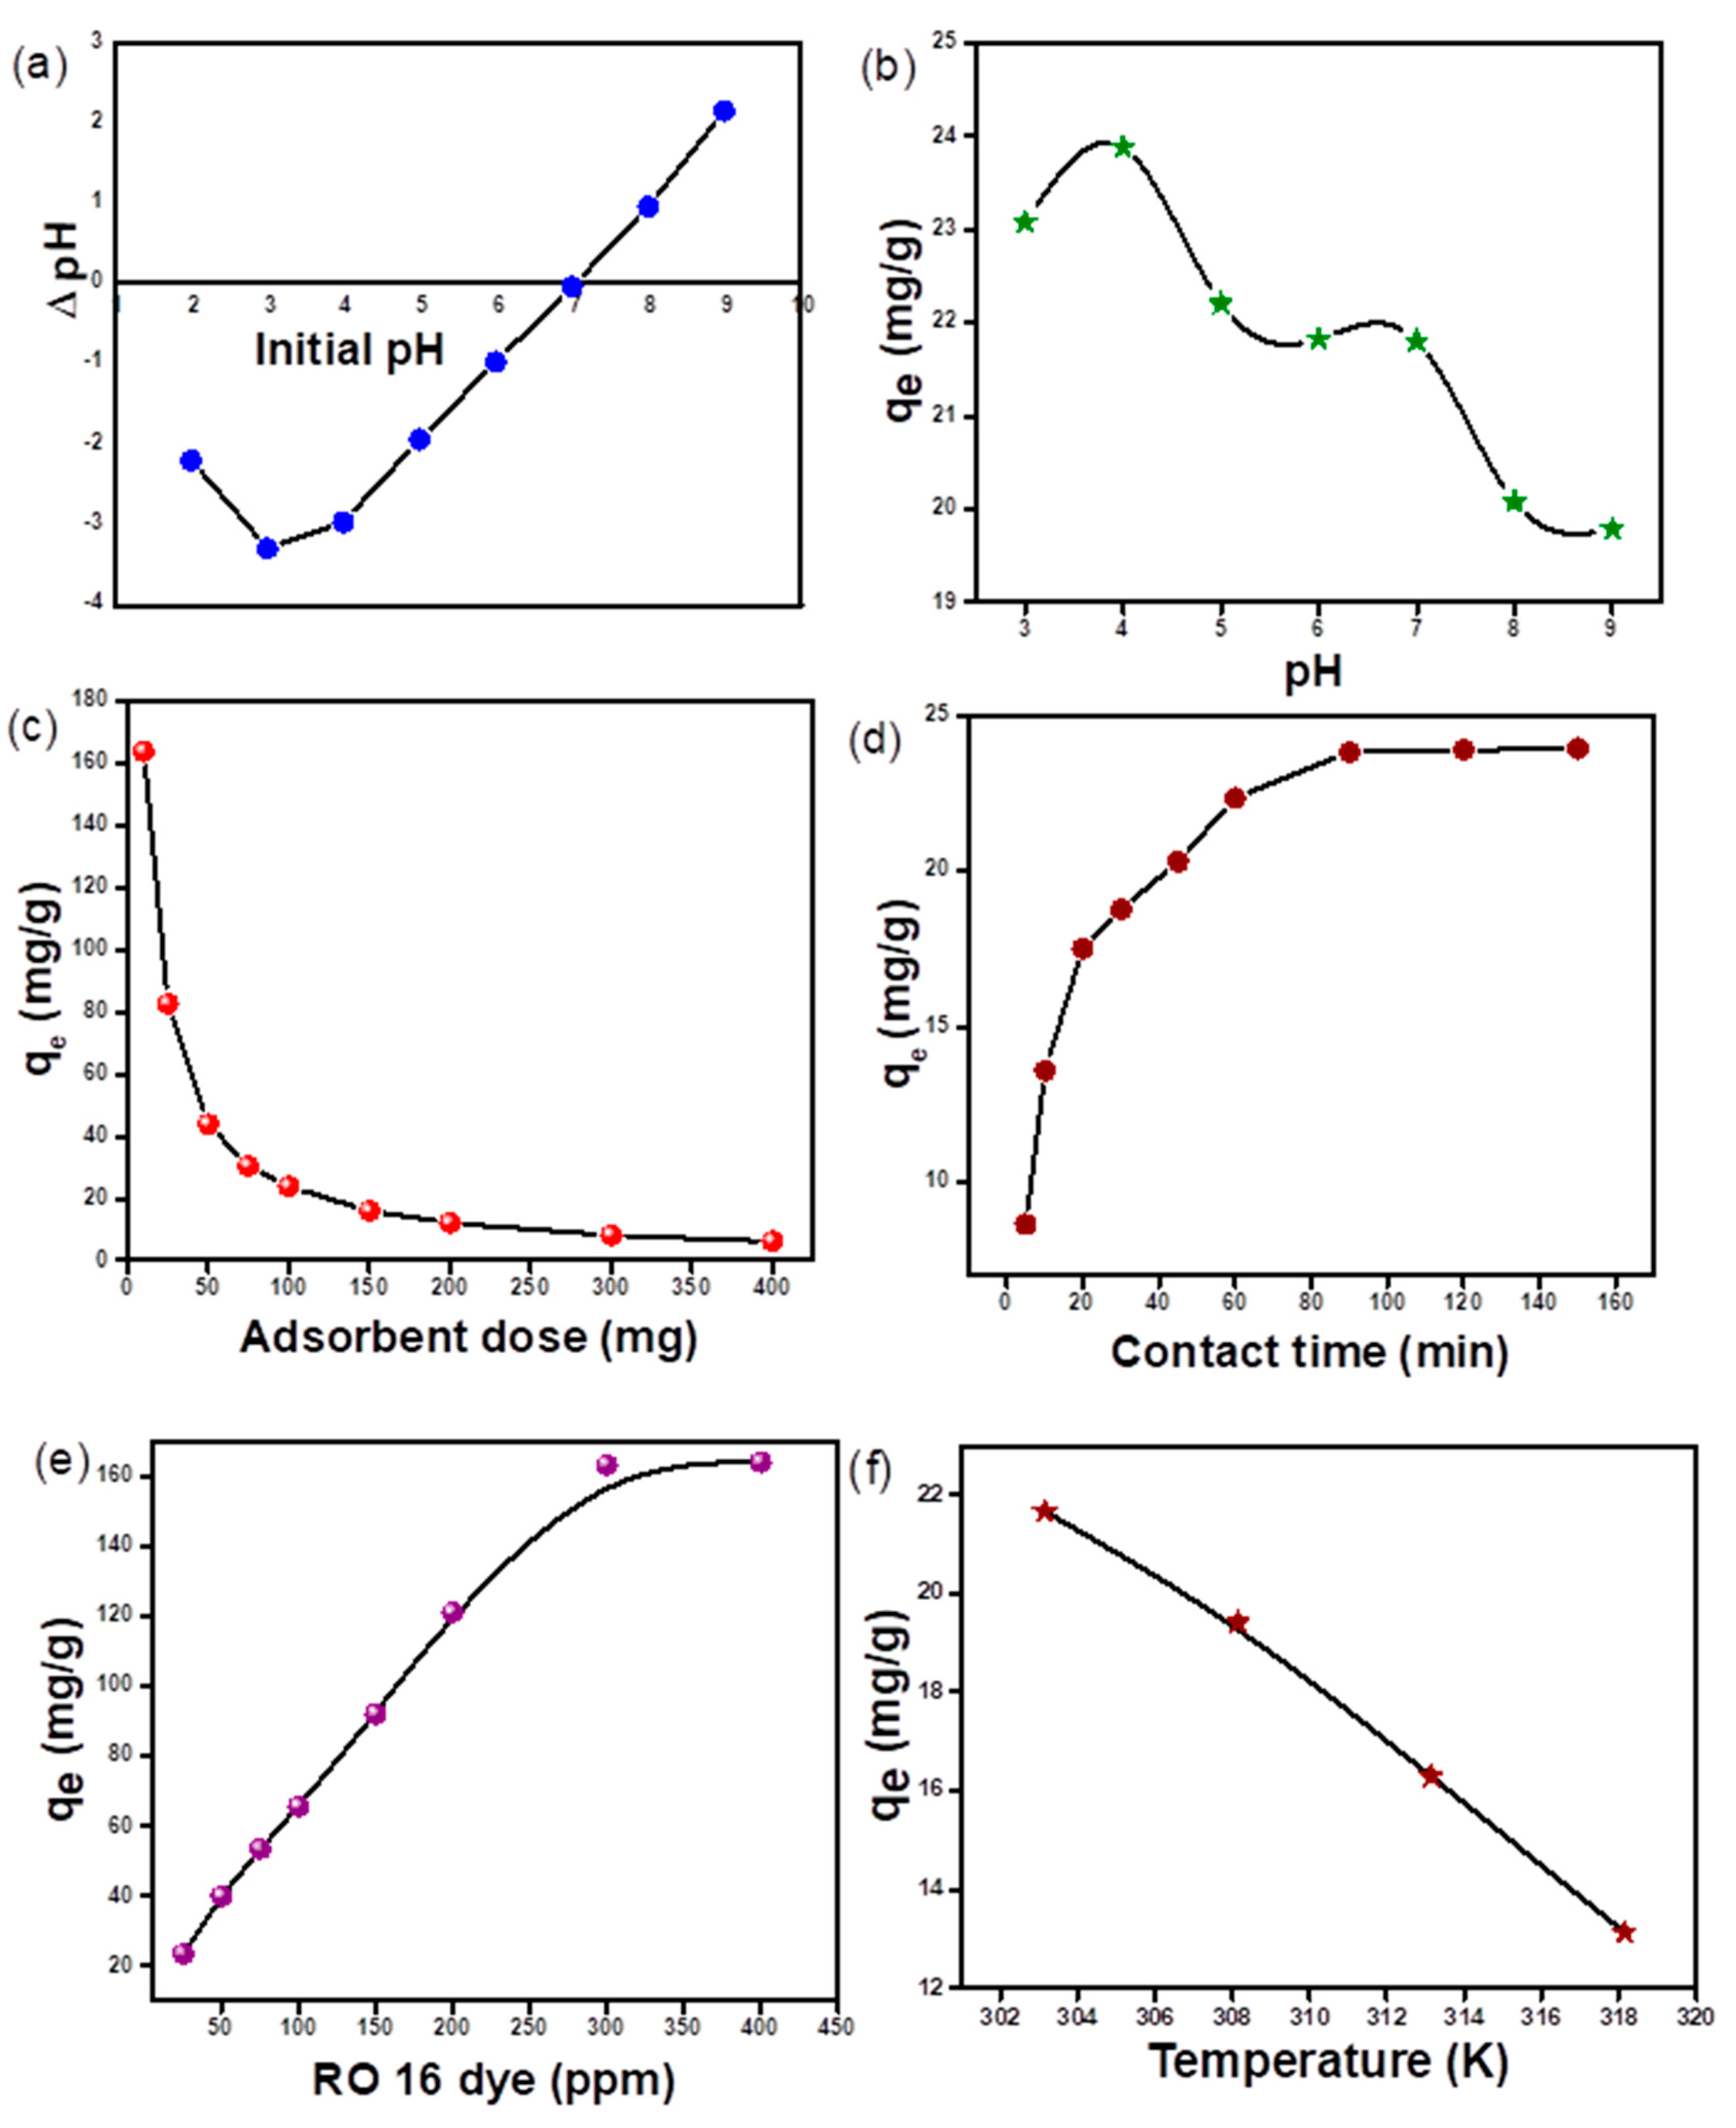
3.2.1. pH Point of Zero Charge (PZC) and Surface Analysis

The adsorbent surface charge will be positive if the solution pH is smaller than PZC and will be negative if the pH value is greater than PZC [41]. Hence, adsorption will occur for species whose charges are opposite those of the adsorbent species. The graph plotted between changes in pH as a function of the initial solution pH intersected the x-axis at a 7.0 value of pH (Figure 8a). This shows that the adsorbent surface is positively charged below pH 7.0 and negative above this pH [22,25].

3.2.2. Influence of Solution pH on RO 16 Dye Adsorption

pH has a significant effect on the utility of adsorbents and on the chemical properties of adsorbates because it alters surface charges and ionic charges, which might affect the utility of adsorbents. Hence, adsorption removal efficiency could be greatly influenced by pH. Results showed that pH 4 was the best for the adsorption of RO 16 dye with maximum adsorption efficiency (Figure 8b). At lower pH values, chitosan begins to dissolve in the solution while at higher pH values, the surface of the adsorbent will be carrying an excess negative charge and thereby repelling the anionic dye moieties.

3.2.3. Influence of m-CGPA Dose

The optimal required dosage of adsorbent was assessed by varying the adsorbent dose from 10 mg to 400 mg of a fixed concentration of dye with optimized pH 4. With an increase in adsorbent dosage, the percentage removal increases based on an increase in the number of available sites for adsorption. However, the adsorption efficiency of the material in terms of qe was found to decrease with an increase in the adsorbent dose. This similar general decrease trend in adsorption capacity with an increase in adsorbent dosage because of bare adsorbent sites synchronizes with previously reported articles in the literature [43,44]. Figure 8c represents the influence of m-CGPA dose on adsorption.

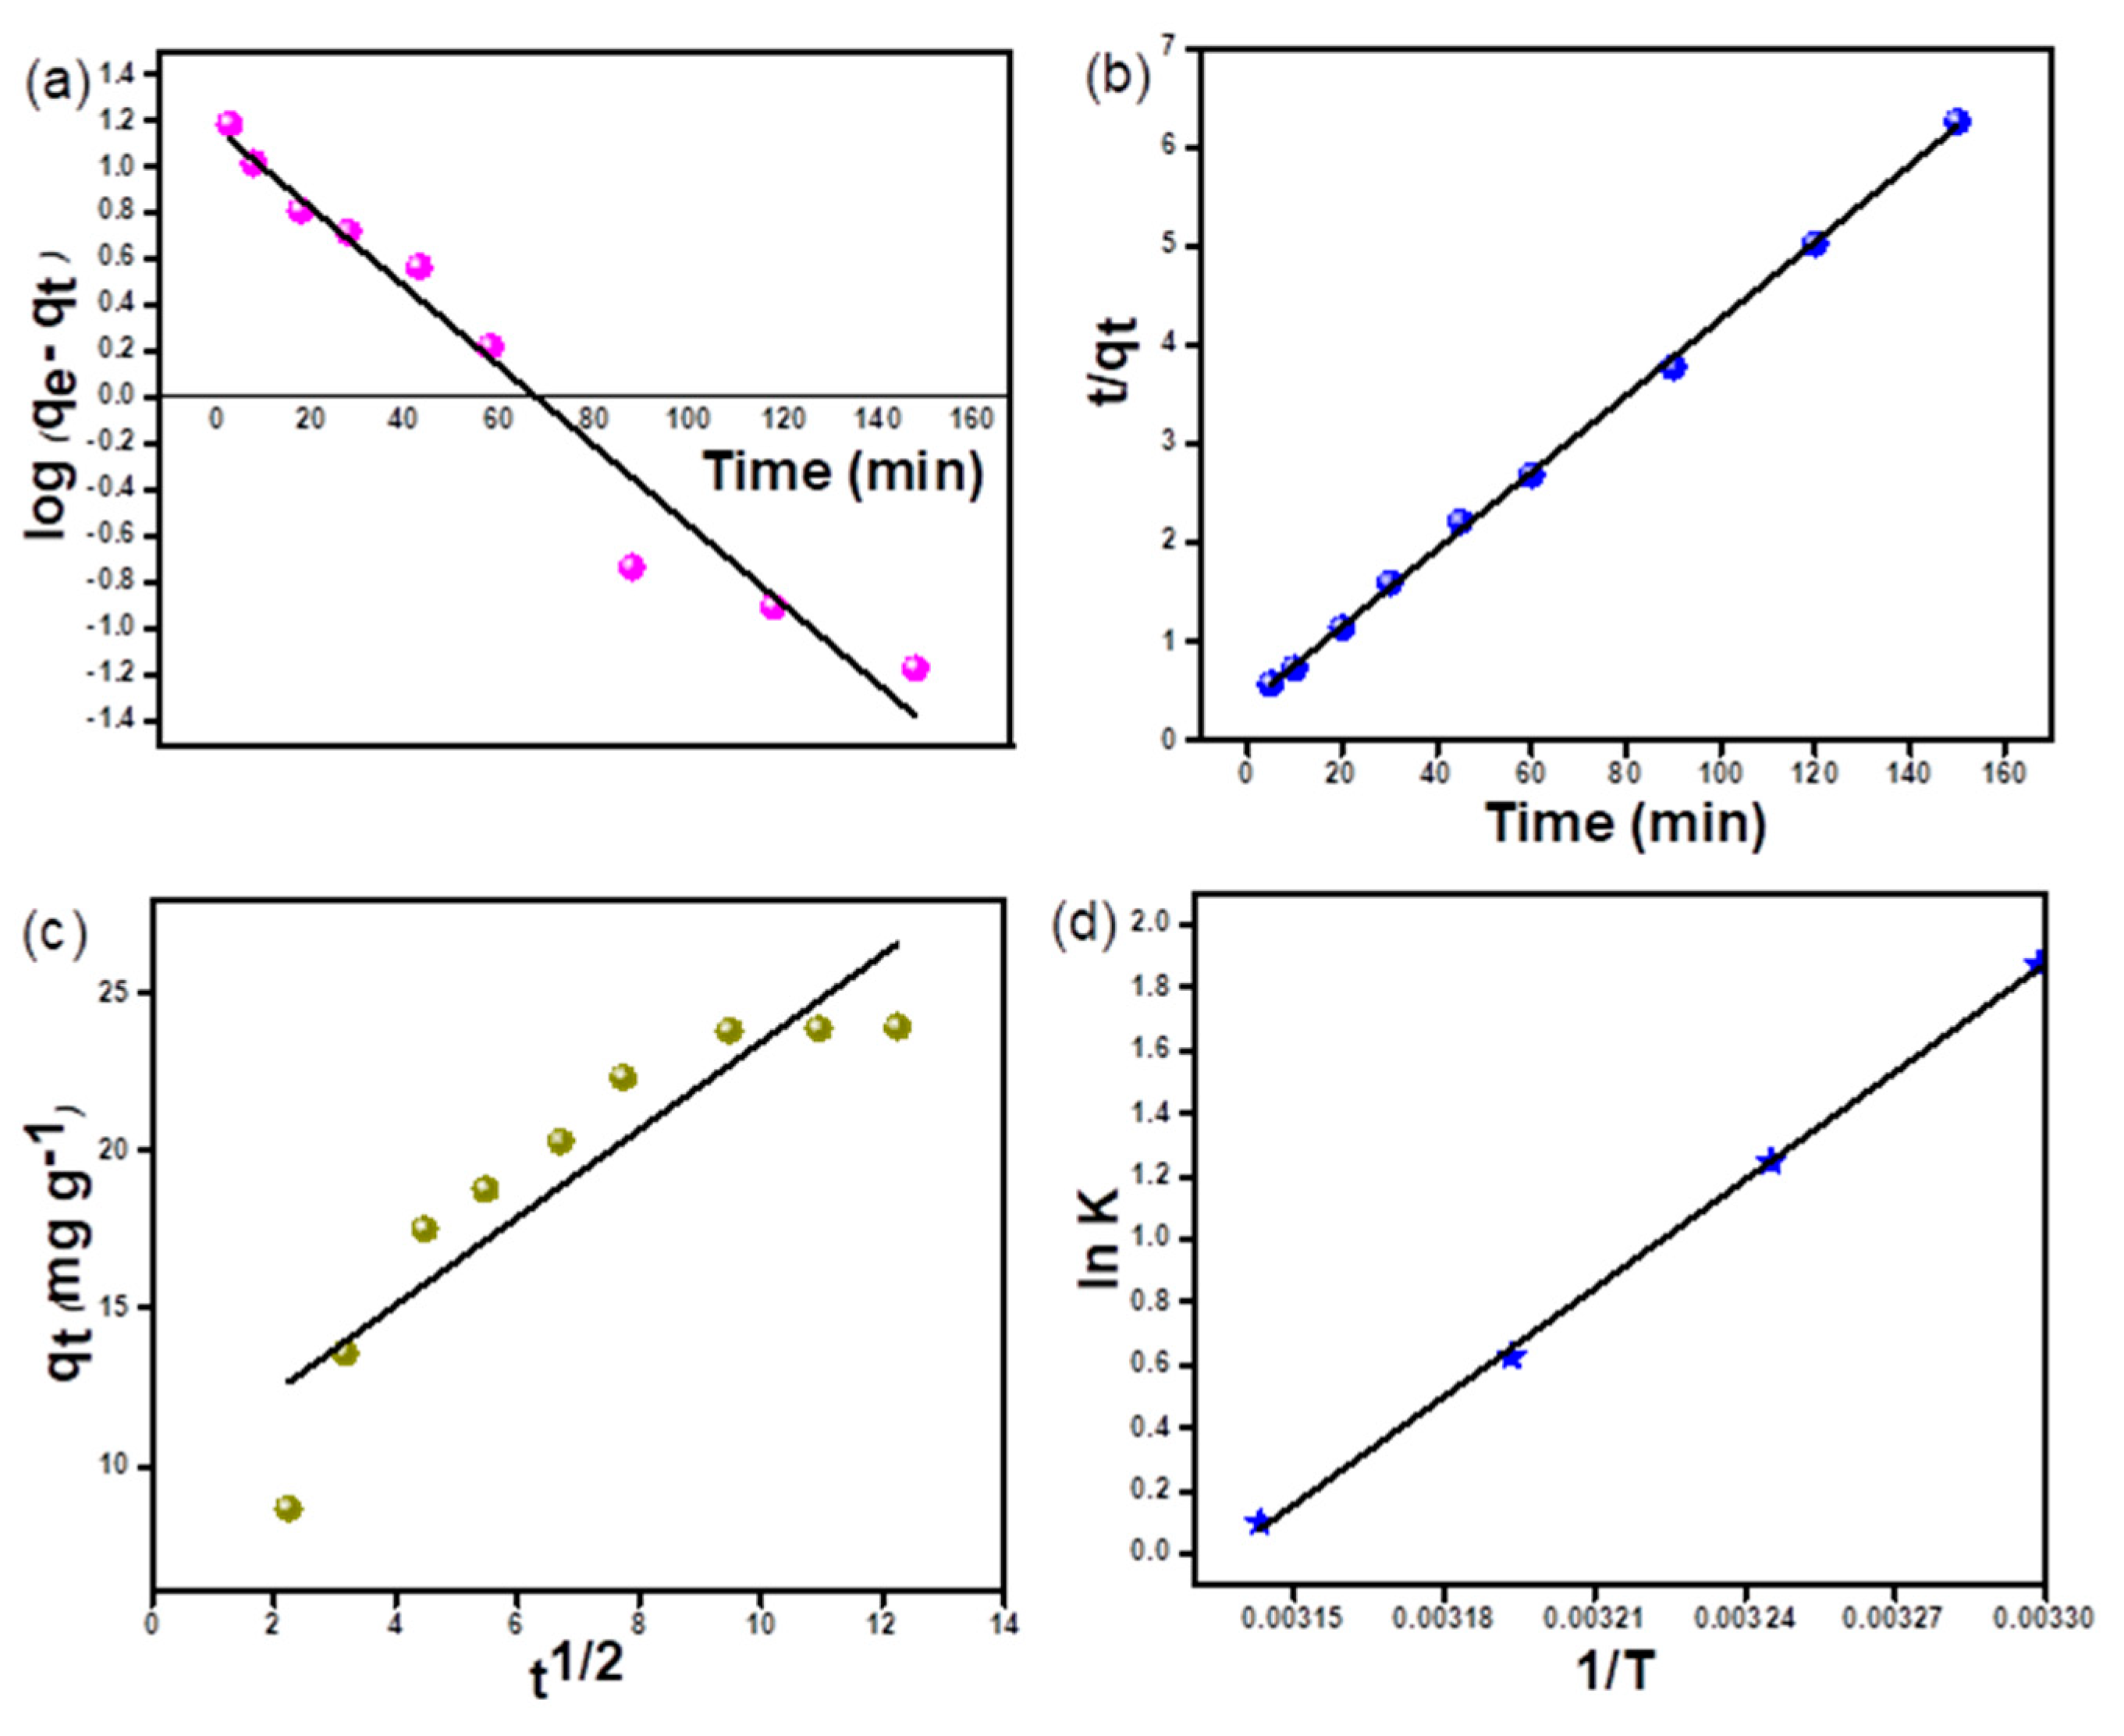
3.3. Adsorption Kinetics Studies

The interdependence of removal efficiency and period of adsorption was checked out by varying contact time from 5 to 150 min. With an increase in contact time to 90 min, the adsorption efficiency increased considerably, thereafter it tended to be stable aiming toward equilibrium attainment of the adsorption process. Hence, this time period was selected for further studies (Figure 8d). This is in agreement with earlier studies, the rapid adsorption at the beginning was in reference to abundant vacant sites for adsorption. However, with the passage of time, dye molecules gradually filled adsorption sites, inhibiting further adsorption and slowing the total adsorption process till equilibrium was reached [22,45]. Figure 9 collates kinetic plots of pseudo-first order, pseudo-second order, and intraparticle diffusion model (IPD). The fitting parameters are listed in Table 1. From the table, it is clear that the experimental data are in complete agreement with the pseudo-second-order kinetics model equation. The expression for this pseudo-second-order model is as given below:
t q t = 1 k 2 q e 2 + t q e
where k 2 (g mg−1 min−1) stands for the rate constant of the pseudo-second-order reaction.
As the value of R2 for the pseudo-second-order model is precisely close to unity as compared with the kinetic model of the pseudo-first-order model and intraparticle diffusion model, this model shows a higher degree of fitting. This suggests that the rate-limiting step is a chemical adsorption process as per the assumption of the pseudo-second-order model. Hence, this validates the fact that microspheres adsorb predominantly by the chemisorption process [46]. Also, the non-zero value of intercept from the graph (Figure 9c) implies that the boundary layer along with the diffusion process plays a significant role in the rate-limiting step. The pictorial representation of the effect of adsorption time has been shown in Supplementary Figure S2.

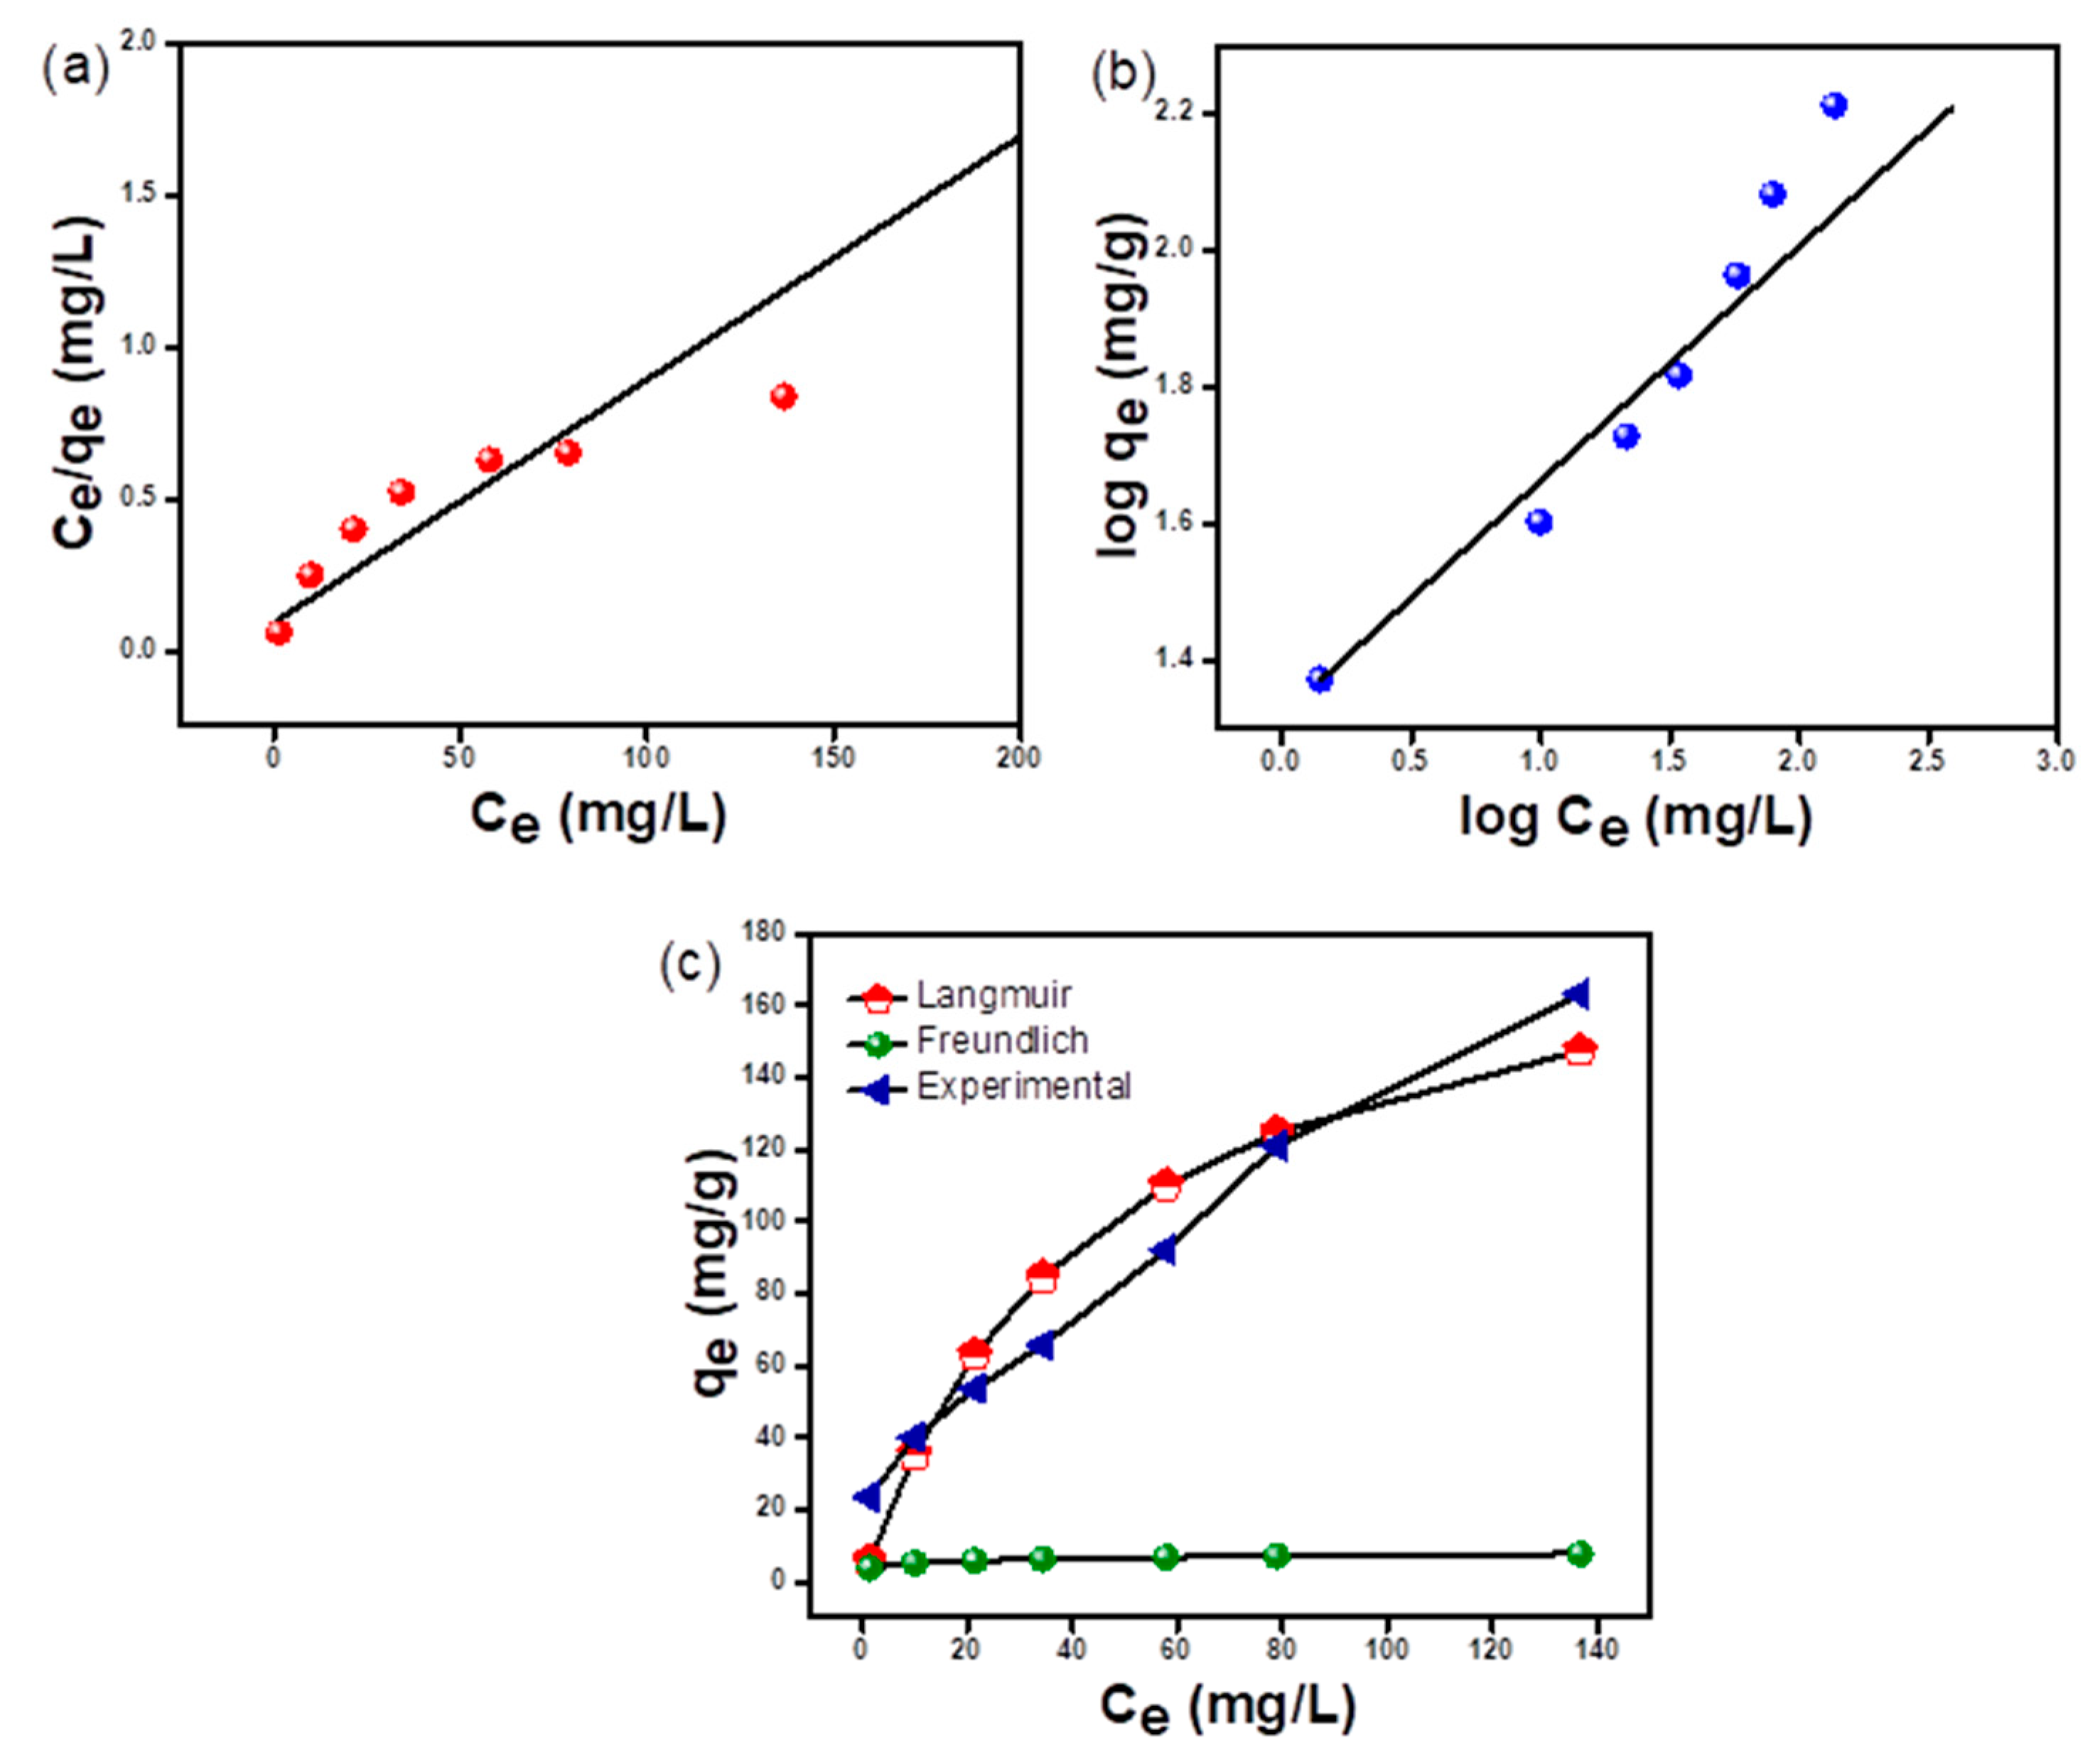
3.4. Adsorption Isotherm Studies

Figure 8e depicts the relation between adsorption capacity and increasing concentration of RO 16 dye. As depicted in the figure, at a low concentration of dye, sufficient sites are available for the adsorption of RO 16 dye. When RO 16 concentration is increased, the surface of the adsorbent gets swiftly occupied by dye molecules, thereby saturating the surface and therefore limiting adsorption capacity [47]. The increase in adsorption capacity of adsorbent from 23.6 to 163.3 mg/g with an increase in dye concentration from 25 to 300 mg L−1 may be a result of an increased concentration gradient, which acts as a driving force for the adsorption of RO 16 dye by hydrogel microspheres [48]. Also, phenomenal interactions between hydrogel microspheres and complex moieties of dye come up with equilibrium attainment.
The adsorption isotherm studies help in establishing the mechanism of interaction between adsorbent and adsorbate. The interrelationship between adsorption capacity and varying dye concentration details information for the knowledge of probable adsorption mechanisms. The adsorption capacities were calculated by fitting experimental data into the equation by various models. Langmuir and Freundlich’s models were used for fitting experimental data (Supplementary Table S1). The various adsorption isotherm parameters are presented in Table 2. Figure 10c collates that the Langmuir isotherm model fits best for experimental data. Also, the magnitude of the regression coefficient from Table 2 lies unerringly near 1.0 for the homogenous Langmuir isotherm model. The Langmuir isotherm is predicated on the idea that each valence point on the adsorbent’s surface has the capacity to adsorb one molecule [49]. The separation factor, one of the essential parameters obtained from Langmuir isotherm being in the range from 0.13–0.375 for 25–300 mg L−1 initial concentrations of RO 16 dye shows monolayer homogenous adsorption of dye molecules emphasizing the fact that RO 16 dye adsorption process by hydrogel microspheres is favorable and advantageous [50]. The value of n = 2.914 suggests a chemisorption type of adsorption process and the 1 / n value being less than unity specifies an excellent process of adsorption [33,51]. The maximum adsorption capacity for hydrogel microspheres obtained from the best-fitted Langmuir adsorption isotherm model shows a benchmark when compared with other similar chitosan-based adsorbents. This has been represented with the help of Table 2. Hence, it can be considered advantageous because of its easy separation and promising hydrogel microspheres adsorbent for RO 16 dye decontamination from effluents.
The adsorption capacity of m-CGPA was compared with different types of adsorbents as reported in the literature and represented in Table 3. The table indicates that m-CGPA is an admirable reusable adsorbent for the decontamination of RO 16 dye.

3.5. Adsorption Thermodynamics

The temperature’s impact on the dye adsorption process is represented in Figure 8f. The adsorption was significantly influenced by temperature and so the effect of temperature on the dye adsorption process was investigated. Different thermodynamic parameters like free energy change (ΔG°), enthalpy change (ΔH°), and entropy change (ΔS°) were estimated for knowing the spontaneity and the nature of the adsorption process. The calculation formula for these three basic thermodynamic parameters is as follows:
Δ G ° = R T ln K
ln K = Δ S ° R Δ H ° R T
where R is the universal gas constant, T is the absolute temperature in Kelvin, and K is the equilibrium constant obtained from the ratio of RO 16 dye concentration on adsorbent in adsorbed phase to that of the remaining RO 16 concentration in the solution phase. The vant Hoff plot of ln K versus 1/T gave a straight line and slope as well an intercept was used to calculate ΔH and ΔS thermodynamic parameters (Figure 9d). The values of these thermodynamic parameters are presented in Table 4. The overall change in free energy was negative at all temperatures during the adsorption process and hence indicating the fact that the process was spontaneous as well as thermodynamically favorable. With the decrease in temperature, the value of free energy change decreased corresponding to lower driving force and hence low adsorption capacity at high temperatures. The high value of free energy as compared to TΔS concludes the fact that the adsorption process is purely enthalpy driven in nature.

3.6. RO 16 Dye Column Adsorption Studies

Adsorption studies using a fixed bed column were carried out in order to properly evaluate the adsorption process while handling larger volumes of sample. For this, 100 mg L−1 RO 16 dye solution of pH 4.0 was allowed to pass through a glass column of 10 cm long having 0.5 g of hydrogel microspheres with a flow rate of 10 mL min−1. For the purpose of quantifying the dye, each 25 mL eluent portion was examined for outlet dye concentration. The breakthrough curve was plotted and column parameters such as breakthrough capacity, exhaustion capacity, and degree of exhaustion volume were evaluated with the help of the following Equations (6)–(8). The column parameters have been presented in Table 5. Results show that these hydrogel microspheres are promising for use as an adsorbent in removing RO 16 dye in large sample volumes. Figure 11 shows the experimental graph of column adsorption studies.
Breakthrough   Capacity   mg / g = Breakthrough   Volume L × Inlet   RO   16   dye   concentration mg / L Wt .   of   m CGPA   g
Exhaustion   Capacity   mg / g = Exhaustion   Volume L × Inlet   RO   16   dye   concentration mg / L Wt .   of   m CGPA   g
Degree   of   column   utilization   %   = Breakthrough   Volume Exhaustion   Volume × 100

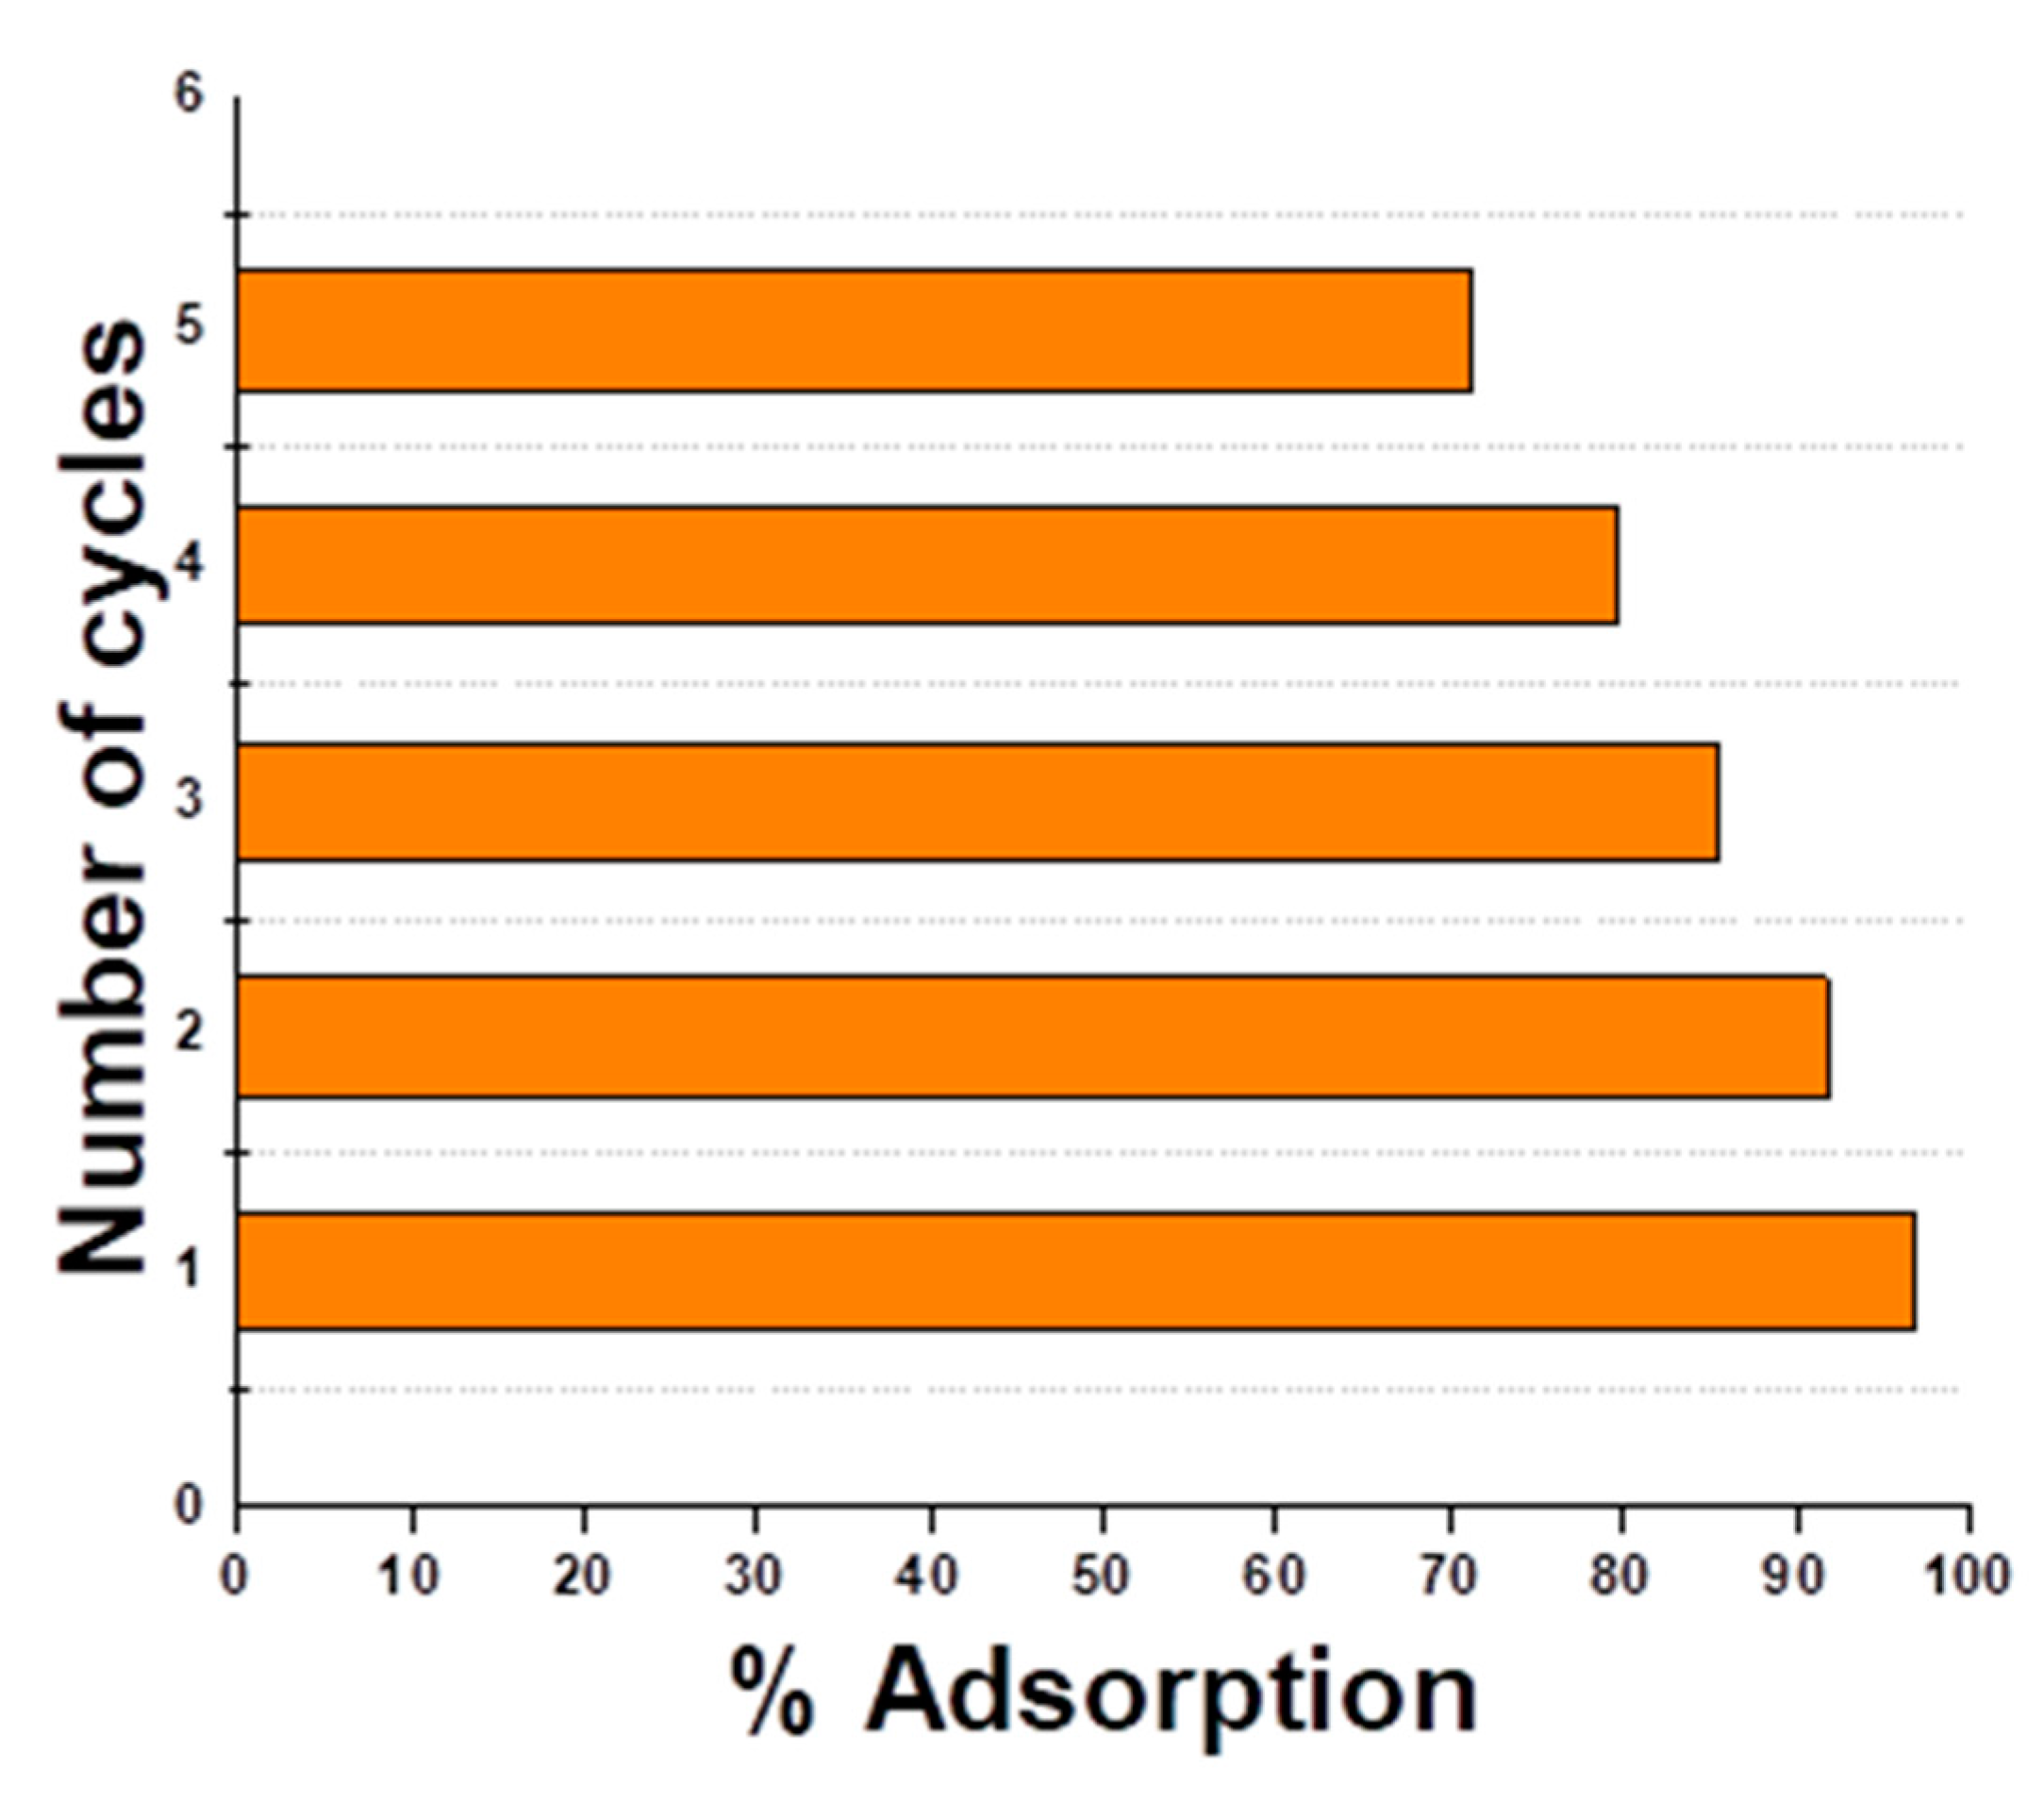
3.7. Regeneration Studies of Adsorbent

For the practical application of an adsorbent in the industry, it is essential to evaluate economic feasibility and conservation of resources. The regeneration of hydrogel microspheres was tested by using different solutions of 5% NaOH, NaCl, Na2CO3, and Na2SO4. The best results of adsorption were obtained using a 5% solution of NaOH. Even after four cycles of regeneration, % adsorption was more than 70%. This is responsible for the low cost of dye removal. These results (Figure 12) pointed out that hydrogel microspheres are recyclable and stable adsorbent for the removal of RO 16 dye. The desorption of dye molecules from the adsorbent surface can be attributed to the fact that the adsorbent surface acquires a negative charge above pH 7. Hence, under strongly basic conditions, there is a large negative charge on m-CGPA and so there is electrostatic repulsion between the anionic dye and the adsorbent.

4. Conclusions

The m-CGPA hydrogel microspheres were synthesized by the method of instantaneous gelation. The characterization of hydrogel microspheres confirmed that magnetization was comparable with other magnetic adsorbents and so Fe3O4 was introduced successfully. The adsorption parameters were optimized and it was found that acidic pH and 90 min of contact time were favorable for the adsorption of RO 16 dye. The isotherm and kinetic data of the experiment fitted well with the Langmuir isotherm model and pseudo-second-order kinetic model respectively. The higher adsorption capacity (196.3 mg g−1) of these hydrogel microspheres shows that this can be used as an efficient adsorbent and hence reckoning importance for anionic dye removal. Adsorption thermodynamics disclose the fact that the process was spontaneous, thermodynamically favorable, and enthalpy-driven in nature. Being magnetic and hence easily recoverable from the solution adds an advantage to the practical application of adsorbents in industry. The higher adsorption capacity, easy recovery, reusability, and application to large sample volumes make it a promising adsorbent for the decontamination of dyes present in industrial wastewater. The material could be applied to large sample volumes using the fixed bed column method and also could be regenerated and reused in multiple cycles.

Supplementary Materials

The following supporting information can be downloaded at: https://www.mdpi.com/article/10.3390/w14213411/s1, Figure S1: As formed hydrogel beads of m-CGPA; Figure S2: Removal of dye at by m-CGPA at different time intervals; Figure S3: Magnetic separation of m-CGPA using external magnet; Table S1: Linearized equations of the adsorption isotherm models studied.

Author Contributions

P.D.: Data curation, Investigation, Methodology, Writing—original draft, Formal analysis; V.G.: Project administration; A.B.: Supervision; A.S.: Conceptualization; R.J.: Investigation, Writing—review; S.P.: Visualization, Writing—Reviewing and Editing. All authors have read and agreed to the published version of the manuscript.

Funding

This research received no external funding.

Data Availability Statement

Raw data is available and may be provided on request.

Acknowledgments

Facilities provided by RTM Nagpur University are gratefully acknowledged.

Conflicts of Interest

The authors declare no conflict of interest.

References

  1. Mathew, S.; Yella, A.; Gao, P.; Humphry-Baker, R.; Curchod, B.F.E.; Ashari-Astani, N.; Tavernelli, I.; Rothlisberger, U.; Nazeeruddin, M.K.; Gratzel, M. Dye-sensitized solar cells with 13% efficiency achieved through the molecular engineering of porphyrin sensitizers. Nat. Chem. 2014, 6, 242–247. [Google Scholar] [CrossRef] [PubMed] [Green Version]
  2. Li, M.; Sun, W.; Tian, R.S.; Cao, J.F.; Tian, Y.; Gurram, B.; Fan, J.L.; Peng, X.J. Smart J-Aggregate of cyanine photosensitizer with the ability to target tumor and enhance photodynamic therapy efficacy. Biomaterials 2021, 269, 120532. [Google Scholar] [CrossRef] [PubMed]
  3. Yagub, M.T.; Sen, T.K.; Afroze, S.; Ang, H.M. Dye and its removal from aqueous solution by adsorption: A review. Adv. Colloid Interface Sci. 2014, 209, 172–184. [Google Scholar] [CrossRef] [PubMed]
  4. Wang, X.; Jiang, C.; Hou, B.; Wang, Y.; Hao, C.; Wu, J. Carbon composite lignin-based adsorbents for the adsorption of dyes. Chemosphere 2018, 206, 587–596. [Google Scholar] [CrossRef]
  5. Manzoor, K.; Ahmad, M.; Ahmad, S.; Ikram, S. Synthesis, characterization, kinetics, and thermodynamics of EDTA-modified chitosan-carboxymethyl cellulose as Cu(II) ion adsorbent. ACS Omega 2019, 4, 17425–17437. [Google Scholar] [CrossRef] [Green Version]
  6. Qiao, A.; Cui, M.; Huang, R.; Ding, G.; Qi, W.; He, Z.; Klemeš, J.J.; Su, R. Advances in nanocellulose-based materials as adsorbents of heavy metals and dyes. Carbohydr. Polym. 2021, 272, 118471. [Google Scholar] [CrossRef]
  7. Gulati, A.; Malik, J.; Kakkar, R. Mesoporous rGO@ZnO composite: Facile synthesis and excellent water treatment performance by pesticide adsorption and catalytic oxidative dye degradation. Chem. Eng. Res. Des. 2020, 160, 254–263. [Google Scholar] [CrossRef]
  8. Chen, Q.; Yao, Y.; Zhao, Z.; Zhou, J.; Chen, Z. Long term catalytic activity of pyrite in heterogeneous Fenton-like oxidation for the tertiary treatment of dyeing wastewater. J. Environ. Chem. Eng. 2021, 9, 105730. [Google Scholar] [CrossRef]
  9. Turcanu, A.; Bechtold, T. Cathodic decolourisation of reactive dyes in model effluents released from textile dyeing. J. Clean. Prod. 2017, 142, 1397–1405. [Google Scholar] [CrossRef]
  10. Tu, H.; Li, D.; Yi, Y.; Liu, R.; Wu, Y.; Dong, X.Y.; Shi, X.W.; Deng, H.B. Incorporation of rectorite into porous polycaprolactone/TiO2 nanofibrous mats for enhancing photocatalysis properties towards organic dye pollution. Compos. Commun. 2019, 15, 58–63. [Google Scholar] [CrossRef]
  11. Amornpitoksuk, P.; Suwanboon, S.; Kaowphong, S.; Randorn, C.; Graidist, P. Photocatalytic activity of K2Ti6O13/TiO2 nanocomposite prepared using water extract of wood ash from waste for degradation of dye pollutants. J. Taiwan Inst. Chem. Eng. 2020, 117, 242–251. [Google Scholar] [CrossRef]
  12. Barzegar, M.H.; Sabzehmeidani, M.M.; Ghaedi, M.; Avargani, V.M.; Moradi, Z.; Roy, V.A.L.; Heidari, H. S-scheme heterojunction g-C3N4/TiO2 with enhanced photocatalytic activity for degradation of a binary mixture of cationic dyes using solar parabolic trough reactor. Chem. Eng. Res. Des. 2021, 174, 307–318. [Google Scholar] [CrossRef]
  13. Hachemaoui, M.; Boukoussa, B.; Ismail, I.; Mokhtar, A.; Taha, I.; Iqbal, J.; Hacini, S.; Bengueddach, A.; Hamacha, R. CuNPs-loaded amines-functionalized-SBA-15 as effective catalysts for catalytic reduction of cationic and anionic dyes. Colloid Surf. A 2021, 623, 126729. [Google Scholar] [CrossRef]
  14. He, S.J.; Sun, W.H.; Wang, J.I.; Chen, L.J.; Zhang, Y.X.; Yu, J. Enhancement of biodegradability of real textile and dyeing wastewater by electron beam irradiation. Radiat. Phys. Chem. 2016, 124, 203–207. [Google Scholar] [CrossRef]
  15. Mella, B.; Puchana-Rosero, M.J.; Costa, D.E.S.; Gutterres, M. Utilization of tannery solid waste as an alternative biosorbent for acid dyes in wastewater treatment. J. Mol. Liq. 2017, 242, 137–145. [Google Scholar] [CrossRef]
  16. Cui, J.L.; Wang, X.; Yu, S.Y.; Zhong, C.S.; Wang, N.; Meng, J. Facile fabrication of chitosan-based adsorbents for effective removal of cationic and anionic dyes from aqueous solutions. Int. J. Biol. Macromol. 2020, 165, 2805–2812. [Google Scholar] [CrossRef]
  17. Wazir, M.B.; Daud, M.; Ali, F.; Al-Harthi, M.A. Dendrimer assisted dye-removal: A critical review of adsorption and catalytic degradation for wastewater treatment. J. Mol. Liq. 2020, 315, 113775. [Google Scholar] [CrossRef]
  18. Ahmad, M.; Zhang, B.; Wang, J.I.; Xu, J.; Manzoor, K.; Ahmad, S. New method for hydrogel synthesis from diphenylcarbazide chitosan for selective copper removal. Int. J. Biol. Macromol. 2019, 136, 189–198. [Google Scholar] [CrossRef]
  19. Noreen, S.; Bhatti, H.N.; Iqbal, M.; Hussain, F.; Sarim, F.M. Chitosan, starch, polyaniline and polypyrrole biocomposite with sugarcane bagasse for the efficient removal of Acid Black dye. Int. J. Biol. Macromol. 2020, 147, 439–452. [Google Scholar] [CrossRef]
  20. Ma, X.; Liu, Y.; Zhang, Q.; Sun, S.; Zhou, X.; Xu, Y. A novel natural lignocellulosic biosorbent of sunflower stem-pith for textile cationic dyes adsorption. J. Clean. Prod. 2022, 331, 129878. [Google Scholar] [CrossRef]
  21. Krishnamoorthi, R.; Anbazhagan, R.; Tsai, H.; Wang, C.; Lai, J. Preparation of caffeic acid-polyethyleneimine modified sponge for emulsion separation and dye adsorption. J. Taiwan Inst. Chem. Eng. 2021, 118, 325–333. [Google Scholar] [CrossRef]
  22. Doondani, P.; Gomase, V.; Sarvanan, D.; Jugade, R. Chitosan coated cotton-straw-biochar as an admirable adsorbent for reactive red dye. Results Eng. 2022, 15, 100515. [Google Scholar] [CrossRef]
  23. Yaashikaa, P.R.; Kumar, P.S.; Karishma, S. Review on biopolymers and composites–Evolving material as adsorbents in removal of environmental pollutants. Environ. Res. 2022, 212, 113114. [Google Scholar] [CrossRef] [PubMed]
  24. Saheed, I.O.; Oh, W.D.; Suah, F.B.M. Chitosan modifications for adsorption of pollutants—A review. J. Hazard. Mater. 2021, 408, 124889. [Google Scholar] [CrossRef]
  25. Khapre, M.; Pande, S.; Jugade, R. Glutaraldehyde-cross-linked chitosan–alginate composite for organic dyes removal from aqueous solutions. Int. J. Biol. Macromol. 2021, 190, 862–875. [Google Scholar] [CrossRef]
  26. Jeyaseelan, C.; Chaudhary, N.; Jugade, R. Sulphate-crosslinked chitosan as an adsorbent for the removal of congo red dye from aqueous solution. Air Soil Water Res. 2018, 11, 1178622118811680. [Google Scholar] [CrossRef] [Green Version]
  27. Korde, S.; Deshmukh, S.; Tandekar, S.; Jugade, R. Implementation of response surface methodology in physi-chemisorption of Indigo carmine dye using modified chitosan composite. Carbohydr. Polym. 2021, 2, 100081. [Google Scholar] [CrossRef]
  28. Vithalkar, S.; Jugade, R. Adsorptive removal of crystal violet from aqueous solution by crosslinked chitosan coated bentonite. Mater. Today Proc. 2020, 29, 1025–1032. [Google Scholar] [CrossRef]
  29. Khapre, M.; Jugade, R. Tetrabutylammonium Impregnated Chitosan for Adsorptive Removal of Harmful Carcinogenic Dyes from Water-Bodies. Chem. Afr. 2021, 4, 993–1005. [Google Scholar] [CrossRef]
  30. Park, J.S.; Park, J.W.; Ruckenstein, E. Thermal and dynamic mechanical analysis of PVA/MC blend hydrogels. Polymer 2001, 42, 4271–4280. [Google Scholar] [CrossRef]
  31. Liang, S.; Liu, L.; Huang, Q.; Yam, K.L. Preparation of single or double-network chitosan/poly(vinyl alcohol) gel films through selectively cross-linking method. Carbohydr. Polym. 2009, 77, 718–724. [Google Scholar] [CrossRef]
  32. Wu, J.; Huang, D.; Liu, X.; Meng, J.; Tang, C.; Xu, J. Remediation of As(III) and Cd(II) co-contamination and its mechanism in aqueous systems by a novel calcium based magnetic biochar. J. Hazard. Mater. 2018, 348, 10–19. [Google Scholar] [CrossRef]
  33. You, X.; Zhou, R.; Zhu, Y.; Bu, D.; Cheng, D. Adsorption of dyes methyl violet and malachite green from aqueous solution on multi-step modified rice husk powder in single and binary systems: Characterization, adsorption behavior and physical interpretations. J. Hazard. Mater. 2022, 430, 128445. [Google Scholar] [CrossRef] [PubMed]
  34. Zhu, H.-Y.; Fu, Y.-Q.; Jiang, R.; Yao, J.; Xiao, L.; Zeng, G.-M. Novel magnetic chitosan/poly(vinyl alcohol) hydrogel beads: Preparation, characterization, and application for adsorption of dye from aqueous solution. Bioresour. Technol. 2012, 105, 24–30. [Google Scholar] [CrossRef] [PubMed]
  35. Shekhawat, A.; Kahu, S.; Sarvanan, D.; Jugade, R. Tin (IV) cross-linked chitosan for the removal of As (III). Carbohydr. Polym. 2017, 172, 205–212. [Google Scholar] [CrossRef]
  36. Thomas, J.D. Novel Associated PVA/PVP Hydrogels for Nucleus Pulposus Replacement. Master’s Thesis, Drexel University, Philadelphia, PA, USA, September 2001. [Google Scholar]
  37. Hassan, C.M.; Peppas, N.A. Structure and Applications of Poly(vinyl alcohol) Hydrogels Produced by Conventional Crosslinking or by Freezing/Thawing Methods. Adv Polym Sci 2000, 153, 37–65. [Google Scholar]
  38. Cheng, M.M.; Huang, L.J.; Wang, Y.X.; Zhao, Y.C.; Tang, J.G.; Wang, Y.; Zhang, Y.; Hedayti, M.; Kipper, M.J.; Wikramasinghe, S.R. Synthesis of graphene oxide/polyacrylamide composite membranes for organic dyes/water separation in water purification. J. Mater. Sci. 2019, 54, 252–264. [Google Scholar] [CrossRef]
  39. Waldron, R.D. Infrared spectra of Ferrites. Phys. Rev. 1955, 99, 1727. [Google Scholar] [CrossRef]
  40. Nalbandian, L.; Patrikiadou, E.; Zaspalis, V.; Patrikidou, A.; Hatzidaki, E.C.N. Papandreou Magnetic Nanoparticles in Medical Diagnostic Applications: Synthesis, Characterization and Proteins Conjugation. Curr. Nanosci. 2015, 12, 455–468. [Google Scholar] [CrossRef]
  41. Korde, S.; Tandekar, S.; Jugade, R. Novel mesoporous chitosan-zirconia-ferrosoferric oxide as magnetic composite for defluoridation of water. J. Environ. Chem. Eng. 2020, 8, 104360. [Google Scholar] [CrossRef]
  42. Wang, W.; Zhou, S.; Li, R.; Peng, Y.; Sun, C.; Vakili, M.; Yu, G.; Deng, S. Preparation of magnetic powdered carbon/nano-Fe3O4 composite for efficient adsorption and degradation of trichloropropyl phosphate from water. J. Hazard. Mater. 2021, 416, 125765. [Google Scholar] [CrossRef]
  43. Saeed, T.; Naeem, A.; Mahmood, T.; Khan, A.; Ahmad, Z.; Hamayun, M. Kinetic and thermodynamic studies of polyvinyl chloride composite of manganese oxide nanosheets for the efficient removal of dye from water. Water Sci. Technol. 2021, 84, 1–14. [Google Scholar] [CrossRef]
  44. Saeed, T.; Naeem, A.; Din, I.U.; Farooq, M.; Khan, I.W.; Hamayun, M.; Malik, T. Synthesis of chitosan composite of metal-organic framework for the adsorption of dyes; kinetic and thermodynamic approach. J. Hazard. Mater. 2022, 427, 127902. [Google Scholar] [CrossRef] [PubMed]
  45. Roy, A.; Adhikari, B.; Majumder, S.B. Equilibrium, kinetic, and thermodynamic studies of azo dye adsorption from aqueous solution by chemically modified lignocellulosic jute fiber. Ind. Eng. Chem. Res. 2013, 52, 6502–6512. [Google Scholar] [CrossRef]
  46. Song, Y.; Wang, N.; Yang, L.Y.; Wang, Y.G.; Yu, D.; Ouyang, X. Facile fabrication of ZIF-8/calcium alginate microparticles for highly efficient adsorption of Pb(II) from aqueous solutions. Ind. Eng. Chem. Res. 2019, 58, 6394–6401. [Google Scholar] [CrossRef]
  47. You, X.; Wang, R.; Zhu, Y.; Sui, W.; Cheng, D. Comparison of adsorption properties of a cellulose-rich modified rice husk for the removal of methylene blue and aluminum (III) from their aqueous solution. Ind. Crop. Prod. 2021, 170, 113687. [Google Scholar] [CrossRef]
  48. Wu, Y.H.; Hu, Y.; Xie, Z.W.; Feng, S.X.; Li, B.; Mi, X.M. Characterization of biosorption process of acid orange 7 on waste brewery’s yeast. Appl. Biochem. Biotechnol. 2011, 163, 882–894. [Google Scholar] [CrossRef] [PubMed]
  49. Vijayakumar, G.; Dharmendirakumar, M.; Renganathan, S.; Sivanesan, S.; Baskar, G.; Elango, K.P. Removal of Congo Red from aqueous solutions by perlite. Clean Soil Air Water 2009, 37, 355–364. [Google Scholar] [CrossRef]
  50. Langmuir, I. The adsorption of gases on plain surfaces of Glass, Mica and Platinum. J. Am. Chem. Soc. 1918, 40, 1361–1403. [Google Scholar] [CrossRef] [Green Version]
  51. Freundlich, H.M.F. Over the adsorption in solution. J. Phys. Chem. 1906, 57, 385–471. [Google Scholar]
  52. Yildirim, A.; Acay, H.; Baran, F. Synthesis and characterisation of mushroom based nanocomposite and its efficiency on dye biosorption via antimicrobial activity. J. Environ. Anal. Chem. 2022, 28, 1068–1082. [Google Scholar] [CrossRef]
  53. Shah, J.A.; Ashfaq, T.; Khan, M.S.; Riaz, N.; Shah, K.H.; Arshad, M.; Shah, S.H.; Amin, B.A.; Arfan, M.; Zhang, Y.; et al. Melia azedarach Activated Carbon and its novel TiO2 Nanocomposite for Chemisorption and Photodecoloration of Reactive Orange 16: Isotherm and Kinetic Modeling. Curr. Anal. Chem. 2021, 17, 107–119. [Google Scholar] [CrossRef]
  54. Marrakchi, F.; Ahmed, M.J.; Khanday, W.; Asif, M.; Hameed, B. Mesoporous carbonaceous material from fish scales as low-cost adsorbent for reactive orange 16 adsorption. J. Taiwan Inst. Chem. Eng. 2017, 71, 47–54. [Google Scholar] [CrossRef]
  55. Malek, N.N.A.; Jawad, A.H.; Abdulhameed, A.S.; Ismail, K.; Hameed, B. New magnetic Schiff’s base-chitosan-glyoxal/fly ash/ Fe3O4 biocomposite for the removal of anionic azo dye: An optimized process. Int. J. Biol. Macromol. 2020, 146, 530–539. [Google Scholar] [CrossRef] [PubMed]
  56. Malek, N.N.A.; Jawad, A.H.; Ismail, K.; Razuan, R.; Alothman, Z.A. Fly ash modified magnetic chitosan-polyvinyl alcohol blend for reactive orange 16 dye removal: Adsorption parametric optimization. Int. J. Biol. Macromol. 2021, 189, 464–476. [Google Scholar] [CrossRef] [PubMed]
  57. Marrakchi, F.; Khanday, W.; Asif, M.; Hameed, B. Cross-linked chitosan/sepiolite composite for the adsorption of methylene blue and reactive orange 16. Int. J. Biol. Macromol. 2016, 93, 1231–1239. [Google Scholar] [CrossRef] [PubMed]
Figure 1. Schematic representation for the synthesis of m-CGPA.
Water 14 03411 g001
Figure 2. Comparison of adsorption efficiencies of various adsorbents.
Water 14 03411 g002
Figure 3. FT-IR spectra of (a) Chitosan (b) Polyvinyl alcohol (c) Graphite (d) Fe3O4 nanoparticles (e) m-CGPA before adsorption (f) m-CGPA after adsorption of RO 16 dye.
Water 14 03411 g003
Figure 4. (a) SEM image and (b) EDS mapping analysis of m-CGPA.
Water 14 03411 g004
Figure 5. XRD patterns of (a) Chitosan and (b) m-CGPA.
Water 14 03411 g005
Figure 6. Magnetic hysteresis loop of m-CGPA in comparison with Fe3O4.
Water 14 03411 g006
Figure 7. TGA curves of Chitosan, PVA, Graphite, Fe3O4, and m-CGPA.
Water 14 03411 g007
Figure 8. (a) pH PZC for m-CGPA, (b) influence of RO 16 dye pH (c) influence of m-CGPA dose (d) influence of contact time on RO 16 dye adsorption (e) influence of initial concentration of RO 16 dye (f) influence of temperature on RO 16 dye adsorption.
Water 14 03411 g008
Figure 9. RO 16 adsorption kinetics plot (a) PFO kinetic plot (b) PSO kinetic plot (c) IPD kinetic plot (d) vant Hoff plot.
Water 14 03411 g009
Figure 10. RO 16 adsorption isotherm curves of m-CGPA (a) Langmuir isotherm model curve (b) Freundlich isotherm model curve (c) Best fitted isotherm curve.
Water 14 03411 g010
Figure 11. RO 16 dye Column adsorption curve for m-CGPA.
Water 14 03411 g011
Figure 12. Reusability assays of m-CGPA.
Water 14 03411 g012
Table 1. Kinetic Parameters for RO 16 dye adsorption.
Adsorption Kinetics ModelMathematical ParametersObtained Values
PFO kinetic modelk1 (min−1)0.0396
R20.965
PSO kinetic modelk2 (g mg−1 min−1)0.00456
R20.999
IPD modelki (mg g−1 min−0.5)1.391
C9.546
R20.834
Table 2. Adsorption isotherm parameters of m-CGPA for RO 16 dye adsorption.
ModelDerived ParameterMathematical Values
Langmuirqm (mg g−1)196.3
b (L g−1)0.022
RL0.376
R20.964
FreundlichKF (mg1−1/n g−1 L−1)3.743
n2.913
R20.881
Table 3. Adsorption capacities of different kinds of adsorbents toward RO 16 dye adsorption.
Adsorbentqm (mg/g)References
Pleurotus ostreatus-based-chitosan64.46[52]
Activated carbon-Darek sawdust92.84[53]
Carbonized fish scales105.8[54]
Chitosan-glyoxal/fly ash/Fe3O4112.5[55]
Fly ash modified magnetic chitosan-polyvinyl alcohol123.8[56]
chitosan/sepiolite composite190.96[57]
m-CGPA196.3Present study
Table 4. Thermodynamic parameters for RO 16 adsorption on m-CGPA.
T (K)∆G (kJ mol−1)∆H (kJ mol−1)∆S (J mol−1 K−1)
303.15−4.6912−95.205−298.58
308.15−3.1983
313.15−1.7054
318.15−0.2125
Table 5. Operational and derived parameters for RO 16 Column adsorption by m-CGPA.
ParametersObserved Values
Inlet RO 16 concentration (mg L−1)
Adsorbent weight (g)
Flow rate (mL min−1)
100
0.5
10
Breakthrough Volume (mL)250
Breakthrough Capacity (mg g−1)50
Exhaustion volume (mL)1050
Exhaustion Capacity (mg g−1)210
Degree of column utilization (%)23.81
Publisher’s Note: MDPI stays neutral with regard to jurisdictional claims in published maps and institutional affiliations.

