
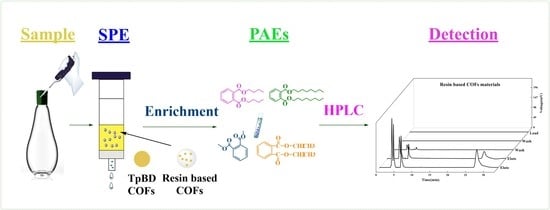
Determination of Phthalate Esters in Beverages and Water Samples by Solid Phase Extraction with Resin Based COFs as Filler


Abstract
:
1. Introduction
2. Materials and Methods
2.1. Reagents and Instruments
2.2. Experimental Methods
2.2.1. Preparation of COF Materials
2.2.2. Determination of PAEs Adsorption Behavior
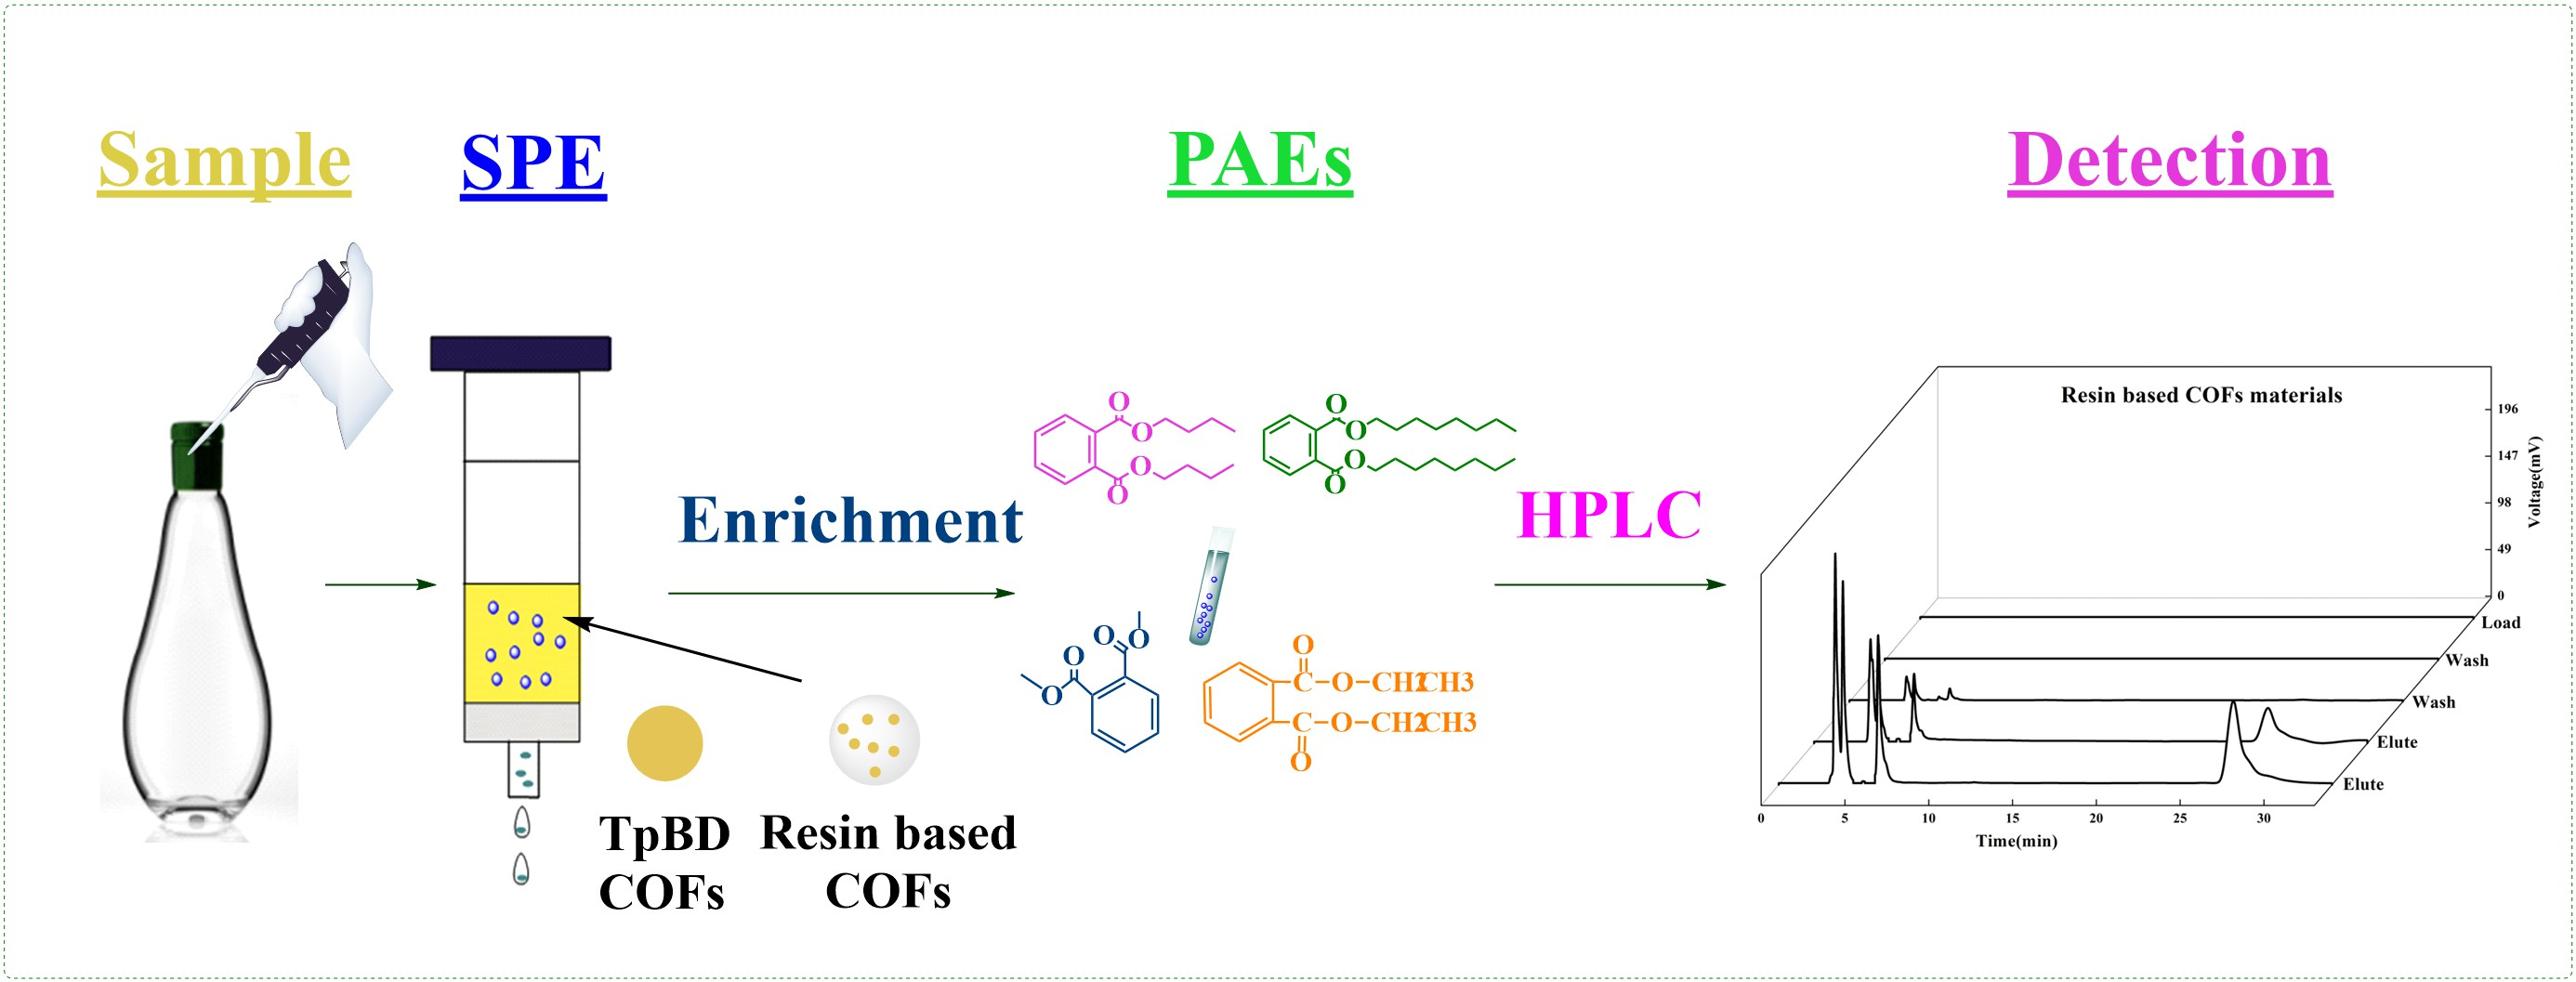
2.2.3. SPE Experiment
2.2.4. Stability Experiment of Four PAEs
2.2.5. Precision Analysis of Four PAEs
2.2.6. Recovery of Four PAEs
2.2.7. Repetitive Experiment of Four PAEs
3. Results
3.1. Adsorption Behavior of Materials
3.1.1. Analysis of Adsorption Effect of COFS on PAEs
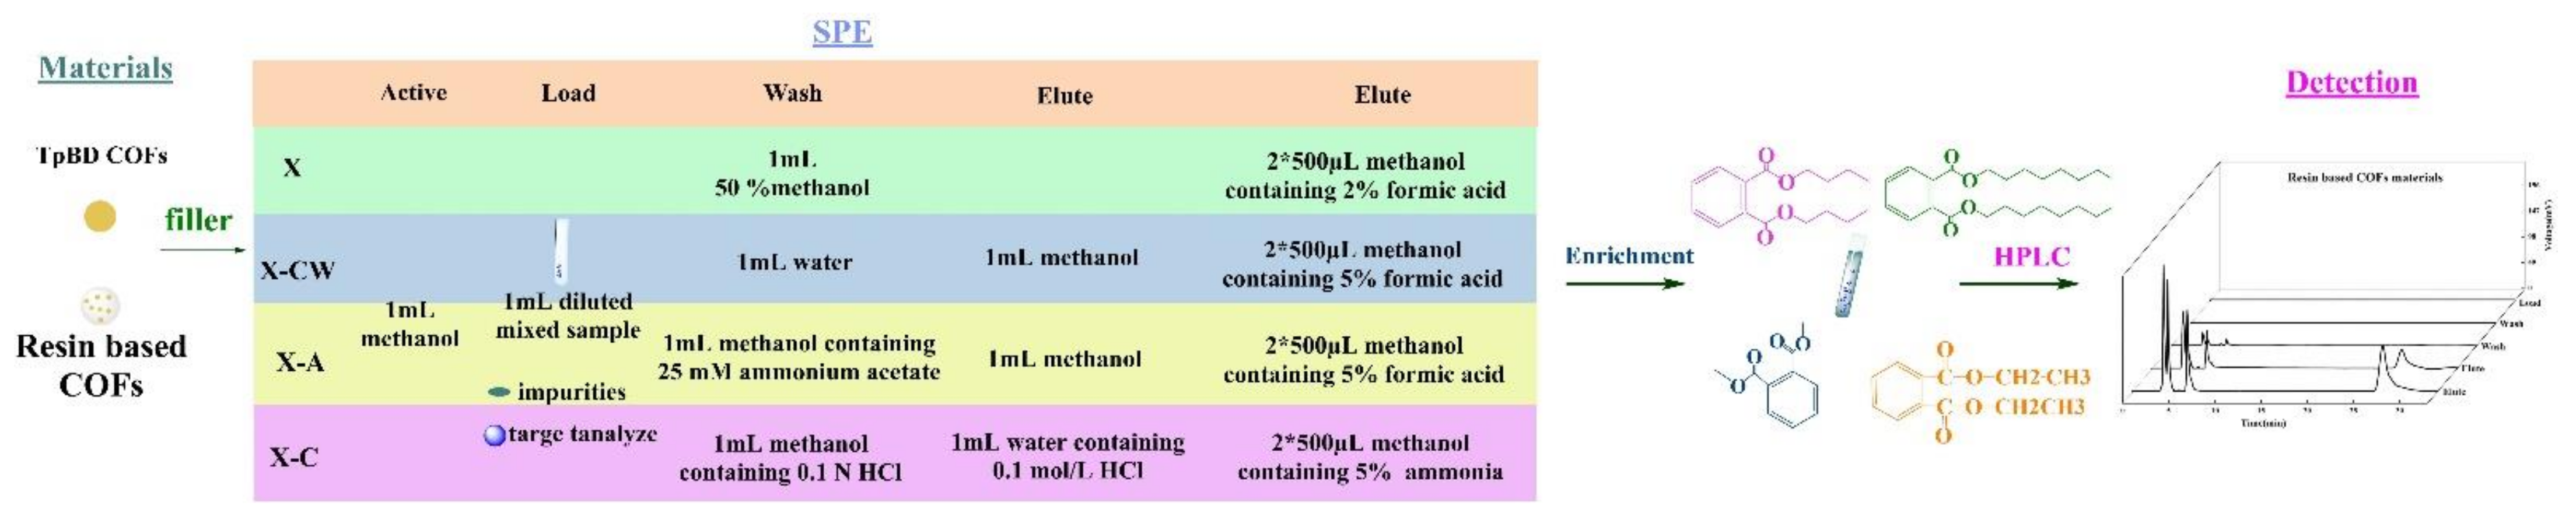
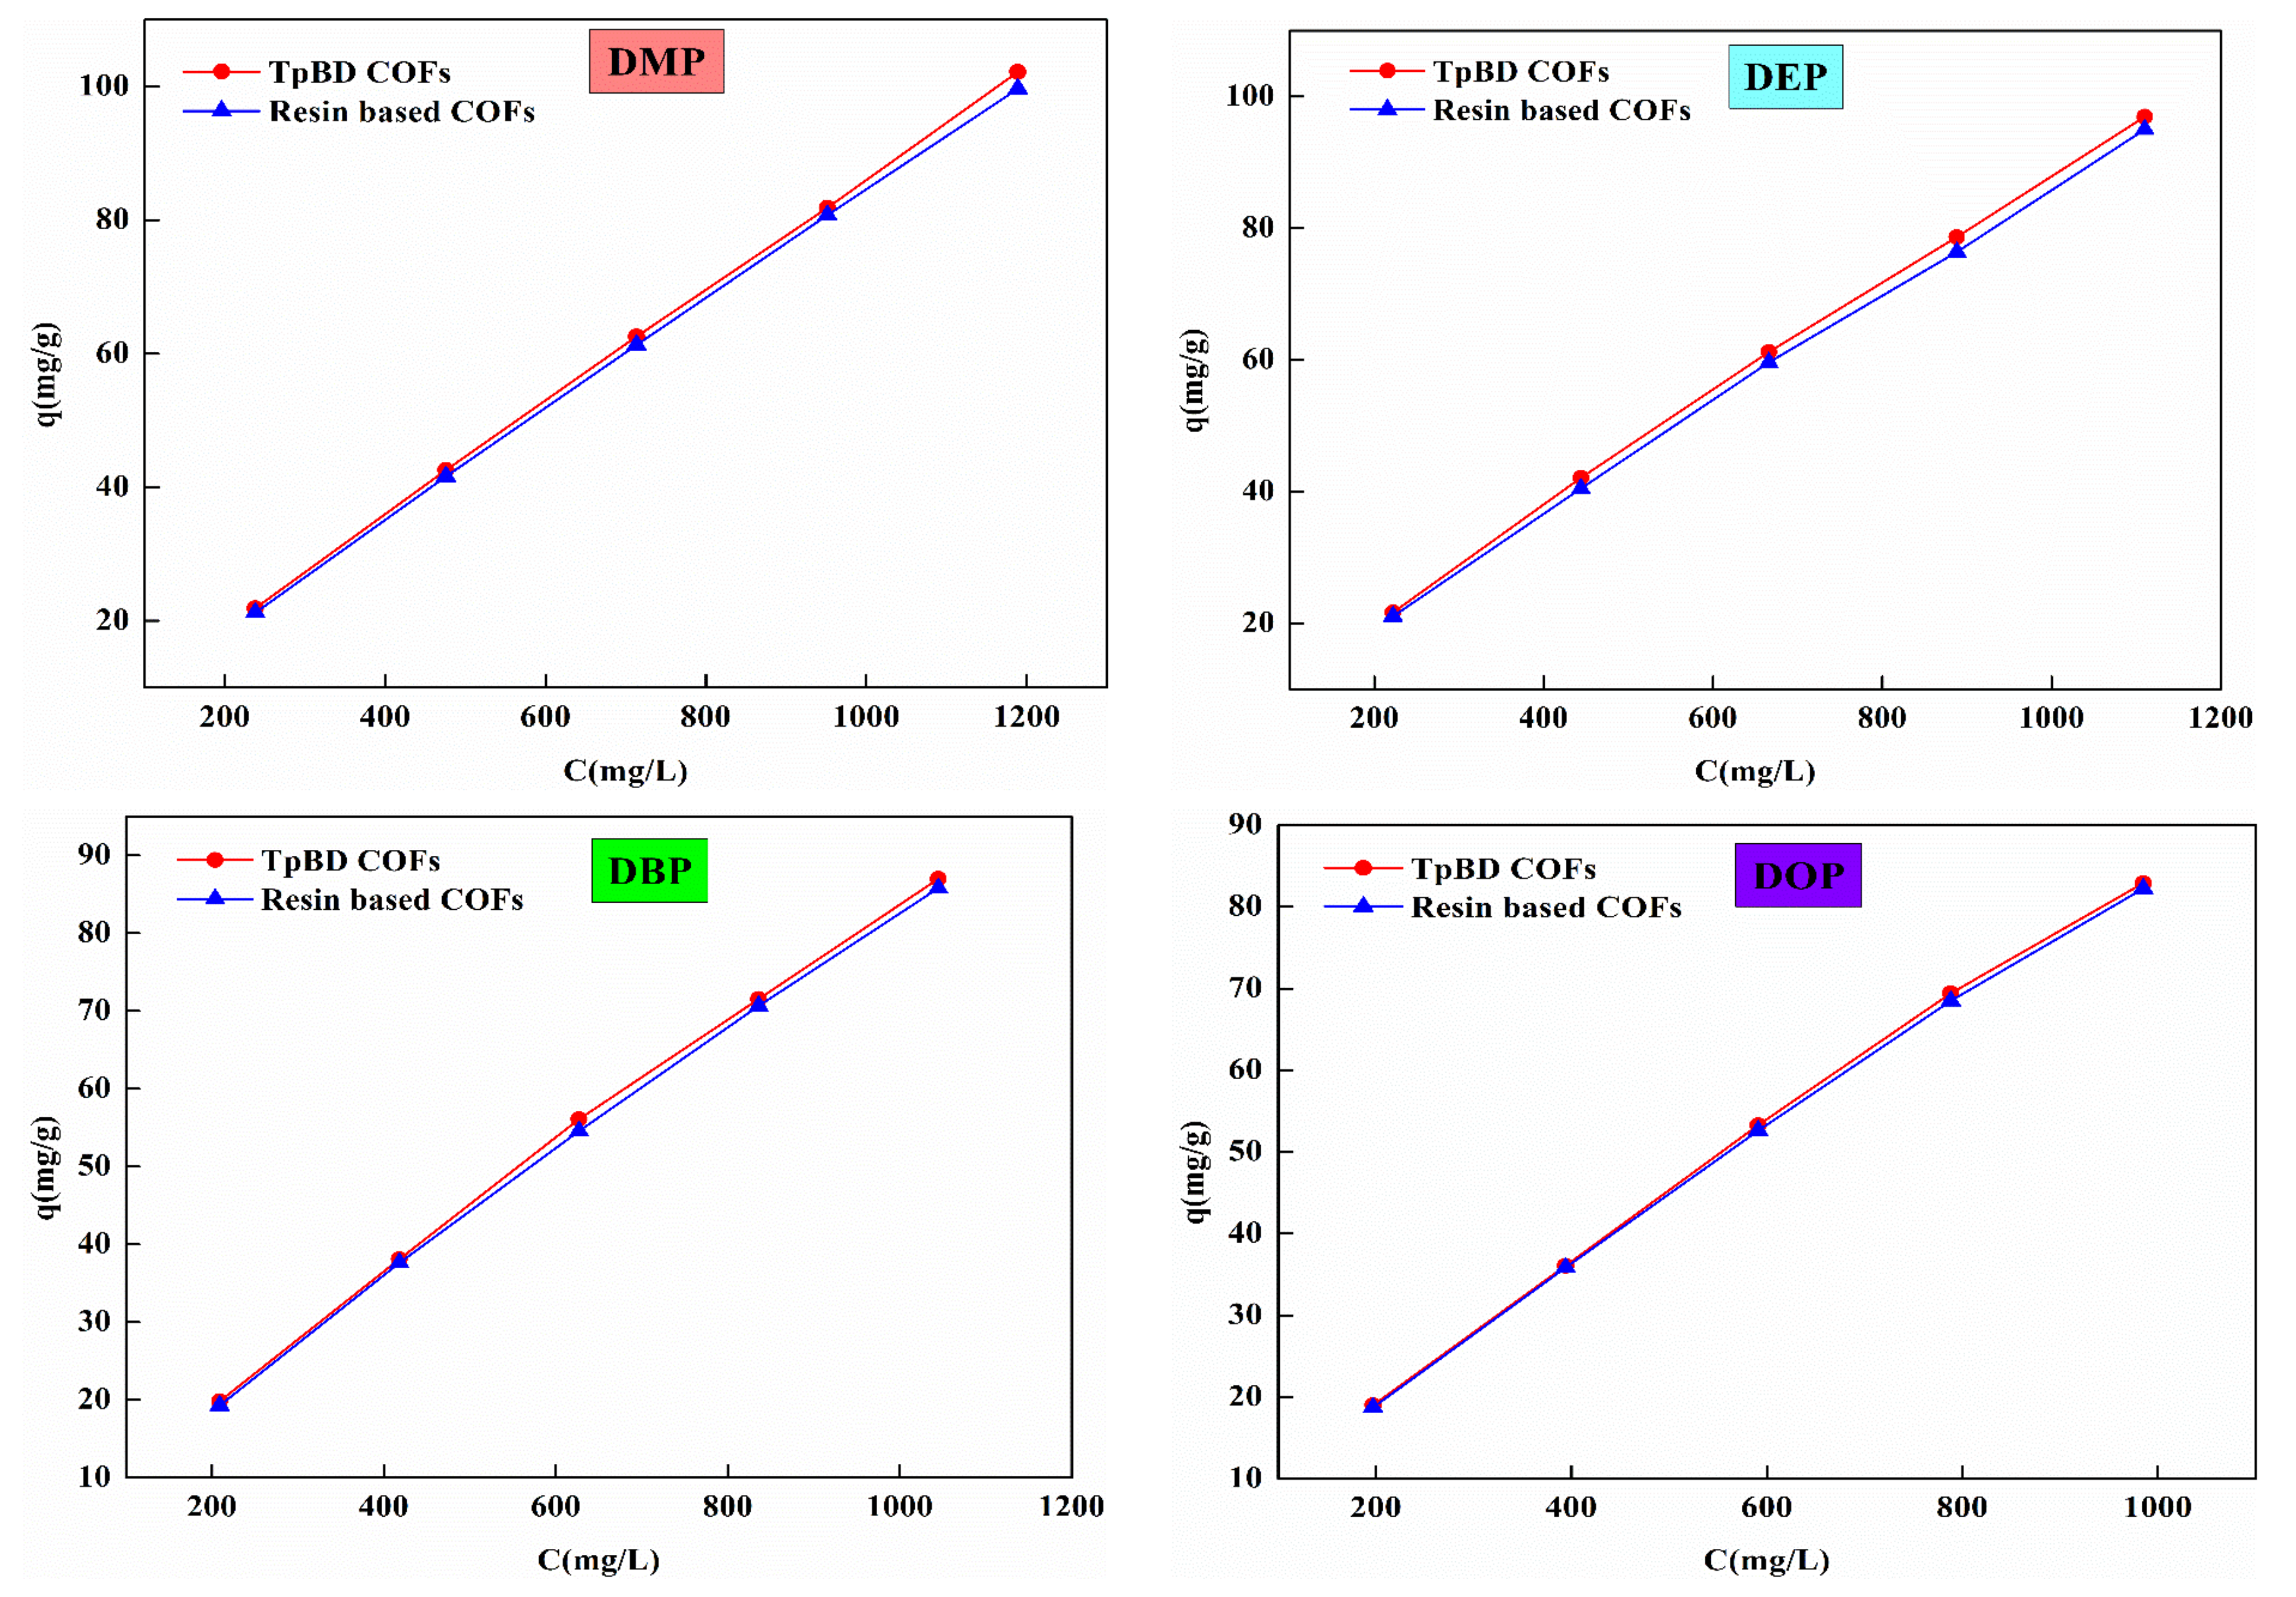
3.1.2. Static Adsorption Behavior of PAEs by COFs
3.1.3. Kinetic Adsorption Behavior of PAEs by COFs
3.2. Evaluation of SPE Performance
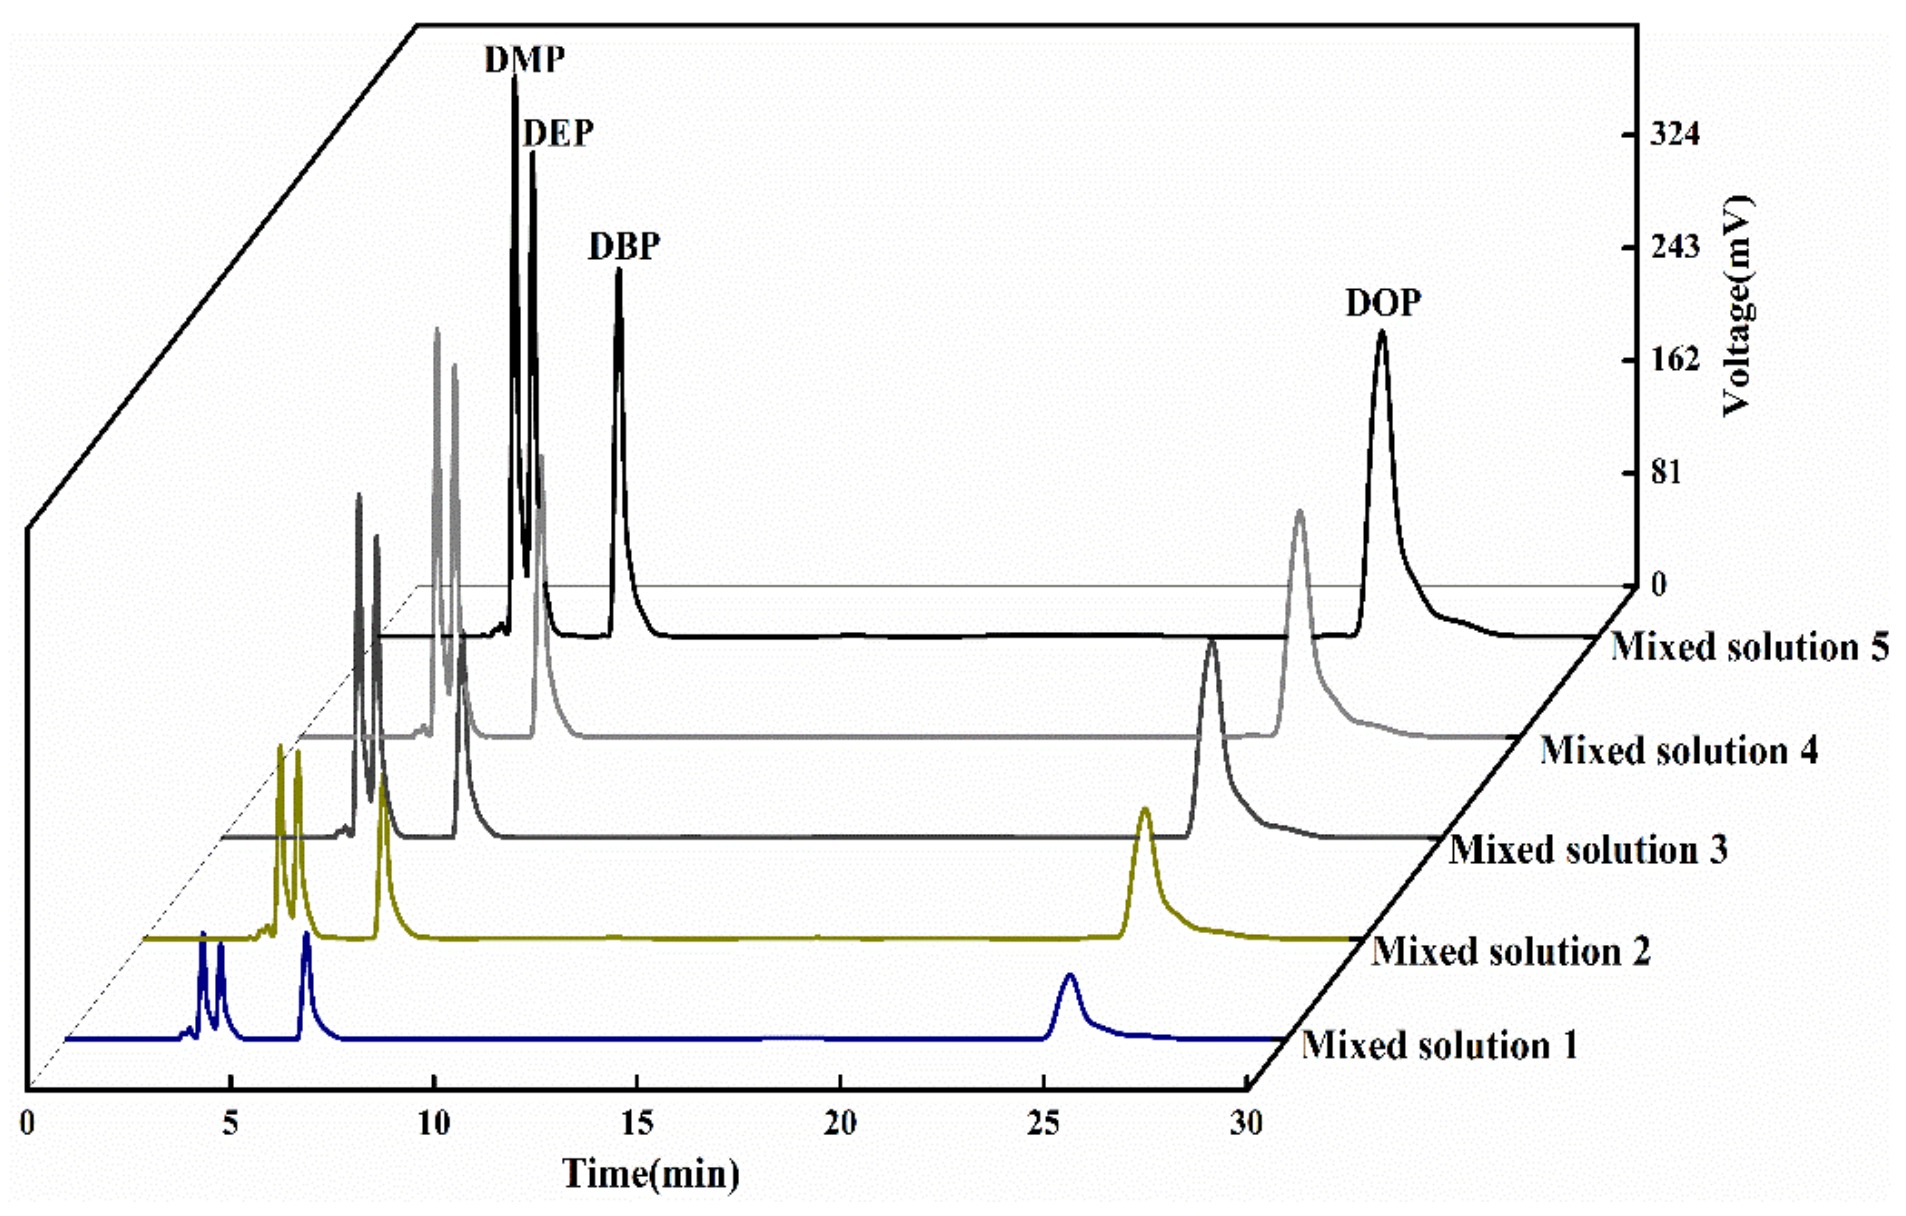
3.2.1. Analysis of Detection Conditions of PAEs by HPLC
3.2.2. Determination of Standard Curve of PAEs
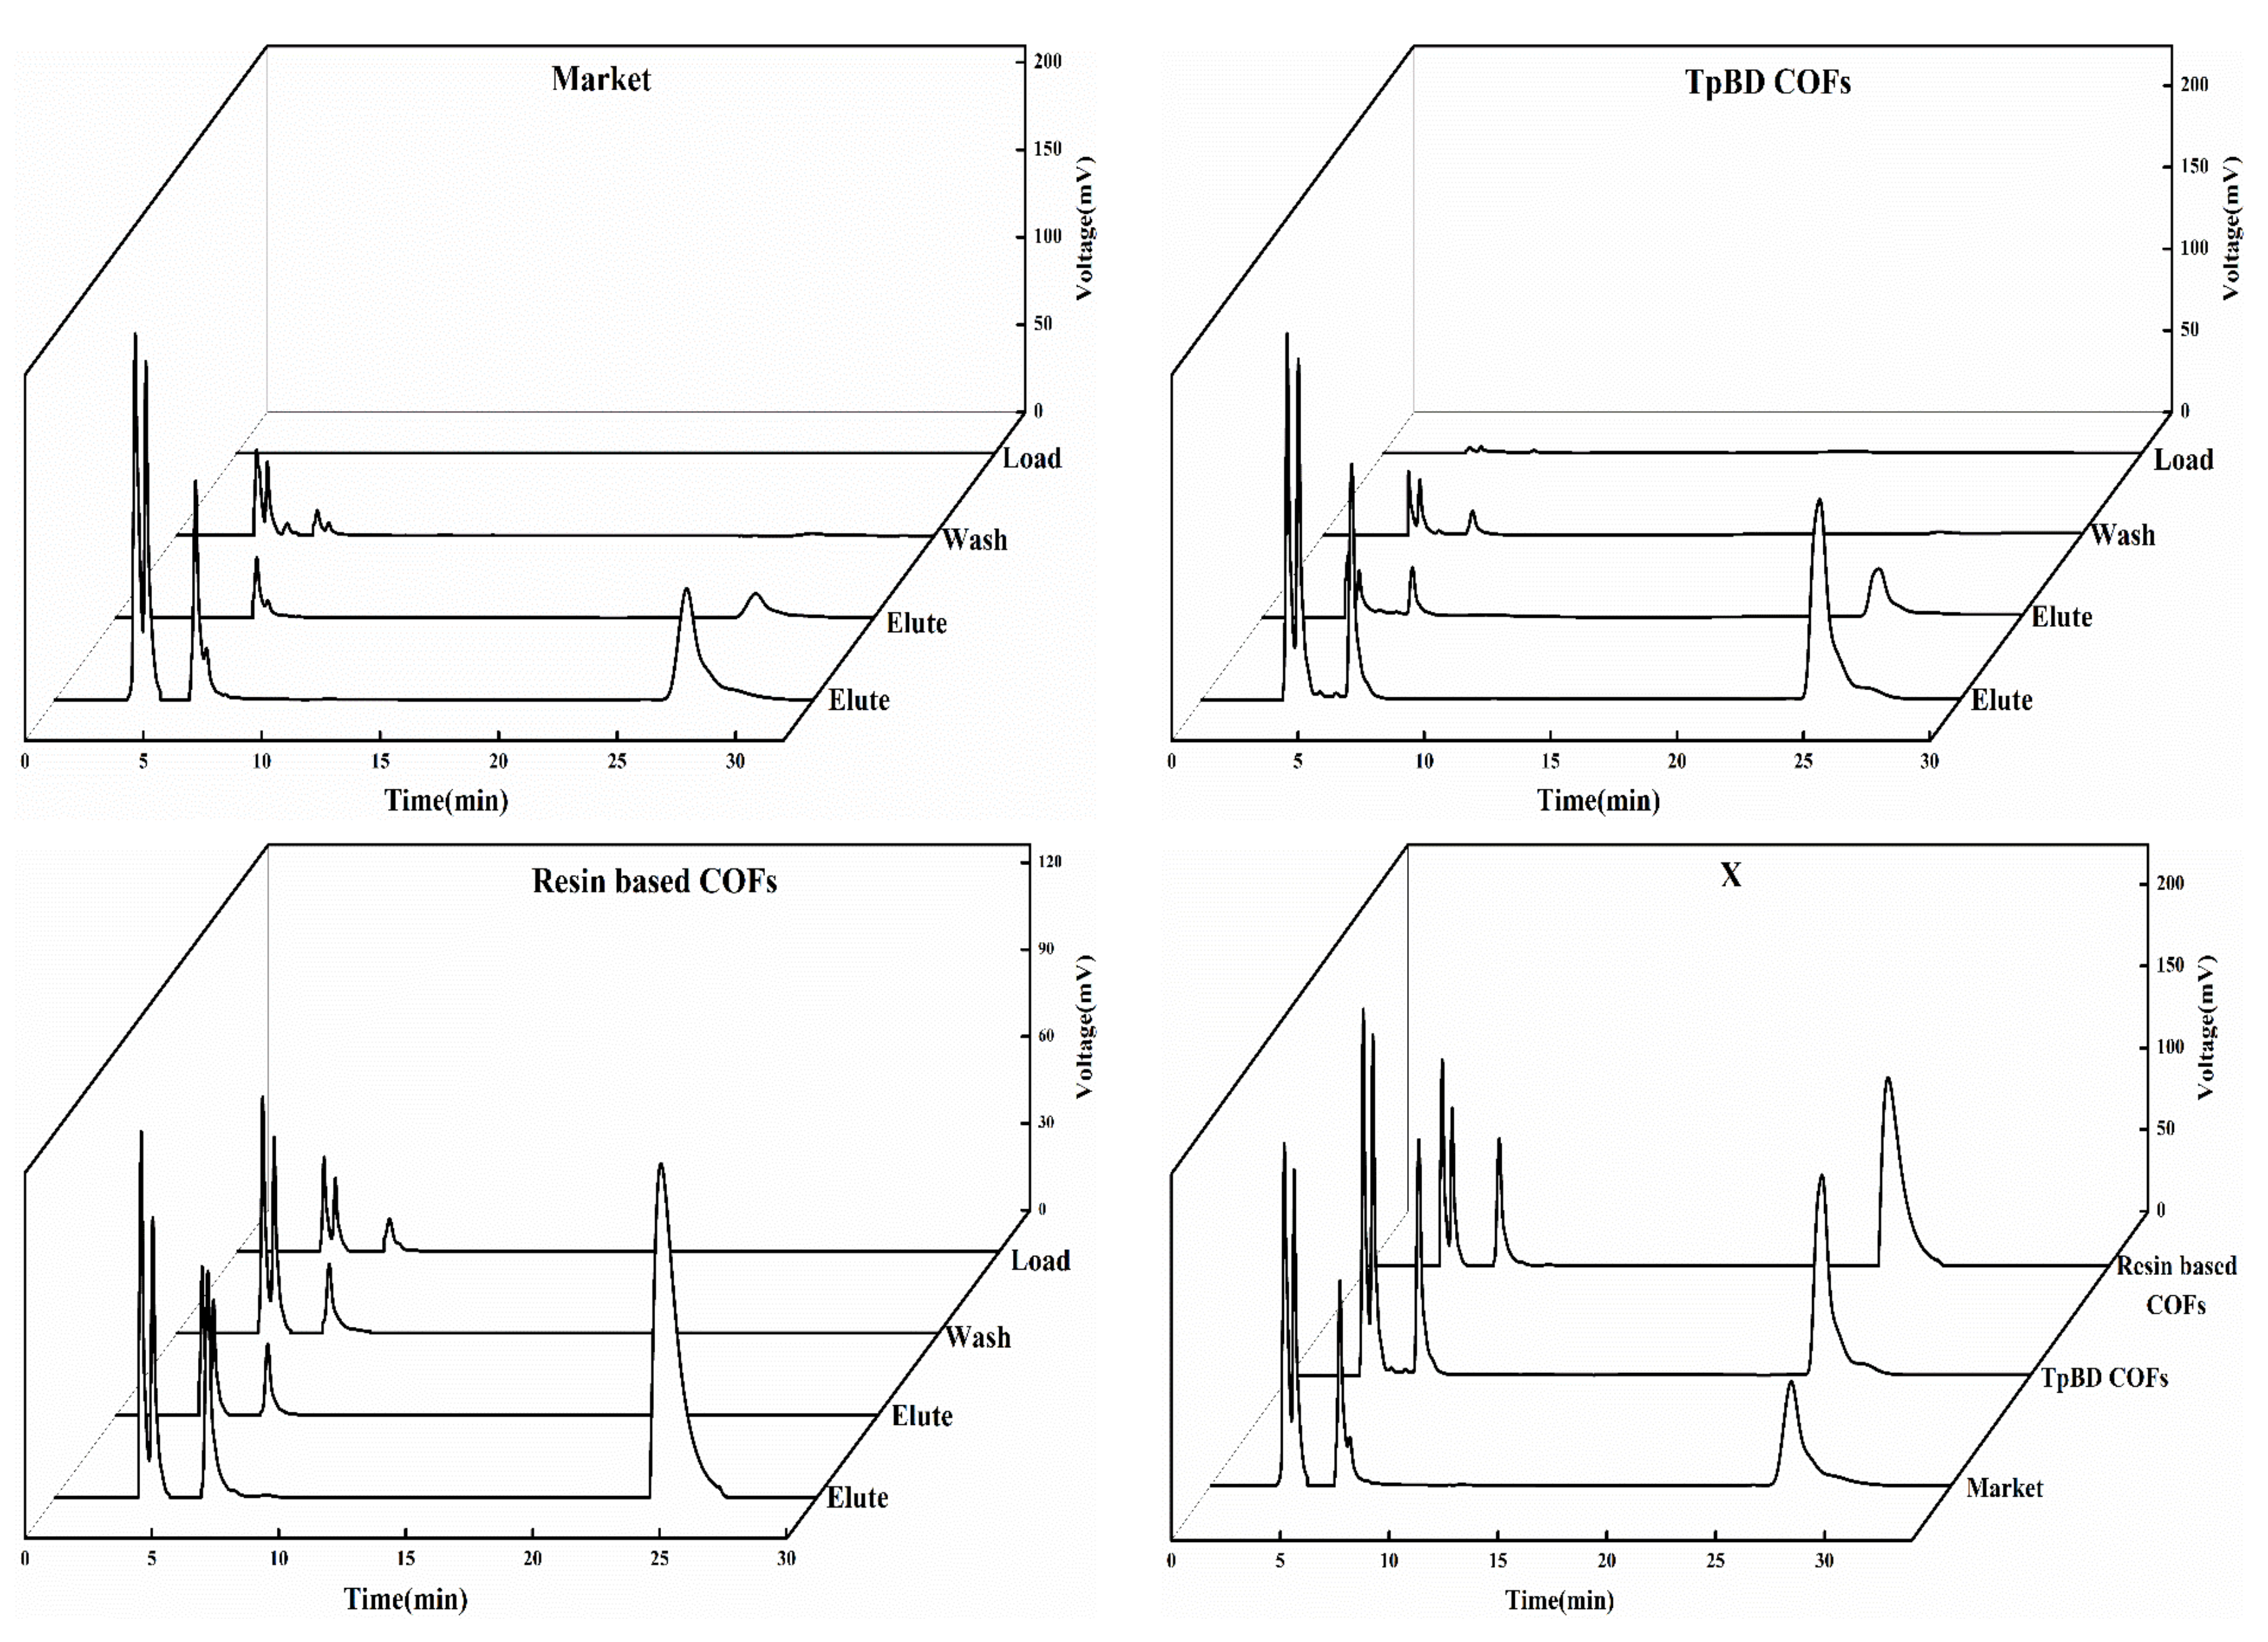
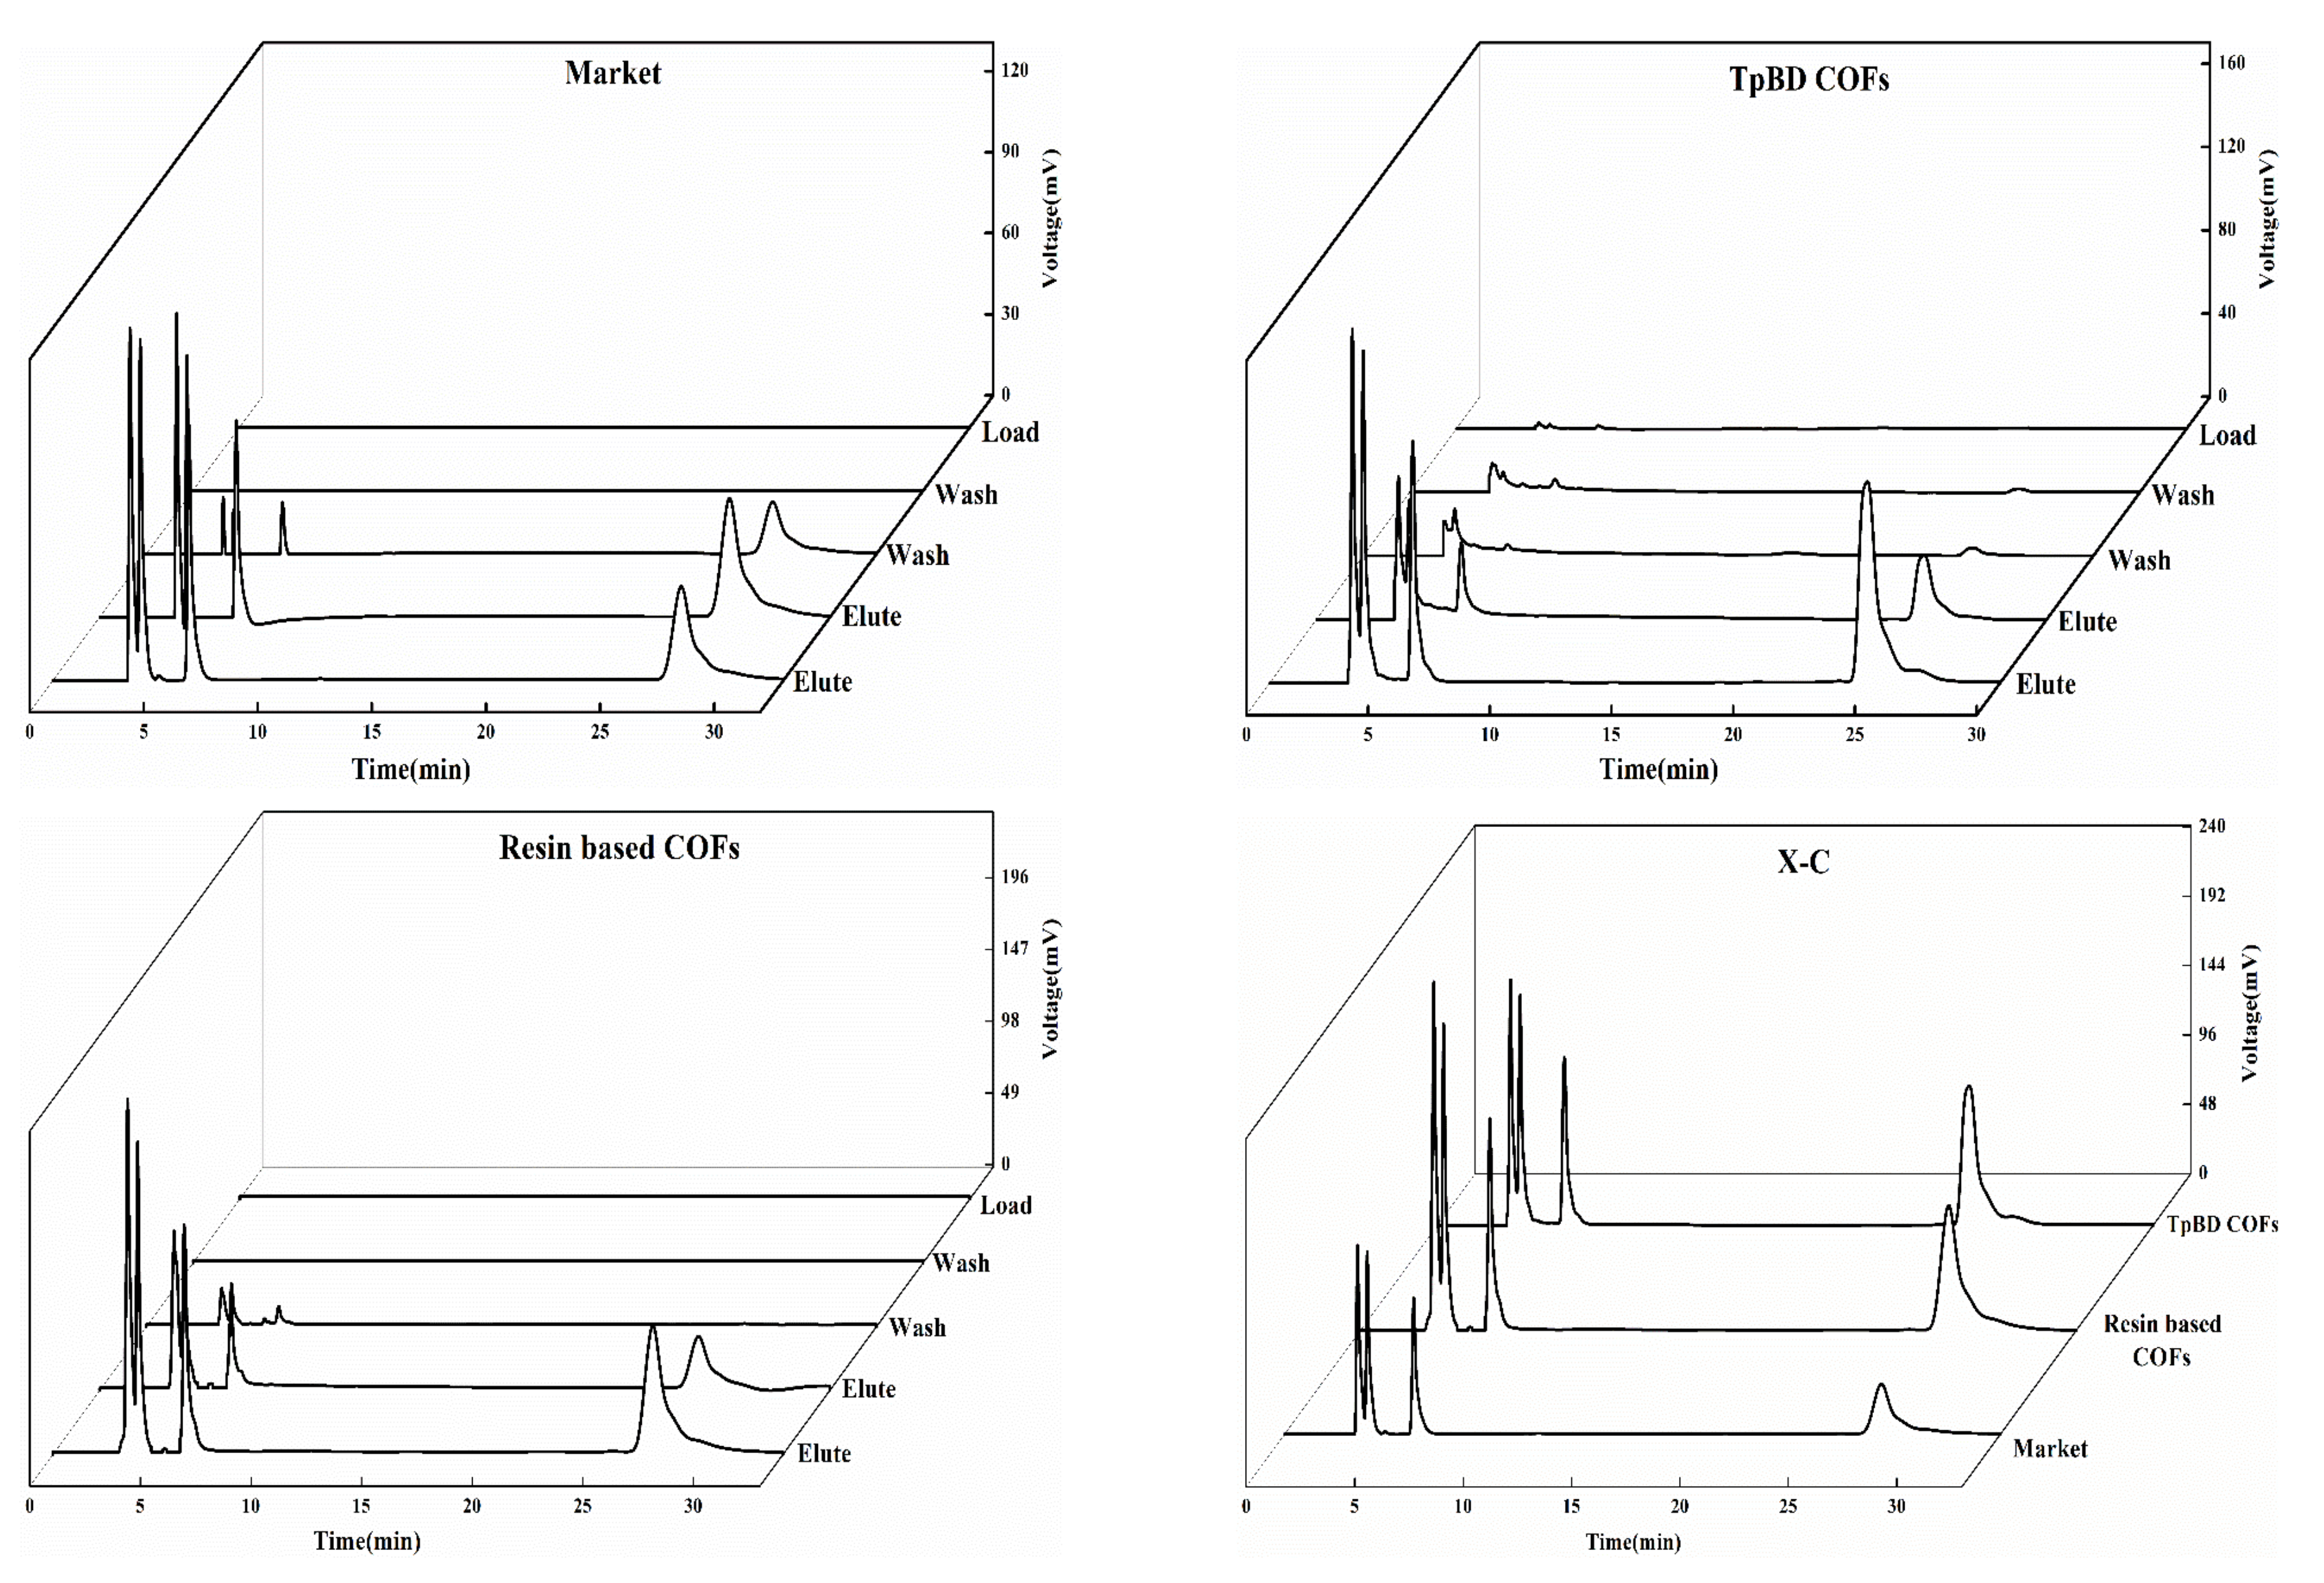
3.2.3. Evaluation of the Effect of PAEs SPE Materials
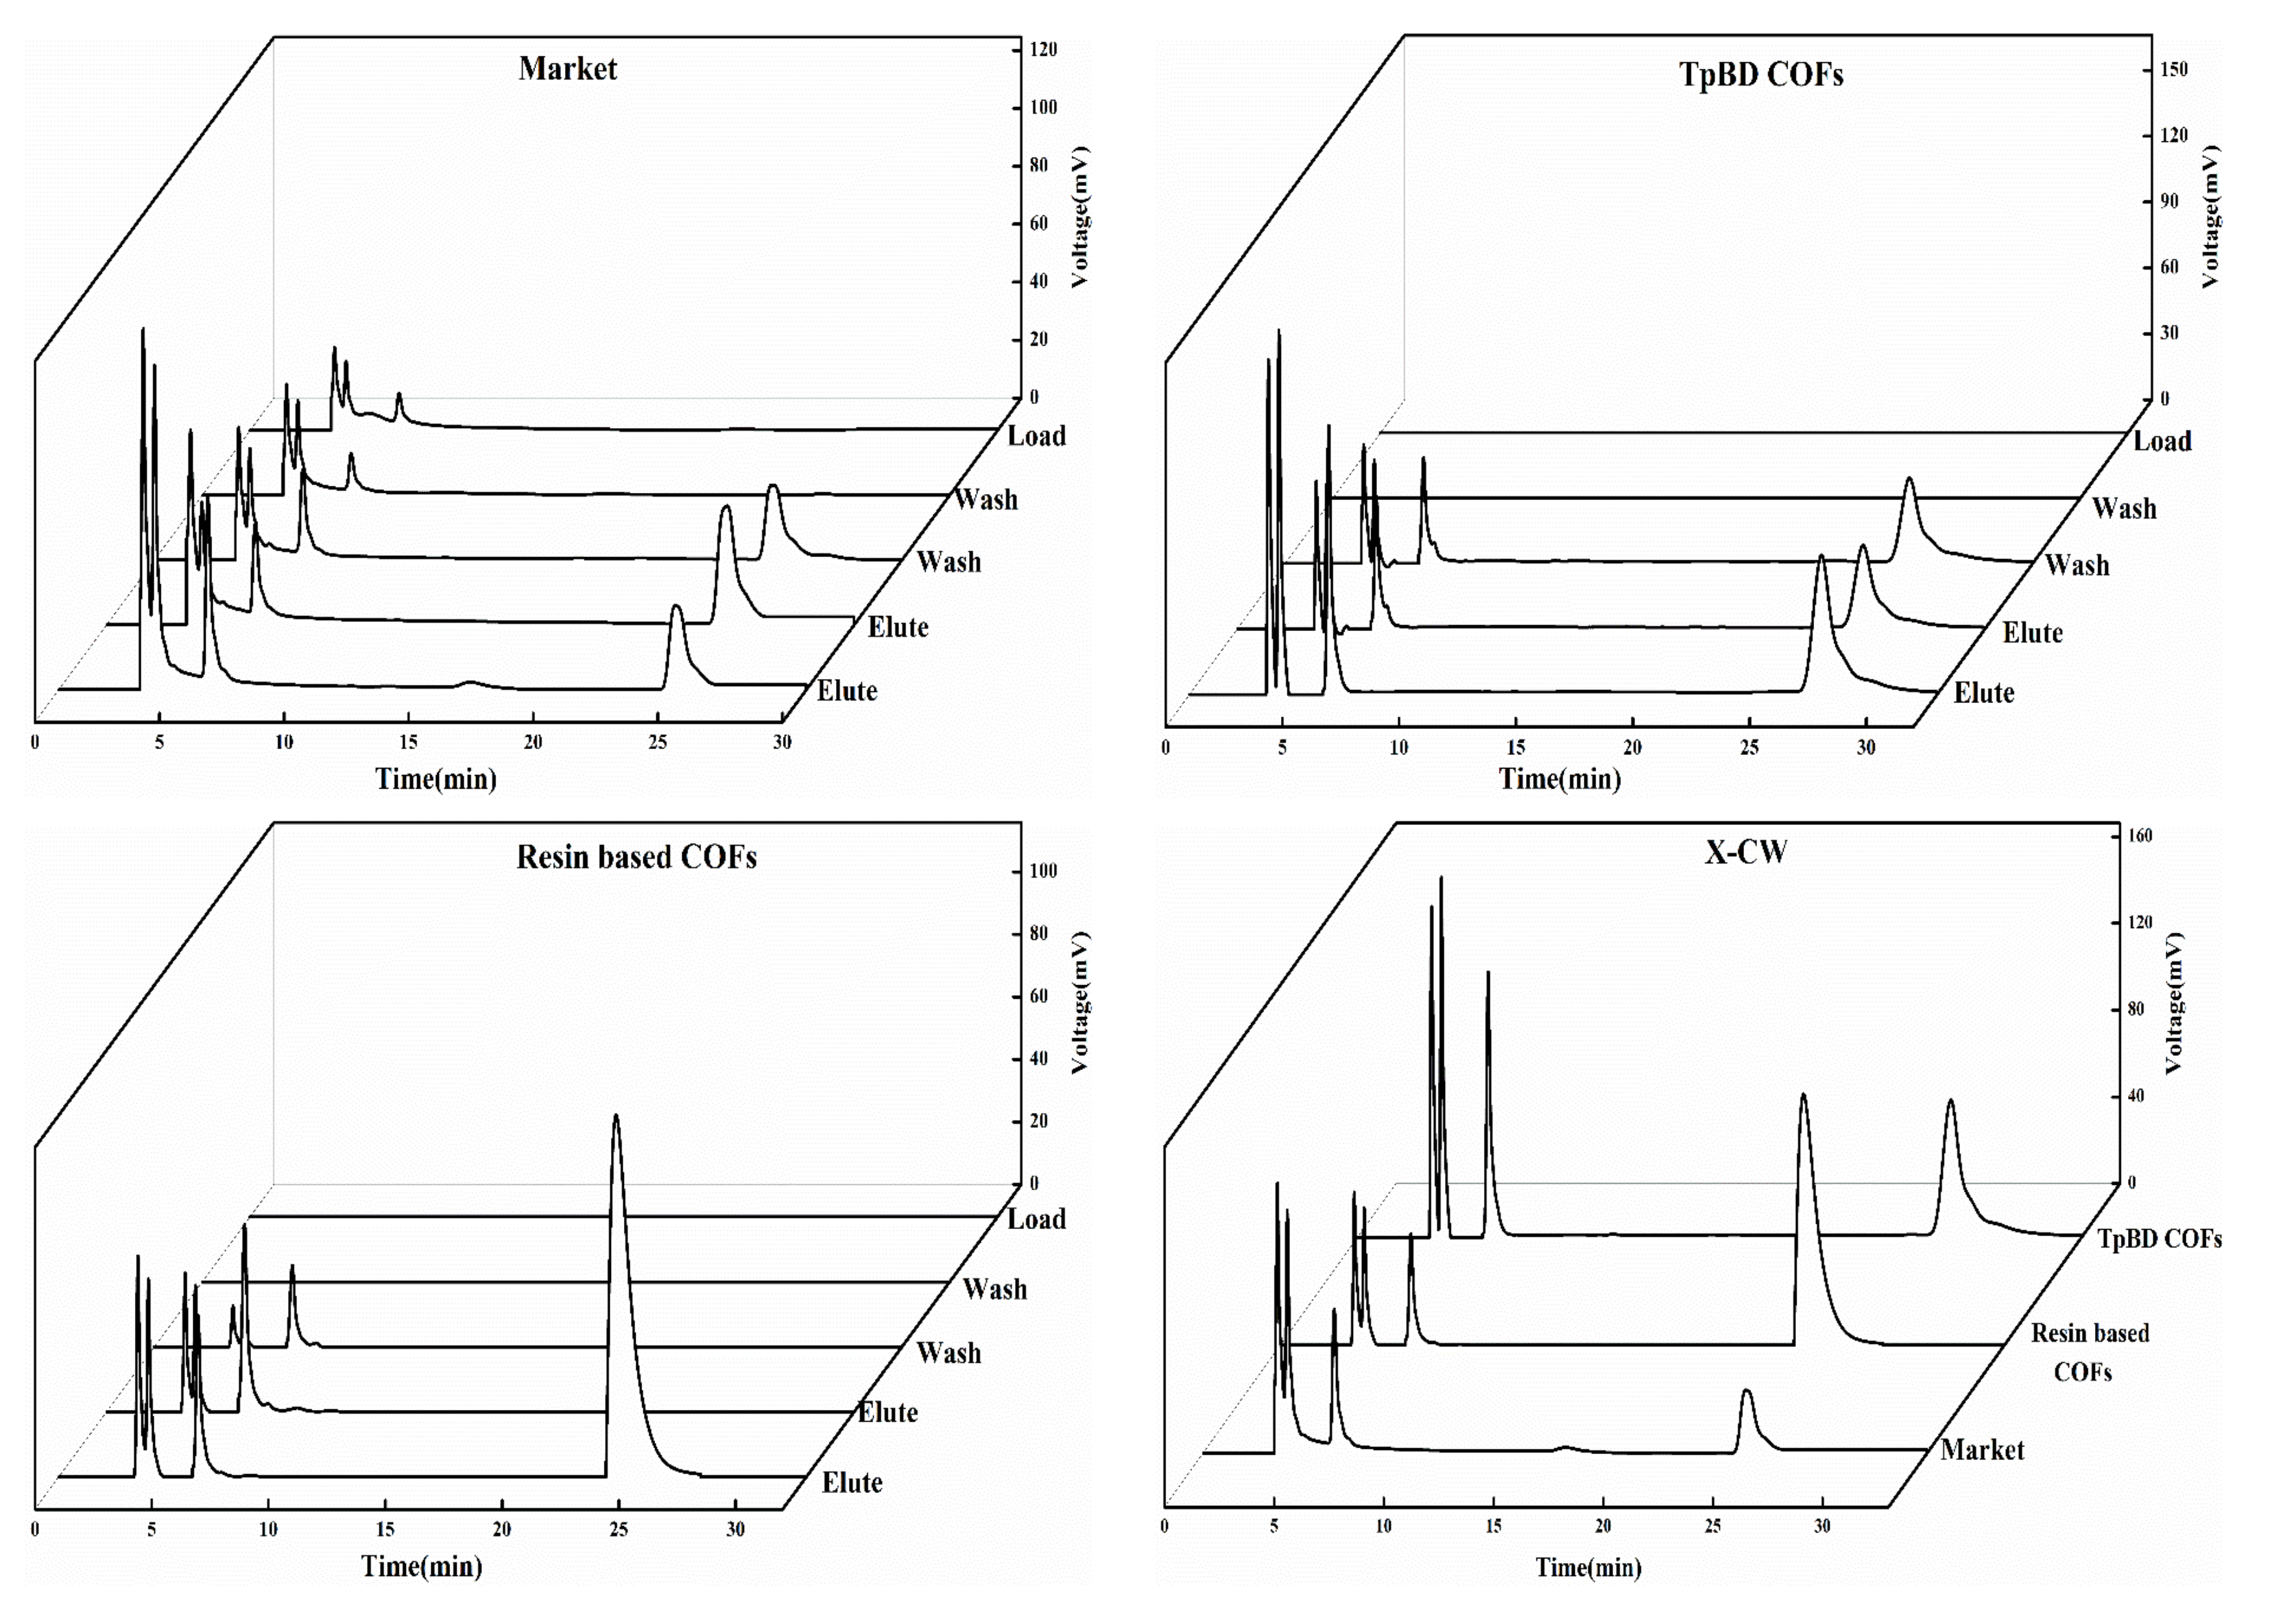
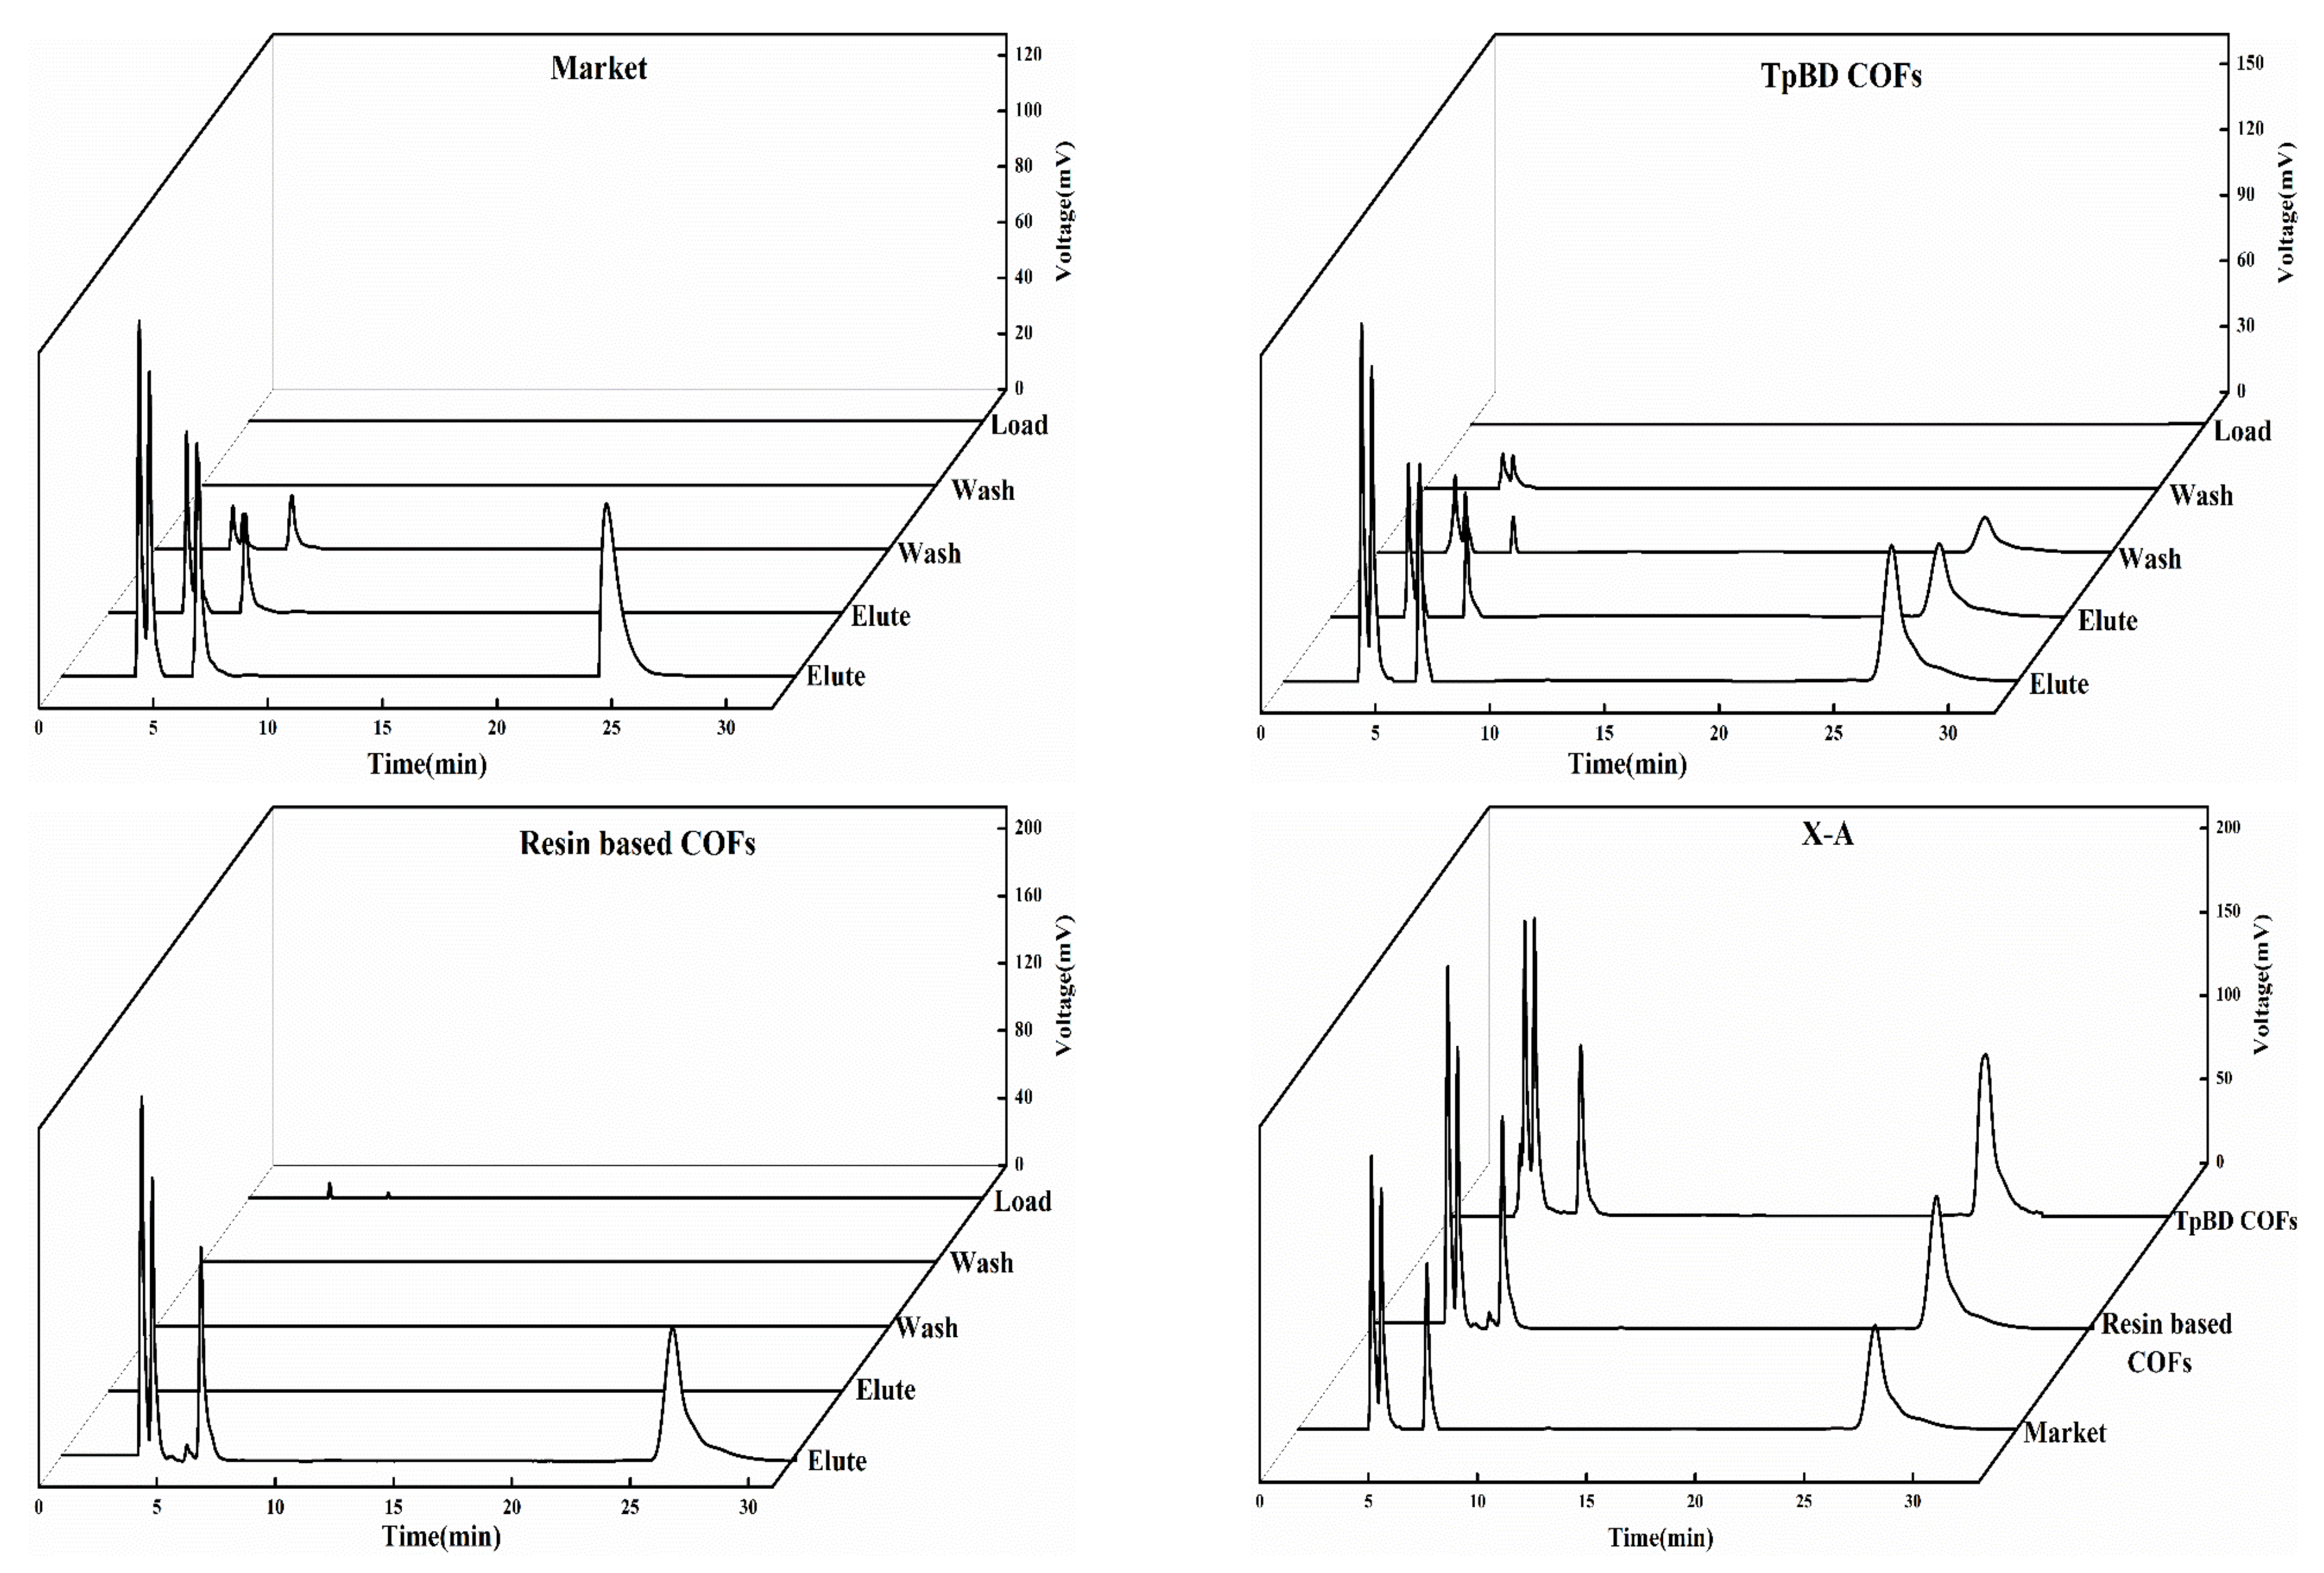
3.2.4. Analysis of SPE Scheme for PAEs
3.2.5. Stability Analysis of Four PAEs
3.2.6. Precision Analysis of Four PAEs
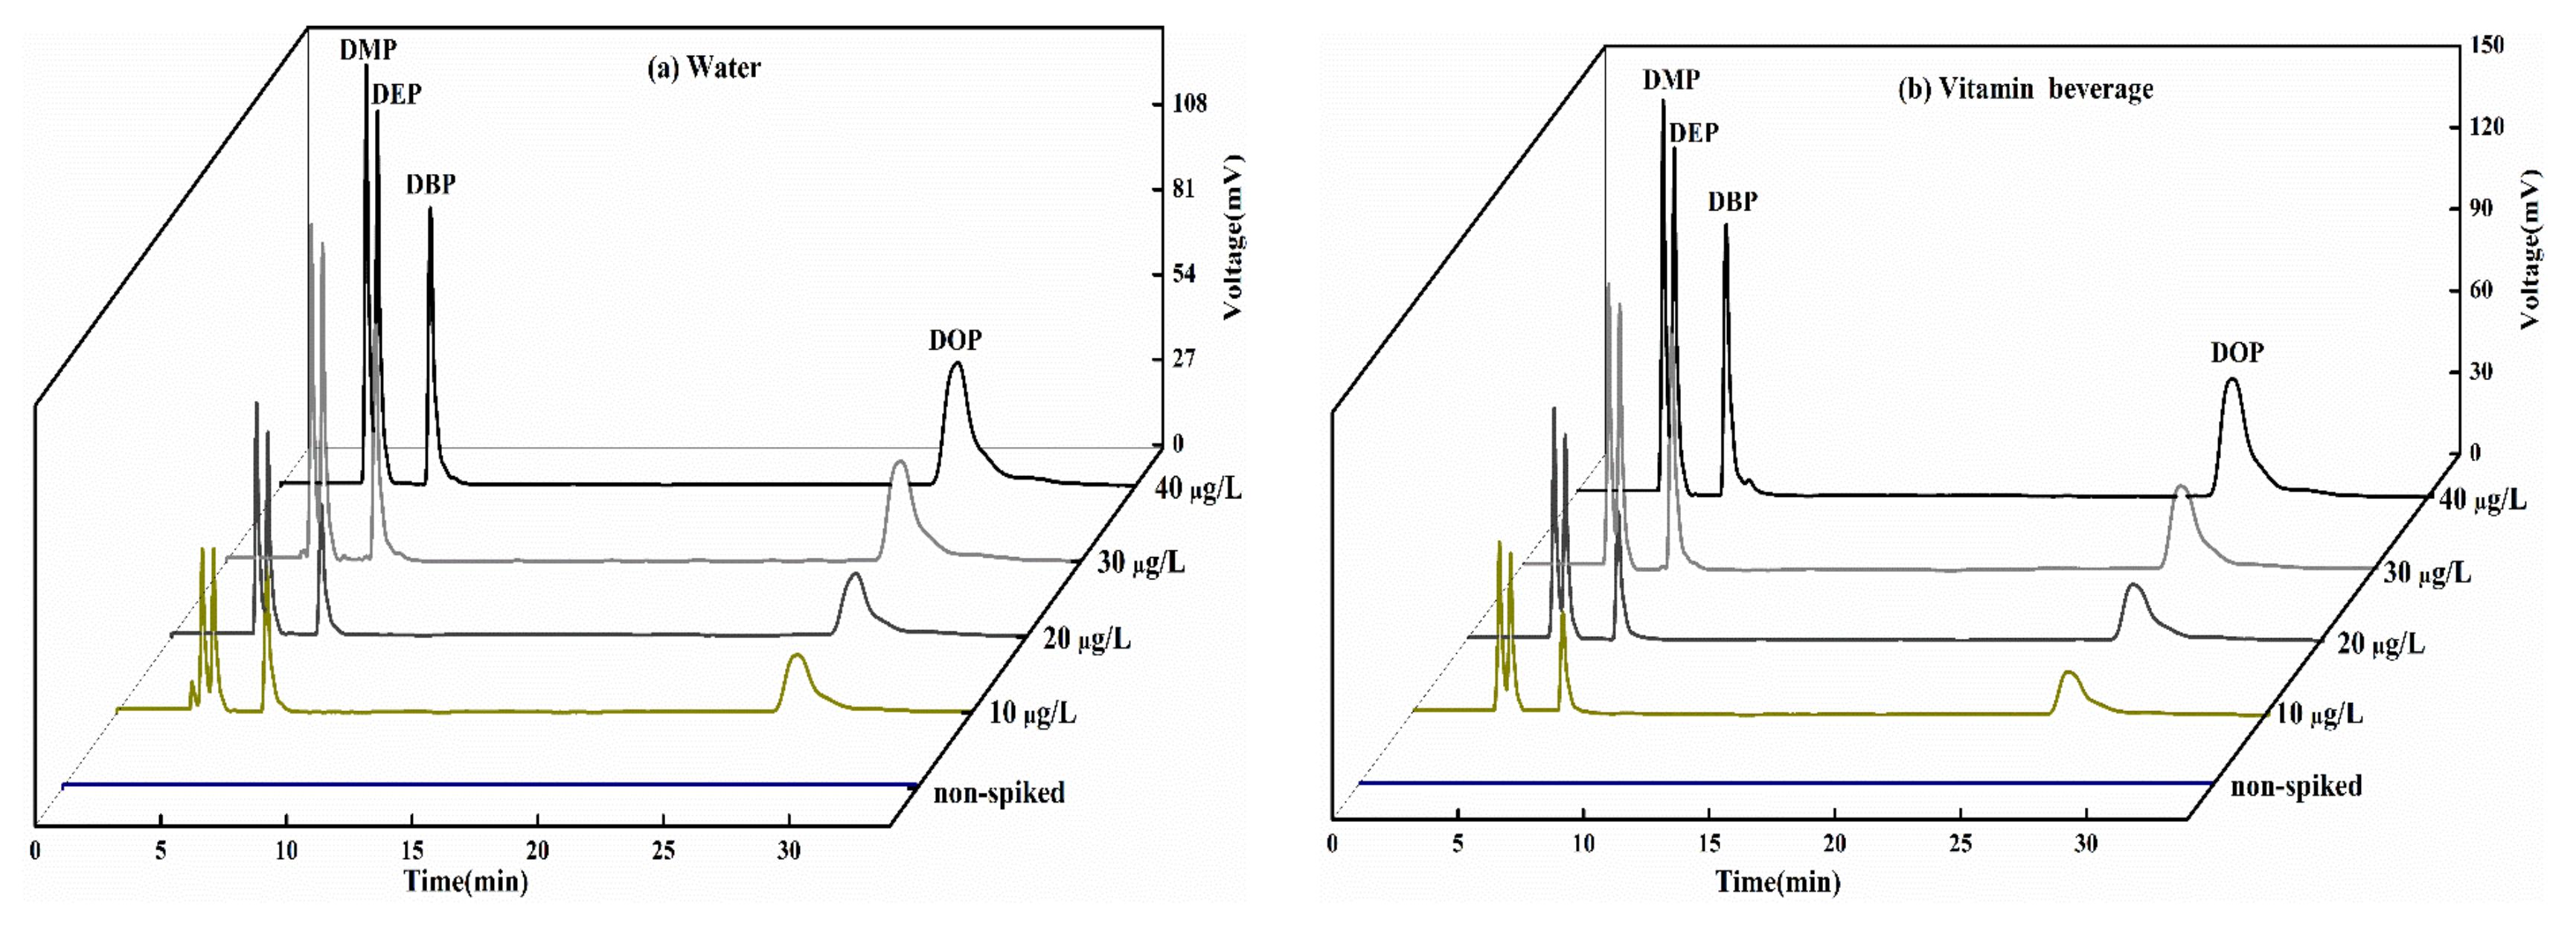
3.2.7. Analysis of SPE Results of PAEs
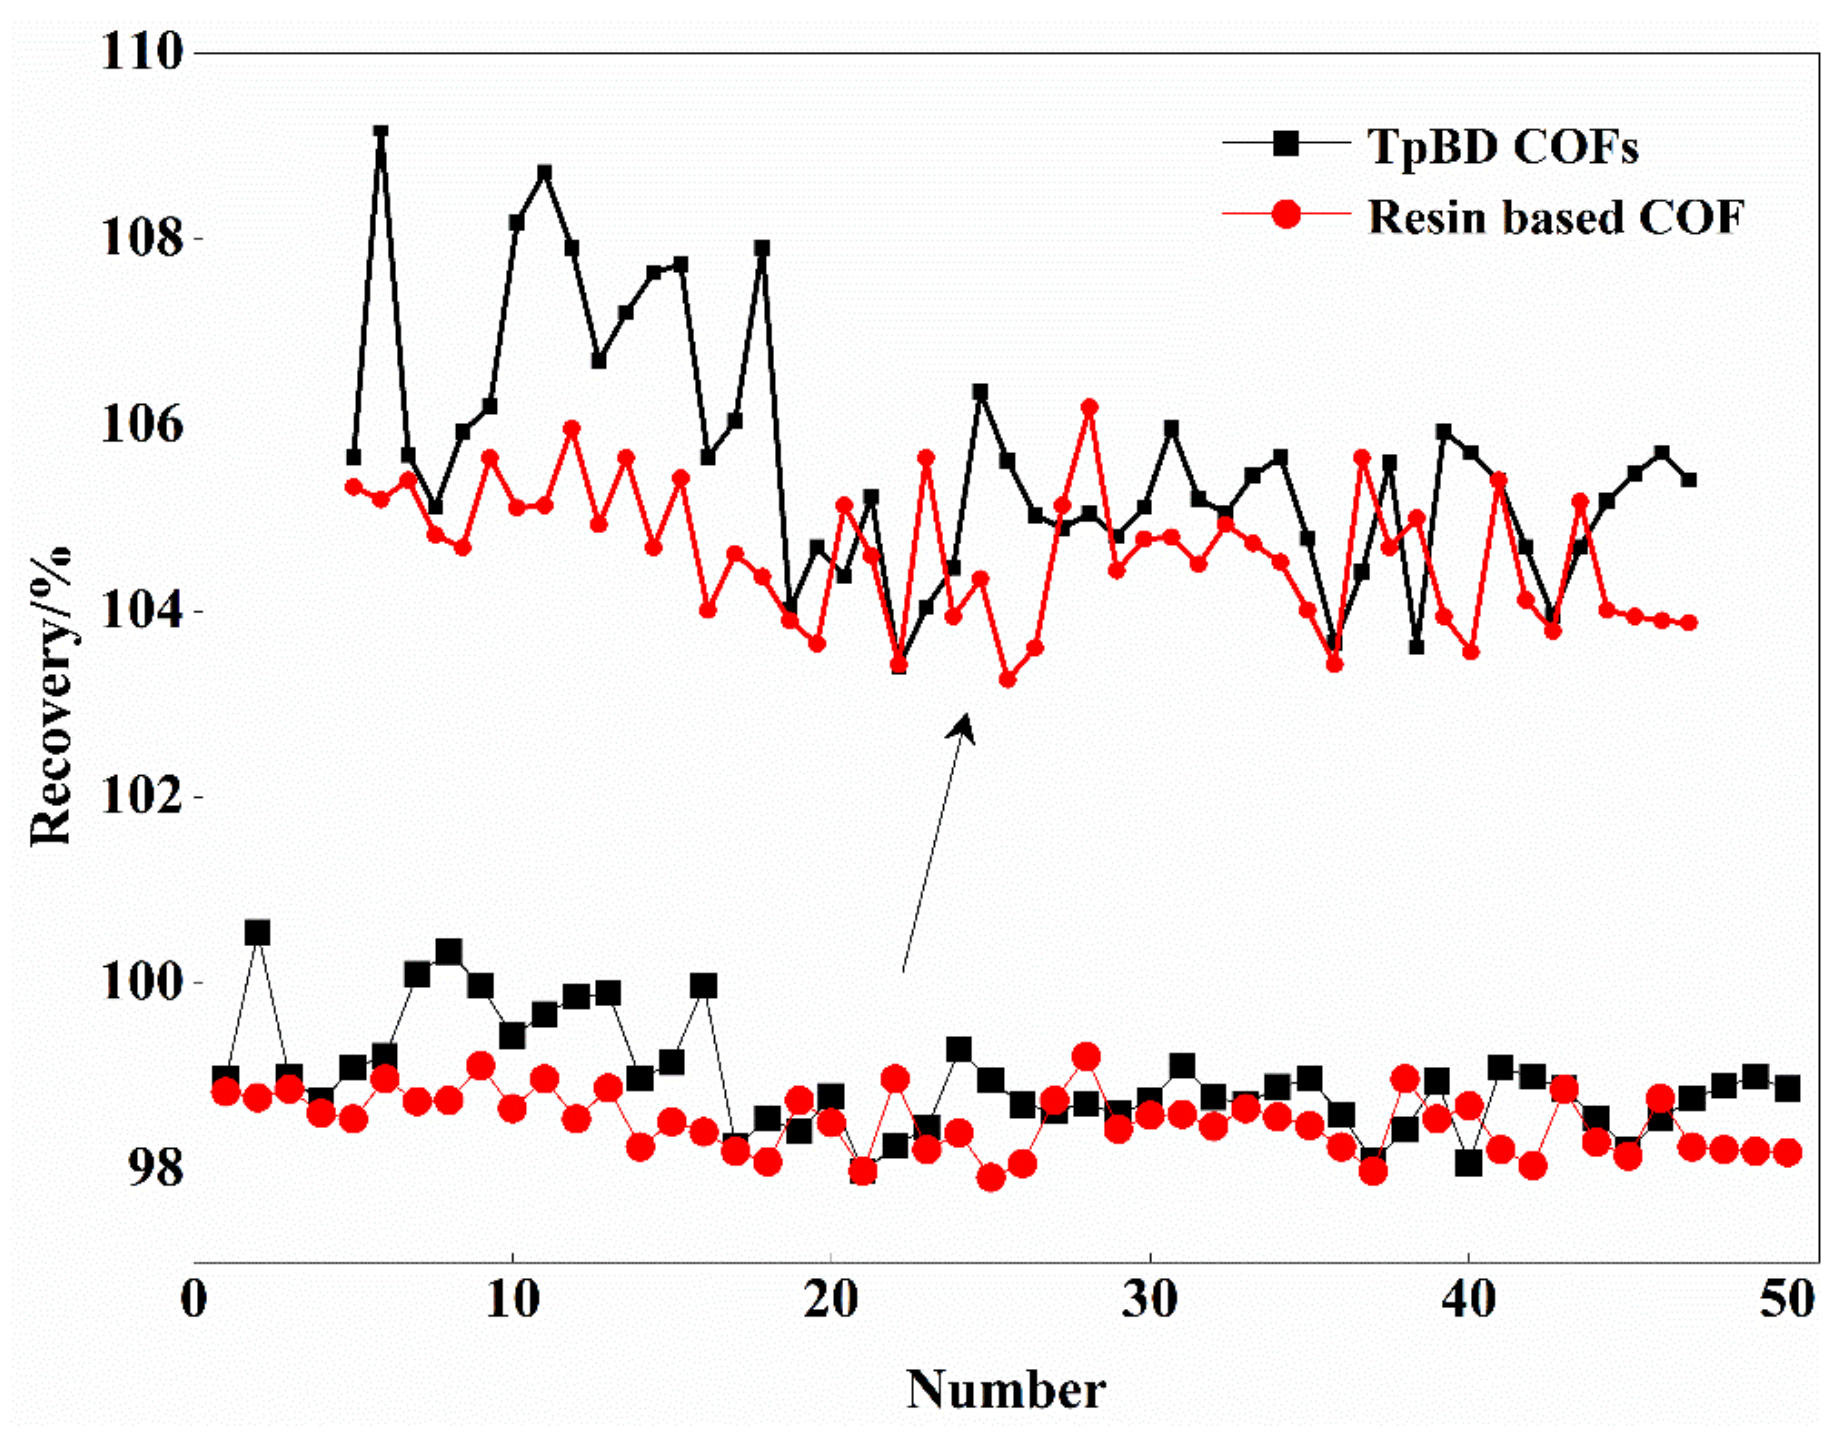
3.2.8. Evaluation of Reuse Effect of Two COFs by SPE
4. Conclusions
- (1)
- Adsorption experiments showed that the kinetic adsorption behavior of COF materials for PAEs was more consistent with the quasi-second-order kinetic adsorption model, and the static adsorption behavior is more in line with the Freundlich isothermal adsorption model.
- (2)
- Two COF materials were applied to the SPE of PAEs samples. The recoveries were 97.99–100.56% and 97.93–100.23%, respectively. The most suitable solid phase extraction schemes are X-A and X-C. These two COFs had ideal enrichment and separation effect on four phthalate esters, and had strong anti-interference ability. The SPE effects were better than four commercially available SPE columns.
- (3)
- The preparation cost of COF materials was greatly reduced after COF materials are compounded with resin. This study provided a new way to introduce COF materials as high performance SPE adsorbent for the preconcentration and determination of trace harmful substances in beverage samples.
Supplementary Materials
Author Contributions
Funding
Institutional Review Board Statement
Informed Consent Statement
Data Availability Statement
Conflicts of Interest
References
- Amanzadeh, H.; Yamini, Y.; Moradi, M.; Asl, Y.A. Determination of phthalate esters in drinking water and edible vegetable oil samples by headspace solid phase microextraction using graphene/polyvinylchloride nanocomposite coated fiber coupled to gas chromatography-flame ionization detector. J. Chromatogr. A 2016, 1465, 38–46. [Google Scholar] [CrossRef]
- Barp, L.; Purcaro, G.; Franchina, F.A.; Zoccali, M.; Sciarrone, D.; Tranchida, P.Q.; Mondello, L. Determination of phthalate esters in vegetable oils using direct immersion solid-phase microextraction and fast gas chromatography coupled with triple quadrupole mass spectrometry. Anal. Chim. Acta 2015, 887, 237–244. [Google Scholar] [CrossRef]
- Jing, Y.; Li, L.; Zhang, Q.; Lu, P.; Liu, P.; Lu, X. Photocatalytic Ozonation of Dimethyl Phthalate over TiO2 Prepared by a Hydrothermal Method. J. Hazard. Mater. 2011, 189, 40–47. [Google Scholar] [CrossRef] [PubMed]
- Xu, B.; Gao, N.Y.; Sun, X.F.; Xia, S.J.; Rui, M.; Simonnot, M.O.; Causserand, C.; Zhao, J.F. Photochemical degradation of diethyl phthalate with UV/H2O2. J. Hazard. Mater. 2007, 139, 132–139. [Google Scholar] [CrossRef]
- Liao, W.; Zheng, T.; Wang, P.; Tu, S.; Pan, W. Efficient microwave-assisted photocatalytic degradation of endocrine disruptor dimethyl phthalate over composite catalyst ZrOx/ZnO. J. Environ. Sci. 2010, 22, 1800–1806. [Google Scholar] [CrossRef]
- Higuchi, T.T.; Palmer, J.S.; Gray, L.E.; Veeramachaneni, D.N., Jr. Effects of dibutyl phthalate in male rabbits following in utero, adolescent, or postpubertal exposure. Toxicol. Sci. 2003, 72, 301–313. [Google Scholar] [CrossRef]
- Higuchi, A.; Yoon, B.O.; Kaneko, T.; Hara, M.; Maekawa, M.; Nohmi, T. Separation of endocrine disruptors from aqueous solutions by pervaporation: Dioctylphthalate and butylated hydroxytoluene in mineral water. J. Appl. Polym. Sci. 2004, 94, 1737–1742. [Google Scholar] [CrossRef]
- Zhou, S.; Han, M.; Ren, Y.; Yang, X.; Duan, L.; Zeng, Y.; Li, J. Dibutyl phthalate aggravated asthma-like symptoms through oxidative stress and increasing calcitonin gene-related peptide release. Ecotoxicol. Environ. Saf. 2020, 199, 110740. [Google Scholar] [CrossRef] [PubMed]
- Semsarzadeh, M.A.; Mehrabzadeh, M.; Arabshahi, S.S. Dynamic mechanical behavior of the dioctyl phthalate plasticized polyvinyl chloride–epoxidized soya bean oil. Eur. Polym. J. 2002, 38, 351–358. [Google Scholar] [CrossRef]
- Mayer, F.L.; Stalling, D.L.; Johnson, J.L. Phthalate Esters as Environmental Contaminants. Nature 1972, 238, 411–413. [Google Scholar] [CrossRef] [PubMed]
- Song, D.; Sun, H.; Yang, Y.; Wang, X.; Sun, Y.; Liu, X.; Huang, M.; Feng, C.; Zhuang, Y.; Zhang, J.; et al. Status of phthalate esters in tobacco cultivation soils and its health risk to Chinese people. J. Soil. Sediments 2020, 21, 307–318. [Google Scholar] [CrossRef]
- Tles, S.; Kartal, C. Solid-Phase Extraction (SPE): Principles and Applications in Food Samples. Acta Sci. Pol. Technol. Aliment. 2016, 15, 5–15. [Google Scholar] [CrossRef]
- Pollak, P.T.; Carruthers, S.G.; Freeman, D.J. Simplified liquid-chromatographic assay of amiodarone and desethylamiodarone after solid-phase extraction. Clin. Chem. 1986, 32, 890–893. [Google Scholar] [CrossRef] [PubMed]
- Xu, L.; Qiao, X.; Ma, Y.; Zhang, X.; Xu, Z. Preparation of a Hydrophilic Molecularly Imprinted Polymer and Its Application in Solid-Phase Extraction to Determine of Trace Acrylamide in Foods Coupled with High-Performance Liquid Chromatography. Food Anal. Methods 2013, 6, 838–844. [Google Scholar] [CrossRef]
- Hallaj, T.; Amjadi, M. A sensitive plasmonic probe based on in situ growth of a Ag shell on a Au@N-CD nanocomposite for detection of isoniazid in environmental and biological samples. New J. Chem. 2019, 43, 5980–5986. [Google Scholar] [CrossRef]
- Pfa, B.; Ad, A.; Gma, C.; Cc, C.; Dddde, F.; Vpa, B. Biopolymers in sorbent-based microextraction methods. Trends Anal. Chem. 2021, 125, 115839. [Google Scholar] [CrossRef]
- Faraji, M.; Shirani, M.; Rashidi-Nodeh, H. The recent advances in magnetic sorbents and their applications. Trends Anal. Chem. 2021, 141, 116302. [Google Scholar] [CrossRef]
- Jing, W.; Wag, J.; Kuiqers, B.; Bi, W.; Ddyca, B. Recent applications of graphene and graphene-based materials as sorbents in trace analysis. Trends Anal. Chem. 2021, 137, 116212. [Google Scholar] [CrossRef]
- Janczura, M.; Luliński, P.; Sobiech, M. Imprinting technology for effective sorbent fabrication: Current state-of-art and future prospects. Materials 2021, 14, 1850. [Google Scholar] [CrossRef] [PubMed]
- Bazargan, M.; Ghaemi, F.; Amiri, A.; Mirzaei, M. Metal–organic framework-based sorbents in analytical sample preparation. Coord. Chem. Rev. 2021, 445, 214107. [Google Scholar] [CrossRef]
- Yaghi, O.M. Reticular Chemistry-Construction, Properties, and Precision Reactions of Frameworks. J. Am. Chem. Soc. 2016, 138, 15507–15509. [Google Scholar] [CrossRef]
- Ding, S.Y.; Wang, W. Covalent organic frameworks (COFs): From design to applications. Chem. Soc. Rev. 2013, 42, 548–568. [Google Scholar] [CrossRef]
- Montoro, C.; Rodríguez-San-Miguel, D.; Polo, E.; Escudero-Cid, R.; Ruiz-González, M.L.; Navarro, J.A.; Ocón, P.; Zamora, F. Ionic Conductivity and Potential Application for Fuel Cell of a Modified Imine-Based Covalent Organic Framework. J. Am. Chem. Soc. 2017, 139, 10079–10086. [Google Scholar] [CrossRef] [PubMed]
- Ma, Y.J.; Yuan, Y.; Gao, X.; Cui, H.; Zhang, W.; Wang, S.Y. Preparation of a Novel Resin Based Covalent Framework Material and Its Application in the Determination of Phenolic Endocrine Disruptors in Beverages by SPE-HPLC. Polymers 2021, 13, 2935. [Google Scholar] [CrossRef]
- Liu, J.M.; Yuan, J.L.X.Y.; Liu, H.L.; Fang, G.Z.; Wang, S. Spherical covalent organic frameworks as advanced adsorbents for preconcentration and separation of phenolic endocrine disruptors, followed by high performance liquid chromatography. RSC Adv. 2018, 8, 26880–26887. [Google Scholar] [CrossRef]
- Shibukawa, A.; Nakagawa, T.; Nishimura, N.; Miyake, M.; Tanaka, H. Determination of free drug in protein binding equilibrium by high-performance frontal analysis using internal-surface reversed-phase silica support. Chem. Pharm. Bull. 1989, 37, 702–706. [Google Scholar] [CrossRef] [PubMed]
- Geng, X.-D.; Regnier, F.E. Characters of the Plateau of Methanol Increment in Frontal Analysis in Reversed Phase Liquid Chromatography. Chin. J. Chem. 2010, 20, 431–440. [Google Scholar] [CrossRef]
- Otoukesh, M.; Es’haghi, Z.; Feizy, J.; Nerin, C. Graphene oxide/Layered Double Hydroxides@ Sulfonated Polyaniline: A sorbent for ultrasonic assisted dispersive solid phase extraction of phthalates in distilled herbal beverages. J. Chromatogr. A 2020, 1625, 461307. [Google Scholar] [CrossRef] [PubMed]
- Qian, X.; Yin, X.; Shen, Y.; Zhang, N.; Wang, M.; Gu, Z. Detection of Phthalate Esters in Environmental Water Samples—Comparison of Nylon6 Nanofibers Mat-based Solid Phase Extraction and Other Conventional Extraction Methods. Chin. J. Chem. 2011, 29, 567–574. [Google Scholar] [CrossRef]
- Huang, Z.; Tu, C.; Liu, H.; Wang, L.; Zhu, Z.; Watanabe, I. Hollow fiber-solid phase microextraction of phthalate esters from bottled water followed by flash evaporation gas chromatography-flame ionization detection. J. Chromatogr. A 2020, 1619, 460953. [Google Scholar] [CrossRef]
- Wu, D.; Liu, F.; Tian, T.; Wu, J.-F.; Zhao, G.-C. Copper ferrite nanoparticles as novel coating appropriated to solid-phase microextraction of phthalate esters from aqueous matrices. Microchem. J. 2021, 162, 105845. [Google Scholar] [CrossRef]
- Khataei, M.M.; Yamini, Y.; Ghaemmaghami, M. Reduced graphene-decorated covalent organic framework as a novel coating for solid-phase microextraction of phthalate esters coupled to gas chromatography-mass spectrometry. Mikrochim. Acta 2020, 187, 256. [Google Scholar] [CrossRef] [PubMed]


| c (mg L−1) | tRDMP (min) | tRDEP (min) | tRDBP (min) | tRDOP (min) | |
|---|---|---|---|---|---|
| TpBD COFs | 237.8 | 9.205 | 9.751 | 9.485 | 9.648 |
| 475.6 | 8.951 | 9.482 | 9.113 | 9.156 | |
| 713.4 | 8.769 | 9.189 | 8.947 | 9.012 | |
| 951.5 | 8.603 | 8.859 | 8.558 | 8.809 | |
| 1189 | 8.595 | 8.734 | 8.325 | 8.415 | |
| Resin based COFs | 237.8 | 8.925 | 9.485 | 9.225 | 9.501 |
| 475.6 | 8.751 | 9.113 | 8.999 | 9.098 | |
| 713.4 | 8.595 | 8.951 | 8.702 | 8.901 | |
| 951.5 | 8.485 | 8.603 | 8.452 | 8.691 | |
| 1189 | 8.382 | 8.558 | 8.21 | 8.348 |
| Material | Analyte | ||||||||
|---|---|---|---|---|---|---|---|---|---|
| Linear Formula | R2 | qm (mg·g−1) | KL (×10−5) | Linear Formula | R2 | n | KF | ||
| TpBD COFs | DMP | y = 0.000838x + 10.741 | 0.909 | 1193.32 | 7.802 | y = 0.954x − 0.928 | 0.999 | 1.048 | 0.118 |
| DEP | y = 0.00141x + 9.945 | 0.983 | 709.22 | 1.417 | y = 0.929x − 0.841 | 0.999 | 1.076 | 0.144 | |
| DBP | y = 0.00175x + 10.183 | 0.984 | 571.43 | 1.178 | y = 0.921x − 0.837 | 0.999 | 1.085 | 0.145 | |
| DOP | y = 0.00176x + 10.083 | 0.952 | 568.18 | 1.745 | y = 0.923x − 0.837 | 0.999 | 1.083 | 0.145 | |
| Resin based COFs | DMP | y = 0.000761x + 11.053 | 0.986 | 1314.06 | 6.885 | y = 0.961x − 0.955 | 0.999 | 1.045 | 0.111 |
| DEP | y = 0.00132x + 10.319 | 0.944 | 757.58 | 1.279 | y = 0.934x − 0.867 | 0.999 | 1.071 | 0.136 | |
| DBP | y = 0.00163x + 10.471 | 0.997 | 613.50 | 1.556 | y = 0.928x − 0.864 | 0.999 | 1.077 | 0.136 | |
| DOP | y = 0.00174x + 10.219 | 0.979 | 574.71 | 1.702 | y = 0.925x − 0.848 | 0.999 | 1.081 | 0.141 | |
| Material | Analyte | ||||||
|---|---|---|---|---|---|---|---|
| Linear Formula | R2 | K1/(1 min−1) | Linear Formula | R2 | K2 (10−3·g/(mg·min)) | ||
| TpBD COFs | DMP | y = −0.315x + 5.506 | 0.696 | 0.315 | y = 0.0272x − 0.157 | 0.963 | 0.027 |
| DEP | y = −0.253x + 5.169 | 0.790 | 0.253 | y = 0.0169x − 0.0886 | 0.975 | 0.0170 | |
| DBP | y = −0.275x + 5.129 | 0.754 | 0.275 | y = 0.0219x − 0.113 | 0.964 | 0.022 | |
| DOP | y = −0.247x + 4.901 | 0.775 | 0.247 | y = 0.0184x − 0.0855 | 0.981 | 0.018 | |
| Resin based COFs | DMP | y = −0.300x + 5.357 | 0.718 | 0.300 | y = 0.0239x − 0.129 | 0.980 | 0.024 |
| DEP | y = −0.259x + 5.103 | 0.782 | 0.259 | y = 0.0179x − 0.0882 | 0.968 | 0.018 | |
| DBP | y = −0.275x + 5.101 | 0.754 | 0.275 | y = 0.0220x − 0.111 | 0.971 | 0.022 | |
| DOP | y = −0.262x + 4.959 | 0.749 | 0.262 | y = 0.0211x − 0.102 | 0.987 | 0.021 | |
| PAEs | Linear Equation | R2 | LOD (μg/L) | RSD (%) n = 5 |
| DMP | y = 8.64 × 10⁷ × x − 7.14 × 10⁴ | 0.997 | 0.02 | 0.118 |
| DEP | y = 8.39 × 10⁷ × x + 8.65 × 10³ | 0.992 | 0.05 | 0.149 |
| DBP | y = 8.26 × 10⁷ × x + 3.84 × 10⁵ | 0.996 | 0.01 | 0.127 |
| DOP | y = 2.13 × 10⁸ × x + 2.75 × 10⁵ | 0.991 | 0.06 | 0.306 |
| Sorbent | Method | Sample | Elution Solution | Recovery | Ref |
|---|---|---|---|---|---|
| GO@LDH@SPAN | GC-MS | water and beverage | methanol | 54.5–112.6% | [28] |
| Nanofiber pad | SPE-HPLC | tap water, rainwater and pool water | acetonitrile, methanol | >88% | [29] |
| polysulfone hollow fiber | SPME-FE/GC | water | ethanol | 87.0–117.7% | [30] |
| CuFe2O4 Nanoparticles | SPME | water | water | 81.1–103.7% | [31] |
| Graphene modified COF | HS-SPME-GC-MS | water | 10% (w/v) salt | 80.5–111.0% | [32] |
| TpBD COFs | SPE-HPLC | water and beverage | methanol | 98.26–100.56% | This work |
| Resin based COFs | 97.99–99.30% |
| Sample | Method | Material | Recovery (%, n = 3) | Material | Recovery (%, n = 3) | Material | Recovery (%, n = 3) |
|---|---|---|---|---|---|---|---|
| DMP | X | Market | 89.69 | TpBD COFs | 93.51 | Resin based COFs | 70.23 |
| X-CW | 70.62 | 99.23 | 62.46 | ||||
| X-A | 80.56 | 90.38 | 99.21 | ||||
| X-C | 62.31 | 90.56 | 99.99 | ||||
| DEP | X | 86.71 | 92.87 | 69.13 | |||
| X-CW | 68.75 | 99.99 | 60.35 | ||||
| X-A | 82.56 | 92.51 | 99.23 | ||||
| X-C | 68.89 | 91.88 | 99.87 | ||||
| DBP | X | 85.99 | 94.62 | 75.78 | |||
| X-CW | 60.23 | 97.80 | 59.12 | ||||
| X-A | 86.89 | 92.61 | 96.56 | ||||
| X-C | 65.26 | 91.10 | 95.30 | ||||
| DOP | X | 59.56 | 90.83 | 80.89 | |||
| X-CW | 30.25 | 78.92 | 98.73 | ||||
| X-A | 83.45 | 98.99 | 96.18 | ||||
| X-C | 30.23 | 98.00 | 92.89 |
| Analyte | Method | Peak Area (×106) | Average (×106) | SD (×106) | RSD (%) | |||||
|---|---|---|---|---|---|---|---|---|---|---|
| Mixture1 | X-A | DMP | 2.18 | 2.17 | 2.15 | 2.16 | 2.16 | 2.164 | 0.0114 | 0.526 |
| DEP | 2.16 | 2.16 | 2.16 | 2.14 | 2.15 | 2.154 | 0.00894 | 0.415 | ||
| DBP | 1.47 | 1.46 | 1.49 | 1.46 | 1.46 | 1.468 | 0.0130 | 0.888 | ||
| DOP | 1.39 | 1.40 | 1.38 | 1.39 | 1.40 | 1.392 | 0.00836 | 0.601 | ||
| X-C | DMP | 2.34 | 2.36 | 2.32 | 2.34 | 2.35 | 2.342 | 0.0148 | 0.633 | |
| DEP | 2.18 | 2.18 | 2.18 | 2.17 | 2.17 | 2.176 | 0.00547 | 0.251 | ||
| DBP | 1.48 | 1.47 | 1.5 | 1.47 | 1.46 | 1.476 | 0.0151 | 1.027 | ||
| DOP | 1.42 | 1.42 | 1.42 | 1.40 | 1.40 | 1.412 | 0.0109 | 0.775 | ||
| Mixture2 | X-A | DMP | 3.99 | 3.99 | 4.02 | 4.00 | 3.98 | 3.996 | 0.0151 | 0.379 |
| DEP | 3.32 | 3.32 | 3.34 | 3.33 | 3.32 | 3.326 | 0.00894 | 0.268 | ||
| DBP | 2.61 | 2.60 | 2.60 | 2.60 | 2.60 | 2.602 | 0.00447 | 0.171 | ||
| DOP | 1.92 | 1.90 | 1.93 | 1.91 | 1.90 | 1.912 | 0.0130 | 0.681 | ||
| X-C | DMP | 4.85 | 4.83 | 4.86 | 4.82 | 4.82 | 4.836 | 0.0181 | 0.375 | |
| DEP | 2.92 | 2.92 | 2.90 | 2.90 | 2.91 | 2.910 | 0.010 | 0.343 | ||
| DBP | 2.88 | 2.9 | 2.87 | 2.89 | 2.87 | 2.882 | 0.0130 | 0.452 | ||
| DOP | 2.23 | 2.23 | 2.21 | 2.22 | 2.23 | 2.224 | 0.00894 | 0.402 | ||
| Analyte | Method | Peak Area (×106) | Average (×106) | SD (×106) | RSD (%) | |||||
|---|---|---|---|---|---|---|---|---|---|---|
| Mixture1 | X-A | DMP | 2.28 | 2.26 | 2.31 | 2.30 | 2.34 | 2.298 | 0.0303 | 1.31 |
| DEP | 2.17 | 2.18 | 2.18 | 2.20 | 2.19 | 2.184 | 0.0114 | 0.52 | ||
| DBP | 1.49 | 1.42 | 1.58 | 1.56 | 1.46 | 1.502 | 0.0672 | 2.47 | ||
| DOP | 1.42 | 1.44 | 1.48 | 1.39 | 1.50 | 1.446 | 0.0444 | 3.07 | ||
| X-C | DMP | 2.74 | 2.68 | 2.68 | 2.71 | 2.80 | 2.722 | 0.0502 | 1.84 | |
| DEP | 2.30 | 2.31 | 2.32 | 2.32 | 2.32 | 2.314 | 0.0089 | 0.38 | ||
| DBP | 1.56 | 1.67 | 1.63 | 1.51 | 1.70 | 1.614 | 0.0610 | 3.78 | ||
| DOP | 1.70 | 1.72 | 1.82 | 1.86 | 1.86 | 1.792 | 0.0769 | 4.29 | ||
| Mixture2 | X-A | DMP | 4.01 | 4.20 | 4.11 | 4.06 | 4.04 | 4.084 | 0.0743 | 1.82 |
| DEP | 3.44 | 3.47 | 3.42 | 3.46 | 3.40 | 3.438 | 0.0286 | 0.83 | ||
| DBP | 2.63 | 2.65 | 2.64 | 2.60 | 2.67 | 2.638 | 0.0258 | 0.98 | ||
| DOP | 2.19 | 2.10 | 2.14 | 2.16 | 2.09 | 2.136 | 0.0415 | 1.94 | ||
| X-C | DMP | 4.96 | 4.80 | 4.98 | 4.91 | 4.89 | 4.908 | 0.0704 | 1.43 | |
| DEP | 3.04 | 3.22 | 3.08 | 3.13 | 3.16 | 3.126 | 0.0698 | 2.23 | ||
| DBP | 2.91 | 2.90 | 2.68 | 2.81 | 2.87 | 2.834 | 0.0944 | 3.33 | ||
| DOP | 2.25 | 2.14 | 2.51 | 2.25 | 2.16 | 2.262 | 0.0975 | 3.52 | ||
| Sample | Method | Material | Targets | Spiked (μg/L) | Recovery (%, n = 3) |
|---|---|---|---|---|---|
| Water | X-C method | TpBD COFs | DMP | 10 | 98.99 |
| 20 | 100.56 | ||||
| 30 | 99.00 | ||||
| 40 | 98.75 | ||||
| DEP | 10 | 99.11 | |||
| 20 | 99.23 | ||||
| 30 | 100.11 | ||||
| 40 | 100.35 | ||||
| DBP | 10 | 99.99 | |||
| 20 | 99.45 | ||||
| 30 | 99.68 | ||||
| 40 | 99.87 | ||||
| DOP | 10 | 99.91 | |||
| 20 | 98.99 | ||||
| 30 | 99.16 | ||||
| 40 | 99.99 | ||||
| Resin based COFs | DMP | 10 | 98.26 | ||
| 20 | 98.56 | ||||
| 30 | 98.42 | ||||
| 40 | 98.80 | ||||
| DEP | 10 | 97.99 | |||
| 20 | 98.27 | ||||
| 30 | 98.46 | ||||
| 40 | 99.30 | ||||
| DBP | 10 | 98.97 | |||
| 20 | 98.71 | ||||
| 30 | 98.65 | ||||
| 40 | 98.72 | ||||
| DOP | 10 | 98.61 | |||
| 20 | 98.75 | ||||
| 30 | 99.13 | ||||
| 40 | 98.79 | ||||
| X-A method | TpBD COFs | DMP | 10 | 98.72 | |
| 20 | 98.90 | ||||
| 30 | 98.99 | ||||
| 40 | 98.60 | ||||
| DEP | 10 | 99.10 | |||
| 20 | 98.99 | ||||
| 30 | 98.10 | ||||
| 40 | 98.76 | ||||
| DBP | 10 | 98.88 | |||
| 20 | 98.60 | ||||
| 30 | 98.74 | ||||
| 40 | 98.56 | ||||
| DOP | 10 | 99.16 | |||
| 20 | 99.26 | ||||
| 30 | 99.34 | ||||
| 40 | 98.91 | ||||
| Resin based COFs | DMP | 10 | 98.85 | ||
| 20 | 98.66 | ||||
| 30 | 98.99 | ||||
| 40 | 98.39 | ||||
| DEP | 10 | 98.79 | |||
| 20 | 98.83 | ||||
| 30 | 98.86 | ||||
| 40 | 99.15 | ||||
| DBP | 10 | 98.10 | |||
| 20 | 98.44 | ||||
| 30 | 98.96 | ||||
| 40 | 98.08 | ||||
| DOP | 10 | 99.11 | |||
| 20 | 99.01 | ||||
| 30 | 98.88 | ||||
| 40 | 98.56 | ||||
| Vitamin beverage | X-C method | TpBD COFs | DMP | 10 | 99.23 |
| 20 | 99.56 | ||||
| 30 | 99.78 | ||||
| 40 | 99.91 | ||||
| DEP | 10 | 100.01 | |||
| 20 | 99.88 | ||||
| 30 | 100.23 | ||||
| 40 | 100.15 | ||||
| DBP | 10 | 99.46 | |||
| 20 | 99.87 | ||||
| 30 | 99.85 | ||||
| 40 | 99.45 | ||||
| DOP | 10 | 99.61 | |||
| 20 | 99.99 | ||||
| 30 | 100.01 | ||||
| 40 | 99.00 | ||||
| Resin based COFs | DMP | 10 | 98.80 | ||
| 20 | 98.86 | ||||
| 30 | 99.15 | ||||
| 40 | 98.85 | ||||
| DEP | 10 | 98.79 | |||
| 20 | 98.88 | ||||
| 30 | 98.62 | ||||
| 40 | 98.56 | ||||
| DBP | 10 | 98.99 | |||
| 20 | 98.75 | ||||
| 30 | 98.76 | ||||
| 40 | 99.13 | ||||
| DOP | 10 | 98.67 | |||
| 20 | 98.99 | ||||
| 30 | 98.56 | ||||
| 40 | 98.89 | ||||
| X-A method | TpBD COFs | DMP | 10 | 98.26 | |
| 20 | 98.53 | ||||
| 30 | 98.42 | ||||
| 40 | 98.21 | ||||
| DEP | 10 | 98.10 | |||
| 20 | 98.76 | ||||
| 30 | 98.52 | ||||
| 40 | 98.00 | ||||
| DBP | 10 | 98.99 | |||
| 20 | 98.23 | ||||
| 30 | 98.41 | ||||
| 40 | 97.93 | ||||
| DOP | 10 | 98.08 | |||
| 20 | 98.76 | ||||
| 30 | 99.23 | ||||
| 40 | 98.45 | ||||
| Resin based COFs | DMP | 10 | 98.60 | ||
| 20 | 98.61 | ||||
| 30 | 98.48 | ||||
| 40 | 98.67 | ||||
| DEP | 10 | 98.58 | |||
| 20 | 98.49 | ||||
| 30 | 98.26 | ||||
| 40 | 98.00 | ||||
| DBP | 10 | 98.99 | |||
| 20 | 98.56 | ||||
| 30 | 98.70 | ||||
| 40 | 98.23 | ||||
| DOP | 10 | 98.06 | |||
| 20 | 98.88 | ||||
| 30 | 98.31 | ||||
| 40 | 98.16 |
Publisher’s Note: MDPI stays neutral with regard to jurisdictional claims in published maps and institutional affiliations. |
© 2021 by the authors. Licensee MDPI, Basel, Switzerland. This article is an open access article distributed under the terms and conditions of the Creative Commons Attribution (CC BY) license (https://creativecommons.org/licenses/by/4.0/).
Share and Cite
Ma, Y.; Gao, X.; Ruan, Y.; Cui, H.; Zhang, L.; Zhang, W.; Wang, S. Determination of Phthalate Esters in Beverages and Water Samples by Solid Phase Extraction with Resin Based COFs as Filler. Water 2021, 13, 3338. https://doi.org/10.3390/w13233338
Ma Y, Gao X, Ruan Y, Cui H, Zhang L, Zhang W, Wang S. Determination of Phthalate Esters in Beverages and Water Samples by Solid Phase Extraction with Resin Based COFs as Filler. Water. 2021; 13(23):3338. https://doi.org/10.3390/w13233338
Chicago/Turabian StyleMa, Yunjie, Xin Gao, Yang Ruan, Hang Cui, Li Zhang, Wei Zhang, and Shaoyan Wang. 2021. "Determination of Phthalate Esters in Beverages and Water Samples by Solid Phase Extraction with Resin Based COFs as Filler" Water 13, no. 23: 3338. https://doi.org/10.3390/w13233338