
Wood Retention at Inclined Bar Screens: Effect of Wood Characteristics on Backwater Rise and Bedload Transport


1
ETH Zurich, Laboratory of Hydraulics, Hydrology and Glaciology (VAW), 8093 Zurich, Switzerland
2
Institute of Earth Surface Dynamics (IDYST), Faculty of Geosciences and the Environment, University of Lausanne, 1015 Lausanne, Switzerland
*
Author to whom correspondence should be addressed.
Water 2021, 13(16), 2231; https://doi.org/10.3390/w13162231
Submission received: 29 June 2021
/
Revised: 11 August 2021
/
Accepted: 12 August 2021
/
Published: 16 August 2021
(This article belongs to the Special Issue Impact of Large Wood on River Ecosystems)
Abstract
:In forested mountain catchment areas, both bedload and large wood (LW) can be transported during ordinary flows. Retention structures such as sediment traps or racks are built to mitigate potential hazards downstream. Up to now, the design of these retention structures focuses on either LW or bedload. In addition, the majority of LW retention racks tend to retain both LW and bedload, while bedload transport continuity during ordinary flows is an important aspect to be considered in the design. Therefore, a series of flume experiments was conducted to study the effect of LW accumulations at an inclined bar screen with a bottom clearance on backwater rise and bedload transport. The main focus was put on testing different LW characteristics such as LW size, density, fine material, and shape (branches and rootwads), as well as a sequenced flood. The results demonstrated that a few logs (wood volume of ≈ 7 m prototype scale with a model scale factor of 30) are sufficient to reduce the bedload transport capacity to below 75% compared to the condition without LW. Fine material and smaller wood sizes further reduced bedload transport and increased backwater rise. In contrast, LW density and LW shape had a negligible effect. The test focusing on a sequenced flood highlighted the need for maintenance measures to avoid self-flushing of the bed material. The results of this study further indicate that an inclined bar screen may need to be adapted by considering LW characteristics in the design of the bottom clearance to enable bedload continuity during ordinary flows.
1. Introduction
Potential hazards associated with intense bedload transport in steep mountain streams have traditionally been managed by building check dams and sediment trap structures [1]. The design of such retention structures has evolved through time, and nowadays a variety of models exists, ranging from solid dams to slit and other types of open check dams [2,3]. The design depends on both the purpose and function of the structure, which can be grouped in (i) stabilization and consolidation to prevent or stop bed incision or lateral erosion, (ii) retention and storage of water and/or sediment, (iii) dosing and filtering to regulate peak flows and to sort selected sediment fractions, and (iv) energy dissipation to reduce stream power and break debris flows [1,4]. An important aspect for designing sediment traps is related to the impact on the stream ecosystem. By retaining flow and sediment, the natural regimes downstream of the structure are altered, leading to morphological and physical changes, such as incision, lateral erosion, or armoring, with important consequences in terms of habitat loss and changes in ecological characteristics and biodiversity [5,6,7]. Therefore, it is important to design retention structures that are effective in retaining sediment during potentially hazardous events (high flows), but are permeable during ordinary flows. With this aim, a novel design of semipermeable check dams has recently been proposed by combining a hydraulic with a mechanical barrier and a guiding channel [8,9,10,11]. This semipermeable structure proved to be successful in terms of maintaining bedload transport continuity during ordinary flows and bedload retention during higher flows. However, mountain streams in forested catchments can also transport large wood (LW; herein defined as logs with a length ≥1 m and a diameter ≥0.1 m [12,13,14]), such as downed trees, trunks, rootwads, and branches, during both ordinary and high flows. The choice of retention structure type should, therefore, also consider the transport and retention of LW [15,16]. Design guidelines for retention structures in mountain streams that properly manage both bedload and LW are still lacking. A novel rack design for low-gradient (small Froude number) river sections is the bypass retention system. This rack is installed at an outer river bend parallel to the flow and enables the separation of bedload and LW due to the secondary currents induced by the river curvature, thereby allowing the structure to trap LW without limiting the bedload transport continuity [17]. As this rack design requires both smaller slope gradients and a river bend, it may not be efficient in steeper, mountain streams. The majority of sediment traps has been designed without considering LW or the conducted experiments were limited to a specific case study [11,18,19]. In addition, common wood retention structures are usually designed to only retain LW, whereas they tend to also retain bedload [20]. Flume experiments with inclined racks showed that both backwater rise and local scour decreases with increasing rack inclination [21]. First experiments at an inclined bar screen with a lower gap demonstrated that LW volume blocking 20% of the flow cross section is sufficient to reduce bedload transport by 50% [22] and the effect of LW on bedload transport should, thus, not be overlooked.
Based on a preliminary proof-of-concept by Schalko and Weitbrecht [22], this paper aims at testing the effects of LW accumulation at inclined bar screens on the bedload transport continuity during ordinary flows. The functionality of a complete sediment trap during large floods was not the focus of this study. The flume experiments were performed to reproduce morphologically effective ordinary flows, so bedload transport occurs (following the work in [23]). This effective discharge was assumed to be equivalent to a bankfull discharge, which can be linked to return periods of 1 to 3 years for most rivers [24], but could increase to 30 to 50 years for steep mountain streams [8,25]. Following the procedure tested by Schalko and Weitbrecht [22], we broadened the tested parameter range and focused on wood characteristics. Specifically, we studied the impact of different LW sizes, shapes, densities, and organic fine material (i.e., fir branches and leaves [26,27,28]) on backwater rise upstream of the rack and on bedload transport continuity. In this paper, we hypothesized that (H1) LW retention at the inclined bar screen affects the behaviour of the structure, triggering backwater rise and leading to bedload retention; (H2) LW characteristics (i.e., dimension, shape, and density) influence backwater rise and bedload transport continuity; (H3) organic fine material (i.e., fir branches and leaves) within an accumulation results in increased backwater rise and bedload deposition; (H4) the maintenance of the structure requires both LW and bedload management to avoid bedload self-flushing, especially during sequenced floods; and (H5) the design of inclined bar screens, including the lower gap, is not only a function of characteristic grain size diameters, but also of LW dimensions.
2. Materials and Methods
2.1. Experimental Setup
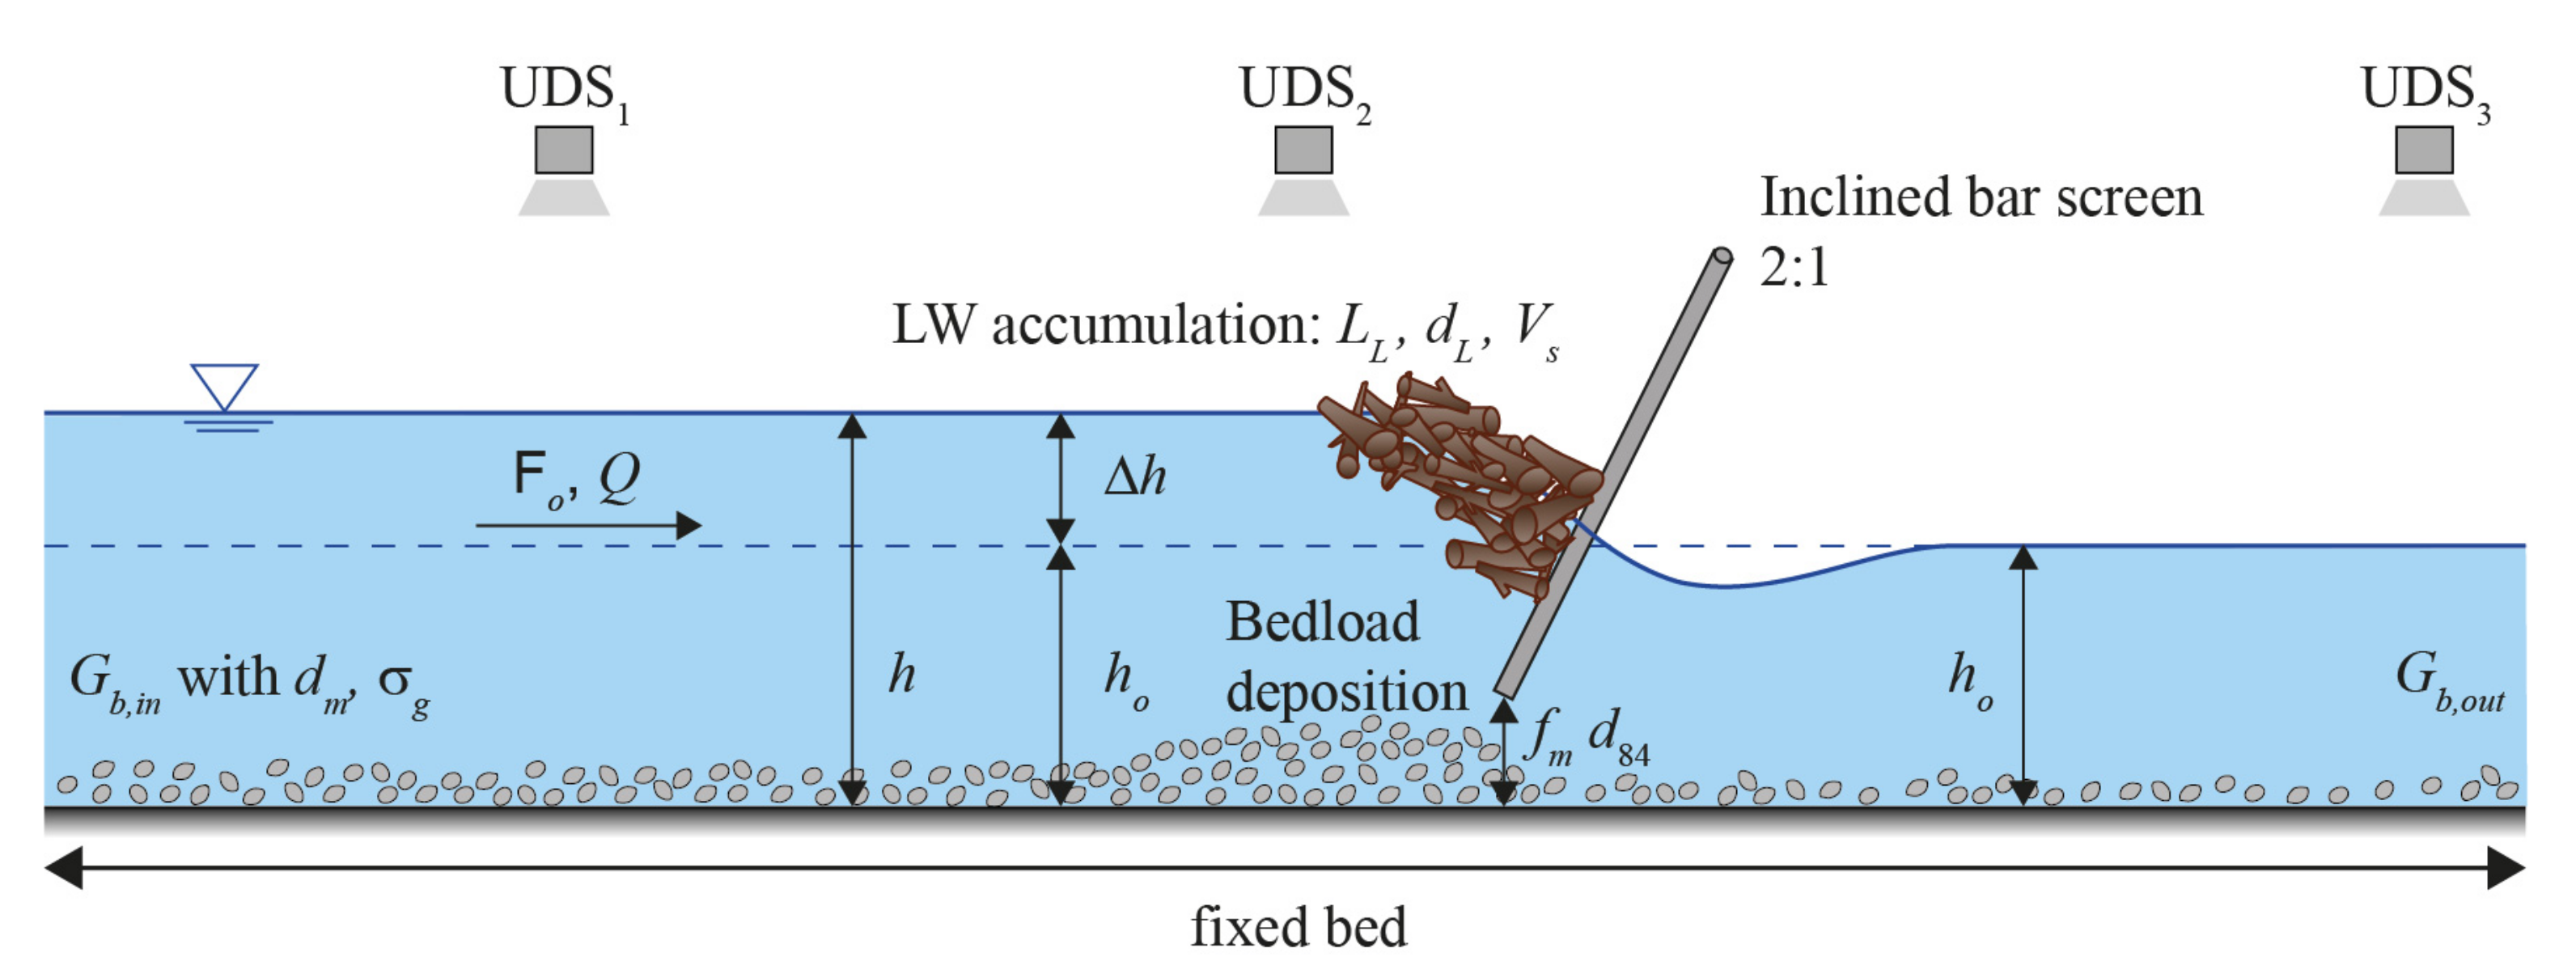
Physical model tests were performed at the Laboratory of Hydraulics, Hydrology and Glaciology (VAW) at ETH Zurich. The experiments were conducted according to Froude similitude with a model scale factor of = 30 in an 8 m long, 0.4 m wide, and 0.7 m deep glass-walled channel with a slope of S = 3.3%. The test setup and notation are illustrated in Figure 1. The intake is 0.66 m long and equipped with two flow straighteners to suppress secondary currents and surface waves. Approximately 4 m downstream from the intake an inclined bar screen with aluminum circular bars (5 mm diameter) and a lower gap was placed in the flume to mimic the mechanical control of a semipermeable check-dam within a guiding channel. The inclined bar screen was designed based on the recommendations by Schwindt et al. [9] and Roth et al. [10] with an inclination of 2:1. The concrete orifice dam of the Schwindt et al. [9] design was neglected, as the focus of this study was on the interaction between bedload transport and LW at the inclined bar screen during ordinary flows. The open bar spacing b = 1.2 and the bottom clearance height (with defined as a pre-factor) are both a function of the characteristic grain size diameter and were kept constant during the experiments with b = 7 mm and = 19 mm (similar relative bottom clearance height / = 0.56 to Roth et al. [10]). The model bar diameter was set to 5 mm, in the same order of magnitude as . Steady-state discharge with Q = 11.6 l/s was used to reproduce morphologically effective ordinary flows. The tested Q and S correspond to supercritical flow conditions with an approach flow (subscript o) Froude number F = v/ ≥ 1, with v flow velocity, g gravitational acceleration, and h water depth. The discharge was measured with an electromagnetic flow meter (MID) with ±0.1% accuracy and the water depth was measured with two Ultrasonic Distance Sensors (UDS) positioned 1.2 m and 0.3 m upstream and one UDS 1.2 m downstream of the inclined bar screen with ±0.3 mm accuracy. For all tests, backwater rise () was calculated as the difference between upstream and downstream water depth to = with relative backwater rise defined as /.
2.2. Model Large Wood and Sediment
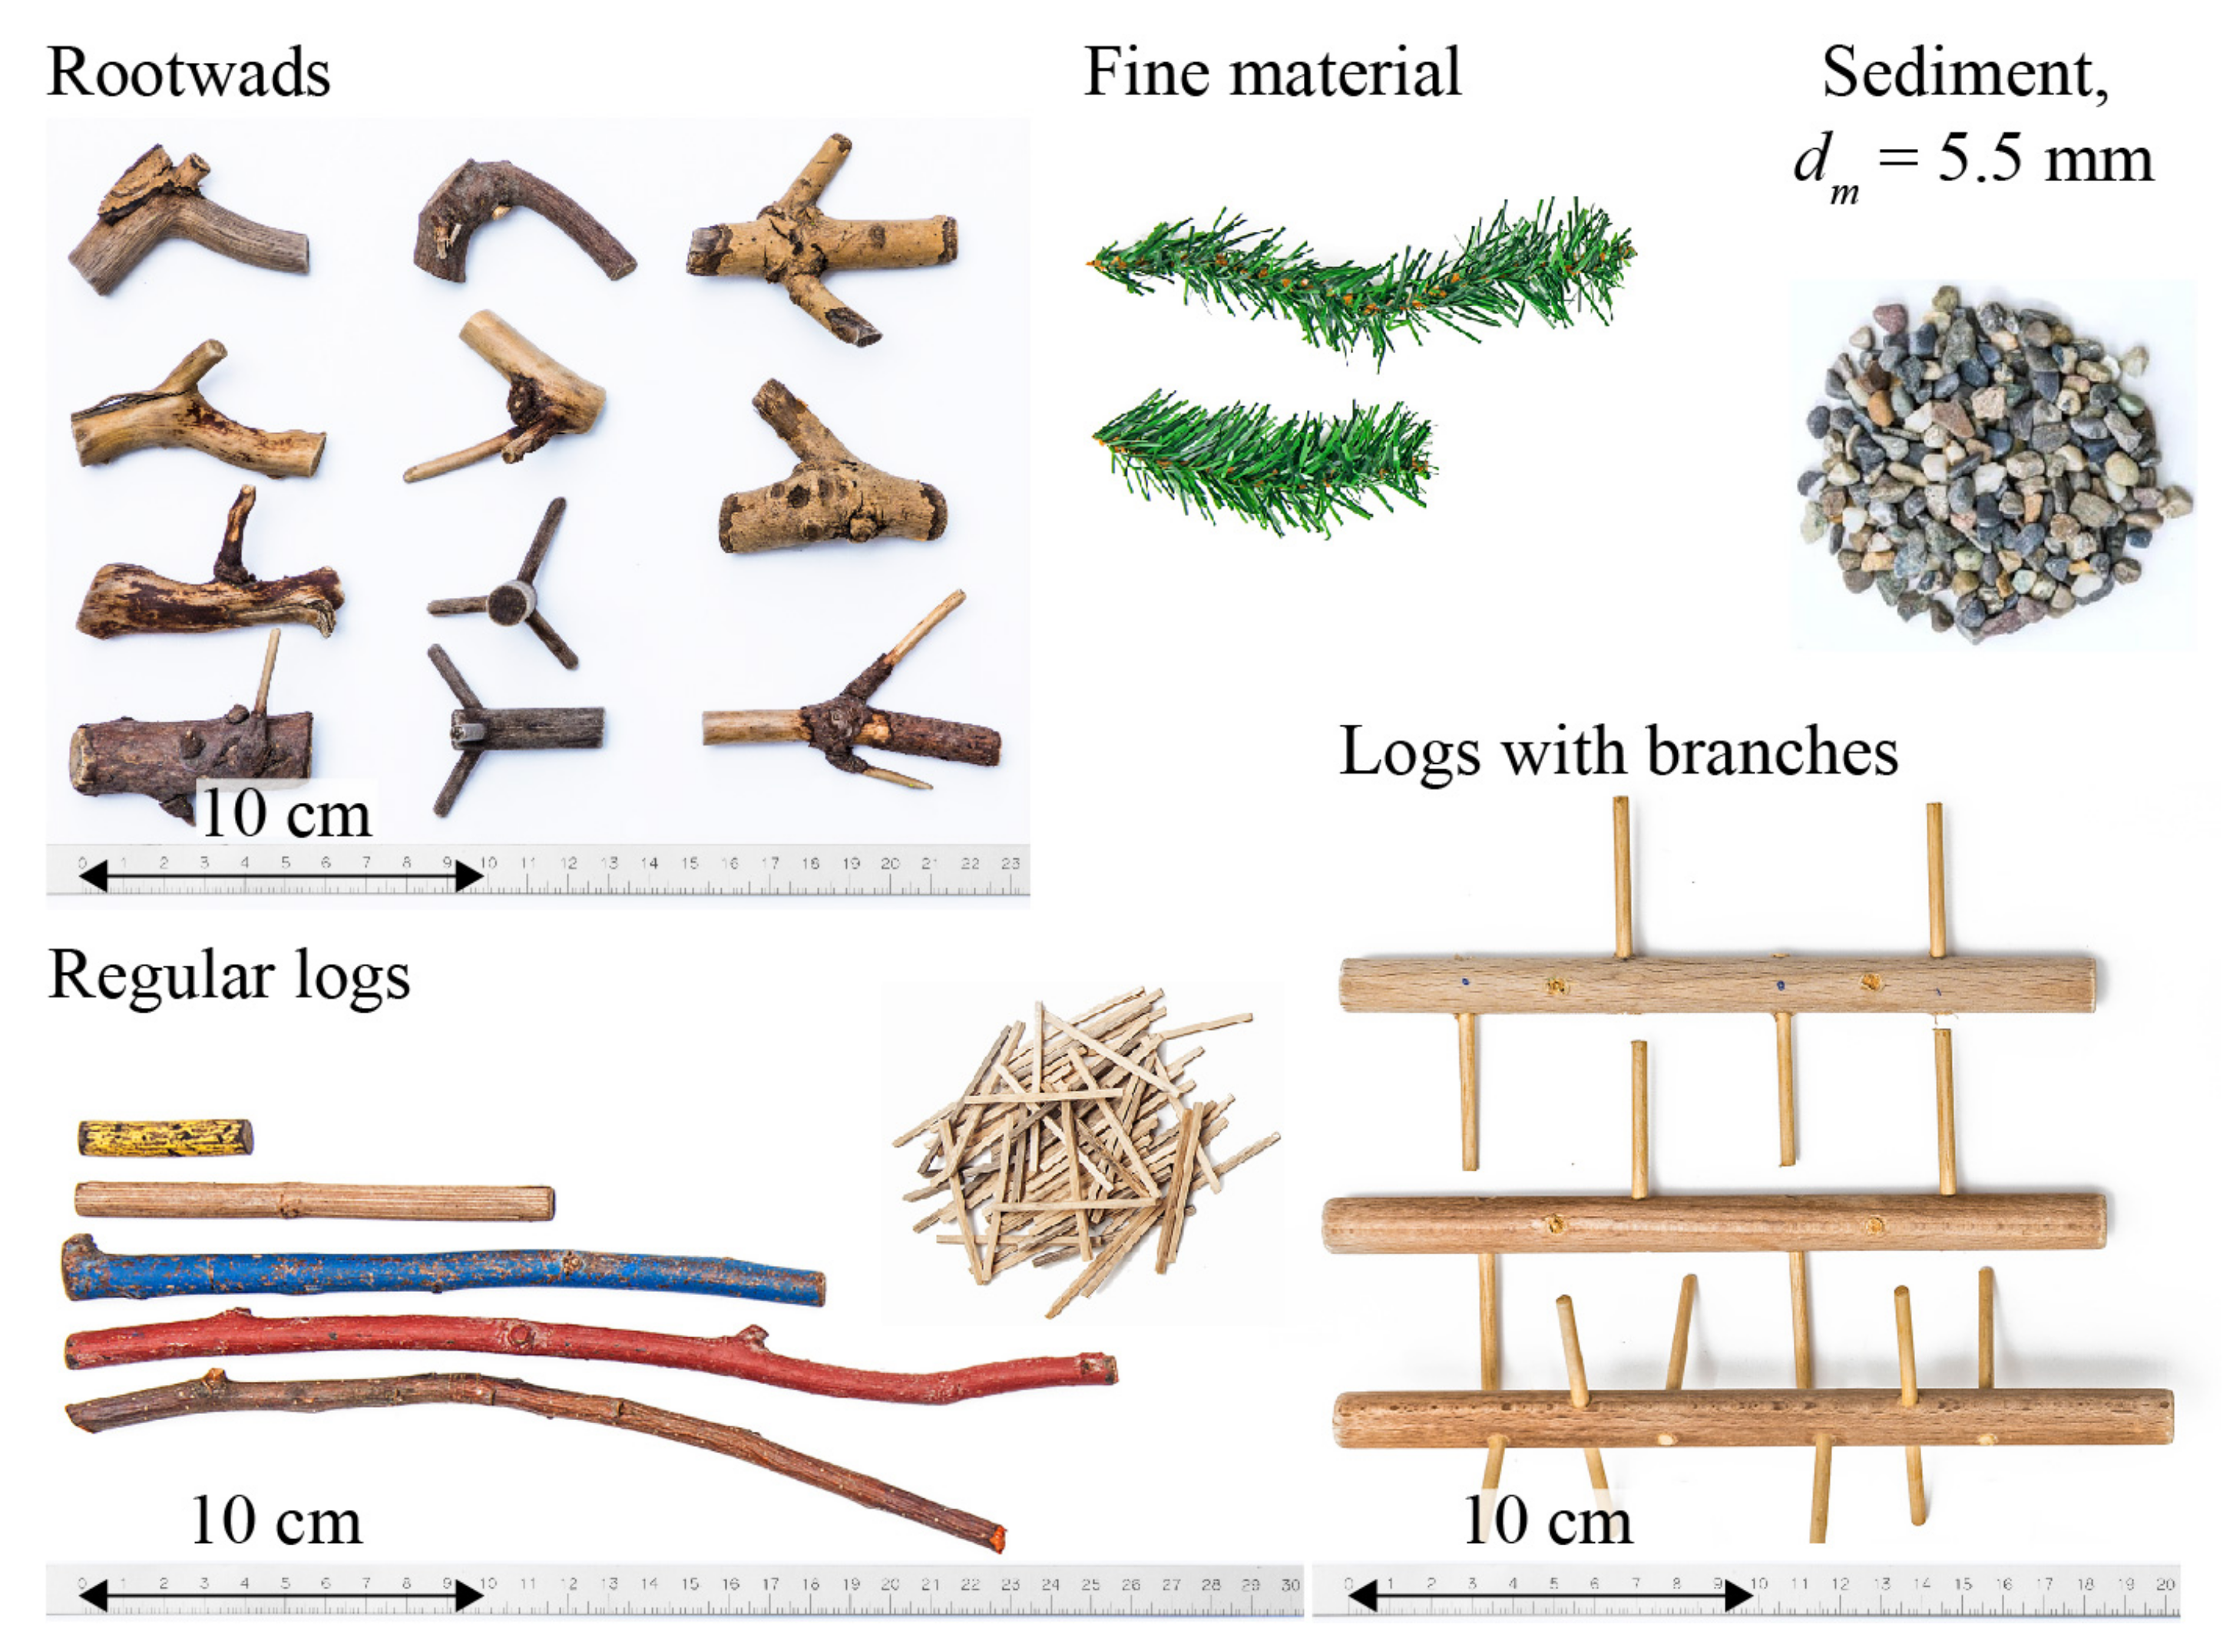
Natural cylindrical wooden logs were used to model LW. In addition, logs with branches, rootwads, and model fine material (using plastic fir tree made of polyvinyl chloride) were also tested (Figure 2). The log diameter varied between = 0.2 and 2 cm and log length = 4.7 to 20 cm. LW density was varied by watering the logs for several days until the respective density of 500 to 1100 kg/m was reached. The fine material and rootwads were added to the solid LW volume as a volume percentage with 10, 30, and 50% of fine material and 25 and 50% of rootwads. A total of 200 g of LW was added in four wood packages to the flow 0.5 m downstream of the inlet. Each wood package consisted of a solid wood mass = 50 g (i.e., 6–7 logs for V1a–c). Based on the solid wood mass and the wood density , the respective solid wood volume can be calculated for each wood package as well as the relative wood volume , defined as the wood volume required to block an idealized rectangular cuboid = , with B channel width. Considering the different tested LW characteristics, = 0.14 to 0.30 for each wood package. The wood trapping ratio = / is the ratio of the wood volume blocked at the inclined bar screen to the entire wood volume added to the flow.
Uniform bed material was used as model sediment with the characteristic grain size diameters of = 5.5 mm (subscript m as mean), = 6.0 mm (0.18 m in prototype with = 30 to model coarse gravel bed rivers), = 5.9 mm, and = 5.2 mm (see in [22]). The sorting coefficient of the grain size distribution was = 1.1 and verified with a sieving analysis. Prior to the addition of LW, the initial condition of bedload transport was defined as apparent transport across channel width with the initial (subscript IC) non-dimensional bed shear stress ≥ 0.11 and larger than the threshold value for full transport in gravel bed rivers = 0.06 [29]. The corresponding bedload transport input rate in (g/s) was calculated using the bedload transport equation by Rickenmann [30], resulting in = 88 g/s for the tested flow and bedload conditions. The calculated value was then verified during the experiments and added continuously to the flow over the entire test duration using a sediment feeder. The experiments were conducted for 100% transport capacity, so bedload transport input equals output rate. The bedload transport output rate was manually measured for a defined duration (≈5 min) using a filter basket, and then drying in the oven and weighing the sediment with ±0.5 g/s accuracy. The bedload transport reduction factor was computed as the ratio between the bedload output rate and bedload input rate to = /. A value of = 0.75 (i.e., the bedload output is reduced to 75% of the bedload supply and 25% of the input bedload is retained due to the inclined bar screen) was defined as the critical threshold for maintaining bedload transport continuity [10,22]. During the experiments, was determined after each LW package addition.
2.3. Test Program and Procedure
The test program is listed in Table 1. The focus of the experiments in this paper was put on the wood characteristics. Therefore, the rack geometry was kept constant with a bottom clearance height of = 1.9 cm as well as the initial conditions with discharge Q = 11.6 l/s, approach flow depth = 3.4 cm, flow Froude number F = 1.55, channel slope S = 3.3%, non-dimensional bed shear stress = 0.11, and bedload transport rate = 88 g/s. The reproducibility of the experiments was evaluated in tests V1a–c. In tests V1–V5, the effect of log density was studied. Different log dimensions were investigated in tests V6–V8. Model fine material was added to the LW accumulation in tests V9–V11. In tests V12–V14, the effect of branches and rootwads was studied. For test V15, the test procedure was adapted to model a sequenced flood and consisted of two runs. Similar to the previous tests, four LW packages (i.e., wood supply 1) were added to the flow during the first run. After the addition of the last LW package, the accumulated LW was removed and the second run started with the addition of a new set of four LW packages (i.e., wood supply 2) to the flow without changing flow and bedload conditions. The time between wood removal and the beginning of the second run (wood supply 2) amounted to 3 min, similar to the time interval between the addition of LW packages.
The test procedure can be summarized by the following steps. First, the approach flow conditions were set by gradually increasing Q with S = 0% at test start. The channel slope was then increased to S = 3.3% and the bedload addition started. The initial bedload transport condition was evaluated by measuring with UDS and calculating . Equilibrium of bedload transport ( = ; 100% transport capacity) was validated by manually measuring . Second, the inclined bar screen was inserted to the flume with the defined bottom clearance height , and both water depth h and bedload transport output rate were measured to check the influence of the inclined bar screen on flow and bedload transport continuity. Prior to rack addition, = 99.2% (±1.5) compared to = 99.0% (±1.3) with the rack, demonstrating that the rack itself had a negligible effect on . Third, LW was added to the flow in random orientation and distributed across the flume width. After each LW package, h and were measured after an equilibrium was reached with respect to h (≈2 min). After the addition of the respective LW volume (i.e., four LW packages), S was reduced to 0%, bedload supply stopped, and Q reduced. LW that accumulated at the inclined bar screen was extracted and dried.
3. Results and Discussion
3.1. Test Reproducibility and Wood Trapping Ratio
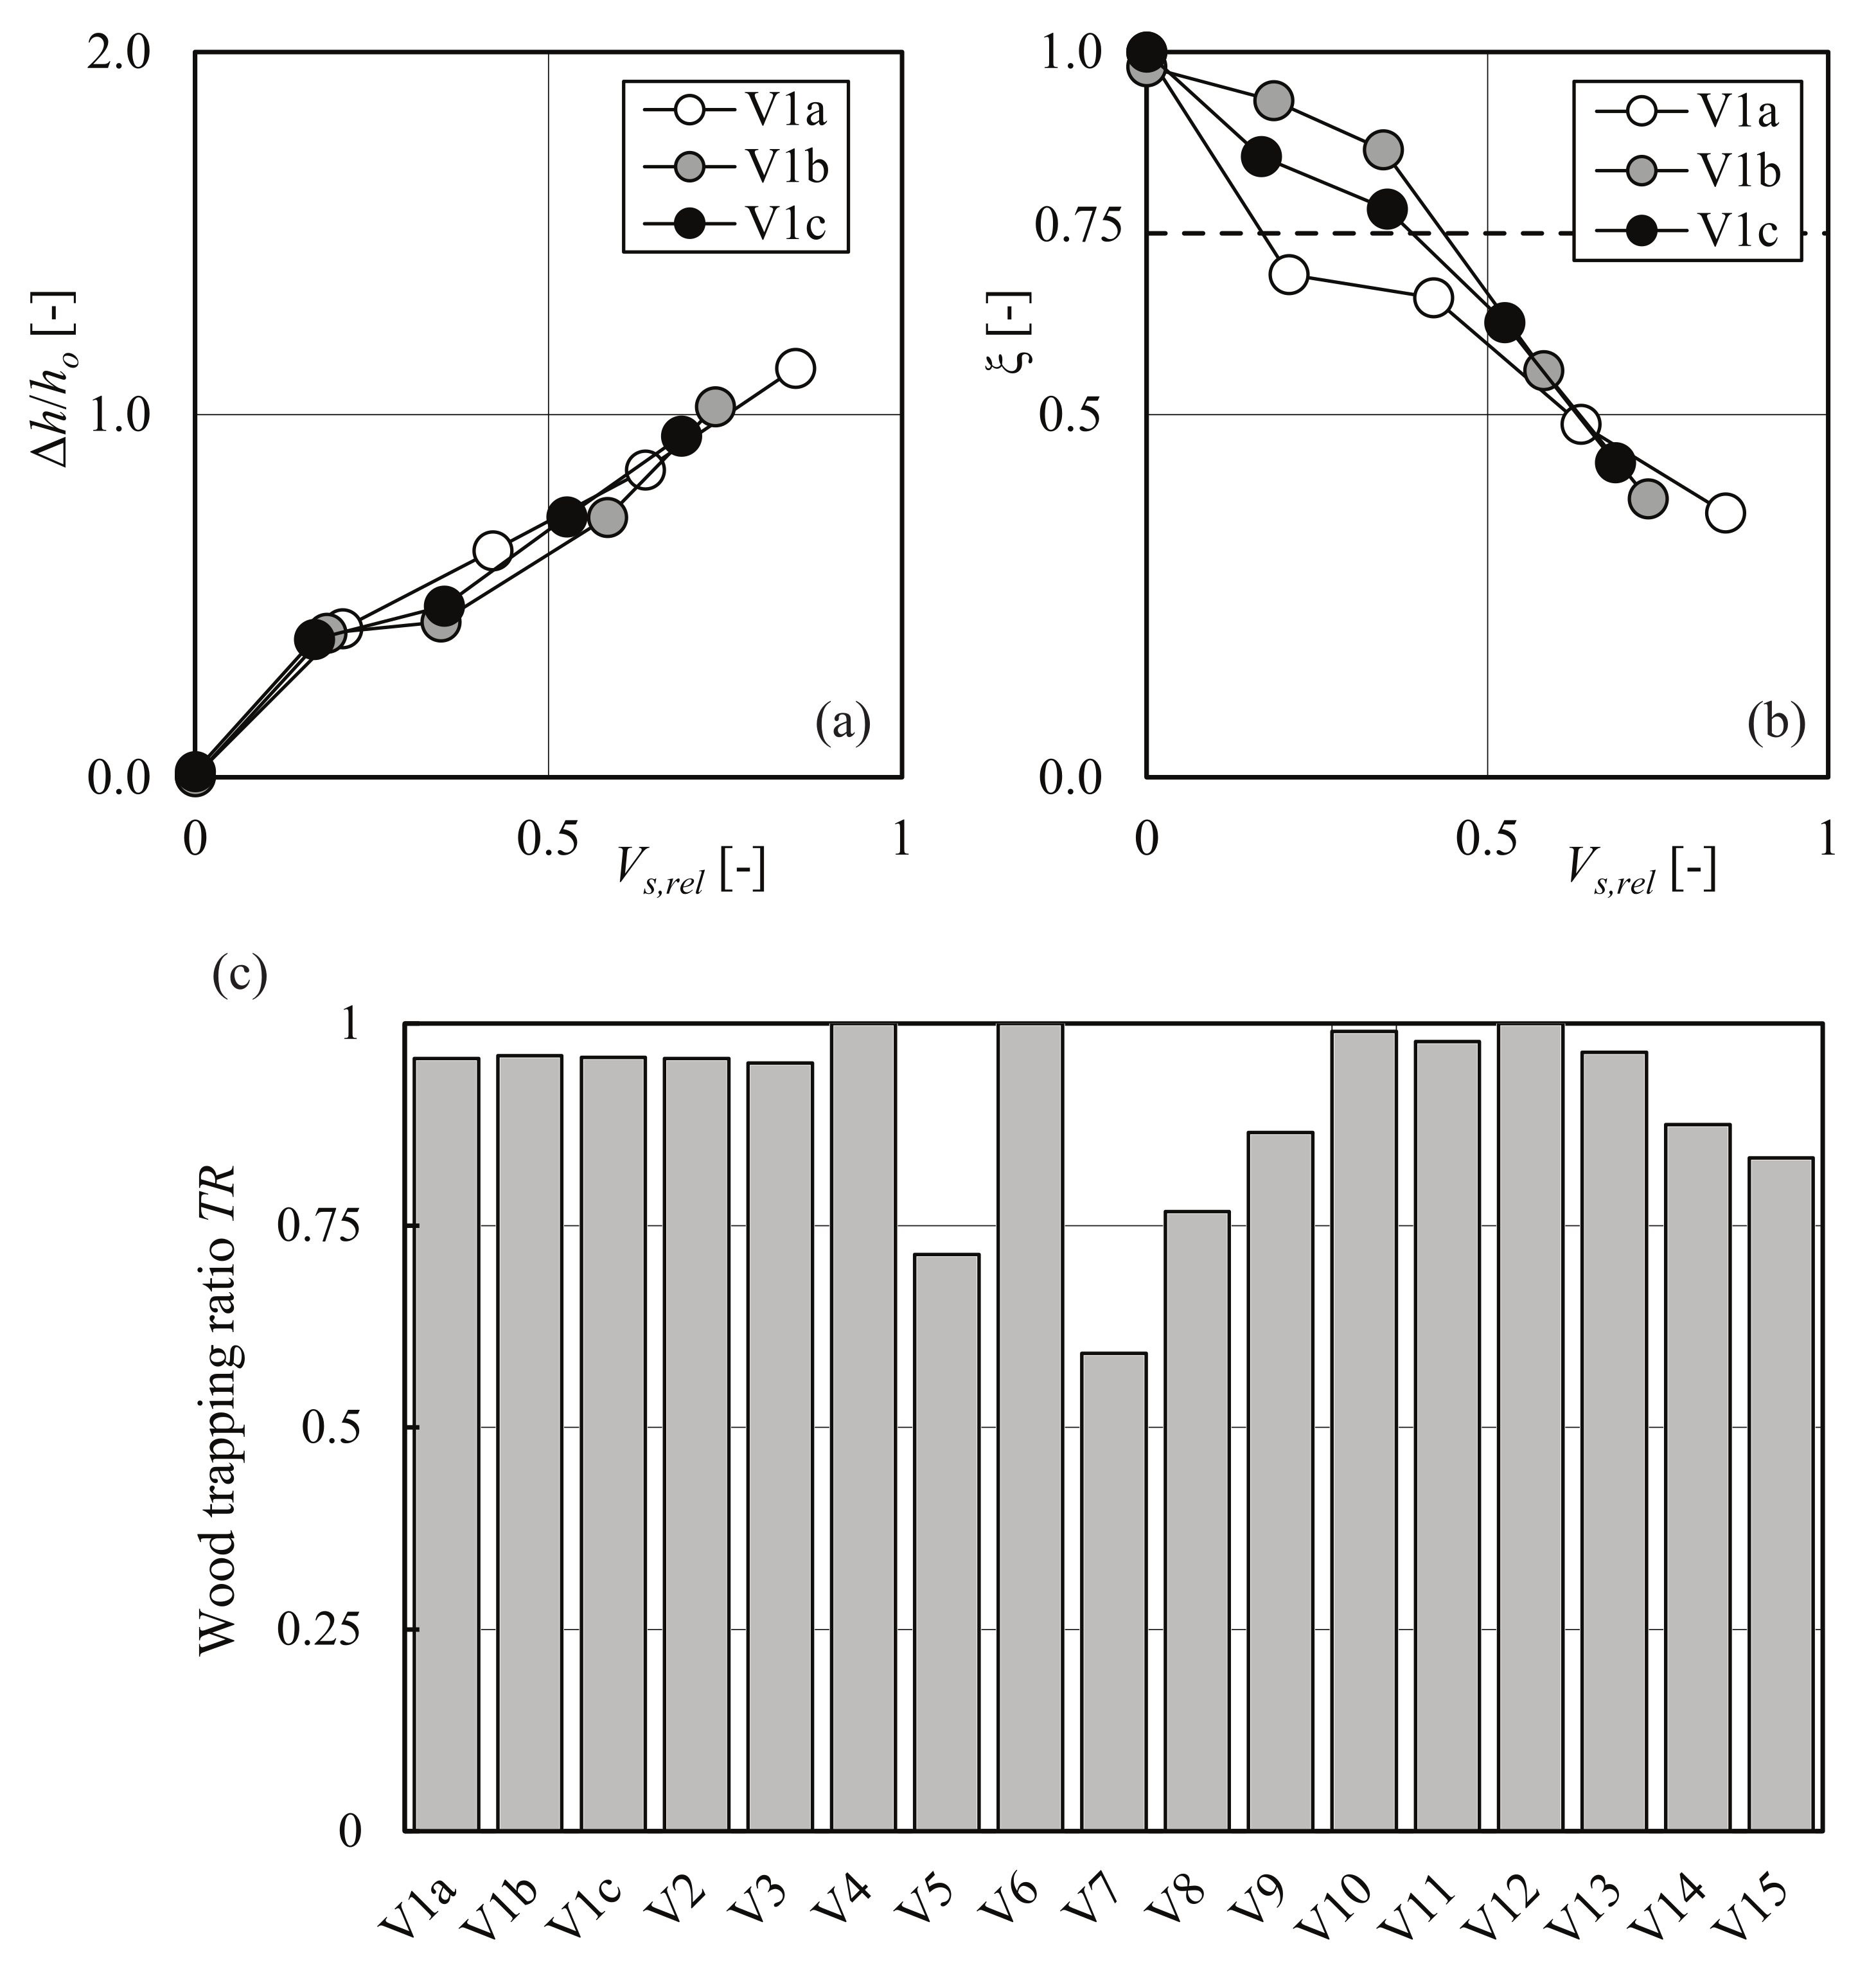
Test reproducibility was confirmed by tests V1a–c (Figure 3). Relative backwater rise / increased and relative bedload transport reduction factor decreased with increasing relative solid wood volume . The mean relative standard error amounted to 6.2% for / and 7.2% for (Table 2). The differences between the three tests were larger for < 0.5. The LW accumulation process is highly stochastic, leading to different log arrangements for the respective tests. With increasing and number of logs, the differences in log arrangement (i.e., blocking ratio) decreased and likewise the differences in the resulting backwater rise and bedload transport reduction factor. For the later analysis, the average of tests V1a–c (V1*) was used to compare the effects of wood characteristics on backwater rise and bedload transport continuity. For all tests, the trapping ratio of LW at the inclined bar screen was on average 89.6%, with a minimum of 59.2% for test V7 due to the small log sizes.
3.2. Large Wood Density
A photo series of resulting backwater rise and bedload deposition at the inclined bar screen is illustrated for test V1b with = 500 kg/m in Figure 4a,b and test V4 with = 900 kg/m in Figure 4c,d. We observed that with increasing and in particular for > 1000 kg/m, logs tend to be transported closer to the channel bottom. In contrast, logs with < 1000 kg/m were transported at the water surface (i.e., floating). This affected the blocking position of individual logs at the inclined bar screen as well as the possibility of dense logs being transported through the bottom clearance further downstream. The trapping ratio decreased with increasing and was 96% for = 500 kg/m (V1*) compared to 71% for = 1100 kg/m (V5).
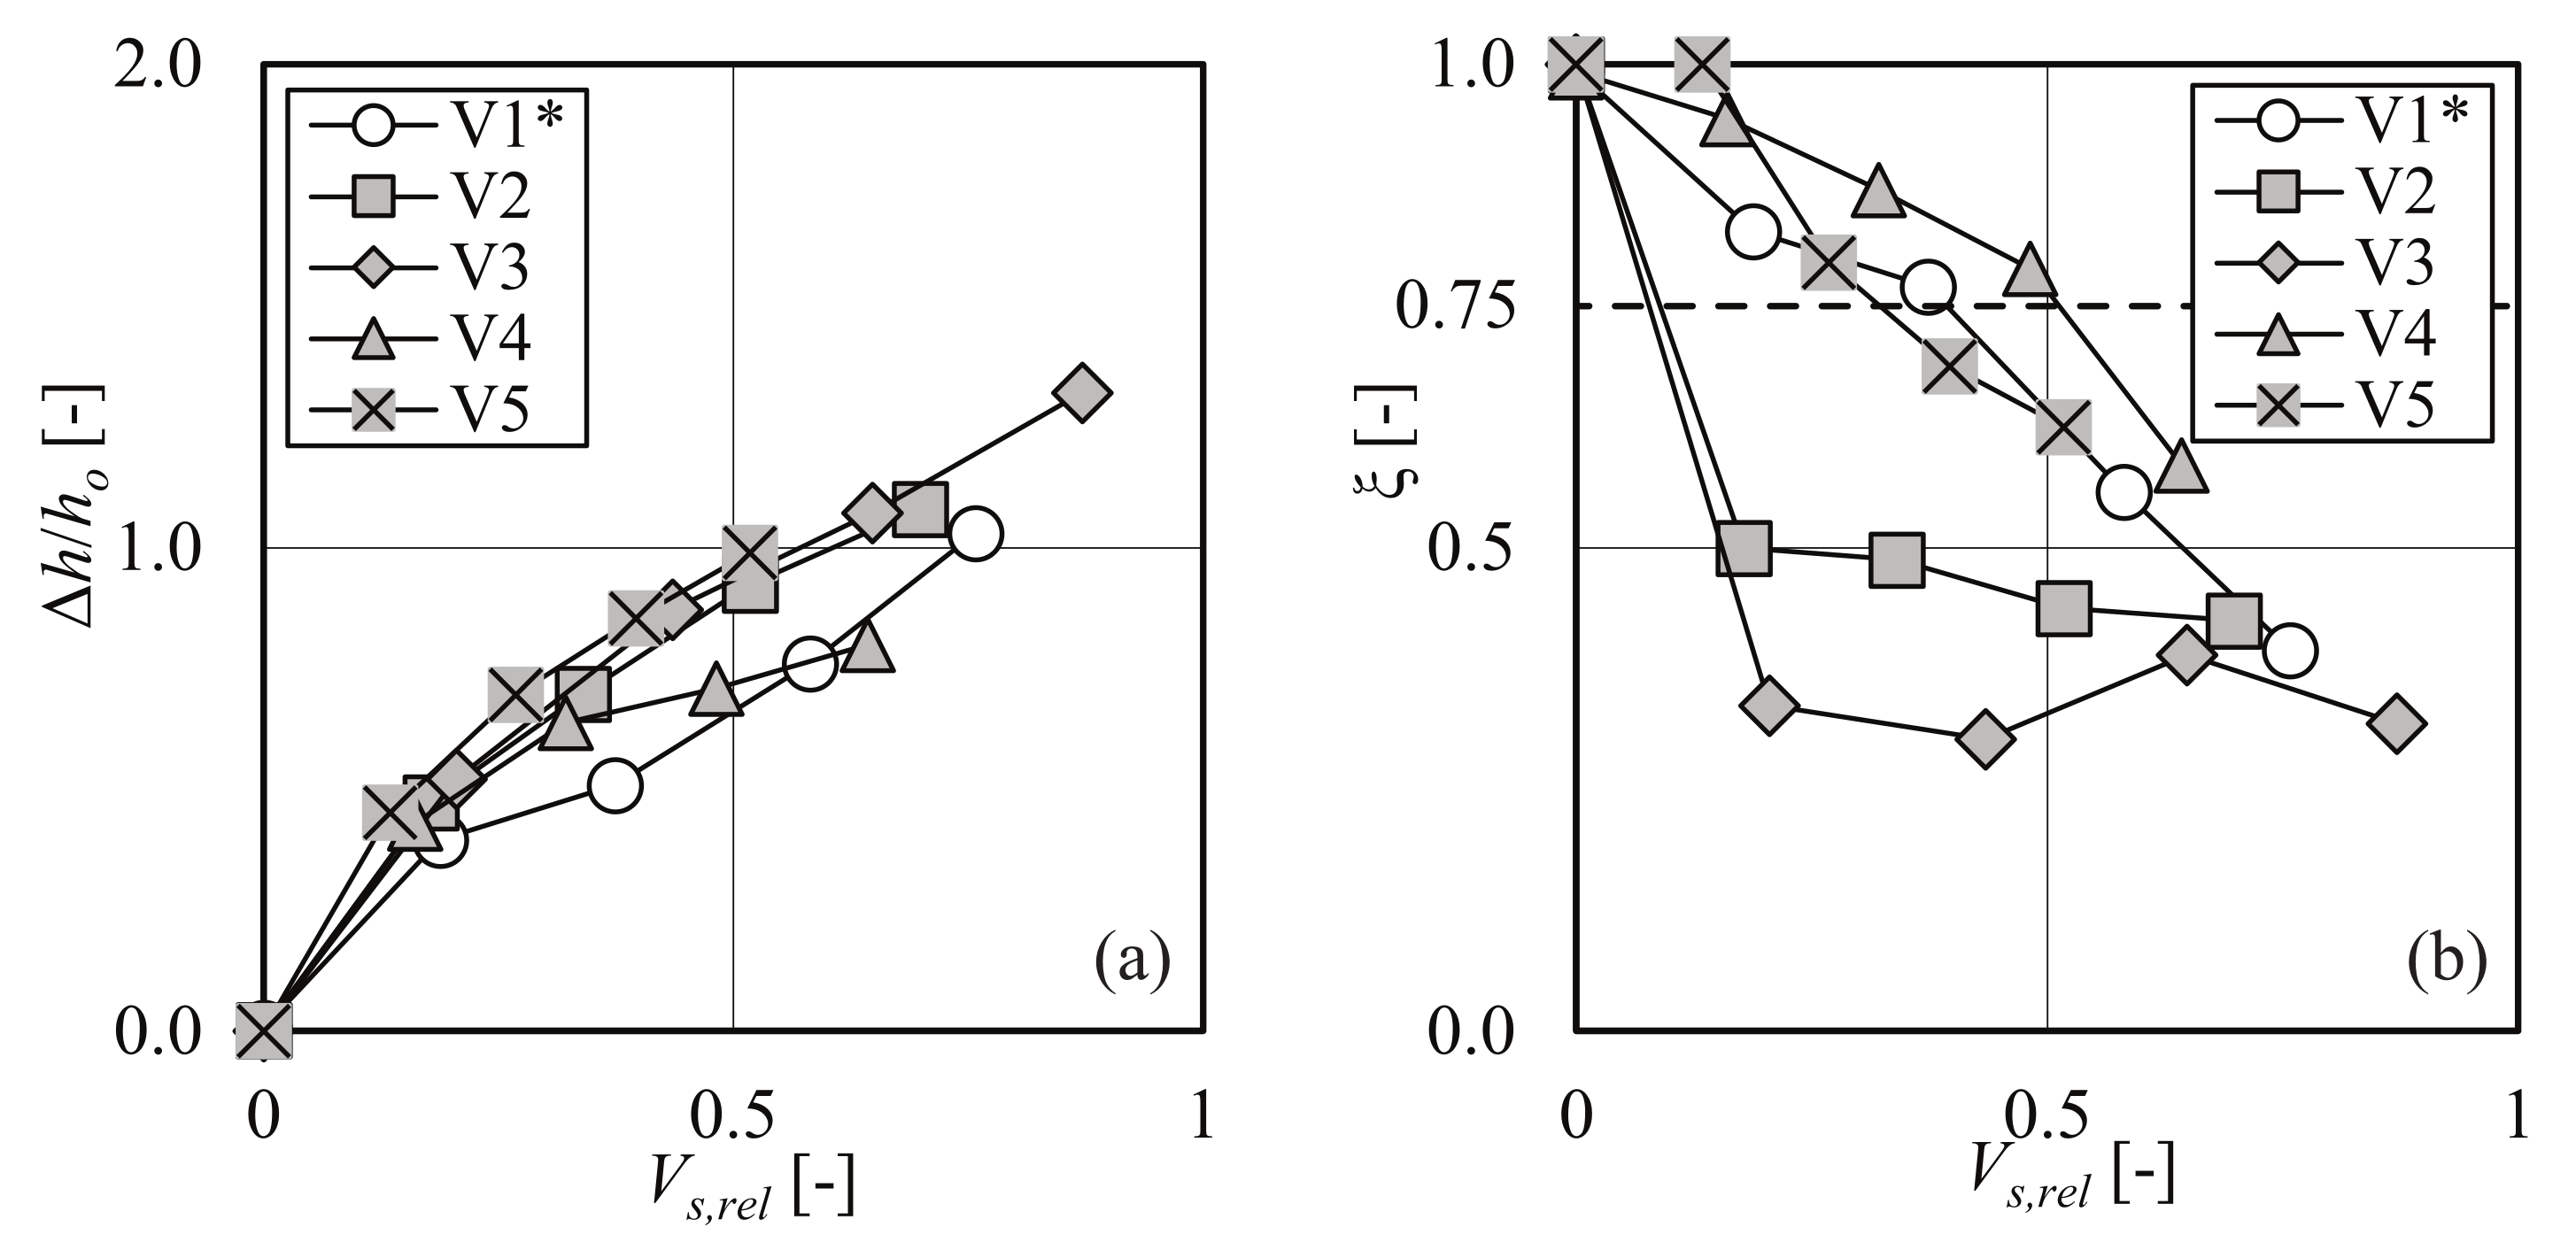
According to Figure 5a, relative backwater rise / increased with increasing relative solid LW volume . With increasing , the open flow cross section decreases, leading to a decrease in flow velocity and, thus, increase in resulting flow depth h. However, there was a negligible effect of on /, as the mean relative standard error amounted to 7.2% and is comparable to the mean relative standard error of the reproducibility tests (6.2%) and no systematic trend was detected. The LW accumulation at the rack and the resulting increase in / will also have implications on the bedload transport capacity. With increasing /, the respective flow velocity and non-dimensional bed shear stress are reduced. Given < , bedload will deposit upstream of the inclined bar screen (Figure 4). As soon as the first LW package was retained at the inclined bar screen, the formation of a bedload deposition was observed. Initially, the bedload deposition was formed upstream of the inclined bar screen and evolved in the upstream direction in a succession of quasi-equilibrium states [31,32]. The change in bottom slope may also affect the flow conditions, and further enhance bedload deposition and reduce bedload transport downstream. Depending on the extent, bedload transport continuity will be significantly reduced and the bedload transport reduction factor will fall below the threshold value < (herein defined as = 0.75). Similar to the results for /, no systematic trend of the effect of on can be deduced based on Figure 5b. Given logs with = 700 and 800 kg/m (V2 and V3), was reduced to 0.55 and 0.34, respectively, after the addition of = 0.18 and = 0.21, respectively. The variation in in Figure 5b resulted due to the differences in log arrangement at the inclined bar screen and the stochastic LW accumulation process. For all tests, < after the addition of > 0.50, corresponding to ≈150 g of LW (model scale). The results for the tests with varying confirmed our first hypothesis (H1) that LW retention at the inclined bar screen affects the behaviour of the structure by triggering backwater rise and leading to bedload retention. The second hypothesis (H2) was not confirmed as the effect of on both backwater rise and bedload retention was negligible.
3.3. Large Wood Size
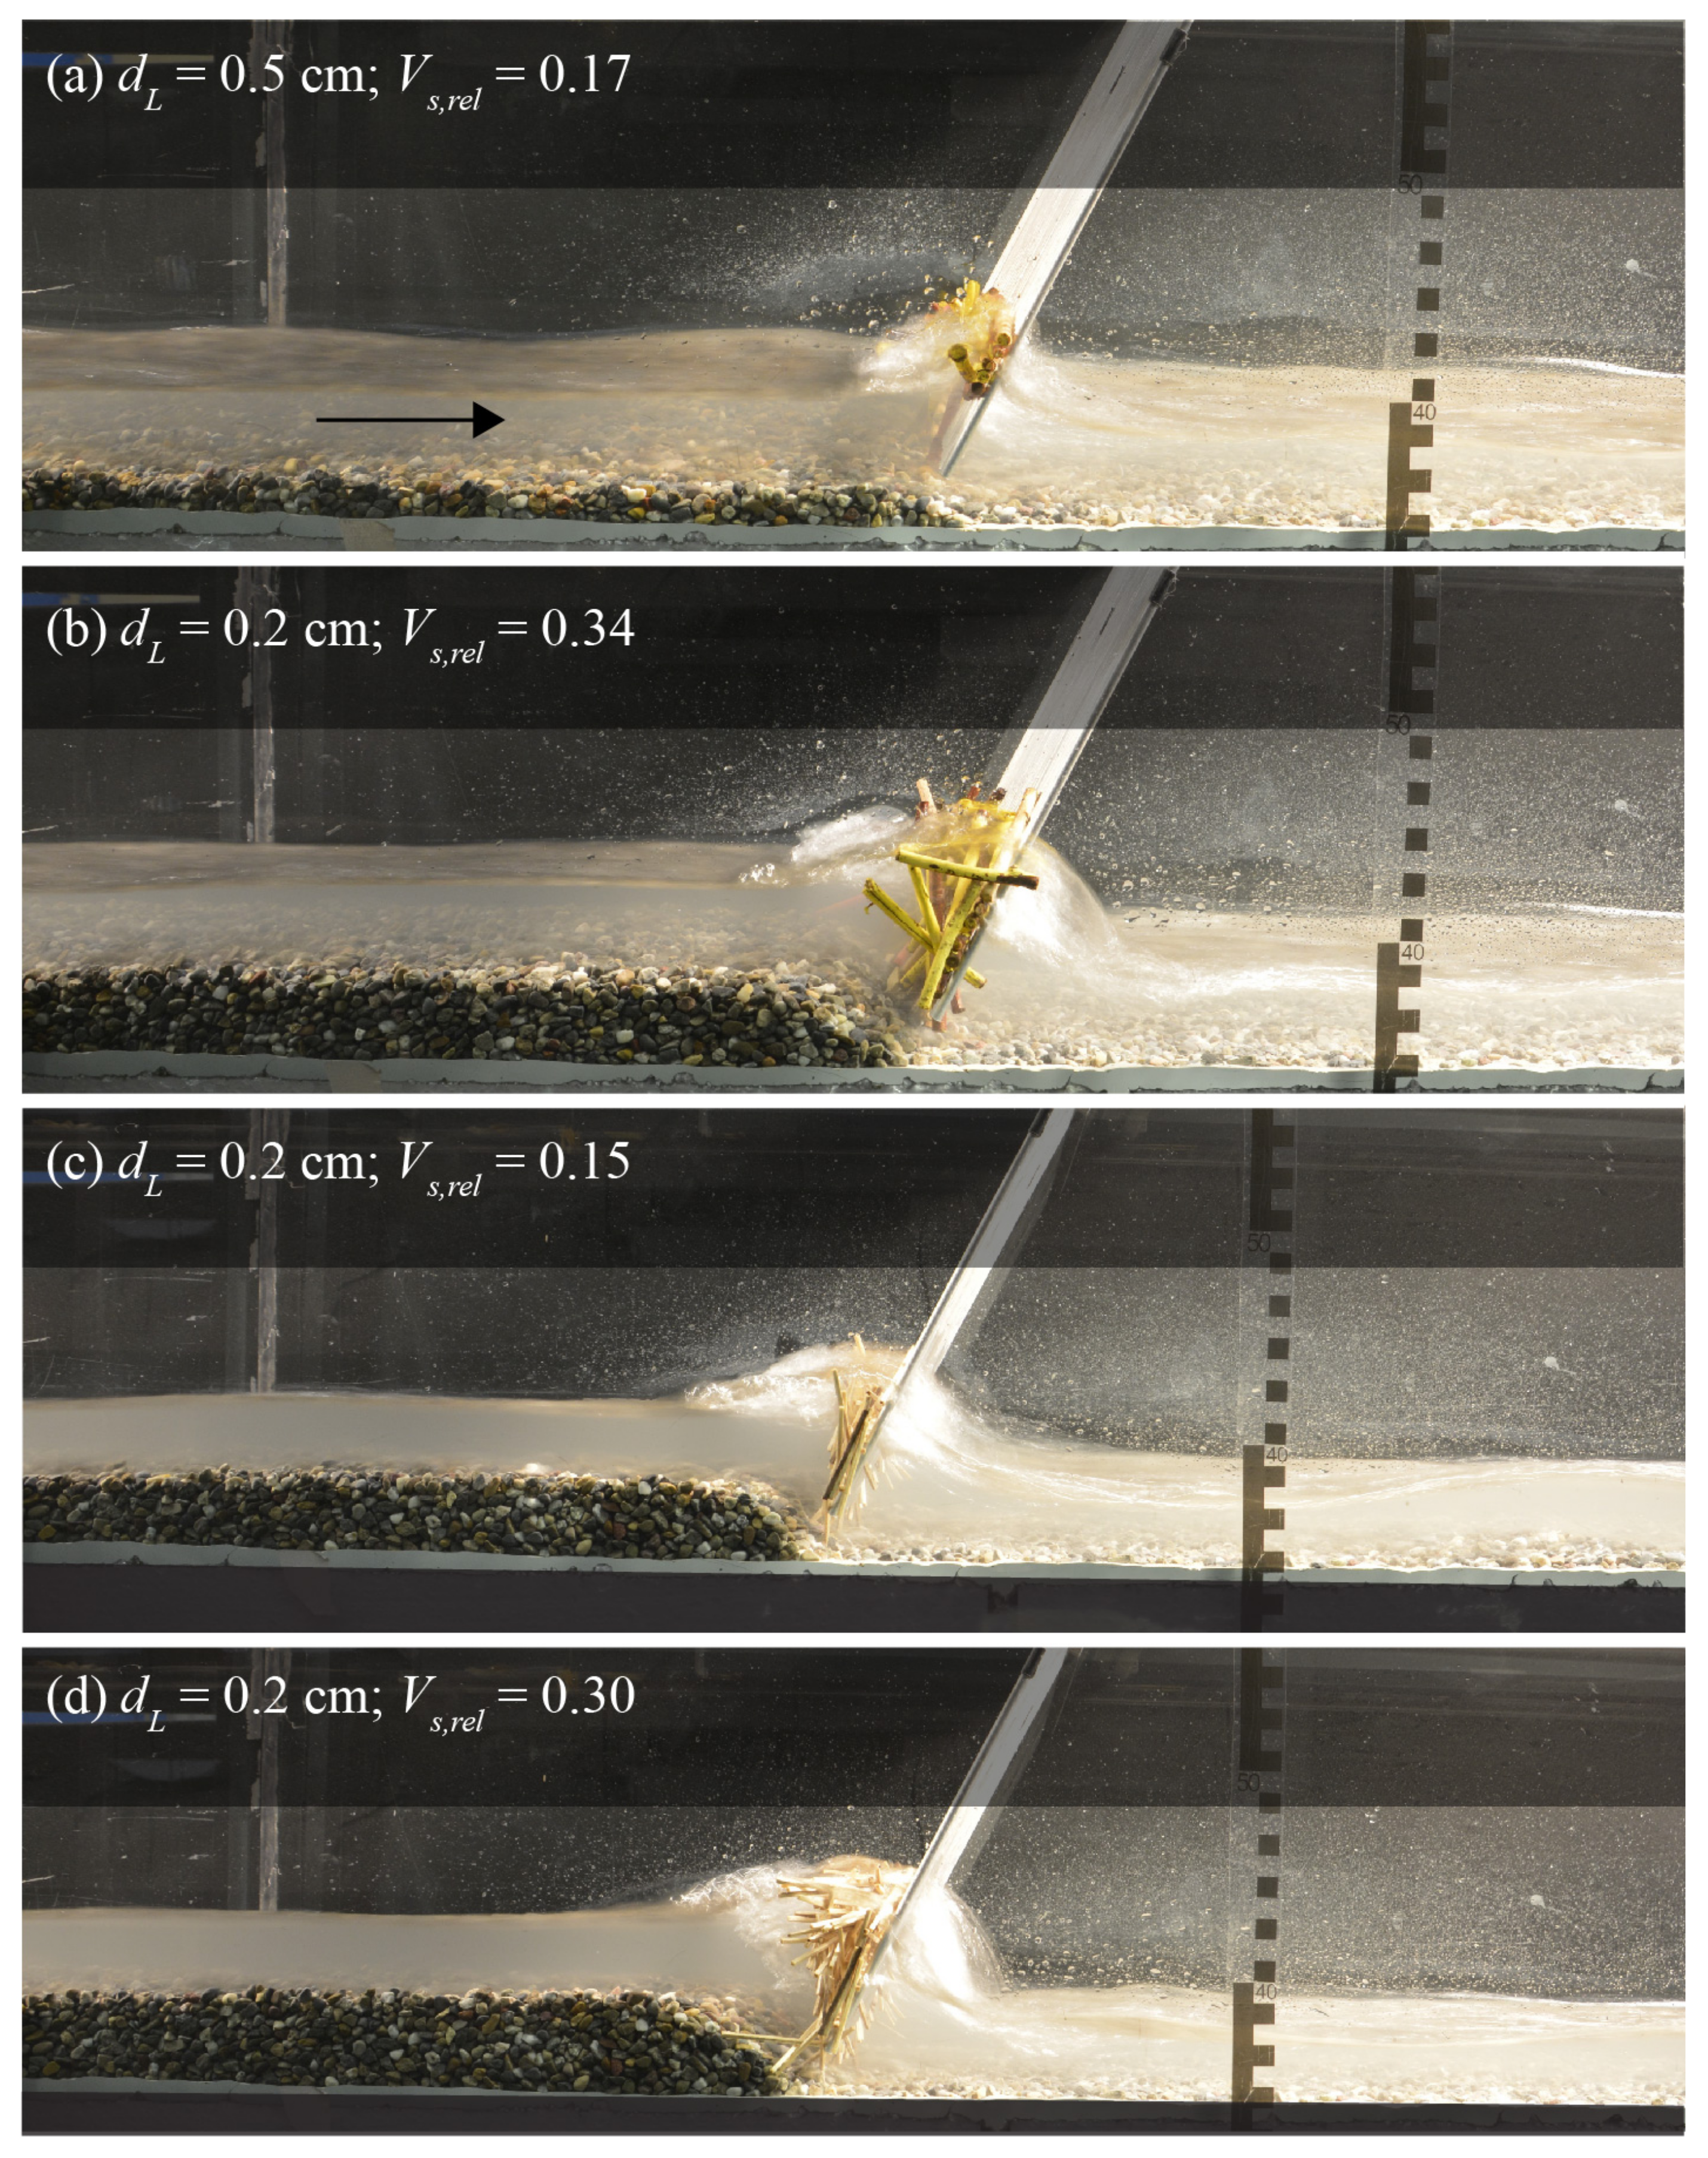
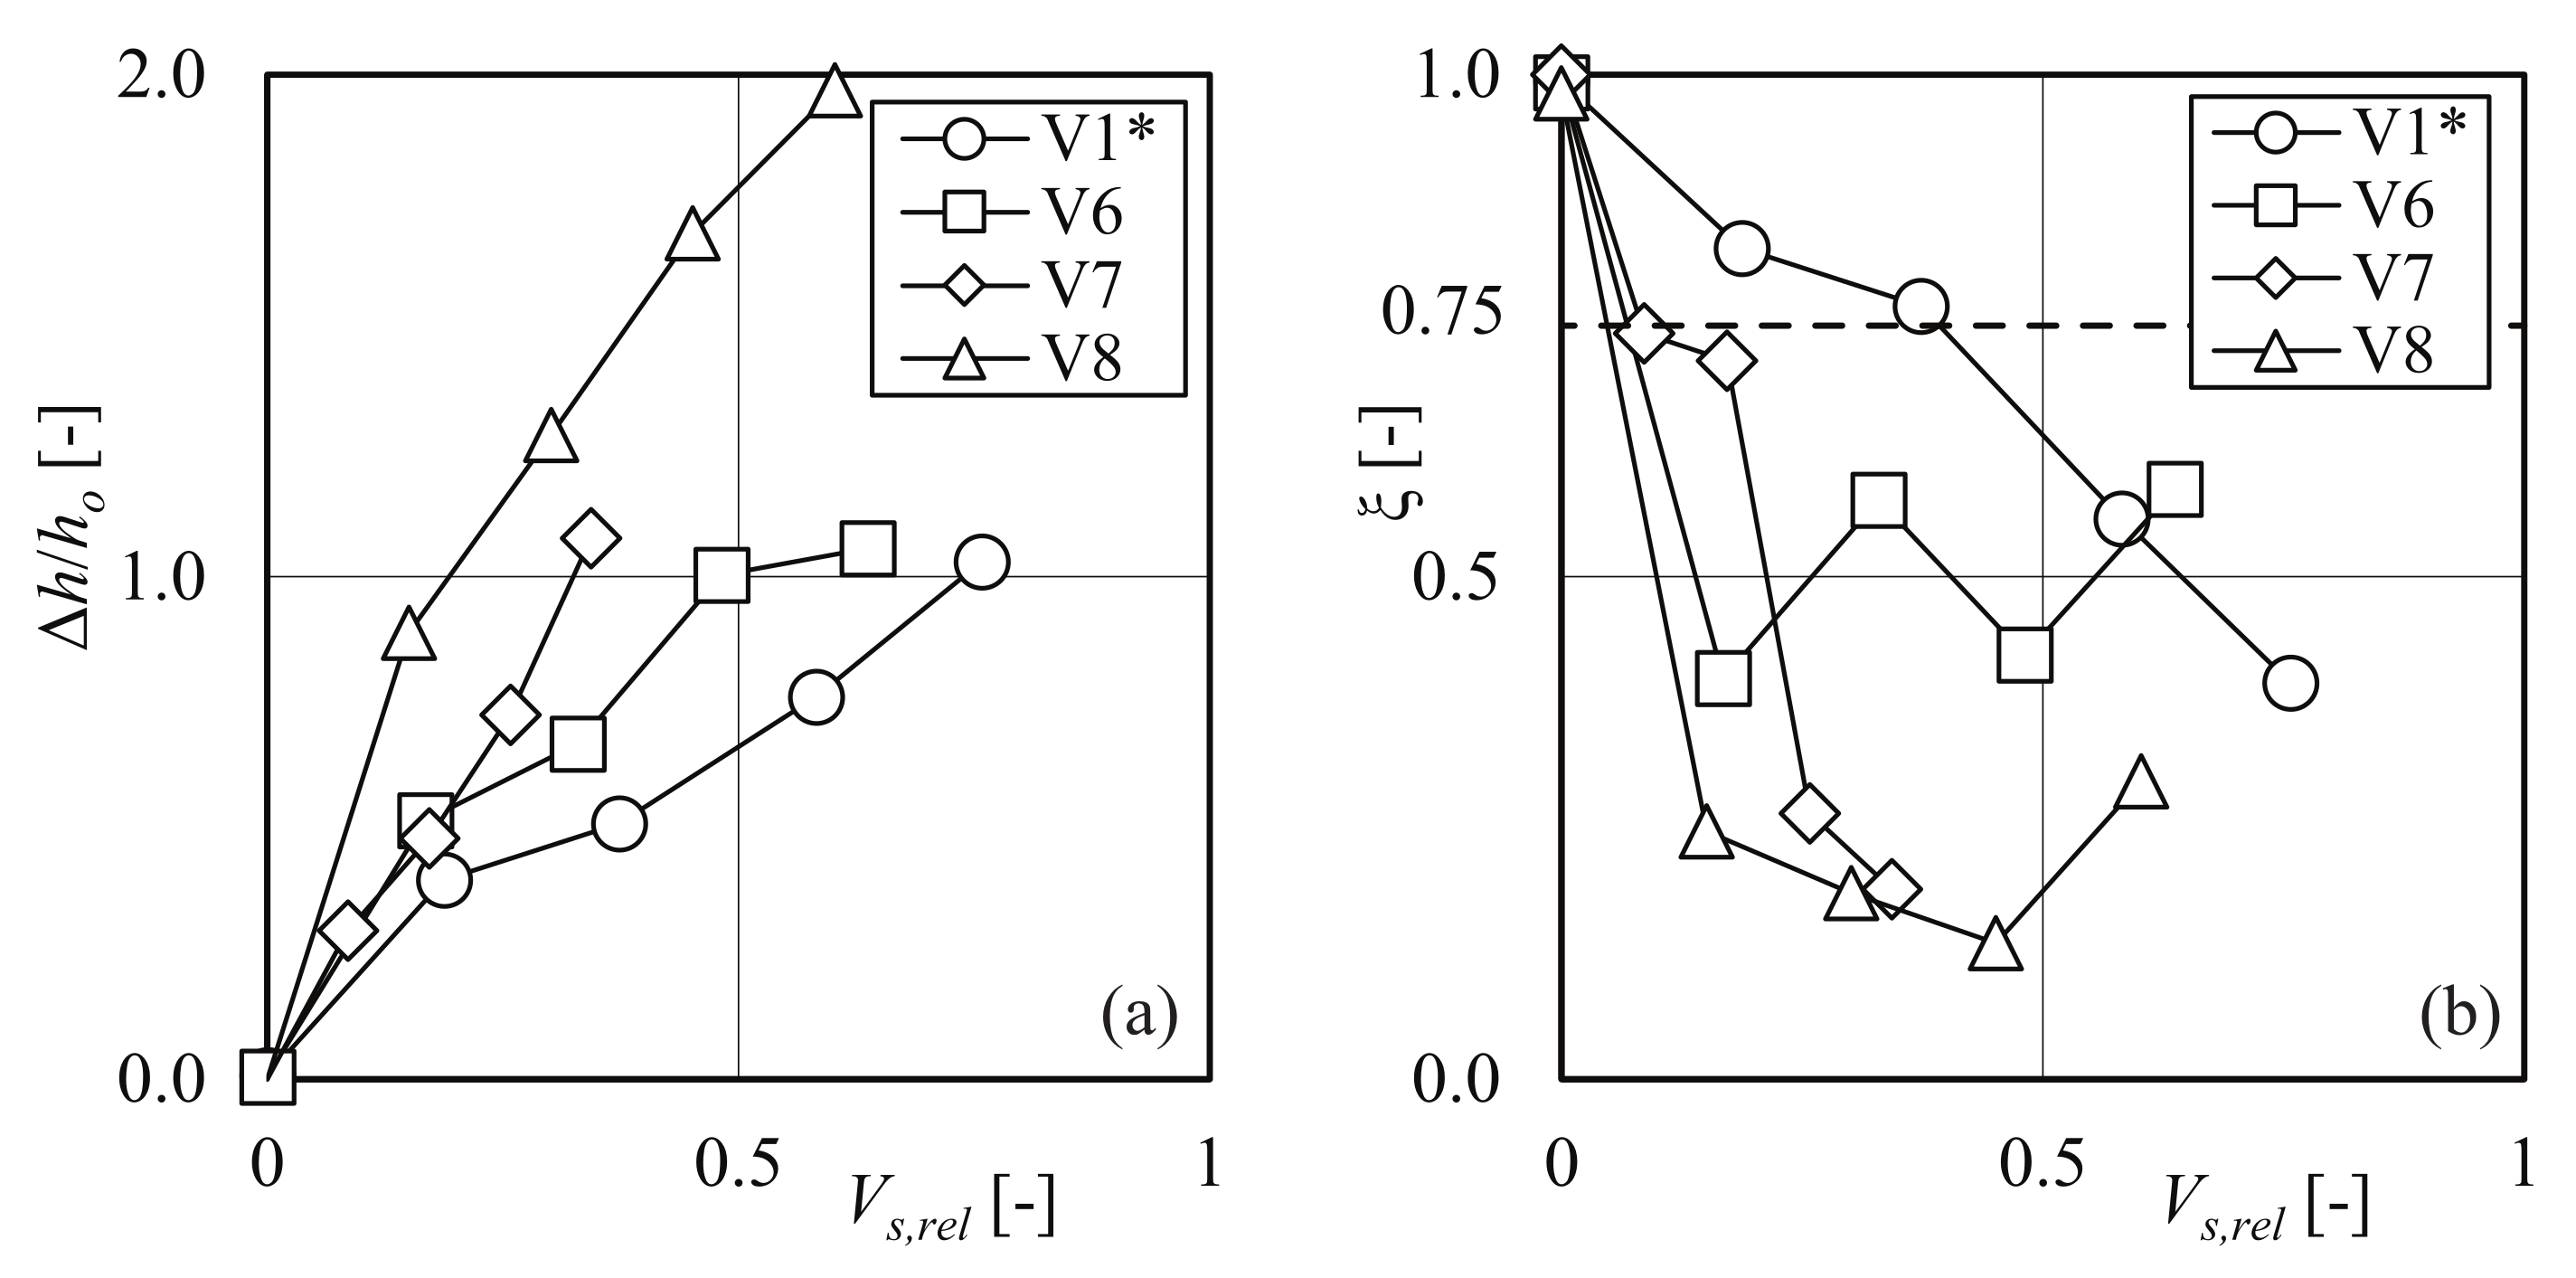
Figure 6 shows a photo series of resulting backwater rise and bedload deposition at the inclined bar screen for test V7 with = 0.5 cm (Figure 6a,b) compared to test V8 with = 0.2 cm (Figure 6c,d). Similar to previous studies on backwater rise due to LW accumulations at rack structures, / increased with decreasing LW size. Due to smaller , the flow within an accumulation is more heterogeneous, leading to increased friction losses and increased / [26,28]. Given = 0.5, / increased by a factor of ≈2.7 for smaller wood dimensions ( = 0.2 cm and = 5 cm; V8) compared to the reference test ( = 1 cm and = 15 cm; V1*) (Figure 7a). The increase in / led to a reduction in bedload transport, and decreased with increasing and decreasing LW size (Figure 7b). After the addition of the first LW package ( ≈ 0.15), bedload transport was significantly reduced to = 0.25 for the smallest tested wood size (V8) compared to = 0.85 for the reference test (V1*) (Figure 7b).
For all tests, decreased below = 0.75 for > 0.38. Due to the decrease in , bedload deposited upstream of the rack and the bedload deposition increased with increasing and decreasing LW size (i.e., with increasing /) (Figure 6). As observed for the tests with varying LW density, the bedload deposition upstream of the rack was extending further upstream with increasing . According to Figure 7b, the effect of LW accumulation on bedload transport was not linear and different for the tested LW sizes. During the experiments, we noted that the log position can shift, thereby affecting the open flow cross section and also the resulting bedload transport. The results of tests V6 and V8 further show that increased for > 0.50 due to partial self-flushing of the bedload deposition upstream of the inclined bar screen. The self-flushing may be initiated due to the changes in log position at the bar screen or due to the increasing slope of the bedload deposition upstream of the bar screen. The experimental results for tests with different LW size confirmed both the first and second hypotheses (H1 and H2), as the LW size had a governing effect on backwater rise and bedload transport continuity.
3.4. Model Fine Material
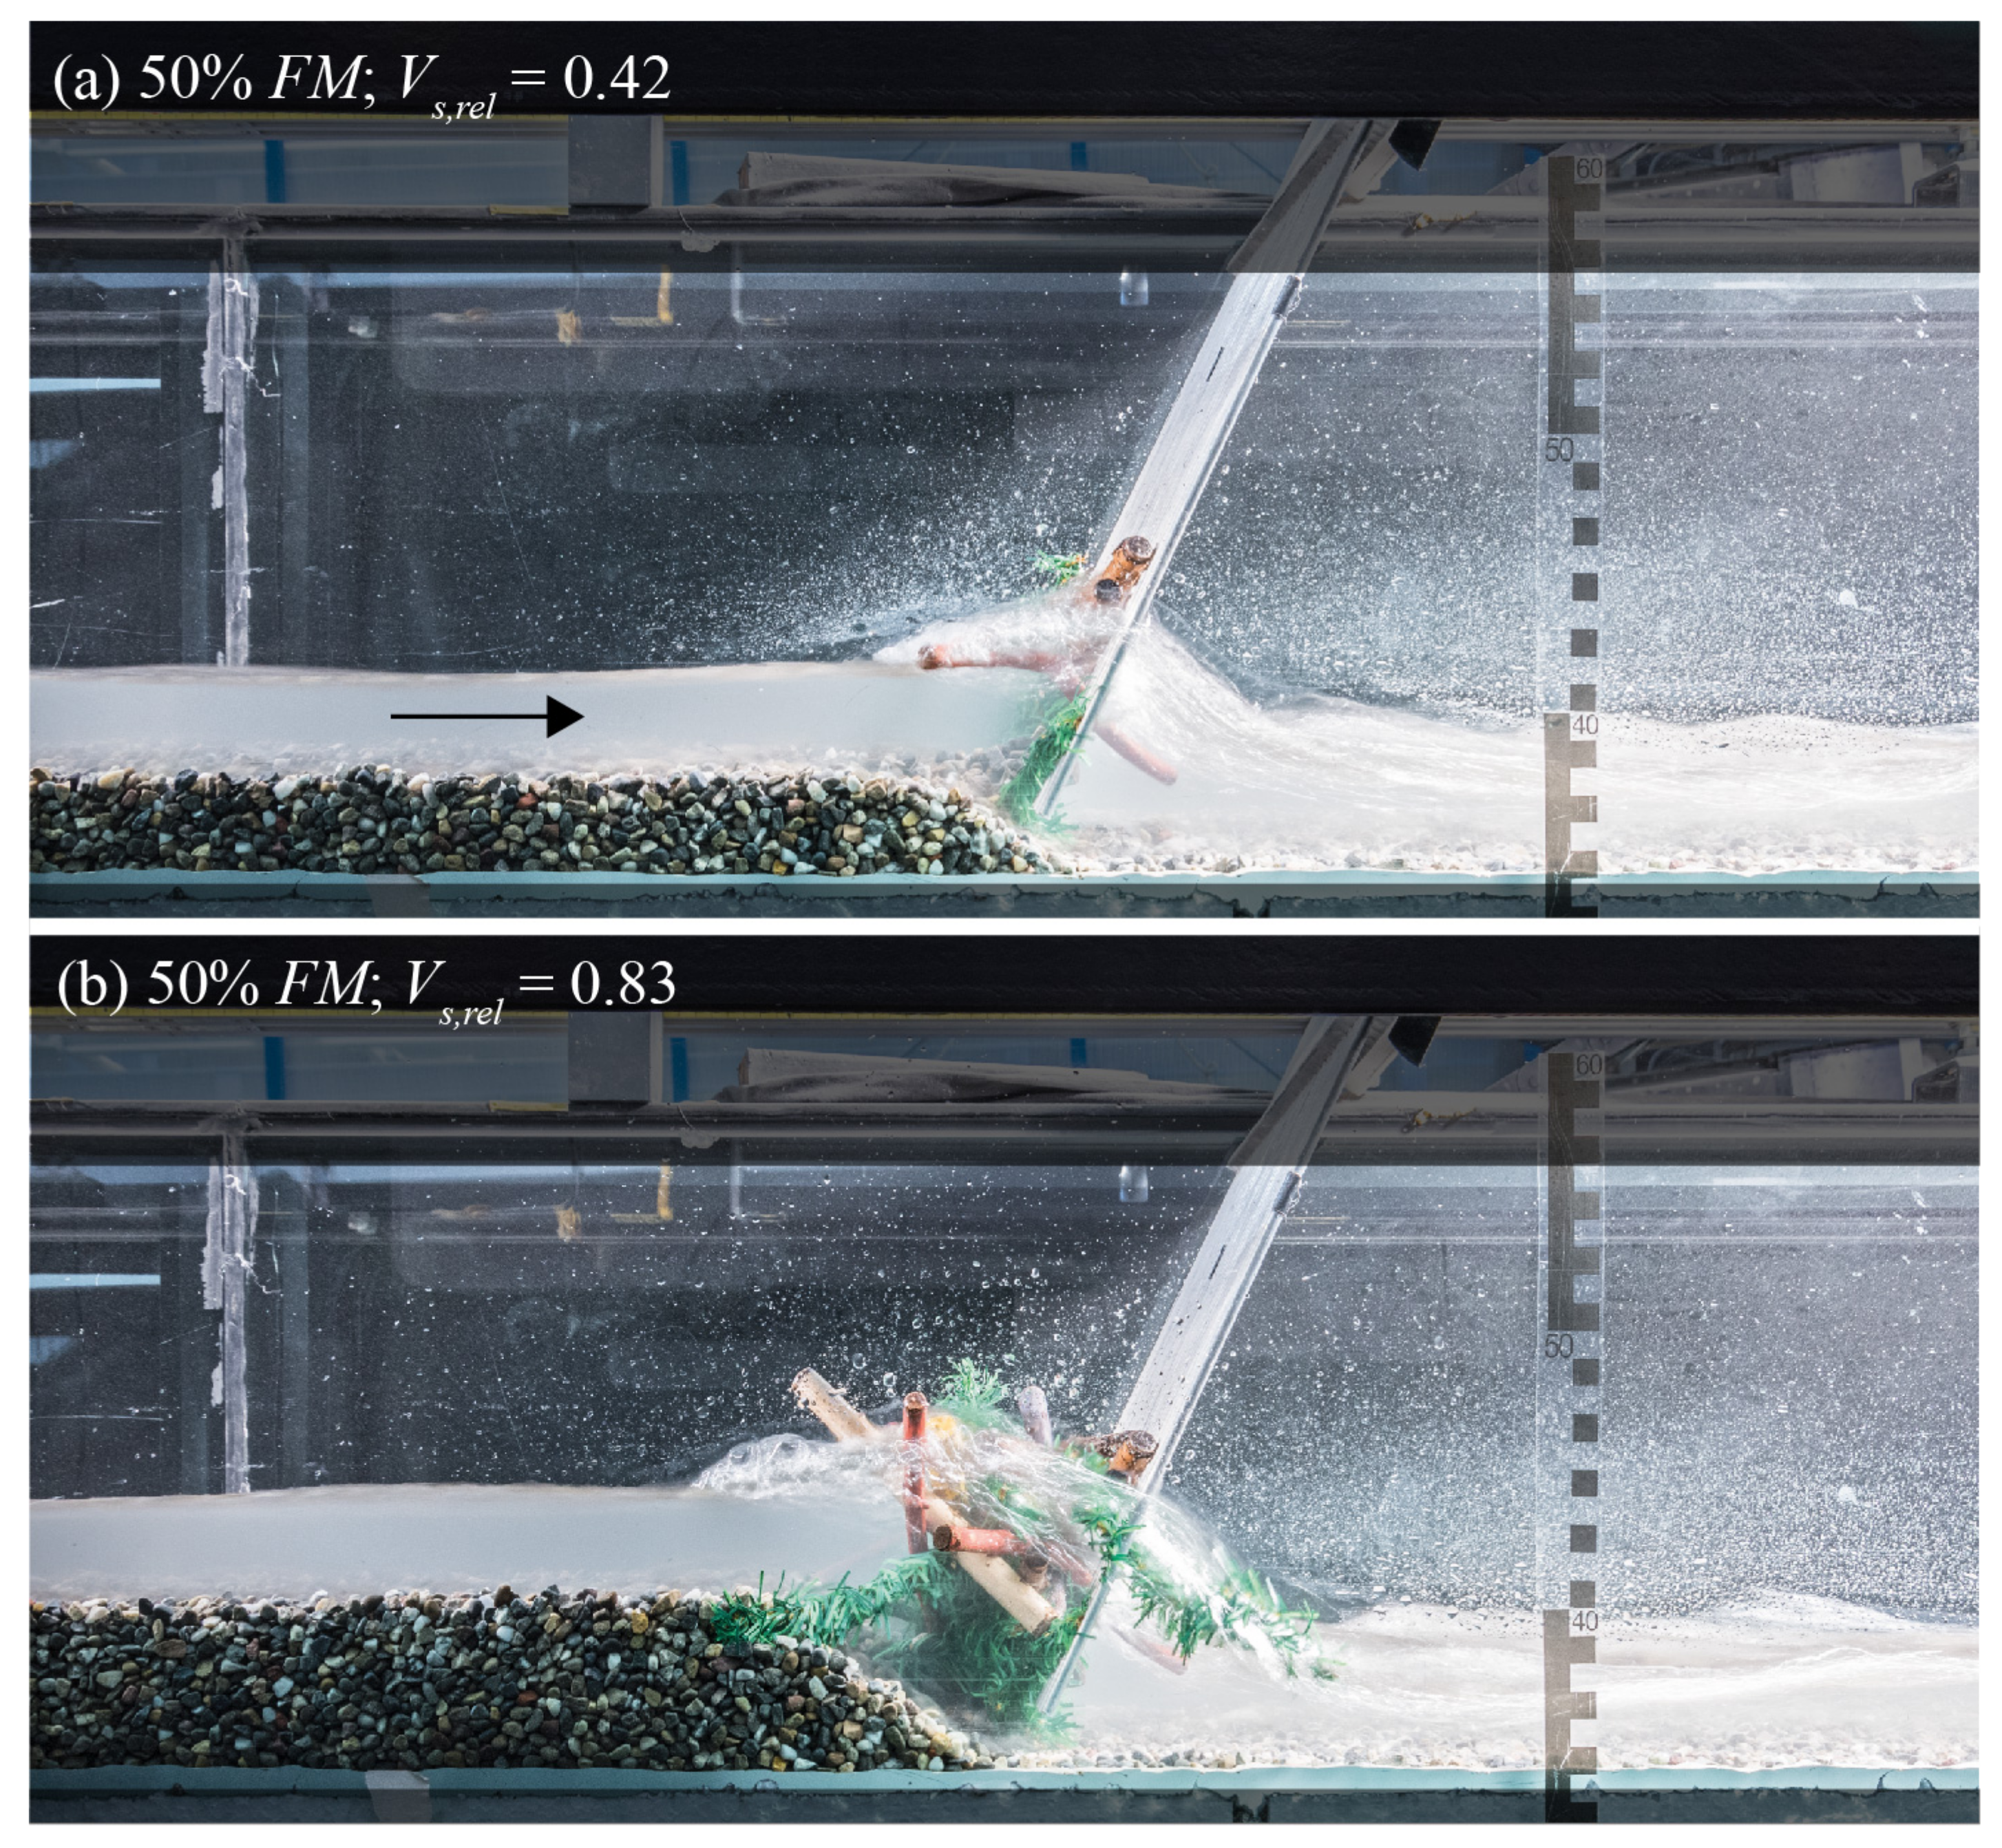
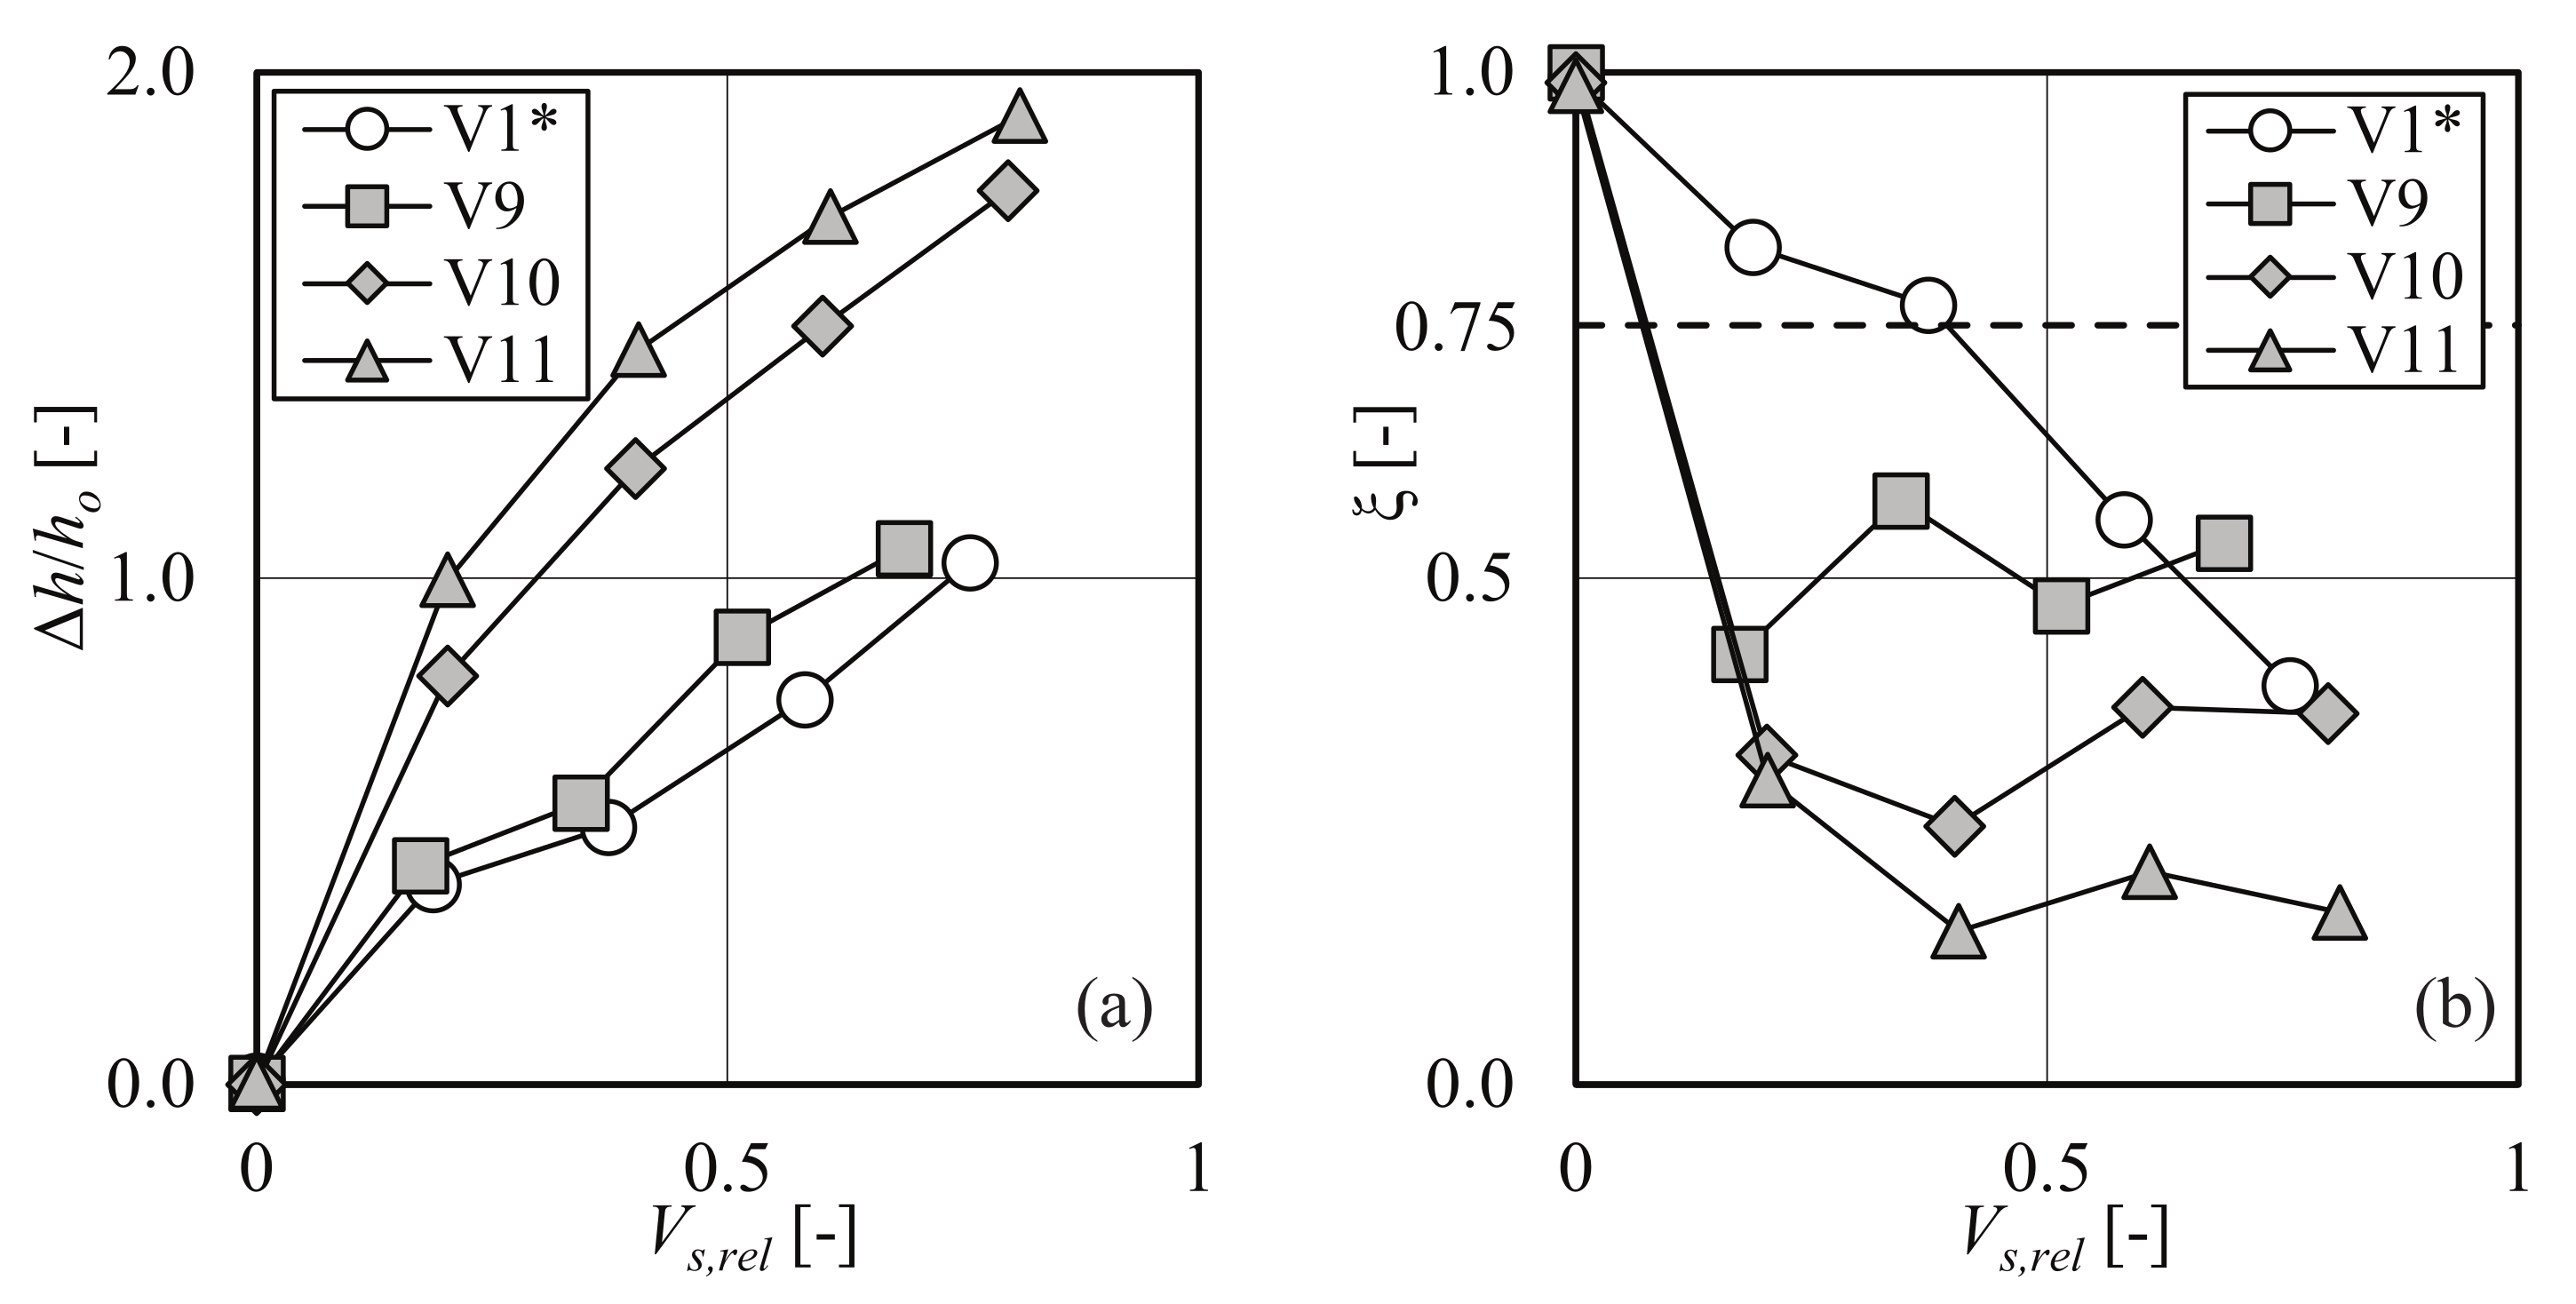
The presence of fine material () such as fir branches and leaves in the LW accumulation significantly affected both backwater rise and bedload transport continuity (Figure 8 and Figure 9). Previous studies [26,27,28] demonstrated that in an accumulation lead to a more heterogeneous flow within the accumulation, increased friction losses, and, thus, increased backwater rise (Figure 9a). To show the effect of , the volume was determined with the logs only.
The addition of 30% and 50% increased / by a factor of 1.9 and 2.3, respectively, compared to the reference test without (V1*) for ≈ 0.2. By conducting flume experiments with bedload supply, we noted that significantly decreased bedload transport (Figure 9b). If we compare for ≈ 0.5, bedload transport capacity is reduced to = 0.18 for 50% (V11), = 0.30 for 30% (V10), and = 0.47 for 10% (V8) compared to = 0.65 without (V1*) (Figure 9b). The resulting decrease in bedload transport capacity leads to bedload deposition upstream of the rack, as illustrated in Figure 8. Based on the results according to Figure 9b, significantly affects bedload transport capacity and, thus, the functionality of the inclined bar screen to enable bedload transport in the presence of LW. The results, therefore, confirmed the first and third hypotheses (H1 and H3), as the consideration of in a LW accumulation had a governing effect on backwater rise and bedload retention.
3.5. Large Wood Shape
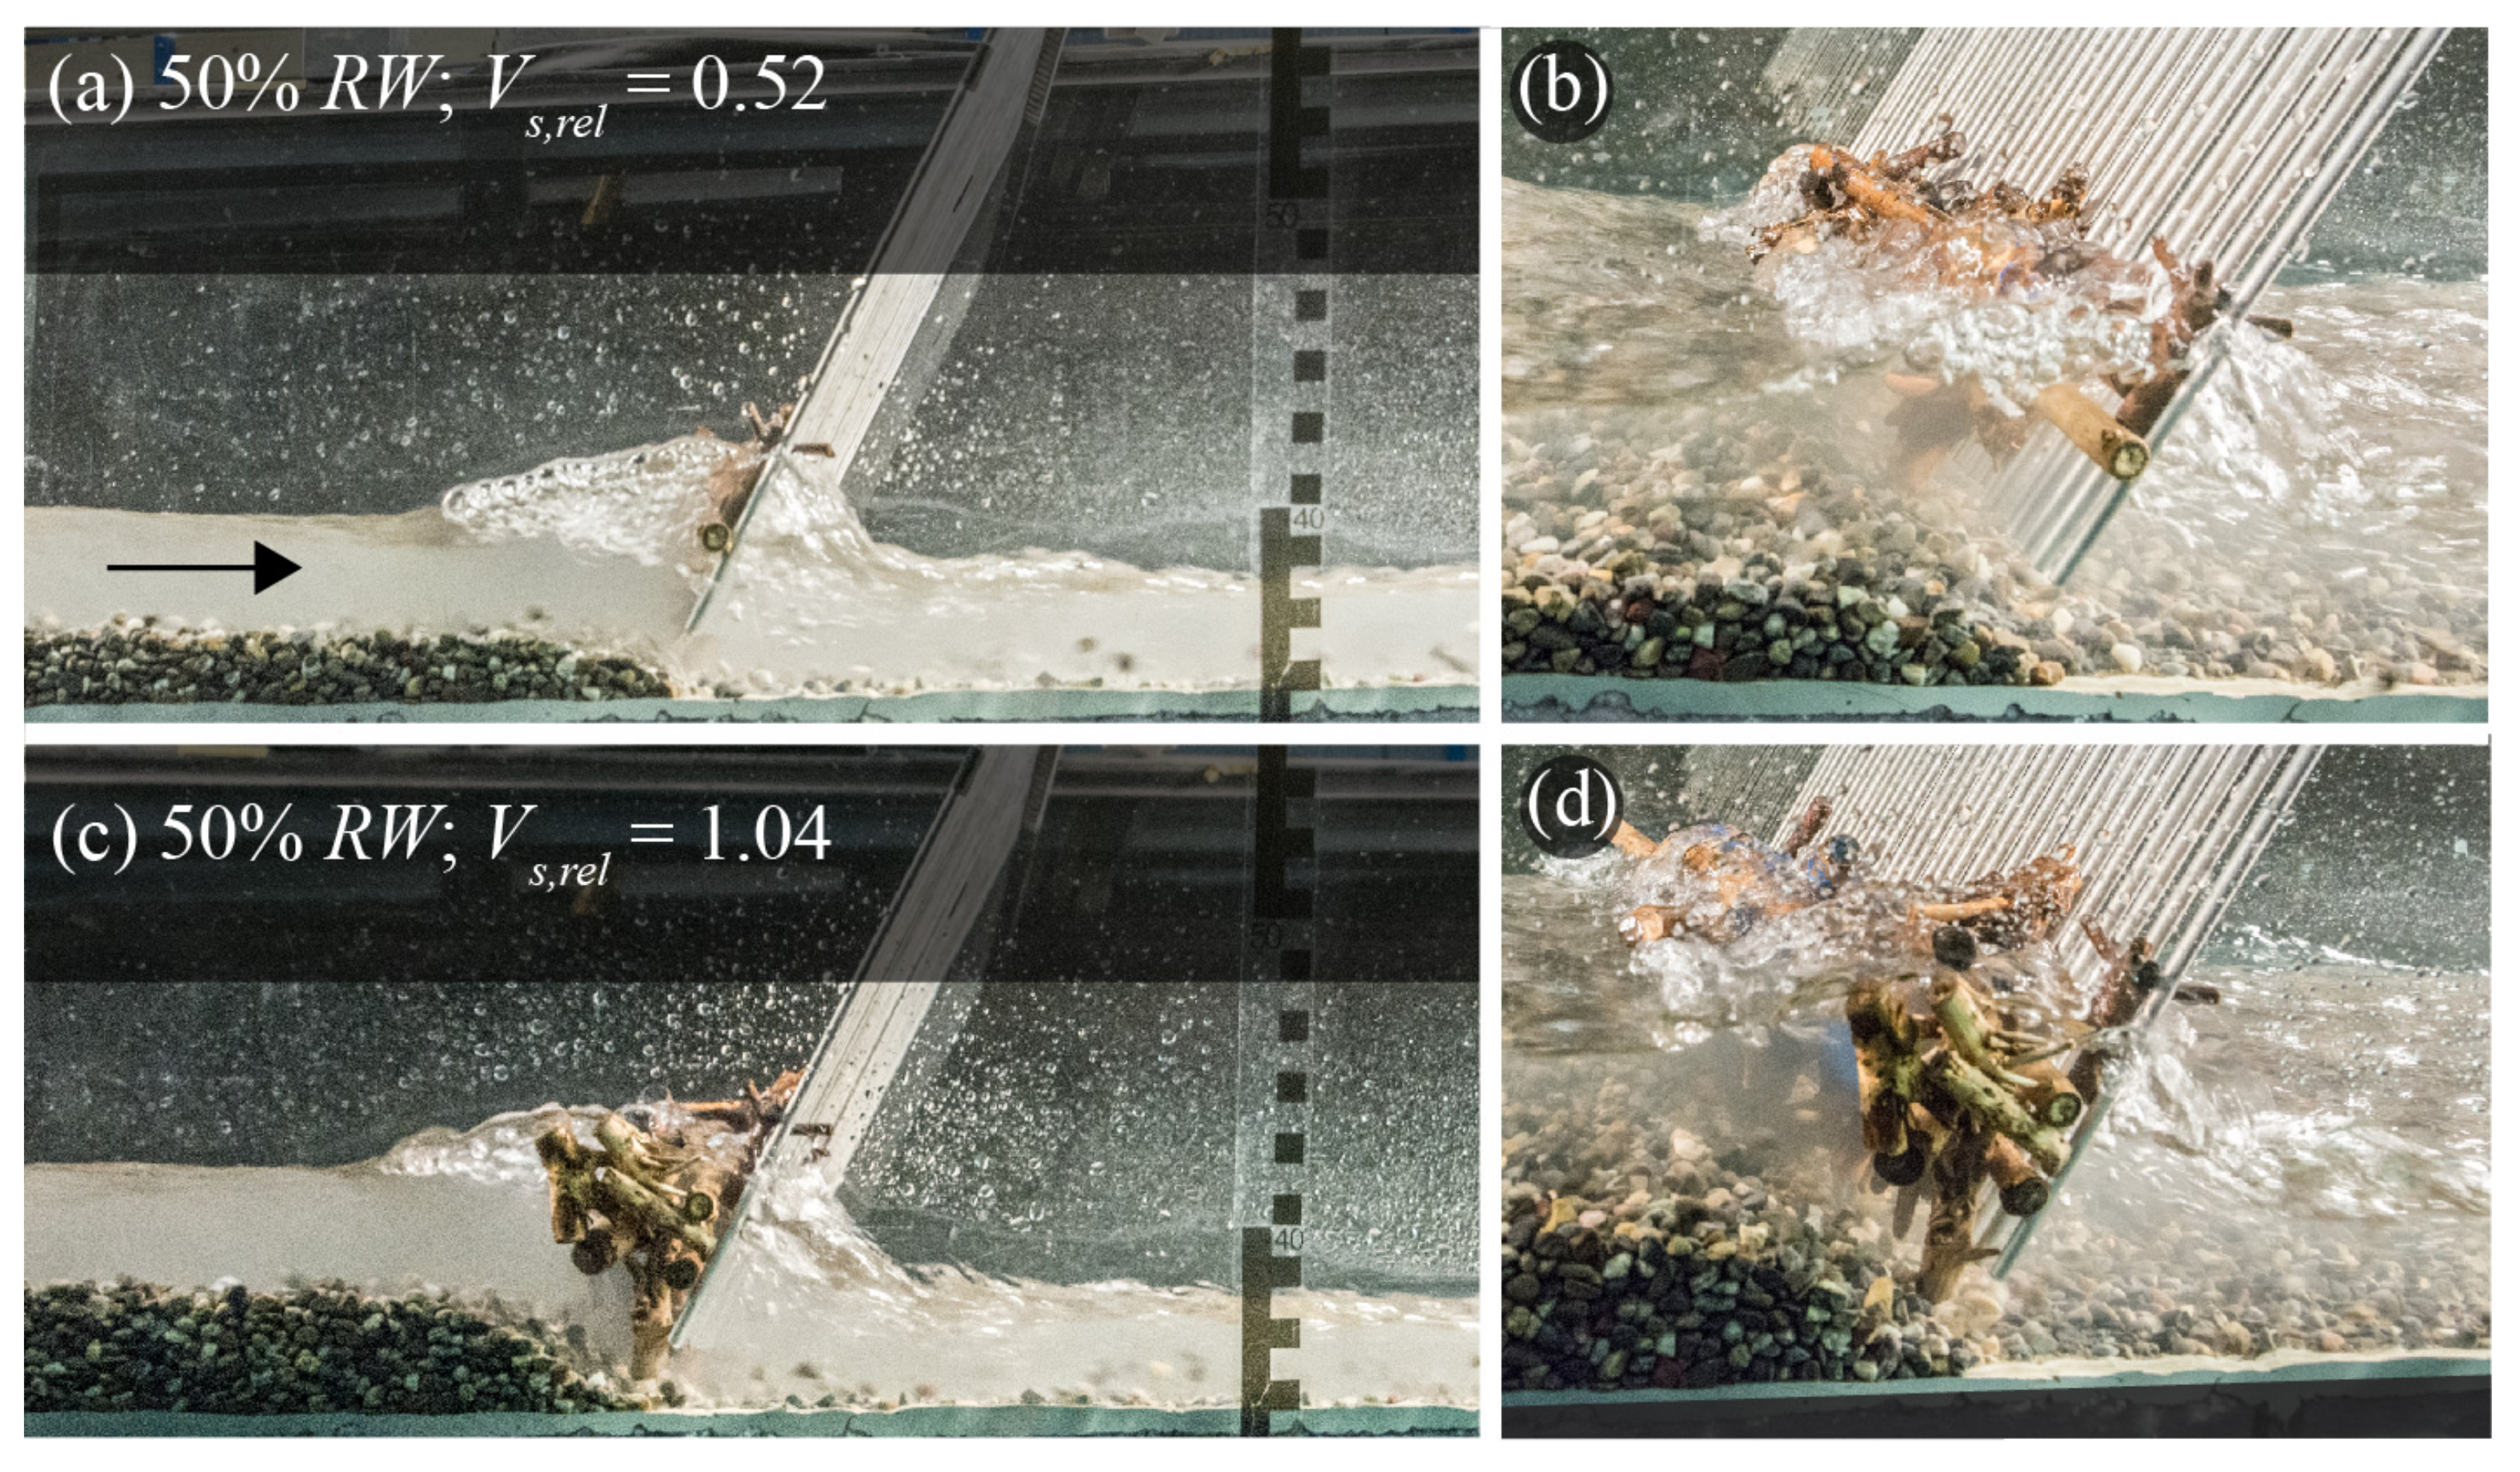
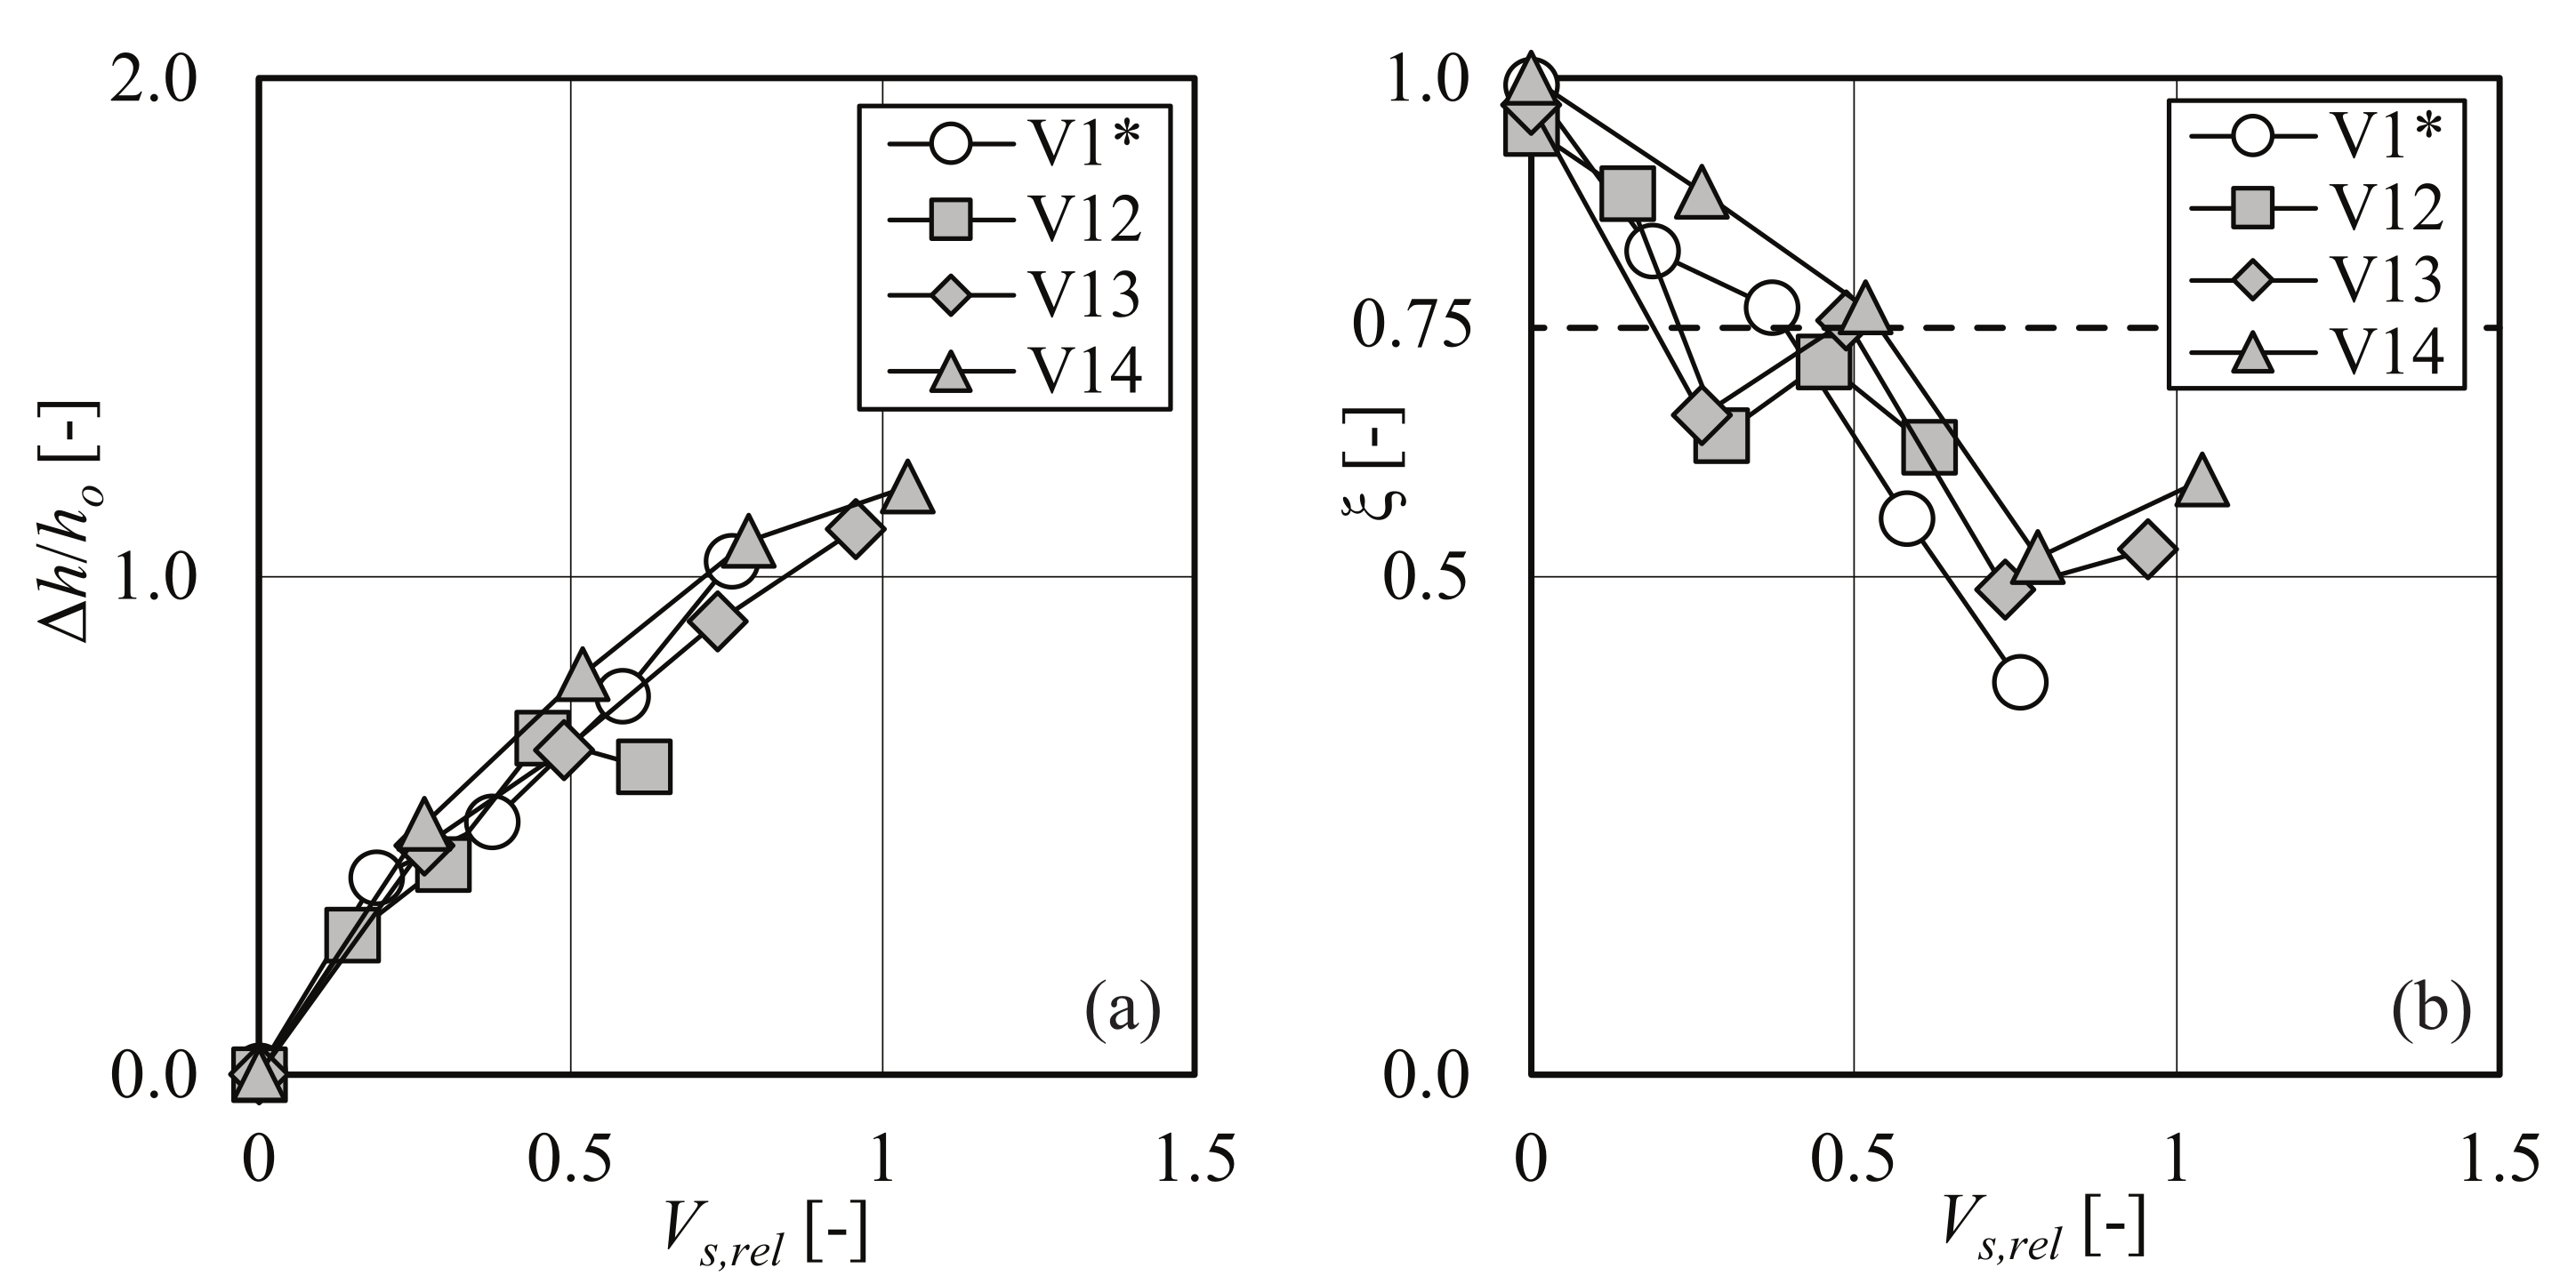
For selected tests, the accumulation and resulting bedload deposition was investigated for different LW shapes including logs with branches and rootwads (Figure 10). In the prototype, especially freshly recruited wood may still include rootwads and branches. In contrast to LW size such as log length and diameter, the shape of LW did not have a governing effect on backwater rise and bedload transport capacity (Figure 11). In addition, the differences in both / and are minimal for test V13 with 25% compared to test V14 with 50% . According to Figure 11b, decreased below = 0.75 for > 0.50. The results of tests V13 and V14 further show that increased for > 0.75 due to partial self-flushing of the bedload deposition upstream of the inclined bar screen, as also observed for tests V6 and V8. To improve the process understanding of self-flushing, continuous monitoring of the bedload transport rate is required. The results for the tests with varying LW shape also confirmed the first hypothesis (H1), while the second hypothesis (H2) was not confirmed as the effect of LW shape on both backwater rise and bedload retention was negligible.
3.6. Sequenced Floods
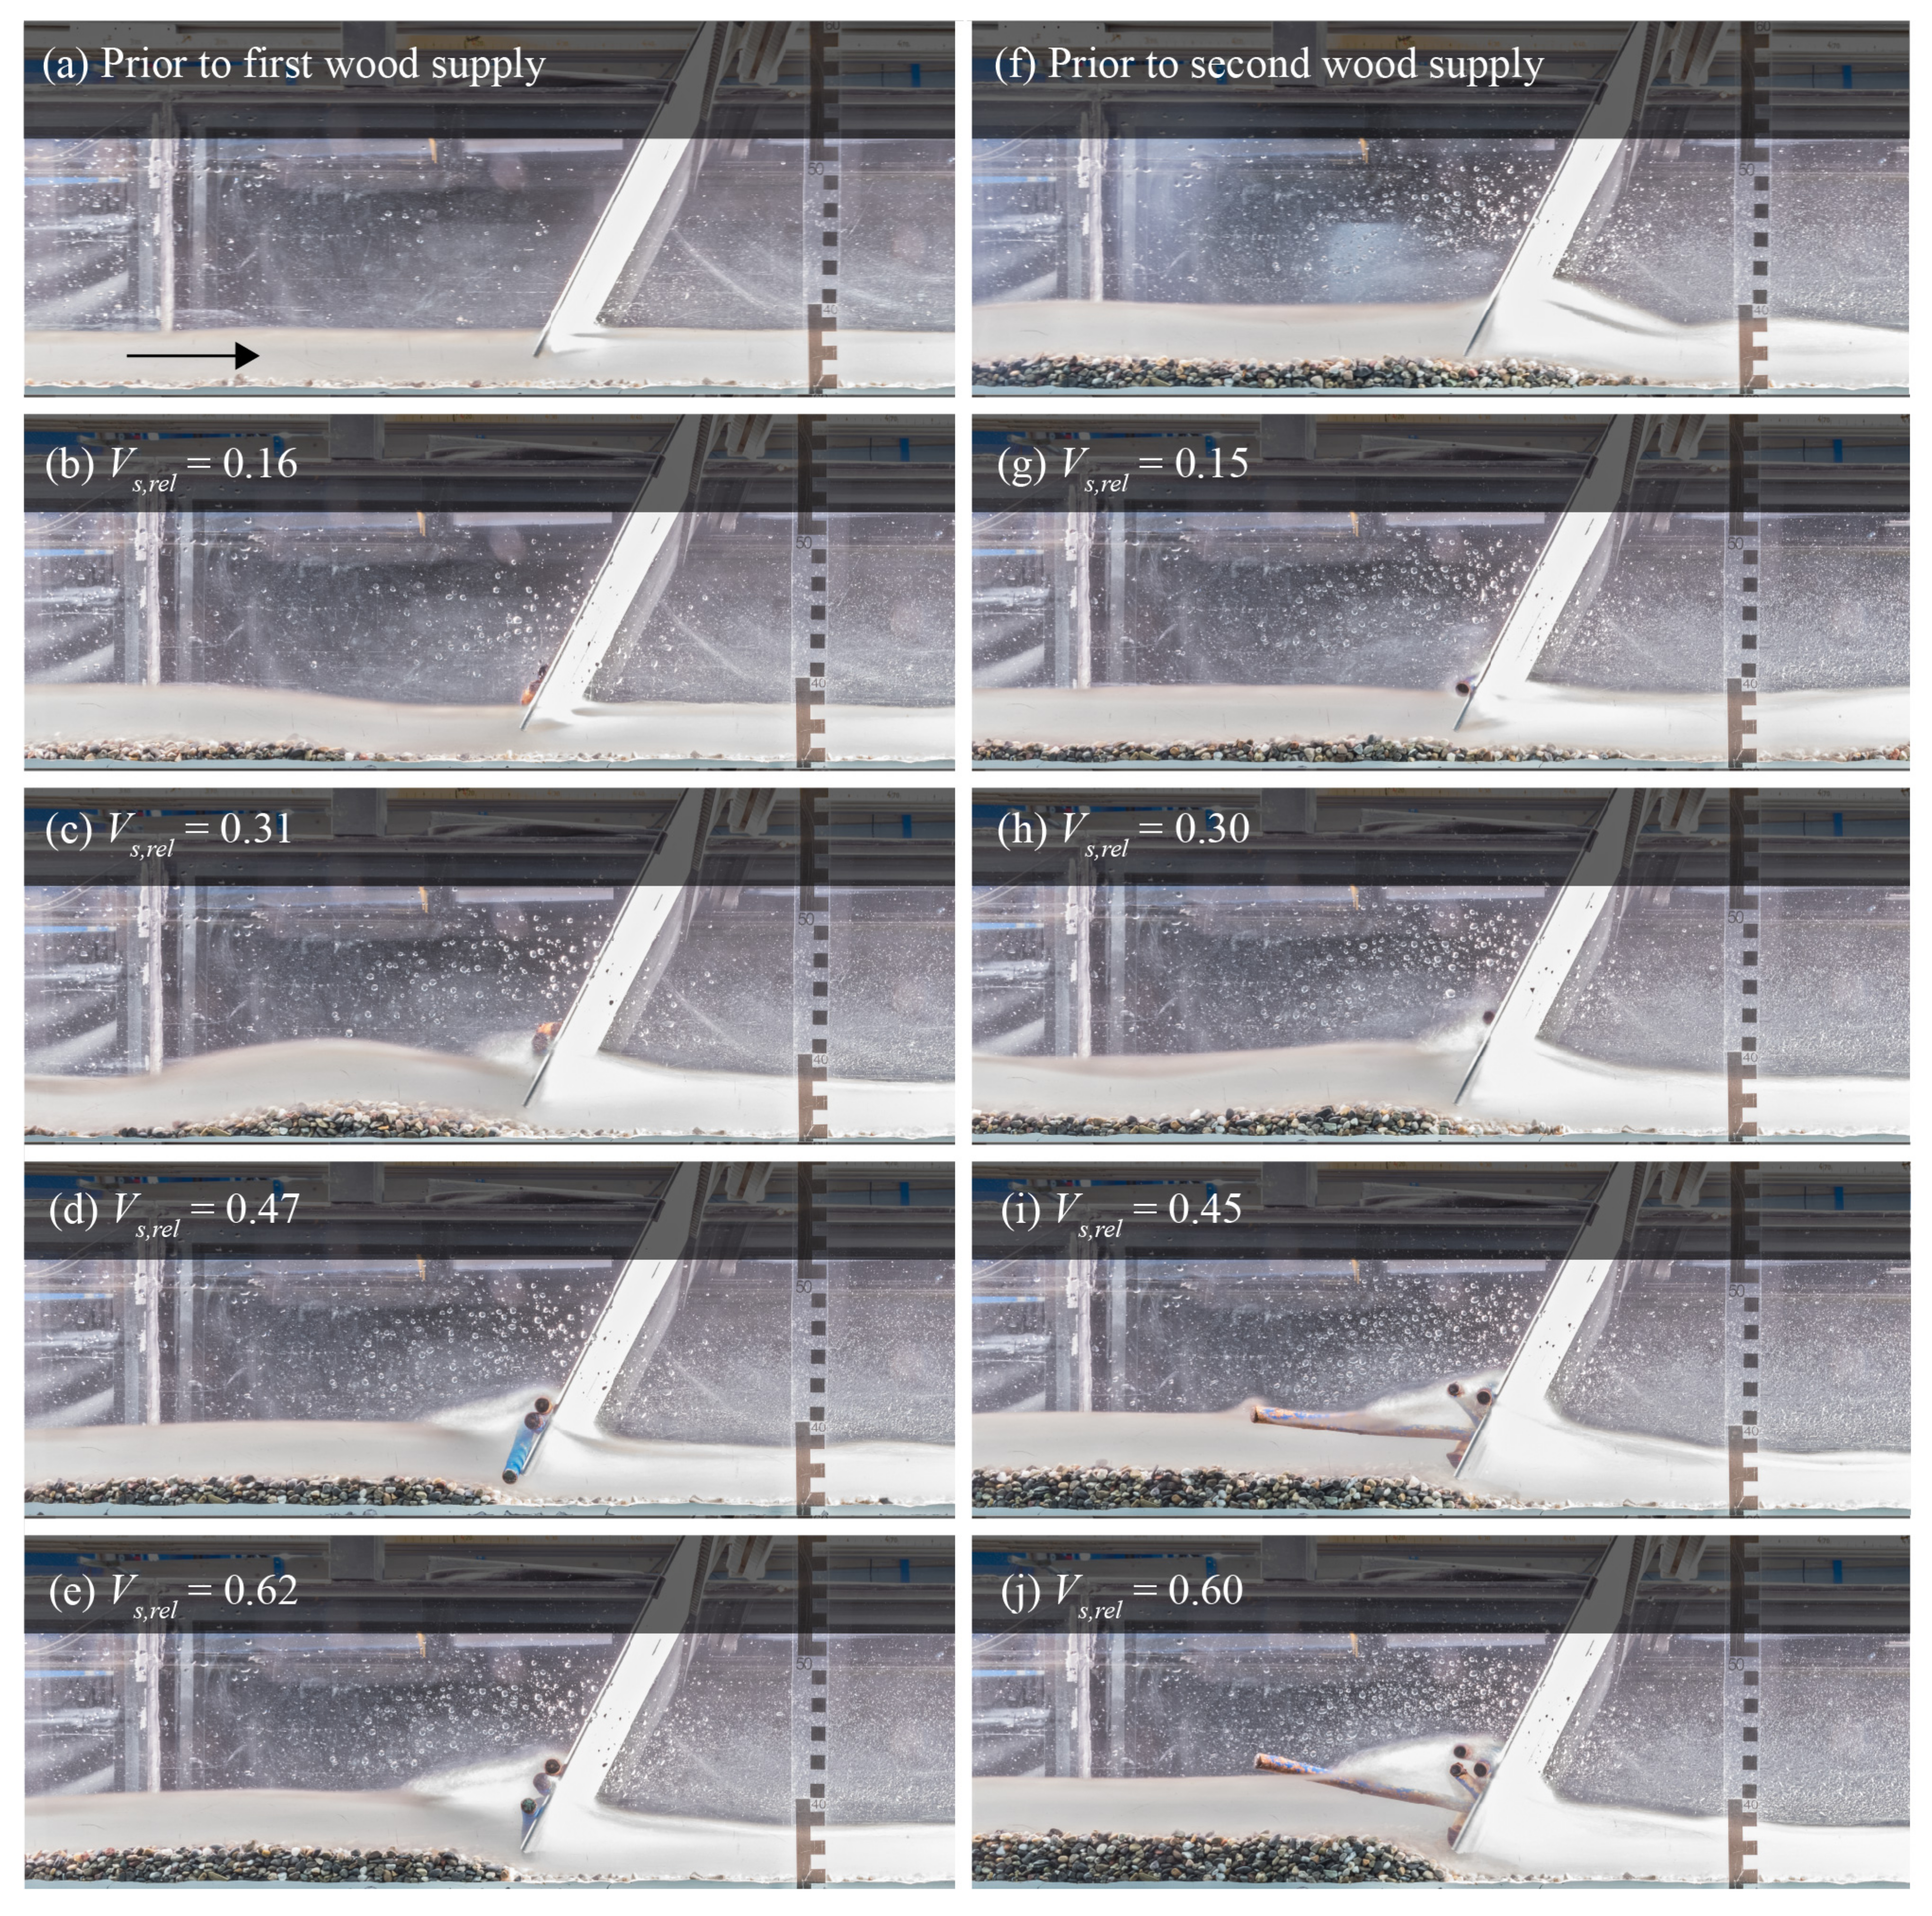
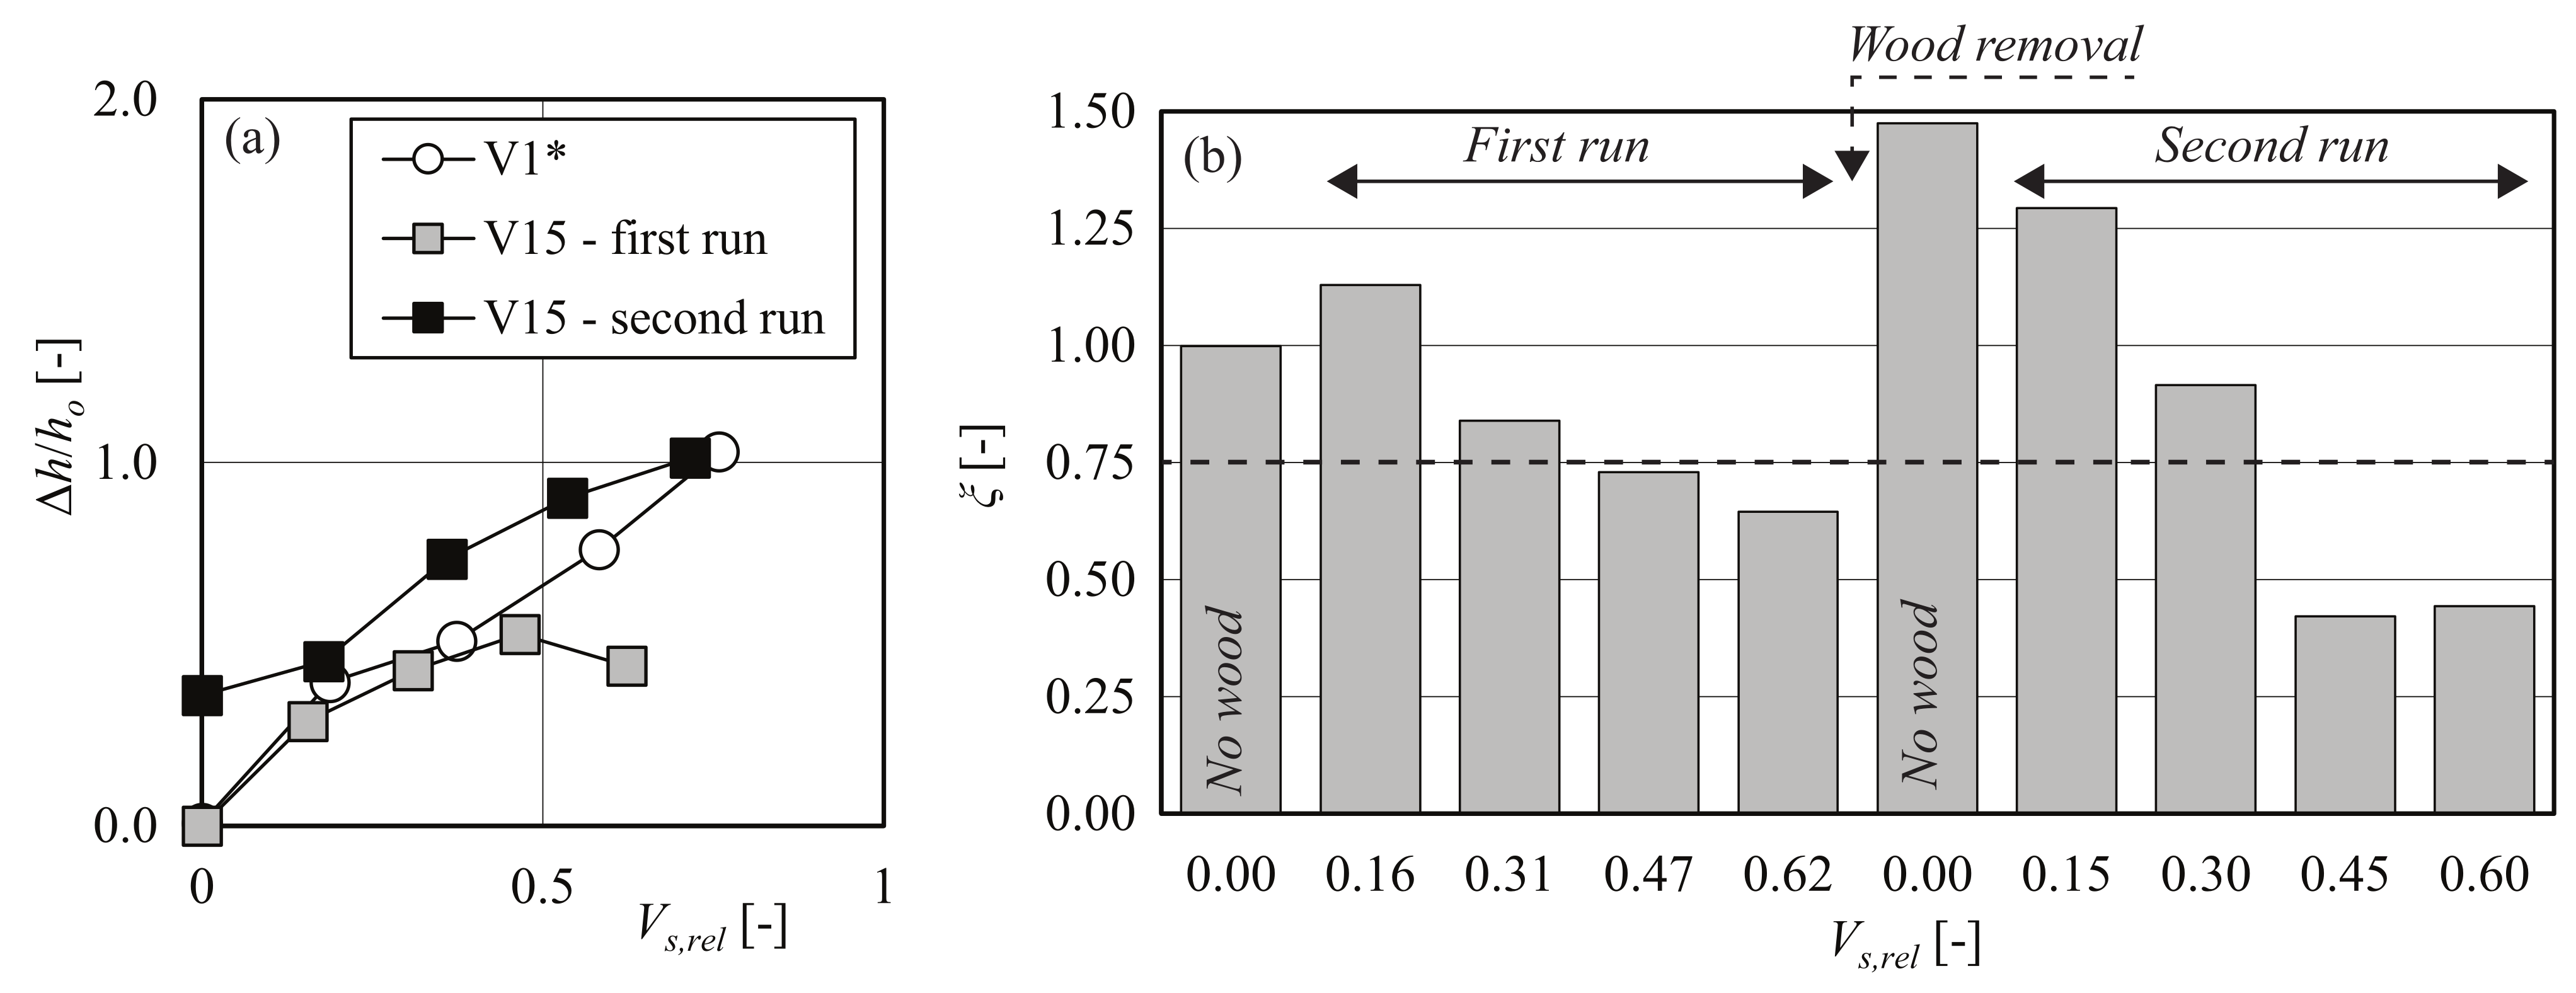
For the last test (V15), the test procedure was adapted by modeling a sequence of floods with two consecutive wood supplies. For the first run, LW was added to the flow in four packages similar to the previous tests (Figure 12b–e). After the addition of the last LW package (Figure 12e), the retained LW at the bar screen was removed and the second run started (Figure 12f) by repeating the procedure and adding four LW packages to the flow (Figure 12g–j). Similar to the previous tests, / increased with increasing . Due to the bedload deposition during the first run, / = 0.36 after the removal of the first wood supply and prior to the second wood supply (Figure 13a). Given = 0.5, / increased by a factor of 1.7 during the second run compared to the first run (Figure 13a). The LW removal at the inclined bar screen led to bedload self-flushing indicated by an increase in bedload transport with ≈ 1.5 prior to the wood supply in the second run (Figure 13b). For a LW accumulation of ≈ 0.6, was larger by a factor of 1.5 in the first run compared to the second run (Figure 13b).
The results demonstrated that the consecutive LW supply can affect both backwater rise and bedload deposition. They confirmed the fourth hypothesis (H4), highlighting that the maintenance of inclined bar screens requires a combined management of both LW and bedload in order to avoid bedload deposition during ordinary flows, bedload self-flushing, as well as backwater rise.
3.7. Interaction of Large Wood Accumulation and Bedload Transport Continuity
The inclined bar screen was designed based on recommendations by Schwindt et al. [9] and Roth et al. [10], where the bottom clearance height is a function of the characteristic grain size diameter . In order to also apply this novel rack structure to sites with LW transport during ordinary flows, it is important to study how LW deposits at the structure alter bedload transport capacity. To determine the effect of LW accumulation on bedload transport continuity, we defined that bedload transport is impaired, if the bedload transport output rate is reduced by a minimum of 25% compared to the bedload transport input rate , i.e., = 0.75 [10]. Similar to the results of Roth et al. [10], bedload transport continuity was not affected by the rack structure prior to the addition of LW with a bedload transport reduction factor ≈ 1 (Figure 14). By plotting the bedload transport reduction factor versus the relative solid LW volume for all tests with varied LW characteristics (V1*–V14), we can differentiate between two areas (gray- vs. white-shaded area in Figure 14). Due to the stochastic LW accumulation process, there are significant deviations in for the different LW characteristics. However, the white-shaded area illustrates that for > 0.5, all tests fell below the threshold value of and bedload transport capacity is impaired. The results, therefore, demonstrate that a comparably small LW volume is sufficient to reduce bedload transport. Similar to the results of Schalko and Weitbrecht [22], a LW accumulation of ≈10–20 logs (100–150 g model scale) with > 0.5 at an inclined bar screen may be large enough to already impair bedload transport. The results plotted in Figure 14 support the last hypothesis (H5) that the design of inclined bar screens and specifically the design of the bottom clearance, should also include LW dimensions to enable bedload transport continuity during ordinary flows. However, additional experiments are required to define the bottom clearance considering LW size and to confirm this hypothesis (H5).
4. Summary and Outlook
Flume experiments were conducted to study the effect of LW accumulations at an inclined bar screen on both backwater rise and bedload transport continuity with a special focus on varying LW characteristics. The results demonstrated that the inclined bar screen does not affect bedload transport prior to the addition of LW with a bedload reduction coefficient of ≈ 1. However, a relative solid LW volume of > 0.5 or ≈10–20 logs (corresponding to a wood volume of ≈6.8 m prototype scale with a model scale factor of 30) are sufficient to reduce the bedload transport capacity to below 75% compared to the condition without LW. The results further demonstrated that smaller LW sizes (i.e., log diameter and length), the addition of fine material such as fir branches and leaves, and the simulation of a sequenced flood significantly increased backwater rise / and reduced the bedload transport reduction factor compared to the reference test with regular logs. In contrast, LW density and LW shape such as logs with branches and the addition of rootwads resulted in similar backwater rise and bedload transport capacity as the reference test. However, in prototype, decayed wood (i.e., small density) may be transported during smaller flows compared to dense wood.
The results further confirm our hypotheses that a LW accumulation at an inclined bar screen affects the behavior of the structure (H1) and that LW characteristics such as fine material and LW size significantly influence backwater rise and bedload retention (H2, H3). The test focusing on the sequenced flood highlighted the need for improved maintenance measures in case an inclined bar screen is used for a combined LW and bedload retention to avoid self-flushing of the bed material (H4). Furthermore, the design of an inclined bar screen may need to be adapted for a combined LW and bedload retention to enable bedload transport continuity during ordinary flows (H5). As the presented experiments did not vary the design of an inclined bar screen, i.e., bottom clearance, the last hypothesis (H5) cannot yet be confirmed.
Additional flume experiments are required focusing on (1) design alterations of the inclined bar screen as a function of LW size, (2) unsteady flow conditions, and (3) different bed material. Variation of the bottom clearance needs to be tested in combination with large floods to guarantee the functionality of inclined bar screens as well as the entire sediment trap system during typical flood hydrographs.
Author Contributions
Conceptualization, I.S.; methodology, I.S. and V.R.-V.; investigation, V.R.-V. and F.M.; formal analysis, I.S. and V.R.-V.; writing—original draft preparation, I.S. and V.R.-V.; writing—review and editing, I.S., V.R.-V., F.M., and V.W.; visualization, I.S.; supervision, V.W. All authors have read and agreed to the published version of the manuscript.
Funding
This research received no external funding.
Data Availability Statement
The data presented in this study is available in Schalko et al. [34].
Acknowledgments
Kristina Milojevic is acknowledged for her laboratory work during her project thesis at ETH Zurich.
Conflicts of Interest
The authors declare no conflict of interest.
References
- Piton, G.; Recking, A. Design of sediment traps with open check dams. II: Woody debris. J. Hydraul. Eng. 2016, 142, 04015046. [Google Scholar] [CrossRef]
- Armanini, A.; Dellagiacoma, F.; Ferrari, L. From the check dam to the development of functional check dams. In Fluvial Hydraulics of Mountain Regions; Springer: Berlin/Heidelberg, Germany, 1991; pp. 331–344. [Google Scholar]
- Wehrmann, H.; Hübl, J.; Holzinger, G. Classification of dams in torrential watersheds. In Proceedings of the INTERPRAEVENT Conference Citeseer, Niigata, Japan, 25–29 September 2006; pp. 829–838. [Google Scholar]
- Rudolf-Miklau, F.; Suda, J. Design criteria for torrential barriers. In Dating Torrential Processes on Fans and Cones; Springer: Berlin/Heidelberg, Germany, 2013; pp. 375–389. [Google Scholar]
- Boix-Fayos, C.; Barberá, G.G.; López-Bermúdez, F.; Castillo, V.M. Effects of check dams, reforestation and land-use changes on river channel morphology: Case study of the Rogativa catchment (Murcia, Spain). Geomorphology 2007, 91, 103–123. [Google Scholar] [CrossRef]
- Bombino, G.; Boix-Fayos, C.; Gurnell, A.M.; Tamburino, V.; Zema, D.A.; Zimbone, S.M. Check dam influence on vegetation species diversity in mountain torrents of the Mediterranean environment. Ecohydrology 2014, 7, 678–691. [Google Scholar] [CrossRef]
- Galia, T.; Škarpich, V.; Ruman, S.; Macurová, T. Check dams decrease the channel complexity of intermediate reaches in the Western Carpathians (Czech Republic). Sci. Total. Environ. 2019, 662, 881–894. [Google Scholar] [CrossRef] [PubMed]
- Schwindt, S. Hydro-Morphological Processes through Permeable Sediment Traps at Mountain Rivers. Ph.D. Thesis, EPFL, Lausanne, Switzerland, 2017. [Google Scholar]
- Schwindt, S.; Franca, M.J.; Reffo, A.; Schleiss, A.J. Sediment traps with guiding channel and hybrid check dams improve controlled sediment retention. Nat. Hazards Earth Syst. Sci. 2018, 18, 647–668. [Google Scholar] [CrossRef] [Green Version]
- Roth, A.; Jafarnejad, M.; Schwindt, S.; Schleiss, A. Design optimization of permeable sediment traps for fluvial bed load transport. E3S Web of Conferences. Edp Sci. 2018, 40, 03009. [Google Scholar]
- Moldenhauer-Roth, A.; Piton, G.; Schwindt, S.; Jafarnejad, M.; Schleiss, A.J. Design of sediment detention basins: Scaled model experiments and application. Int. J. Sediment Res. 2021, 36, 136–150. [Google Scholar] [CrossRef]
- Keller, E.A.; Swanson, F.J. Effects of large organic material on channel form and fluvial processes. Earth Surf. Process. 1979, 4, 361–380. [Google Scholar] [CrossRef]
- Nakamura, F.; Swanson, F.J. Effects of coarse woody debris on morphology and sediment storage of a mountain stream system in western Oregon. Earth Surf. Process. Landforms 1993, 18, 43–61. [Google Scholar] [CrossRef]
- Piégay, H.; Gurnell, A. Large woody debris and river geomorphological pattern: Examples from SE France and S. England. Geomorphology 1997, 19, 99–116. [Google Scholar] [CrossRef]
- Rimböck, A. Schwemmholzrückhalt in Wildbächen: Grundlagen zu Planung und Berechnung von Seilnetzsperren. Ph.D. Thesis, Technische Universität München, Munich, Germany, 2003. [Google Scholar]
- Piton, G.; Recking, A. Design of sediment traps with open check dams. I: Hydraulic and deposition processes. J. Hydraul. Eng. 2016, 142, 04015045. [Google Scholar] [CrossRef]
- Schmocker, L.; Weitbrecht, V. Driftwood: Risk Analysis and Engineering Measures. J. Hydraul. Eng. 2013, 139, 683–695. [Google Scholar] [CrossRef]
- Piton, G.; Mano, V.; Richard, D.; Evin, G.; Laigle, D.; Tacnet, J.M.; Rielland, P.A. Design of a debris retention basin enabling sediment continuity for small events: The Combe de Lancey case study (France). In Proceedings of the International Conference on Debris-Flow Hazards Mitigation: Mechanics, Prediction, and Assessment, Golden, CO, USA, 10–13 June 2019; pp. 1019–1026. [Google Scholar]
- Piton, G.; Horiguchi, T.; Marchal, L.; Lambert, S. Open check dams and large wood: Head losses and release conditions. Nat. Hazards Earth Syst. Sci. 2020, 20, 3293–3314. [Google Scholar] [CrossRef]
- Lange, D.; Bezzola, G.R. Schwemmholz: Probleme und Lösungsansätze. VAW-Mitteilungen 2006, 188, 1–135. [Google Scholar]
- Schalko, I. Wood retention at inclined racks: Effects on flow and local bedload processes. Earth Surf. Process. Landforms 2020, 45, 2036–2047. [Google Scholar] [CrossRef]
- Schalko, I.; Weitbrecht, V. Wood blockage and sediment transport at inclined bar screens. J. Hydraul. Res. 2021, 1–9. [Google Scholar] [CrossRef]
- Wolman, M.G.; Miller, J.P. Magnitude and frequency of forces in geomorphic processes. J. Geol. 1960, 68, 54–74. [Google Scholar] [CrossRef] [Green Version]
- Wohl, E.E. Mountain Rivers; American Geophysical Union: Washington, DC, USA, 2000. [Google Scholar]
- Hassan, M.A.; Brayshaw, D.; Alila, Y.; Andrews, E. Effective discharge in small formerly glaciated mountain streams of British Columbia: Limitations and implications. Water Resour. Res. 2014, 50, 4440–4458. [Google Scholar] [CrossRef]
- Schalko, I.; Schmocker, L.; Weitbrecht, V.; Boes, R.M. Backwater Rise due to Large Wood Accumulations. J. Hydraul. Eng. 2018, 144, 04018056. [Google Scholar] [CrossRef]
- Schalko, I.; Lageder, C.; Schmocker, L.; Weitbrecht, V.; Boes, R.M. Laboratory flume experiments on the formation of spanwise large wood accumulations Part I: Effect on backwater rise. Water Resour. Res. 2019, 55, 4854–4870. [Google Scholar] [CrossRef]
- Follett, E.; Schalko, I.; Nepf, H. Momentum and Energy Predict the Backwater Rise Generated by a Large Wood Jam. Geophys. Res. Lett. 2020, 47. [Google Scholar] [CrossRef]
- Buffington, J.M.; Montgomery, D.R. A systematic analysis of eight decades of incipient motion studies, with special reference to gravel-bedded rivers. Water Resour. Res. 1997, 33, 1993–2029. [Google Scholar] [CrossRef] [Green Version]
- Rickenmann, D. Bedload Transport Capacity of Slurry Flows at Steep Slopes. Ph.D. Thesis, ETH Zurich, Zurich, Switzerland, 1990. [Google Scholar]
- Armanini, A.; Larcher, M. Rational Criterion for Designing Opening of Slit-Check Dam. J. Hydraul. Eng. 2001, 127, 94–104. [Google Scholar] [CrossRef]
- Campisano, A.; Cutore, P.; Modica, C. Improving the Evaluation of Slit-Check Dam Trapping Efficiency by Using a 1D Unsteady Flow Numerical Model. J. Hydraul. Eng. 2014, 140, 04014024. [Google Scholar] [CrossRef]
- Schalko, I.; Ruiz-Villanueva, V.; Weitbrecht, V. Effect of wood accumulation on sediment continuity at permeable sediment traps. In Proceedings of the 10th Conference on Fluvial Hydraulics, Delft, The Netherlands, 7–10 July 2020; CRC Press: Boca Raton, FL, USA, 2020; pp. 1–6. [Google Scholar]
- Schalko, I.; Ruiz-Villanueva, V.; Maager, F.; Weitbrecht, V. Dataset: Wood Retention at Inclined Bar Screens: Effect of Wood Characteristics on Backwater Rise and Bedload Transport. Zenodo. Available online: https://doi.org/10.5281/zenodo.5040461 (accessed on 30 June 2021). [CrossRef]
Figure 1.
Test setup and notation with Froude number F [-], discharge Q [l/s], approach flow depth [cm], resulting water depth with wood blockage h [cm], backwater rise [cm], and bottom clearance height [mm]. Ultrasonic distance sensors (UDS) to measure h. LW accumulation with log length [cm], log diameter [cm], and solid wood volume []. Bedload transport input rate [g/s] and output rate [g/s] with mean sediment diameter [mm] and sorting coefficient of the grain size distribution [-]. Potential bedload deposition is illustrated upstream of the inclined bar screen.

Figure 2.
Model wood, fine material, and sediment.

Figure 3.
(a) Relative backwater rise / versus relative solid wood volume for tests V1a–c, (b) bedload transport reduction factor versus for V1a–c, and (c) wood trapping ratio = / for all tests.
Figure 3.
(a) Relative backwater rise / versus relative solid wood volume for tests V1a–c, (b) bedload transport reduction factor versus for V1a–c, and (c) wood trapping ratio = / for all tests.

Figure 4.
LW accumulation and bedload deposition at the inclined bar screen for (a) test V1b ( = 500 kg/m) with = 0.58 and (b) = 0.74, compared to (c) test V4 ( = 900 kg/m) with = 0.48 and (d) = 0.64.
Figure 4.
LW accumulation and bedload deposition at the inclined bar screen for (a) test V1b ( = 500 kg/m) with = 0.58 and (b) = 0.74, compared to (c) test V4 ( = 900 kg/m) with = 0.48 and (d) = 0.64.

Figure 5.
(a) Relative backwater rise / and (b) bedload transport reduction factor versus for tests V1* ( = 500 kg/m), V2 ( = 700 kg/m), V3 ( = 800 kg/m), V4 ( = 900 kg/m), and V5 ( = 1100 kg/m).
Figure 5.
(a) Relative backwater rise / and (b) bedload transport reduction factor versus for tests V1* ( = 500 kg/m), V2 ( = 700 kg/m), V3 ( = 800 kg/m), V4 ( = 900 kg/m), and V5 ( = 1100 kg/m).

Figure 6.
LW accumulation and bedload deposition at the inclined bar screen for (a) test V7 ( = 0.5 cm and = 5–10 cm) with = 0.17 and (b) = 0.34, compared to (c) test V8 ( = 0.2 cm and = 5 cm) with = 0.15 and (d) = 0.30.
Figure 6.
LW accumulation and bedload deposition at the inclined bar screen for (a) test V7 ( = 0.5 cm and = 5–10 cm) with = 0.17 and (b) = 0.34, compared to (c) test V8 ( = 0.2 cm and = 5 cm) with = 0.15 and (d) = 0.30.

Figure 7.
(a) Relative backwater rise / and (b) bedload transport reduction factor versus for tests V1* ( = 1 cm and = 15–20 cm), V6 ( = 2 cm and = 15–20 cm), V7 ( = 0.5 cm and = 5–10 cm), and V8 ( = 0.2 cm and = 5 cm).
Figure 7.
(a) Relative backwater rise / and (b) bedload transport reduction factor versus for tests V1* ( = 1 cm and = 15–20 cm), V6 ( = 2 cm and = 15–20 cm), V7 ( = 0.5 cm and = 5–10 cm), and V8 ( = 0.2 cm and = 5 cm).

Figure 8.
LW accumulation and bedload deposition at the inclined bar screen for test V11 with 50% and increasing : (a) = 0.42 and (b) = 0.83 (adapted from the work in [33]).
Figure 8.
LW accumulation and bedload deposition at the inclined bar screen for test V11 with 50% and increasing : (a) = 0.42 and (b) = 0.83 (adapted from the work in [33]).

Figure 9.
(a) Relative backwater rise / and (b) bedload transport reduction factor versus for tests V1* (no ), V9 (10% ), V10 (30% ), and V11 (50% ).
Figure 9.
(a) Relative backwater rise / and (b) bedload transport reduction factor versus for tests V1* (no ), V9 (10% ), V10 (30% ), and V11 (50% ).

Figure 10.
LW accumulation and bedload deposition at the inclined bar screen for test V14 with 50% and increasing : (a) side view and (b) zoom with = 0.52 and (c) side view and (d) zoom with = 1.04.
Figure 10.
LW accumulation and bedload deposition at the inclined bar screen for test V14 with 50% and increasing : (a) side view and (b) zoom with = 0.52 and (c) side view and (d) zoom with = 1.04.

Figure 11.
(a) Relative backwater rise / and (b) bedload transport reduction factor versus for tests V1* (regular logs), V12 (logs with branches), V13 (25% ), and V14 (50% ).
Figure 11.
(a) Relative backwater rise / and (b) bedload transport reduction factor versus for tests V1* (regular logs), V12 (logs with branches), V13 (25% ), and V14 (50% ).

Figure 12.
LW accumulation and bedload deposition at the inclined bar screen for test V15 with increasing . Panels (a–e) illustrate first run and panels (f–j) second run. (a) Prior to first wood supply, (b) = 0.16, (c) = 0.31, (d) = 0.47, (e) = 0.62, (f) after wood removal of first run and prior to second wood supply, (g) = 0.15, (h) = 0.30, (i) = 0.45, (j) = 0.60.

Figure 13.
(a) Relative backwater rise / versus for test V1* (addition of 4 LW packages; white circles), V15 with first run (wood supply 1: addition of 4 LW packages; gray squares), and V15 with second run (wood supply 2: LW removal from first run and then re-addition of 4 LW packages; black squares); (b) bedload transport reduction factor versus for test V15 (first and second run).

Figure 14.
Bedload transport reduction factor versus for all tests. Circles correspond to different LW density, diamonds to LW size, triangles to fine material, and squares to LW shapes including rootwads.
Figure 14.
Bedload transport reduction factor versus for all tests. Circles correspond to different LW density, diamonds to LW size, triangles to fine material, and squares to LW shapes including rootwads.


Table 1.
Test program with bottom clearance height = 19 mm, discharge Q = 11.6 l/s, approach flow depth = 3.4 cm, flow Froude number F = 1.55, channel slope S = 3.3%, non-dimensional bed shear stress = 0.11, and bedload transport input rate = 88 g/s. = Fine material and = rootwads.
Table 1.
Test program with bottom clearance height = 19 mm, discharge Q = 11.6 l/s, approach flow depth = 3.4 cm, flow Froude number F = 1.55, channel slope S = 3.3%, non-dimensional bed shear stress = 0.11, and bedload transport input rate = 88 g/s. = Fine material and = rootwads.
| Test | Log Diameter [cm] | Log Length [cm] | Wood Shape [-] | Wood Density [kg/m] |
|---|---|---|---|---|
| V1a | 1 | 15–20 | Logs | 500 |
| V1b | 1 | 15–20 | Logs | 500 |
| V1c | 1 | 15–20 | Logs | 500 |
| V2 | 1 | 15–20 | Logs | 700 |
| V3 | 1 | 15–20 | Logs | 800 |
| V4 | 1 | 15–20 | Logs | 900 |
| V5 | 1 | 15–20 | Logs | 1100 |
| V6 | 2 | 15–20 | Logs | 620 |
| V7 | 0.5 | 5–10 | Logs | 620 |
| V8 | 0.2 | 5 | Logs | 500 |
| V9 | 1 | 15–20 | Logs + 10% | 500 |
| V10 | 1 | 15–20 | Logs + 30% | 500 |
| V11 | 1 | 15–20 | Logs + 50% | 500 |
| V12 | 1 | 15–20 | Logs with branches | 660 |
| V13 | 1 | 15–20 | Logs + 25% | 500 |
| V14 | 1 | 15–20 | Logs + 50% | 500 |
| V15 | 1 | 15–20 | Logs | 500 |
Table 2.
Relative standard error and mean relative standard error of reproducibility tests (V1a–c).
| Test | Parameter | Relative Standard Error [%] | Mean Relative Standard Error [%] |
|---|---|---|---|
| V1a–c | / | 2.2–11.7 | 6.2 |
| V1a–c | 5.2–8.5 | 7.2 |
Publisher’s Note: MDPI stays neutral with regard to jurisdictional claims in published maps and institutional affiliations. |
© 2021 by the authors. Licensee MDPI, Basel, Switzerland. This article is an open access article distributed under the terms and conditions of the Creative Commons Attribution (CC BY) license (https://creativecommons.org/licenses/by/4.0/).
Share and Cite
MDPI and ACS Style
Schalko, I.; Ruiz-Villanueva, V.; Maager, F.; Weitbrecht, V. Wood Retention at Inclined Bar Screens: Effect of Wood Characteristics on Backwater Rise and Bedload Transport. Water 2021, 13, 2231. https://doi.org/10.3390/w13162231
AMA Style
Schalko I, Ruiz-Villanueva V, Maager F, Weitbrecht V. Wood Retention at Inclined Bar Screens: Effect of Wood Characteristics on Backwater Rise and Bedload Transport. Water. 2021; 13(16):2231. https://doi.org/10.3390/w13162231
Chicago/Turabian StyleSchalko, Isabella, Virginia Ruiz-Villanueva, Fiona Maager, and Volker Weitbrecht. 2021. "Wood Retention at Inclined Bar Screens: Effect of Wood Characteristics on Backwater Rise and Bedload Transport" Water 13, no. 16: 2231. https://doi.org/10.3390/w13162231
Note that from the first issue of 2016, this journal uses article numbers instead of page numbers. See further details here.