Surface Nuclear Magnetic Resonance Monitoring Reveals Karst Unsaturated Zone Recharge Dynamics during a Rain Event


1
UMR 1114 EMMAH (AU-INRAE), Avignon University, 84000 Avignon, France
2
UPMC, CNRS, EPHE, UMR 7619 METIS, Sorbonne University, 75005 Paris, France
3
IGE, Institute of Research for Development (IRD), University Grenoble Alps (UGA), 38000 Grenoble, France
*
Authors to whom correspondence should be addressed.
Water 2020, 12(11), 3183; https://doi.org/10.3390/w12113183
Submission received: 8 September 2020
/
Revised: 6 November 2020
/
Accepted: 9 November 2020
/
Published: 14 November 2020
(This article belongs to the Special Issue Recent Advances in Karstic Hydrogeology)
Abstract
:Understanding karst unsaturated zone (UZ) recharge dynamics is crucial for achieving sustainable management of karst hydrosystems. In this paper, we provide the first report of the application of surface nuclear magnetic resonance (SNMR) monitoring of a karst UZ during a typical Mediterranean rain event. This 79 days’ SNMR monitoring is a part of a more than 2 years of SNMR monitoring at the Low Noise Underground Laboratory (LSBB) experimental site located within the Fontaine de Vaucluse karst hydrosystem (southeastern France). We present eight SNMR soundings conducted before and after the rain event that accumulated 168 mm in 5 days. The obtained results demonstrate the applicability and the efficiency of SNMR for investigating infiltration dynamics in karst UZs at the time scale of a few days. We present the SNMR amplitudes that highlight strong signal variations related to water dynamics in the karst UZ. Infiltrated water cause increased SNMR signal during 5 days after the rain event. A significant draining process of the medium starts 15 days after the main event. Finally, after 42 days, the SNMR signal returns close to the initial state.
1. Introduction
Karstified carbonate formations play a major role in water resources management as they contain 25% of the world’s water resources [1]. Understanding their structure and hydrodynamics is essential for achieving sustainable exploitation of karst hydrosystems. The karst unsaturated zone (UZ) plays a key role in karst hydrosystems recharge and contaminant attenuation processes [2,3,4]. However, the role of UZ on infiltration dynamics through the UZ is poorly known [5]. Direct observations of flow processes in the UZ is limited to research sites where physical access to the UZ is granted through artificial or natural cavities. Moreover, direct UZ monitoring focuses on flow originating from preferential flow paths in discrete features (either fracture of stalactite).
Hydro-geophysical approaches provide a large panel of techniques that allow the characterization of sub-surface properties [6]. The contribution of geophysics to the study of karst environments has been widely demonstrated [7]. Compared to other geophysical methods, surface nuclear magnetic resonance (SNMR) is directly related to groundwater content, which makes it particularly well suited for hydrogeological studies [8].
SNMR investigations in karst systems have mostly been devoted to the investigation of saturated zone properties [8,9,10,11,12]. SNMR is also able to quantify the spatial variability of water content in karst UZs under different carbonated contexts [13]. The limitation of SNMR in such lithological and hydrogeological contexts is the very low ambient electromagnetic noise level required to allow the monitoring of temporal variations in water content. SNMR evidence of seasonal variation in water content in karst UZ has, nevertheless, been reported in a few studies [3,14].
In this paper, we present the results of an SNMR monitoring experiment associated with a typical high-intensity Mediterranean rainfall event. Such SNMR monitoring is unique. In this paper, we present only non-inverted SNMR data for several reasons. Firstly, evaluation of non-inverted SNMR is required to discuss the applicability and effectiveness of the method to this particular context. It also provides qualitative insights into karst UZ recharge dynamics. Secondly, in the actual stageof our study, time-lapse inversion code was in the process of being developed and validated [15]. Additional evaluation tests need to be performed to ensure the validity of their outcomes, particularly for the UZ of karst hydrosystems. Finally, by presenting only the SNMR non-inverted data, we avoid confusion with the technical details of the inversion methodologies and the related uncertainties that exceed the scope of both this Special Issue and the journal.
2. Studied Site
2.1. General Context
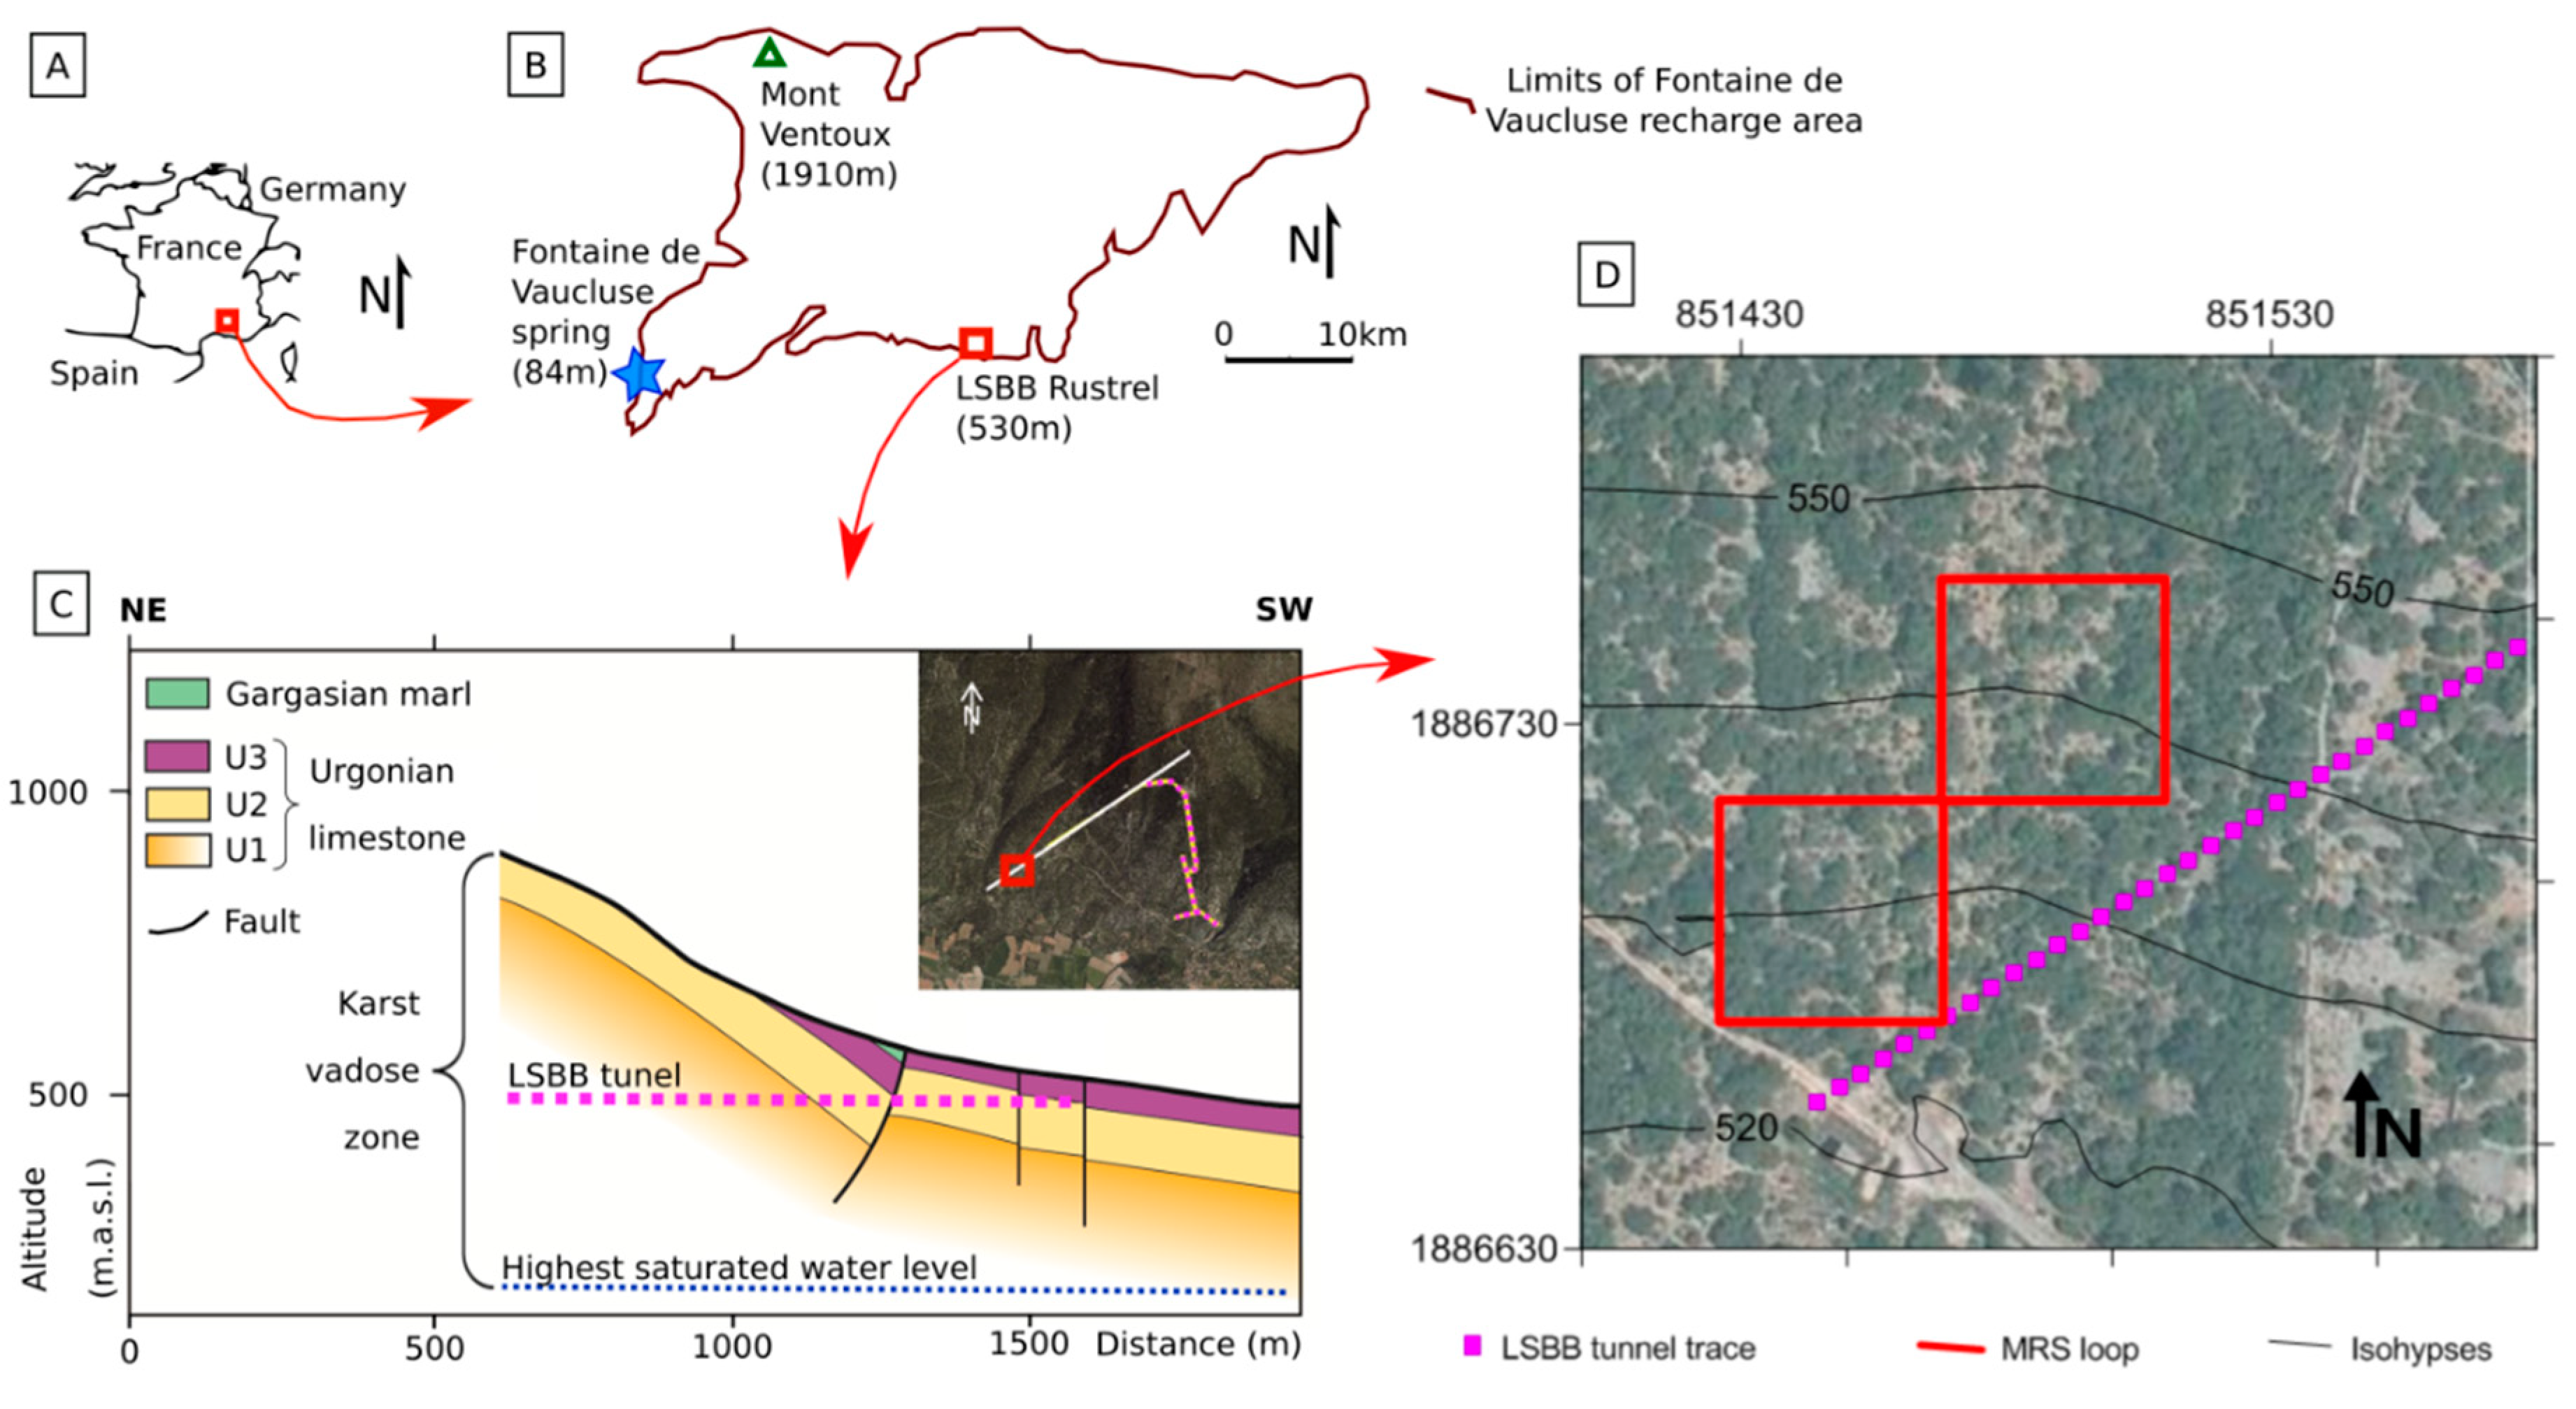
The Buissonière test site is located in the 1160 km2 recharge area of the Fontaine de Vaucluse karst aquifer in southeastern France (Figure 1A,B). This aquifer developed in the North Provence carbonate platform within the cretaceous limestone typical of the Mediterranean area. The test site is located south of the recharge area, at an altitude of 530 m a.s.l., at least 300 m above the highest saturated water level observed. It is a part of the Low Background Noise Underground Research Laboratory (LSBB) of Rustrel, which is a ground- and underground-based facility for interdisciplinary research, development, and innovation. Since 2012, the LSBB has been a Unité Mixte de Service, UMS3538 of the French National Centre for Scientific Research (CNRS). The Fontaine de Vaucluse/LSBB observation site is part of OZCAR Critical Zone network (https://www.ozcar-ri.org/fr/ozcar-3/), the H+ observatory network (http://hplus.ore.fr/en/), and KARST observatory network (http://sokarst.org/). The LSBB tunnel crosses the Buissonnière test site at a depth of 33 m below the ground surface (Figure 1C).
2.2. Local Geological and Hydrogeological Context
Surface conditions at the experimental site are typical of most of the Fontaine de Vaucluse recharge area. It exhibits neither major karstification features (i.e., caves and sinkholes) nor a major tectonic accident (i.e., faults). As in many Mediterranean karst areas, Mediterranean forest (~4 m high) subsists of a thin rocky soil with some limestone outcrops [16]. The limestone of the Buissonière site is sub-reeficial bioclastic limestone with multiple facies, weak lateral continuity, and oblique stratification in certain levels [17,18]. The matrix porosities can reach 20% [19,20]. This so-called Urgonian facies is present over half of the Fontaine de Vaucluse karst system and more widely around the Mediterranean Sea and Middle East.
At the Buissonière site, Urgonian facies is found down to a depth of 34 m [21]. Slanted stratifications were evidenced by ground-penetrating radar (GPR) [18] from 5–7 m up to the maximal GPR-penetration depth of 12 m. Two SNMR soundings performed in dry (2011) and wet (2012) conditions with a squared 80 × 80 m array yielded maximum water contents of 6% and 10% at a 15 m depth, respectively. In this paper, we provide SNMR investigations at a finer time resolution to better understand how water infiltrates into the karst.
2.3. Climatic Context
The climate is Mediterranean with dry and hot summers; most rainfall occurs during spring and autumn. Between 2003 and 2015, the average annual rainfall was 909 mm and ranged between 407 and 1405 mm. The average annual temperature over the same period was 12.9 °C. Intense rainfall episodes regularly affect the region with more than 100 or 200 mm in a few days. These episodes occur in autumn and are linked to the geographical configuration of the site, which is located between the Mediterranean Sea and the first reliefs (>1000 m). In this article, we present the SNMR measurements performed before and after a rain event that released 168 mm in 5 days.
3. Methodology
3.1. SNMR Background
SNMR is the only ground-based geophysical method that can obtain a signal directly related to groundwater. The SNMR method is based on the resonance behavior of the magnetic moments of hydrogen protons in the groundwater molecule. Each proton is able to absorb electromagnetic (EM) energy at a specific frequency (the Larmor frequency) transmitted by an oscillating current in the surface loop. After the energizing pulse is cut off, protons emit back an electromagnetic field at the same frequency. The use of this specific frequency ensures selective sensitivity of the method to groundwater. The SNMR signal parameters (initial amplitude and the apparent transverse relaxation time T2*) are derived from the SNMR signal envelope assuming an exponential decay. The initial amplitude is related to the volume of water under the measuring loop and the geometry of water-bearing formation. T2* relaxation time is related to the characteristics of water-filled pores. All other things being equal, the higher the SNMR signal amplitude, the higher the groundwater content. Conversely, a decrease in the SNMR signal amplitude reveals a decrease in groundwater content. In addition, larger water-filled pores yield higher T2* values [22].
The relationship between the SNMR signal amplitude and SNMR water content depends on several factors. Some factors are directly related to the sounding settings: magnitude and inclination of local geomagnetic field, shape and diameter of the SNMR antenna, and the value of the energizing pulse. Others depend on the subsurface characteristics. Conductive layers may hinder the vertical resolution and the depth resolution of the method. The last factors are those directly related to groundwater distribution in the subsurface. For example, signal amplitude is lower for deeper targets. Comprehensive explanations of the method can be found in the scientific literature [23,24,25].
An SNMR sounding is composed of 10–20 SNMR signals recorded with different magnitudes of the current pulse. The inversion of the SNMR signal has to cope with the equivalence property of the product of each layer’s thickness based on its water content. The vertical resolution depends on loop size and shape and decreases with depth.
Ambient electromagnetic noise is recorded before the current pulse is transmitted. This makes it possible to estimate the signal-to-noise ratio (S/N) as a ratio of the amplitude of the magnetic resonance signal to the mean of the electromagnetic noise. To improve the S/N, measurements are repeated and stacked (usually from ten to several hundred times, depending on the ambient noise magnitude). Details about SNMR method principles and signal processing can be found in the scientific literature [22,23].
3.2. Field Setup and Constraints
Eight SNMR soundings were conducted over 79 days with a variable time step (shorter after the rain event). The measuring device was NUMISPOLY equipment from IRIS Instruments, with a coincident transmitting/receiving eight-square loop configuration composed of two squares with 40 m sides (Figure 1D). The eight-square shape was used to achieve the best signal to noise ratio (S/N). This choice was guided by previous geological and hydrogeological findings on the site [3,18], the ambient electromagnetic noise conditions and finally the targeted signal to noise ratio. Due to the relatively high spatial variability of the ambient noise on the test site, compensation loops available with this SNMR equipment could not be used to increase the signal to noise ratio. The signal duration record was set to 240 ms. The average duration for each SNMR sounding was between 5 and 8 h. The loop location was kept identical for all soundings performed within this study. The loop was set up as a permanent configuration for the entire monitoring period.
3.3. Signal Processing
Data were acquired using a NUMISPOLY SNMR instrument and Prodiviner data acquisition software. A post-processing procedure was completed using the NumisPro 11 × 62 program and consisted of two types of signal filtering: (i) a 15 Hz band-pass and (ii) a 50 Hz notch filter. SNMR signal parameters are derived using the least square-curve-fitting estimator [23].
3.4. Data Quality and Uncertainty
SNMR data quality was estimated based on the average S/N (considering external and instrumental noise). We considered SNMR soundings to be of good quality when S/N ≥ 2. Standard errors of the parameters derived from least square fitting were used as an estimate of SNMR signal parameter uncertainty.
4. Results and Discussions
4.1. SNMR Insights to Understand UZ Infiltration Dynamics
Soundings characteristics are summarized in Table 1. The stacking numbers range from 200 to 400 because noise was highly variable at the investigated site. All soundings had a signal to noise ratio higher than 1.9 and were therefore deemed to be of good quality. The maximum resolution depth was about 25 m.
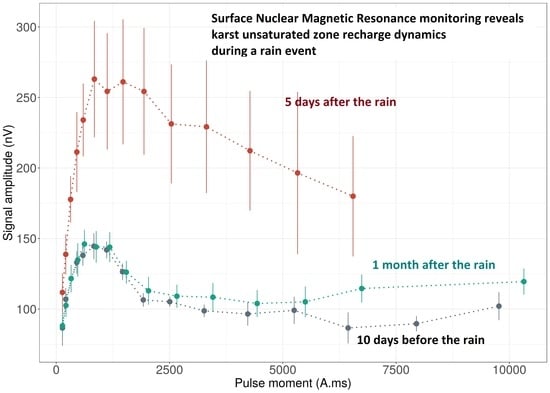
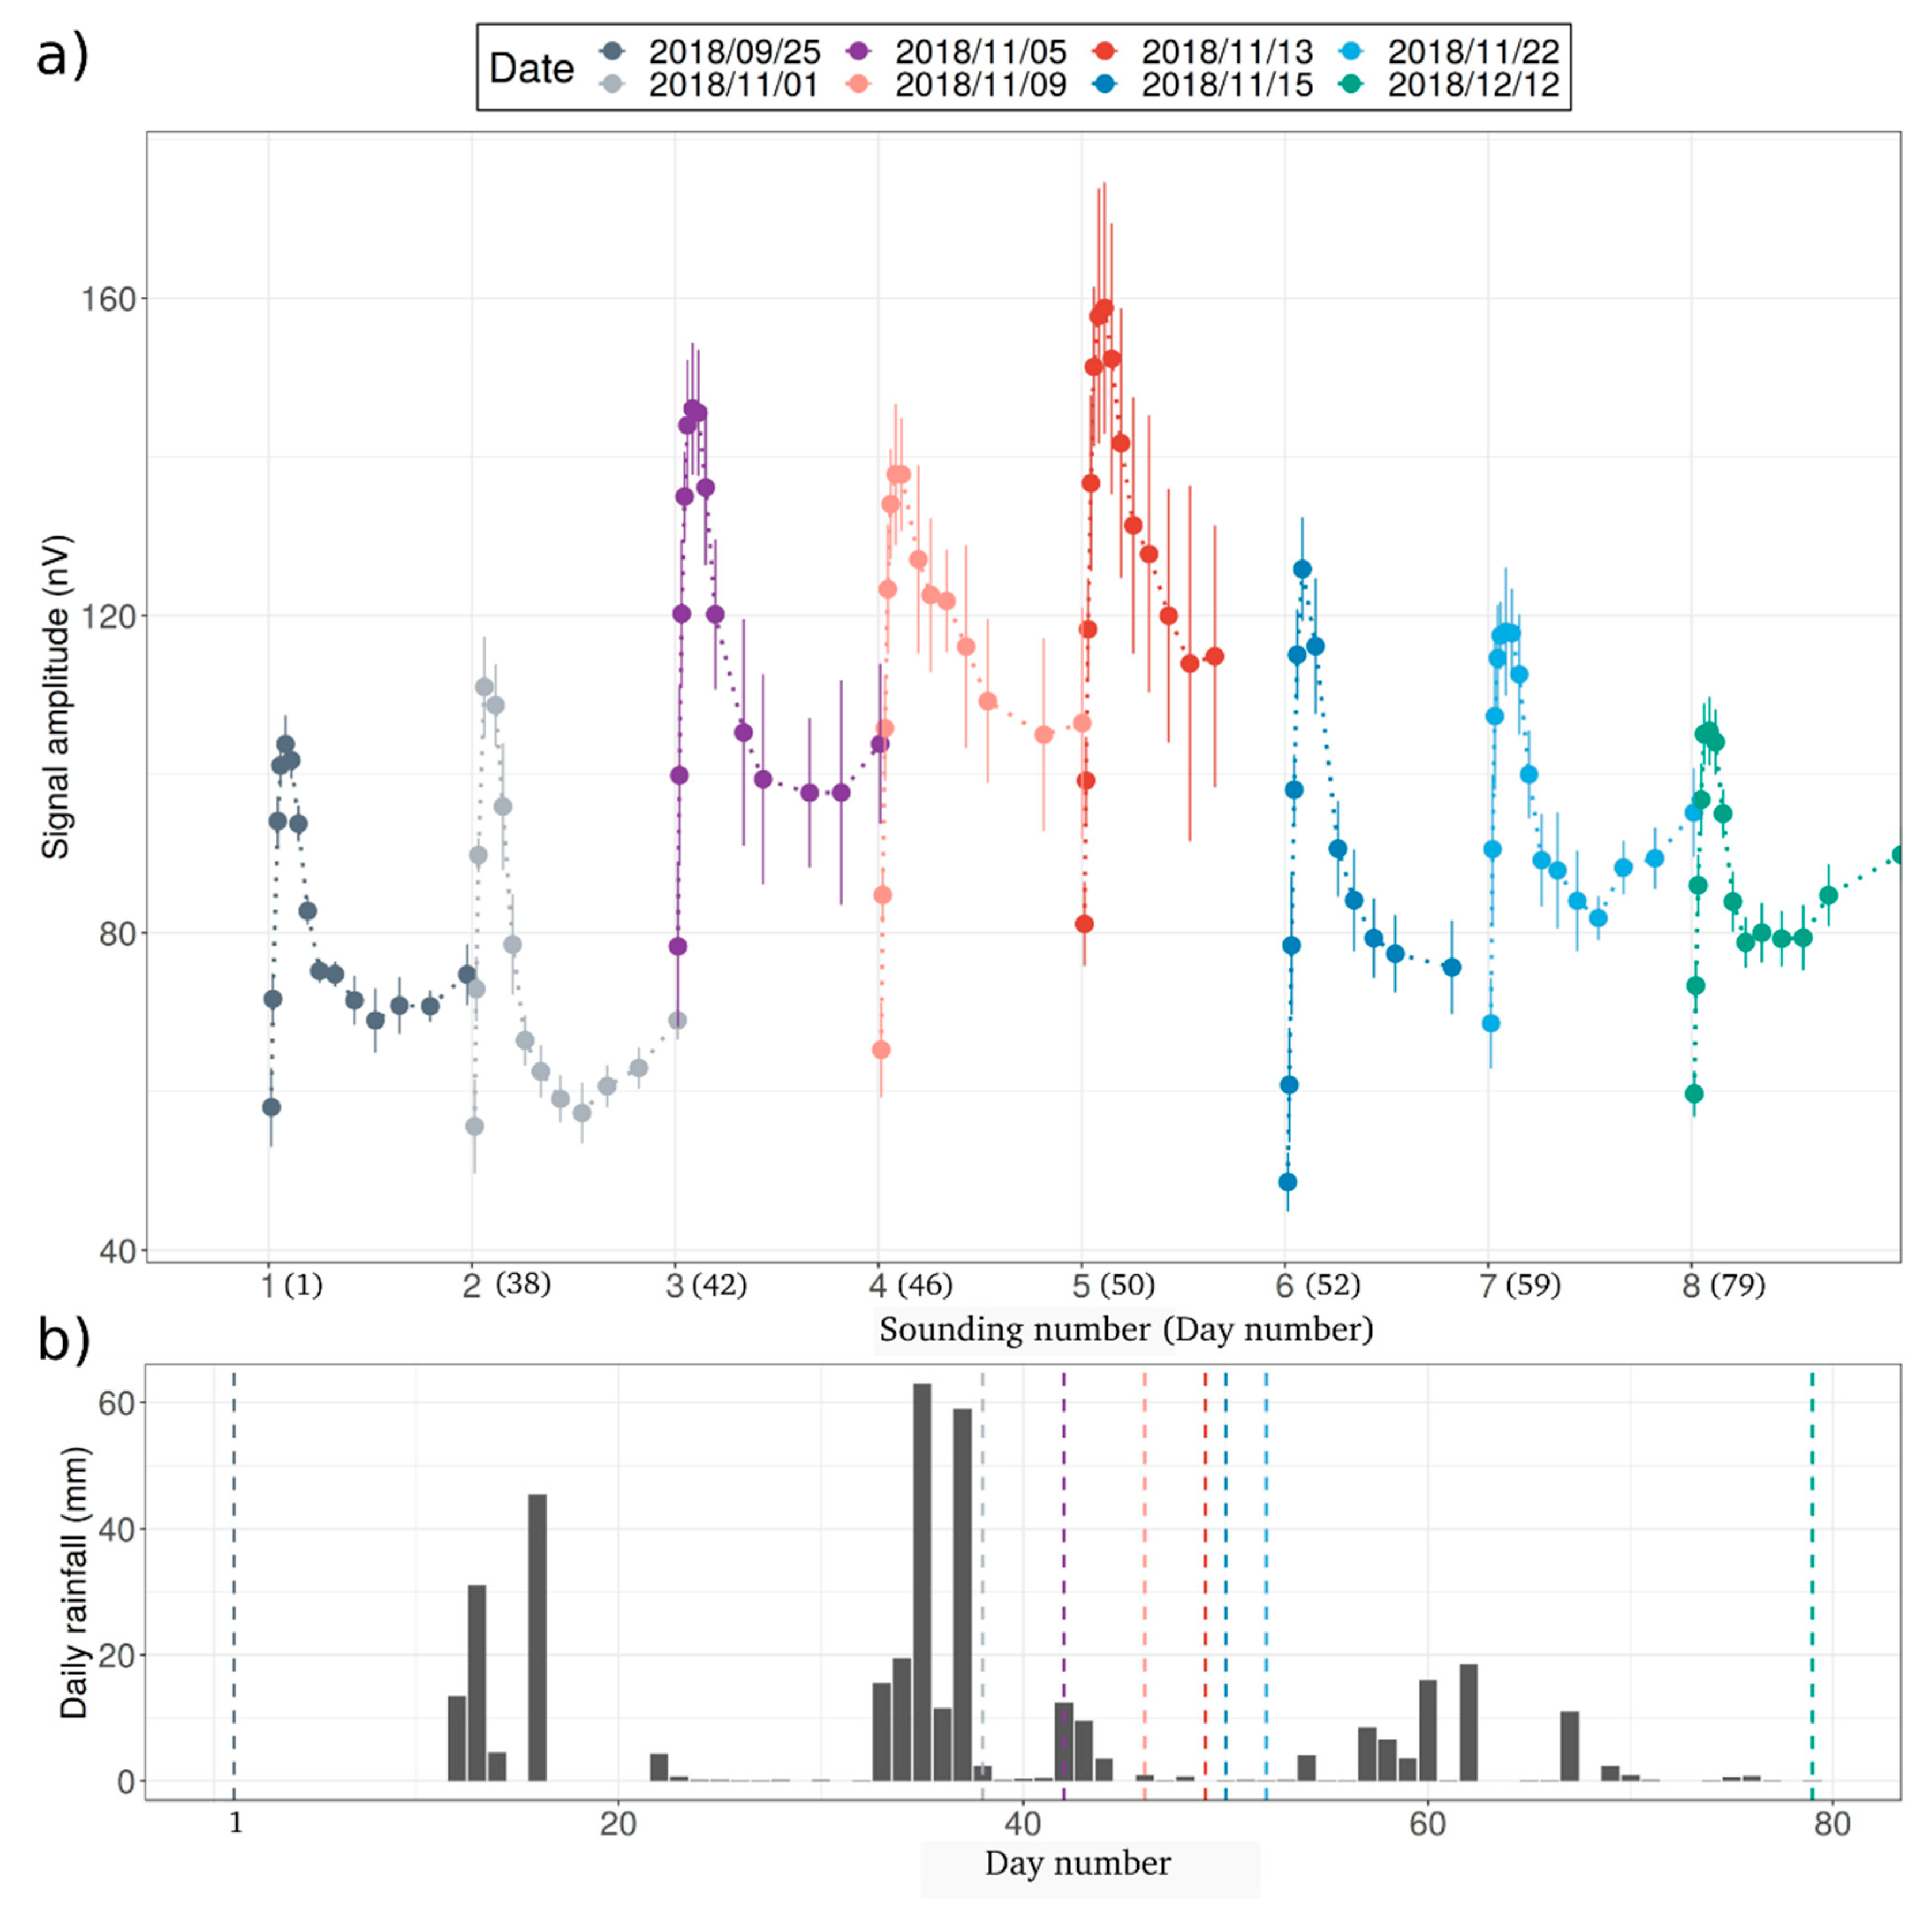
Figure 2 shows the amplitude of the SNMR signal as a function of the energizing pulse for all soundings. Soundings 1 and 2 have relatively low amplitudes compared to the other soundings, with maximums reaching 100 nV. The amplitudes of soundings 3, 4, and 5 are stronger with maximums reaching 140 to 160 nV. A progressive decrease in amplitude was found in soundings 6, 7, and 8. SNMR amplitudes of sounding 8 are similar to those of sounding 1, set apart from the highest energizing pulses (Figure 3).
The initial SNMR amplitudes are related to SNMR water content. The above-mentioned variations thus indicate a strong variability of water content during the monitoring period. Variations in SNMR amplitudes are consistent with the expected dynamics of the water content after a rainy event: a depleted state with low SNMR amplitudes (soundings 1 and 2) was followed by a well-watered state (soundings 3, 4, and 5) and then by progressive drainage of the system (soundings 6, 7, and 8) (Figure 2).
The amplitudes of SNMR signals provided some additional insights into this processes:
- The lowest amplitudes for all energizing pulses, and therefore the lowest water content, were observed for sounding 2, which was performed the day after the end of the rainy event. An undistinguishable impact of rain water on the SNMR signal, despite the high rainfall, means that most of the infiltrated water remains close to the surface. The characteristic time of vertical transfer to the depth of sensitivity of the SNMR signals (typically a few meters) is thus a few days.
- Similar amplitudes and thus water content for soundings 3, 4, and 5 after heavy rain had stopped (cumulated rainfall is 28 mm over this period) indicate a saturated medium during this time span, from 5 up to 13 days after heavy rainfall had stopped. In this hydrogeological context, persistent saturation could be due to either slow infiltration or to lateral inflow/outflow due to the few transmissive stratigraphic features.
- Noticeable draining of the medium starts at day 15 (sounding 6).
- Return to the initial state is reached more than 42 days after the end of the rainfall event.
Measured transverse relaxation times (T2*) are given in Table 1. The lowest values are associated with soundings with the highest water content, which is unusual. T2* depends on the mean distance between the water molecule and its external environment: the shorter the distance, the shorter the relaxation times [23]. T2* is thus used as a proxy for pore size and saturation. In a time-lapse monitoring in the UZ context, it may be expected that an increase in water content would be associated with an increase in saturation, and thus with the highest measured T2*. Various interpretations may be proposed for our observations:
- Increased UZ water content after a rainfall event is associated with saturation of a finer pore network, which may counterbalance the saturation of the pore network containing water in the depleted state. Infiltrated water is assumed to further invade pores that were previously only partially filled with air, leading to an increase in T2*. However, infiltration may also lead to partial or full saturation of pore networks with different characteristics and possibly of smaller dimensions (yielding lower T2*). The resulting T2* of the investigated volume would therefore be lower than that observed in a depleted state. Related hydrogeological context could be that of a superposition of carbonate layers with alternating pore size properties.
- The arrival of suspended particulates may decrease the mean distance between the water molecule and its external environment. High intensity rainfall events are commonly reported to trigger the unclogging of karst conduits. However, this explanation may not be compatible with the observed dynamics of T2*—turbidity should remain high for a week and then drop abruptly, whereas smoother dynamics are usually observed.
4.2. SNMR Limitations
It is important to highlight the limitations of the SNMR monitoring in this context. The first limitation is related to the ambient electromagnetic noise that can seriously decrease the SNMR data quality. This ambient noise may be either natural or anthropogenic, and it can vary in time and in space. Even though it can be treated with a post-processing procedure, ambient noise can be a severe limitation to the success of time-lapse SNMR measurements.
The second limitation is the duration of the SNMR sounding in addition to the integrated nature of the method. With an average of 6 h for a complete sounding, over a large investigated underground volume, SNMR does not have the sensitivity to monitor the rapid circulation that may occur within fine karst features, and the signal could be affected by the lateral inhomogeneity of the medium.
The third limitation is the nature of the event on this type of environmental setting. During an intense rain event, there is a substantial amount of water that runs off or moves laterally and close beneath the surface, which cannot be “seen” by SNMR due to its limited resolution close to the surface.
5. Conclusions and Perspectives
Our data provide the first SNMR monitoring of infiltration dynamics in a karst UZ on the event time scale. Eight SNMR soundings were conducted over 79 days. The obtained results demonstrated the applicability and the effectiveness of SNMR for investigating the hydrogeological processes of karst UZs at a time scale of a few days. Non-inverted data do not allow quantification of groundwater properties, but they provide a valuable insight into UZ infiltration dynamics. Five days after the rain event, the infiltrated water led to an increase in the SNMR signal. The draining process was monitored 15 days after the main event. Finally, the SNMR signal returned close to the observed initial state after 42 days.
The next steps of this study are to quantify water contents using a time-lapse data inversion code, which is currently under development and validation. Firstly, we will perform a time-lapse inversion over a large monitoring period (more than 2 years of SNMR measurements). Hydrogeological processes are better documented at this time scale, which will make it possible to assess inversion consistency. Secondly, we will perform time-lapse inversion for the presented period of time to quantify the SNMR water content and provide a comprehensive hydrogeological interpretation of infiltration dynamics after a rain event. As a latest step, we will consider using this SNMR water content to constrain a lumped model of water infiltration through the UZ on this site.
Author Contributions
Conceptualization, N.M. and K.C.; methodology, K.C. and N.M.; software, A.L.; validation, A.L., N.M., and K.C.; formal analysis, N.M., K.C., and A.L.; investigation, S.D.C., N.M., and K.C.; writing—original draft preparation, N.M., K.C., and S.D.C.; project administration, N.M. and K.C.; funding acquisition, K.C. and N.M. All authors have read and agreed to the published version of the manuscript.
Funding
The presented research was co-funded by Avignon University and the H+ observatory network (http://hplus.ore.fr/en/).
Acknowledgments
The authors would like to express their gratitude to the LSBB team for their technical and logistic help. This work was performed within the framework of the FDV/LSBB observation site, which is part of the OZCAR Critical Zone network (https://www.ozcar-ri.org/fr/ozcar-3/), H+ observatory network (http://hplus.ore.fr/en/), and KARST observatory network (http://sokarst.org/).
Conflicts of Interest
The authors declare no conflict of interest.
References
- Ford, D.; Williams, P. Karst Hydrogeology and Geomorphology; John Wiley & Sons: Hoboken, NJ, USA, 2007; p. 562. [Google Scholar]
- Emblanch, C.; Blavoux, B.; Puig, J.-M.; Mudry, J. Dissolved organic carbon of infiltration within the autogenic Karst Hydrosystem. Geophys. Res. Lett. 1998, 25, 1459–1462. [Google Scholar] [CrossRef] [Green Version]
- Carrière, S.D.; Chalikakis, K.; Danquigny, C.; Davi, H.; Mazzilli, N.; Ollivier, C.; Emblanch, C. The role of porous matrix in water flow regulation within a karst unsaturated zone: An integrated hydrogeophysical approach. Hydrogeol. J. 2016, 24, 1905–1918. [Google Scholar] [CrossRef] [Green Version]
- Watlet, A.; Kaufmann, O.; Triantafyllou, A.; Poulain, A.; Chambers, J.E.; Meldrum, P.I.; Wilkinson, P.B.; Hallet, V.; Quinif, Y.; Van Ruymbeke, M.; et al. Imaging groundwater infiltration dynamics in the karst vadose zone with long-term ERT monitoring. Hydrol. Earth Syst. Sci. 2018, 22, 1563–1592. [Google Scholar] [CrossRef] [Green Version]
- Poulain, A.; Watlet, A.; Kaufmann, O.; Van Camp, M.J.; Jourde, H.; Mazzilli, N.; Rochez, G.; Deleu, R.; Quinif, Y.; Hallet, V. Assessment of groundwater recharge processes through karst vadose zone by cave percolation monitoring. Hydrol. Process. 2018, 32, 2069–2083. [Google Scholar] [CrossRef]
- Guérin, R. Borehole and surface-based hydrogeophysics. Hydrogeol. J. 2005, 13, 251–254. [Google Scholar] [CrossRef]
- Chalikakis, K.; Plagnes, V.; Guerin, R.; Valois, R.; Bosch, F.P. Contribution of geophysical methods to karst-system exploration: An overview. Hydrogeol. J. 2011, 19, 1169–1180. [Google Scholar] [CrossRef]
- Vouillamoz, J.-M.; Legchenko, A.; Albouy, Y.; Bakalowicz, M.; Baltassat, J.-M.; Al-Fares, W. Localization of Saturated Karst Aquifer with Magnetic Resonance Sounding and Resistivity Imagery. Ground Water 2003, 41, 578–586. [Google Scholar] [CrossRef]
- Boucher, M.; Girard, J.-F.; Legchenko, A.; Baltassat, J.-M.; Dorfliger, N.; Chalikakis, K. Using 2D inversion of magnetic resonance soundings to locate a water-filled karst conduit. J. Hydrol. 2006, 330, 413–421. [Google Scholar] [CrossRef] [Green Version]
- Girard, J.-F.; Boucher, M.; Legchenko, A.; Baltassat, J.-M. 2D magnetic resonance tomography applied to karstic conduit imaging. J. Appl. Geophys. 2007, 63, 103–116. [Google Scholar] [CrossRef]
- Legchenko, A.; Ezersky, M.; Camerlynck, C.; Al-Zoubi, A.; Chalikakis, K.; Girard, J.-F. Locating water-filled karst caverns and estimating their volume using magnetic resonance soundings. Geophysics 2008, 73, G51–G61. [Google Scholar] [CrossRef]
- Pérez-Bielsa, C.; Lambán, L.J.; Plata, J.L.; Rubio, F.; Soto, R. Characterization of a karstic aquifer using magnetic resonance sounding and electrical resistivity tomography: A case-study of Estaña Lakes (northern Spain). Hydrogeol. J. 2012, 20, 1045–1059. [Google Scholar] [CrossRef]
- Mazzilli, N.; Boucher, M.; Chalikakis, K.; Legchenko, A.; Jourde, H.; Champollion, C. Contribution of magnetic resonance soundings for characterizing water storage in the unsaturated zone of karst aquifers. Geophysics 2016, 81, WB49–WB61. [Google Scholar] [CrossRef] [Green Version]
- Fores, B.; Champollion, C.; Mainsant, G.; Albaric, J.; Fort, A. Monitoring Saturation Changes with Ambient Seismic Noise and Gravimetry in a Karst Environment. Vadose Zone J. 2018, 17, 170163. [Google Scholar] [CrossRef] [Green Version]
- Legchenko, A.; Baltassat, J.-M.; Duwig, C.; Boucher, M.; Girard, J.-F.; Soruco, A.; Beauce, A.; Mathieu, F.; Legout, C.; Descloitres, M.; et al. Time-lapse magnetic resonance sounding measurements for numerical modeling of water flow in variably saturated media. J. Appl. Geophys. 2020, 175, 103984. [Google Scholar] [CrossRef]
- Carrière, S.D.; Danquigny, C.; Davi, H.; Chalikakis, K.; Ollivier, C.; Martin-StPaul, N.K.; Emblanch, C. Process-Based Vegetation Models Improve Karst Recharge Simulation Under Mediterranean Forest. In EuroKarst 2016, Neuchâtel; Springer: Berlin, Germany, 2017; pp. 109–116. [Google Scholar]
- Masse, J.-P.; Fenerci-Masse, M. Drowning discontinuities and stratigraphic correlation in platform carbonates. The late Barremian–early Aptian record of southeast France. Cretac. Res. 2011, 32, 659–684. [Google Scholar] [CrossRef]
- Carrière, S.D.; Chalikakis, K.; Sénéchal, G.; Danquigny, C.; Emblanch, C. Combining Electrical Resistivity Tomography and Ground Penetrating Radar to study geological structuring of karst Unsaturated Zone. J. Appl. Geophys. 2013, 94, 31–41. [Google Scholar] [CrossRef]
- Léonide, P.; Fournier, F.; Reijmer, J.J.G.; Vonhof, H.B.; Borgomano, J.; Dijk, J.; Rosenthal, M.; Van Goethem, M.; Cochard, J.; Meulenaars, K. Diagenetic patterns and pore space distribution along a platform to outer-shelf transect (Urgonian limestone, Barremian–Aptian, SE France). Sediment. Geol. 2014, 306, 1–23. [Google Scholar] [CrossRef]
- Fournier, F.; Pellerin, M.; Villeneuve, Q.; Teillet, T.; Hong, F.; Poli, E.; Borgomano, J.; Léonide, P.; Hairabian, A. The equivalent pore aspect ratio as a tool for pore type prediction in carbonate reservoirs. AAPG Bull. 2018, 102, 1343–1377. [Google Scholar] [CrossRef]
- Tendil, A.J.-B.; Frau, C.; Léonide, P.; Fournier, F.; Borgomano, J.; Lanteaume, C.; Masse, J.-P.; Massonnat, G.; Rolando, J.-P. Platform-to-basin anatomy of a Barremian–Aptian Tethyan carbonate system: New insights into the regional to global factors controlling the stratigraphic architecture of the Urgonian Provence platform (southeast France). Cretac. Res. 2018, 91, 382–411. [Google Scholar] [CrossRef]
- Schirov, M.; Legchenko, A.; Creer, G. New direct non-invasive ground water detection technology for Australia. Expl. Geophys. 1991, 22, 333–338. [Google Scholar] [CrossRef]
- Legchenko, A.; Valla, P. A review of the basic principles for proton magnetic resonance sounding measurements. J. Appl. Geophys. 2002, 50, 3–19. [Google Scholar] [CrossRef]
- Legchenko, A.; Baltassat, J.-M.; Bobachev, A.; Martin, C.; Robain, H.; Vouillamoz, J.-M. Magnetic Resonance Sounding Applied to Aquifer Characterization. Ground Water 2004, 42, 363–373. [Google Scholar] [CrossRef] [PubMed]
- Legchenko, A. Magnetic Resonance Imaging for Groundwater; Wiley-ISTE: Hoboken, NJ, USA, 2013; ISBN 978-1-84821-568-9. [Google Scholar]
Figure 1.
Location of (A) test site in France; (B) in the Fontaine de Vaucluse recharge area; (C) schematic cross-section across LSBB; (D) overview of the respective locations of the surface NMR (SNMR) loop and LSBB tunnel (coordinate system: Lambert II étendu); isohypses every 10 m (http://www.geoportail.gouv.fr).

Figure 2.
Temporal variability in the SNMR signal. (a) Signal amplitude as a function of the energizing pulse for all soundings. (b) Daily rainfall. Days are numbered since the 1st sounding was performed (the dotted vertical lines represent the 8 SNMR soundings).
Figure 2.
Temporal variability in the SNMR signal. (a) Signal amplitude as a function of the energizing pulse for all soundings. (b) Daily rainfall. Days are numbered since the 1st sounding was performed (the dotted vertical lines represent the 8 SNMR soundings).

Figure 3.
Temporal variability in the SNMR signal. Signal amplitude as a function of the energizing pulse, for 3 selected soundings (1, 5, and 8).
Figure 3.
Temporal variability in the SNMR signal. Signal amplitude as a function of the energizing pulse, for 3 selected soundings (1, 5, and 8).


Table 1.
Synthesis of SNMR investigations.
| Sounding Number | Date | Day Number | Cumulated Rainfall (mm) since Beginning of the Experiment | Cumulated Rainfall (mm) since Last Sounding Was Performed | Average Stacks Number | Average Signal-to-Noise (S/N) Ratio | Mean T2* (ms) | Average Standard Error on T2* Estimate (ms) |
|---|---|---|---|---|---|---|---|---|
| 1 | 25 September 2018 | 1 | 0 | - | 203 | 5.7 | 132 | 5 |
| 2 | 1 November 2018 | 38 | 271.5 | 271.5 | 356 | 3.4 | 161 | 10 |
| 3 | 5 November 2018 | 42 | 285 | 13.5 | 400 | 2.1 | 83 | 4 |
| 4 | 9 November 2018 | 46 | 298.9 | 13.9 | 350 | 3.2 | 95 | 5 |
| 5 | 13 November 2018 | 50 | 299.8 | 0.9 | 400 | 1.9 | 86 | 5 |
| 6 | 15 November 2018 | 52 | 300.1 | 0.3 | 298 | 3.0 | 151 | 13 |
| 7 | 22 November 2018 | 59 | 323.3 | 23.2 | 400 | 4.1 | 108 | 5 |
| 8 | 12 December 2018 | 79 | 374.3 | 51 | 400 | 14.2 | 128 | 5 |
Publisher’s Note: MDPI stays neutral with regard to jurisdictional claims in published maps and institutional affiliations. |
© 2020 by the authors. Licensee MDPI, Basel, Switzerland. This article is an open access article distributed under the terms and conditions of the Creative Commons Attribution (CC BY) license (http://creativecommons.org/licenses/by/4.0/).
Share and Cite
MDPI and ACS Style
Mazzilli, N.; Chalikakis, K.; Carrière, S.D.; Legchenko, A. Surface Nuclear Magnetic Resonance Monitoring Reveals Karst Unsaturated Zone Recharge Dynamics during a Rain Event. Water 2020, 12, 3183. https://doi.org/10.3390/w12113183
AMA Style
Mazzilli N, Chalikakis K, Carrière SD, Legchenko A. Surface Nuclear Magnetic Resonance Monitoring Reveals Karst Unsaturated Zone Recharge Dynamics during a Rain Event. Water. 2020; 12(11):3183. https://doi.org/10.3390/w12113183
Chicago/Turabian StyleMazzilli, Naomi, Konstantinos Chalikakis, Simon D. Carrière, and Anatoly Legchenko. 2020. "Surface Nuclear Magnetic Resonance Monitoring Reveals Karst Unsaturated Zone Recharge Dynamics during a Rain Event" Water 12, no. 11: 3183. https://doi.org/10.3390/w12113183
Note that from the first issue of 2016, this journal uses article numbers instead of page numbers. See further details here.