1. Introduction
Conflicts over transboundary river sharing due to increases in demand from growing populations and urbanization to produce food and energy are rapidly growing in many basins [
1]. Additionally, the impact of climate change is threatening the supply availability of water resources to a significant degree in many locations [
2,
3]. This imbalance of demand and supply can lead to water insecurity and drive riparian states to engage in unilateral development rather than follow shared water principles, particularly when no prior agreements exist. Clearly, development plans that benefit a given state and potentially result in reduced water availability to other riparian states may be seen as a threat. For this reason, disputes arise among basin countries either to secure their water quota or maintain the status quo. The current conflict over utilization of the Nile River between Ethiopia and Egypt is a prime illustration of this situation.
To settle such kind of controversies associated with border crossing rivers water utilization, the necessity of properly executing international law principles is unquestionable [
4]. Among many legal instruments discussed in the next section, the recently ratified and enforced “the 1997 UN Convention on the Law of Non-navigational Uses of International Watercourses (UNWC)” can also be applied. This law is divided by seven parts that contain 37 articles. Particularly, when Article 5 of Part II vividly states the principle of equitable and reasonable water utilization, Article 6 of the convention details relevant factors that should be taken into account to allocate the water in the absence of agreement between riparian countries [
5].
However, as M. Franck [
6] stated, although a list of criteria or factors is essential for implementing the principle of equitable and reasonable utilization, the seven factors categorized under Article 6 of the UNWC below lack measurability. These factors are;
Geographic, hydrographic, hydrological, climatic, ecological, and other natural characteristics;
Social and economic needs of states;
The population dependent on the watercourse in each state;
The effects of the use or allocation by one state on other states;
Existing and potential uses of the watercourse;
Conservation, protection, development, and economic measures of watercourse use and associated costs; and
The availability of alternatives, of comparable value, to a particular planned or existing use.
The difficulty of measuring these broad factors in terms of quantity or specific units also casts doubts on its applicability and interpretation [
7].
Only a few studies have addressed describing these factors with measurable indicators. For example, Beaumont [
8] suggested two indicators, namely relative flow contribution and prior appropriation, to apply the principle of equitable and reasonable water sharing on transboundary rivers. Ziad and Bassam [
9] also proposed nine indicators for the Jordan River basin to allocate water between Israel, Jordan, Palestine, Syria, and Lebanon. With the addition of water quality and ecological variables, a study by Kampragou, et al. [
10] proposed 13 additional indicators for equitable water allocation in the Nestos River basin. Although the indicators from these studies provide insight into describing factors in Article 6 of the UNWC, other studies have indicated a lack of consensus among multidisciplinary experts on proposed indicators. Findings from a study by Fariba, et al. [
11] on the Sirwan-Diyala River between Iran and Iraq also lacked showing the adequacy of the indicators, both in terms of incorporating the conflicting interests of watercourse states and the scope of all factors.
From the above studies, one can see that the indicators suggested by individual studies are prone to subjective interpretation and open to criticism. The consideration of factors such as environmental, social, economic, and political interests of states have also been disregarded in some studies like that of Beaumont [
8]. Moreover, the applicability of specific indicators also varies between locations, and applying only a few variables may not be sufficient to fully consider all dynamics.
Therefore, for a river basin such as the Nile, where only two downstream countries fully control the water based on the 1929 and 1959 colonial treaties and disagreements escalate from time to time [
12,
13,
14,
15,
16,
17], implementing the principle of equitable and reasonable utilization by identifying measurable indicators is warranted. If not, the Declaration of Principles (DoP) agreed upon in 2015 by Egypt, Ethiopia, and Sudan to utilize the river based on equitable and reasonable sharing remains unfunctional [
18].
For this purpose, this study identified and evaluated appropriate indicators for factors mentioned in the UNWC to allocate the Nile River in an equitable and reasonable manner among watercourse states.
2. Background of Legal Instruments
Following the industrial revolution, as countries started scrambling to meet their ever-increasing water demand, international institutions were required to develop water laws to govern transboundary rivers [
19]. Two disparate doctrines were predominantly cited by riparian countries depending on their position. Upstream countries voiced their “absolute sovereign” right to use a river without any restriction, whereas downstream states claimed their right based on the “absolute territorial integrity” principle. Reconciling these two opposing views was difficult, leading to multiple transboundary water allocation conflicts [
20]. In 1956, Dubrovnik developed the “limited sovereignty and territorial integrity” principle, which later became a base for the emergence of the principle of equitable and reasonable utilization. In 1966, the International Law Association (ILA), a scholarly but nonauthoritative institution, adopted this principle into the Helsinki rule. This guiding rule became one of the fundamental legal instruments for managing transboundary rivers. Specifically, Article 4 of the rule outlines 11 factors necessary for implementing the principle of equitable and reasonable utilization of international rivers. Though many treaties and agreements were based on this rule, neither scholars in the ILA nor the document are recognized by all countries, leaving the agreements nonbinding [
19]. The same is true for the 2004 “Berlin rule,” which was extended after the Helsinki rule by ILA. Although the rule is comprehensive in accounting international environmental law, human rights law and the humanitarian law related to management of all kind of water bodies. Similarly, since countries do not agree to be governed by this rule, it is not effective.
Given the increasing number of transboundary water conflicts, the UN General Assembly assigned legal experts nominated by various countries to carefully evaluate international watercourse laws, which eventually became codified in December 1970. Twenty-seven years later, the “UN Convention on the Law of Non-navigational Uses of International Watercourses (UNWC)” was adopted by the general assembly [
21]. Whereas the convention also accepted most of the Helsinki rules, major modifications were made including restricting navigational use, the separation of surface and ground water resources, and condensing the original 11 factors into 7. After the ratification process, the UNWC entered into force operationally in 2014, now serving as a key legal instrument used by the international court of justice (ICJ) to resolve international water disputes [
20,
22]. The heart of the document is Articles 5–7 detailing the principle of equitable and reasonable utilization.
To highlight the abstract meaning and application of the principle of “equitable and reasonable utilization” mentioned under Article 5 [
23], Rieu-Clarke, et al. [
5] stated that from both procedural and substantive points of view, the term “equity” in international laws implies fairness and justice. Even when UNWC did not exist in its current position, ICJ was applying this interpretation on many international cases, including river basins such as Danube [
24,
25]. When the procedural interpretation focuses on the right of sovereign states, the substantive dimension seeks to ensure distributive justice. However, “equity” does not simply imply dividing the resource into equal portions [
26]. According to McIntyre [
27], “equity” can also be viewed from a natural resource allocation perspective. This includes a matter of ensuring certain levels of fairness between developed and developing countries as well as between current and future generations [
28,
29]. An example of this is the 1992 Rio Declaration [
30]. Among 27 principles, principle-16 of the declaration intended to guide countries future sustainable development based on the “polluter pays principle.” It established a modality in which developed countries support the green economy of developing countries to balance the harm caused by excessive emission of pollutant gases. Similarly, the term “reasonable” refers to the rationale behind the process of balancing various conflicting uses by states, including the state’s development level and other external forces [
5]. Again, reasonability does not necessitate achieving optimum allocation or utilization of advanced technology. Rather, it is a relative consideration of current and future contexts without compromising fairness and justice.
Although this principle is fully integrated into the Nile basin’s Cooperative Framework Agreement (CFA) and Declaration of Principles (DoP), the CFA lacks a two-third vote necessary for ratification (rejection by Egypt and Sudan), and the DoP agreement only focuses on Ethiopia, Sudan, and Egypt in relation to GERD filling and operation, excluding the six white Nile parties [
31,
32]. For this reason, the UN convention based on customary international law and applied by the ICJ was utilized as the legal tool in this study.
3. Methodology and Data
3.1. Study Area
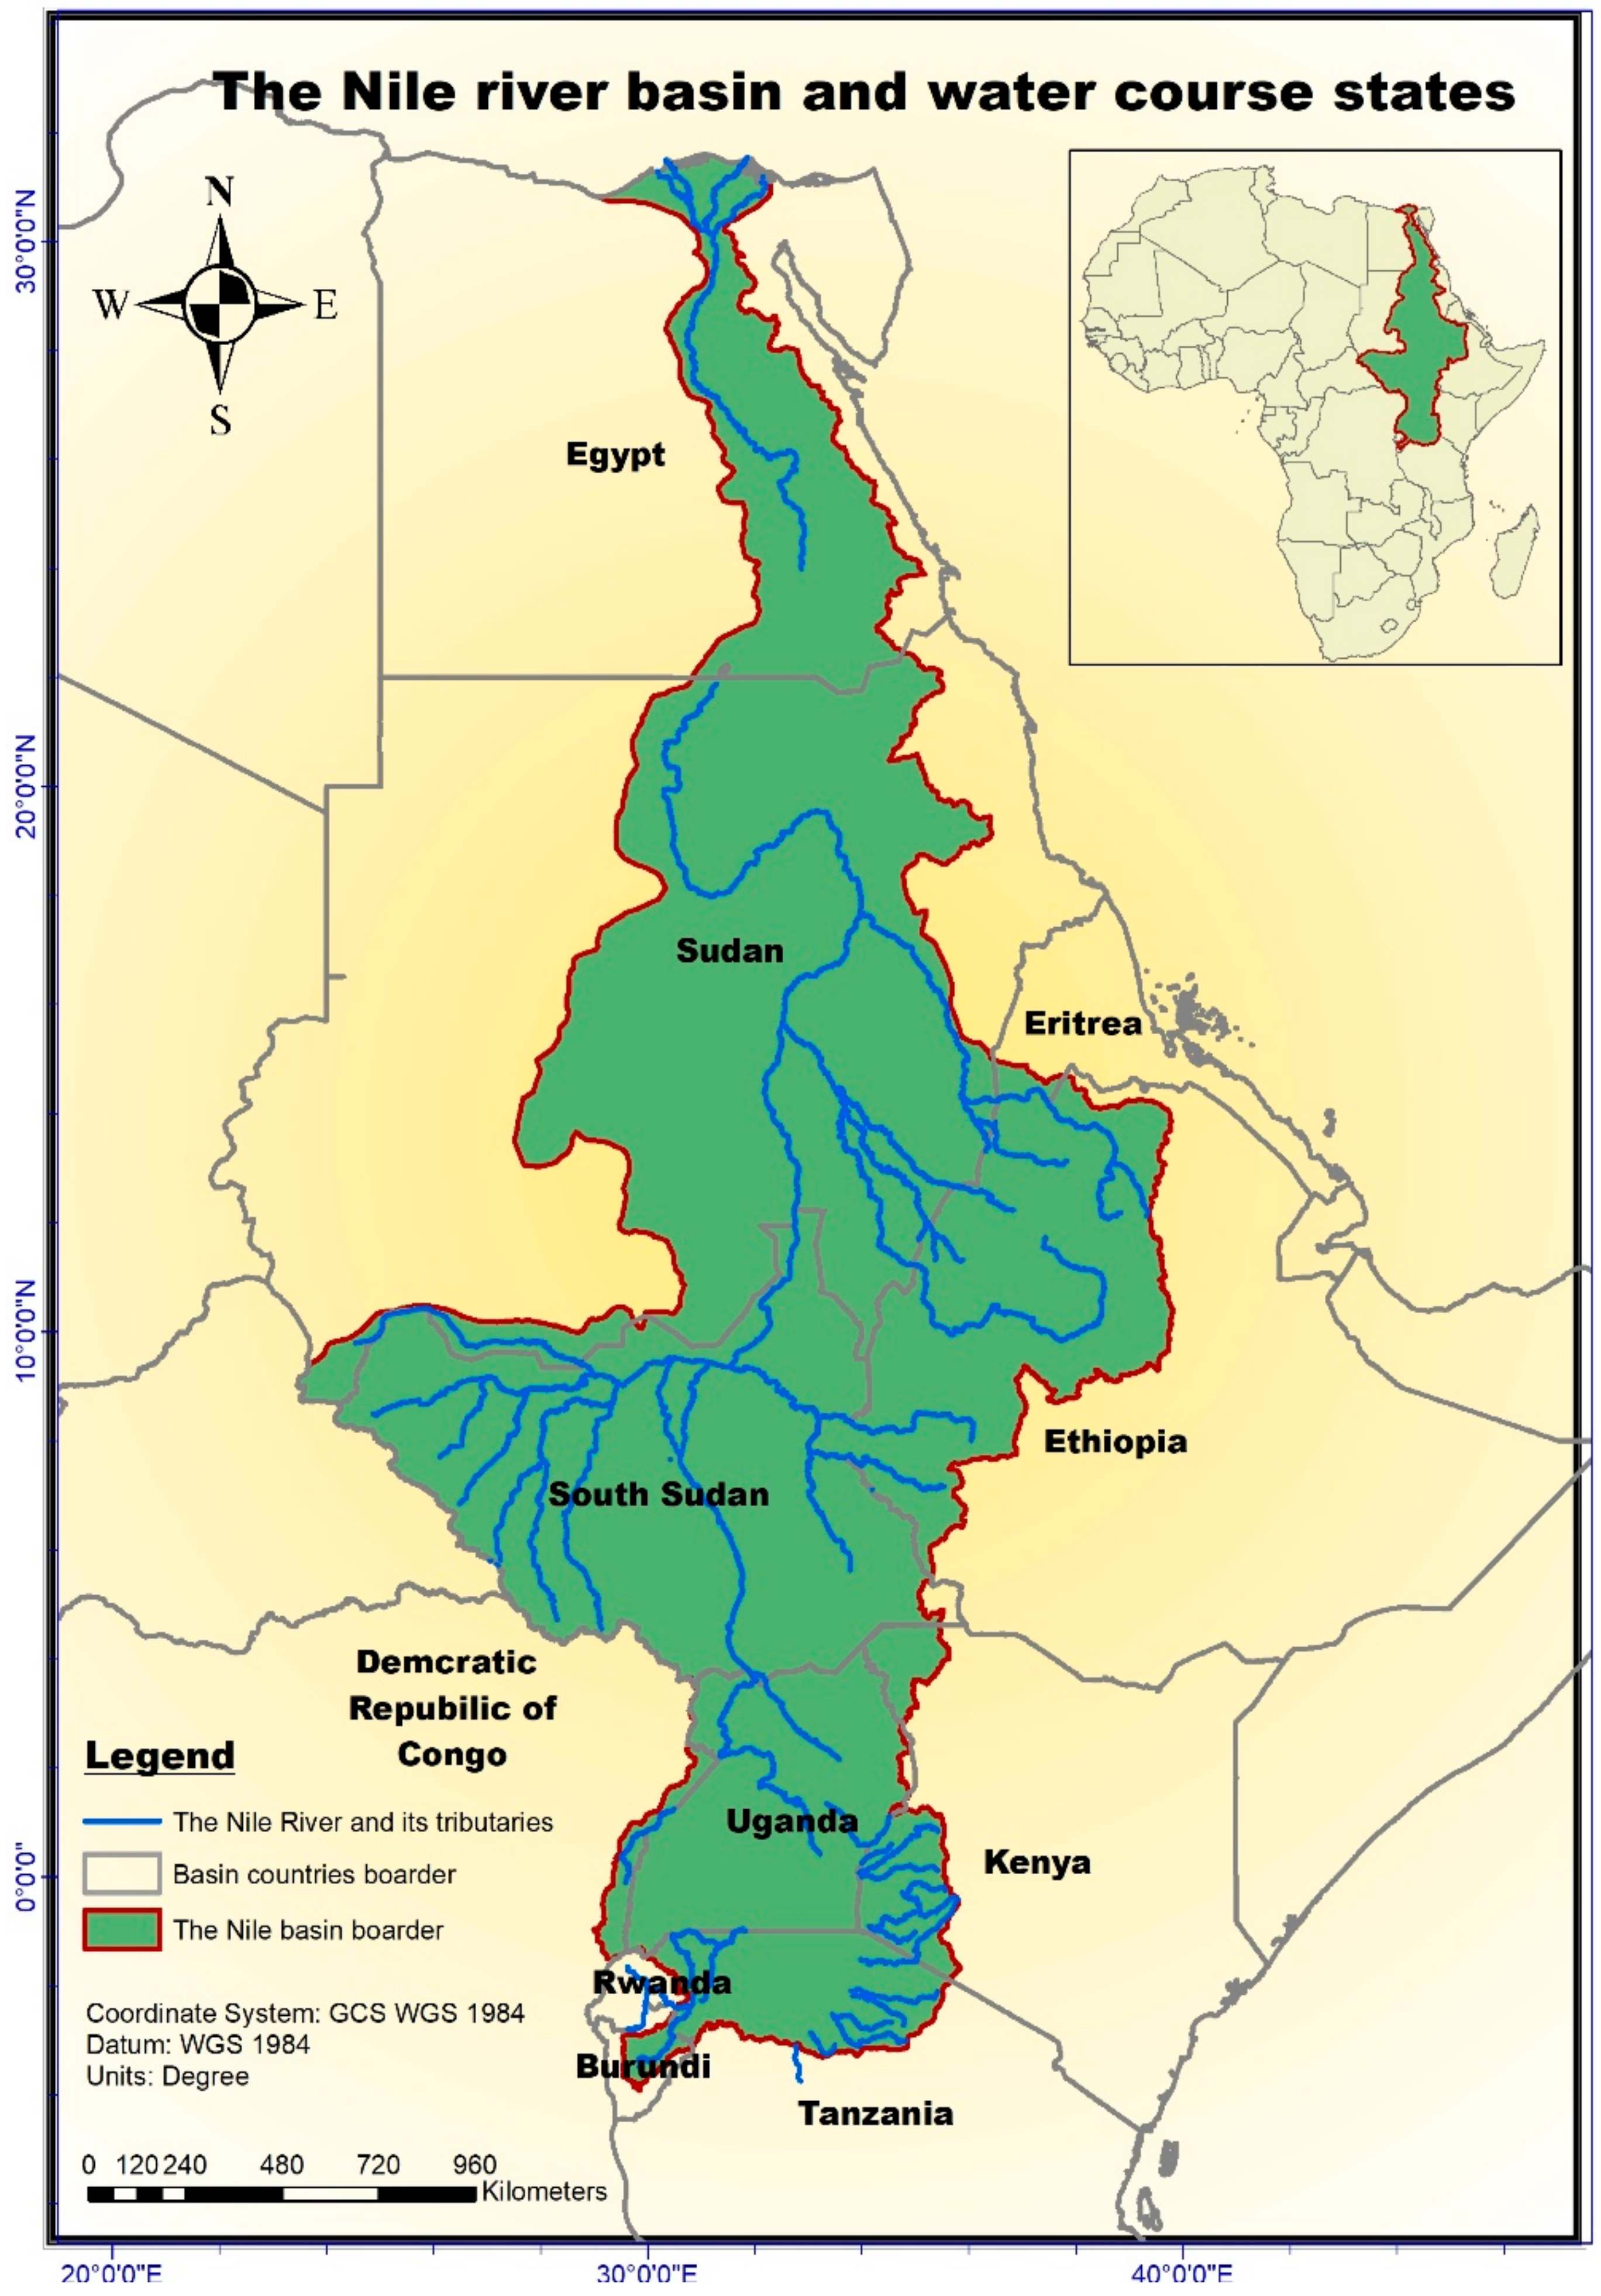
The Nile River is one of the longest rivers in the world, traversing 6853 km. It consists of four major water systems, namely the Blue Nile, Tekeze-Atbara, Baro-Sobat, and the White Nile, before forming the main Nile in Sudan and subsequently flowing north through Egypt into the Mediterranean Sea. The Blue Nile, Baro-Sobat, and Tekeze-Atbara originate in the Ethiopian highlands, contributing 86% of annual flow, leaving the White Nile to contribute 14% from the equatorial African lakes region [
33]. The basin covers 3.2 million km
2, including 11 riparian states, namely Burundi, the Democratic Republic of Congo, Egypt, Eritrea, Ethiopia, Kenya, Rwanda, South Sudan, Sudan, Tanzania, and Uganda (
Figure 1). The basin is home for over 257 million people, with the majority near or below the poverty line [
33,
34,
35].
3.2. Method
In this study, a cross-sectional analytical research design was applied to assess the level of consensus among experts in different professions and geographic locations on the proposed indicators to define the UN convention’s immeasurable factors. For this purpose, an indicator-based questionnaire was selected as the most appropriate and cost-effective method for collecting primary data from relevant experts to capture potential differences in perspectives based on professional background and location (basin vs non-basin, downstream vs upstream, and specific basin country). The selected approach has been applied in similar previous studies. The questionnaire was developed, distributed, and evaluated based on factors from the UNWC, soliciting responses from five continents, to categorize relevance and acceptability of indicators within the Nile region.
3.2.1. Initial Pool of Indicators
Based on Nile River basin hydrographic specifics and socioeconomic characteristics, 75 potential indicators were identified from previous studies and literature, press releases describing negotiations, and websites of international organizations to describe and measure factors contained within Article 6 of the UNWC (
Table S1). The main selection criteria considered for these indicators included the availability, affordability, and feasibility to collect and analyze data; measurability; time bounds; the ability to consider watercourse countries claim; the ability to meet obligatory human rights and environmental rules; and the capacity of the indicators to explain unique features of the basin and basin countries. Also, the monitorability and operational usability was considered. The 75 indicators were categorized under the 7 factors previously described. These indicators were given an identification (I) number from 1 to 75 as shown in
Table S1. The descriptions of the indicators were also provided in the table, along with information of the potential data source and timeframe for the data collection.
3.2.2. Questionnaire Development and Distribution
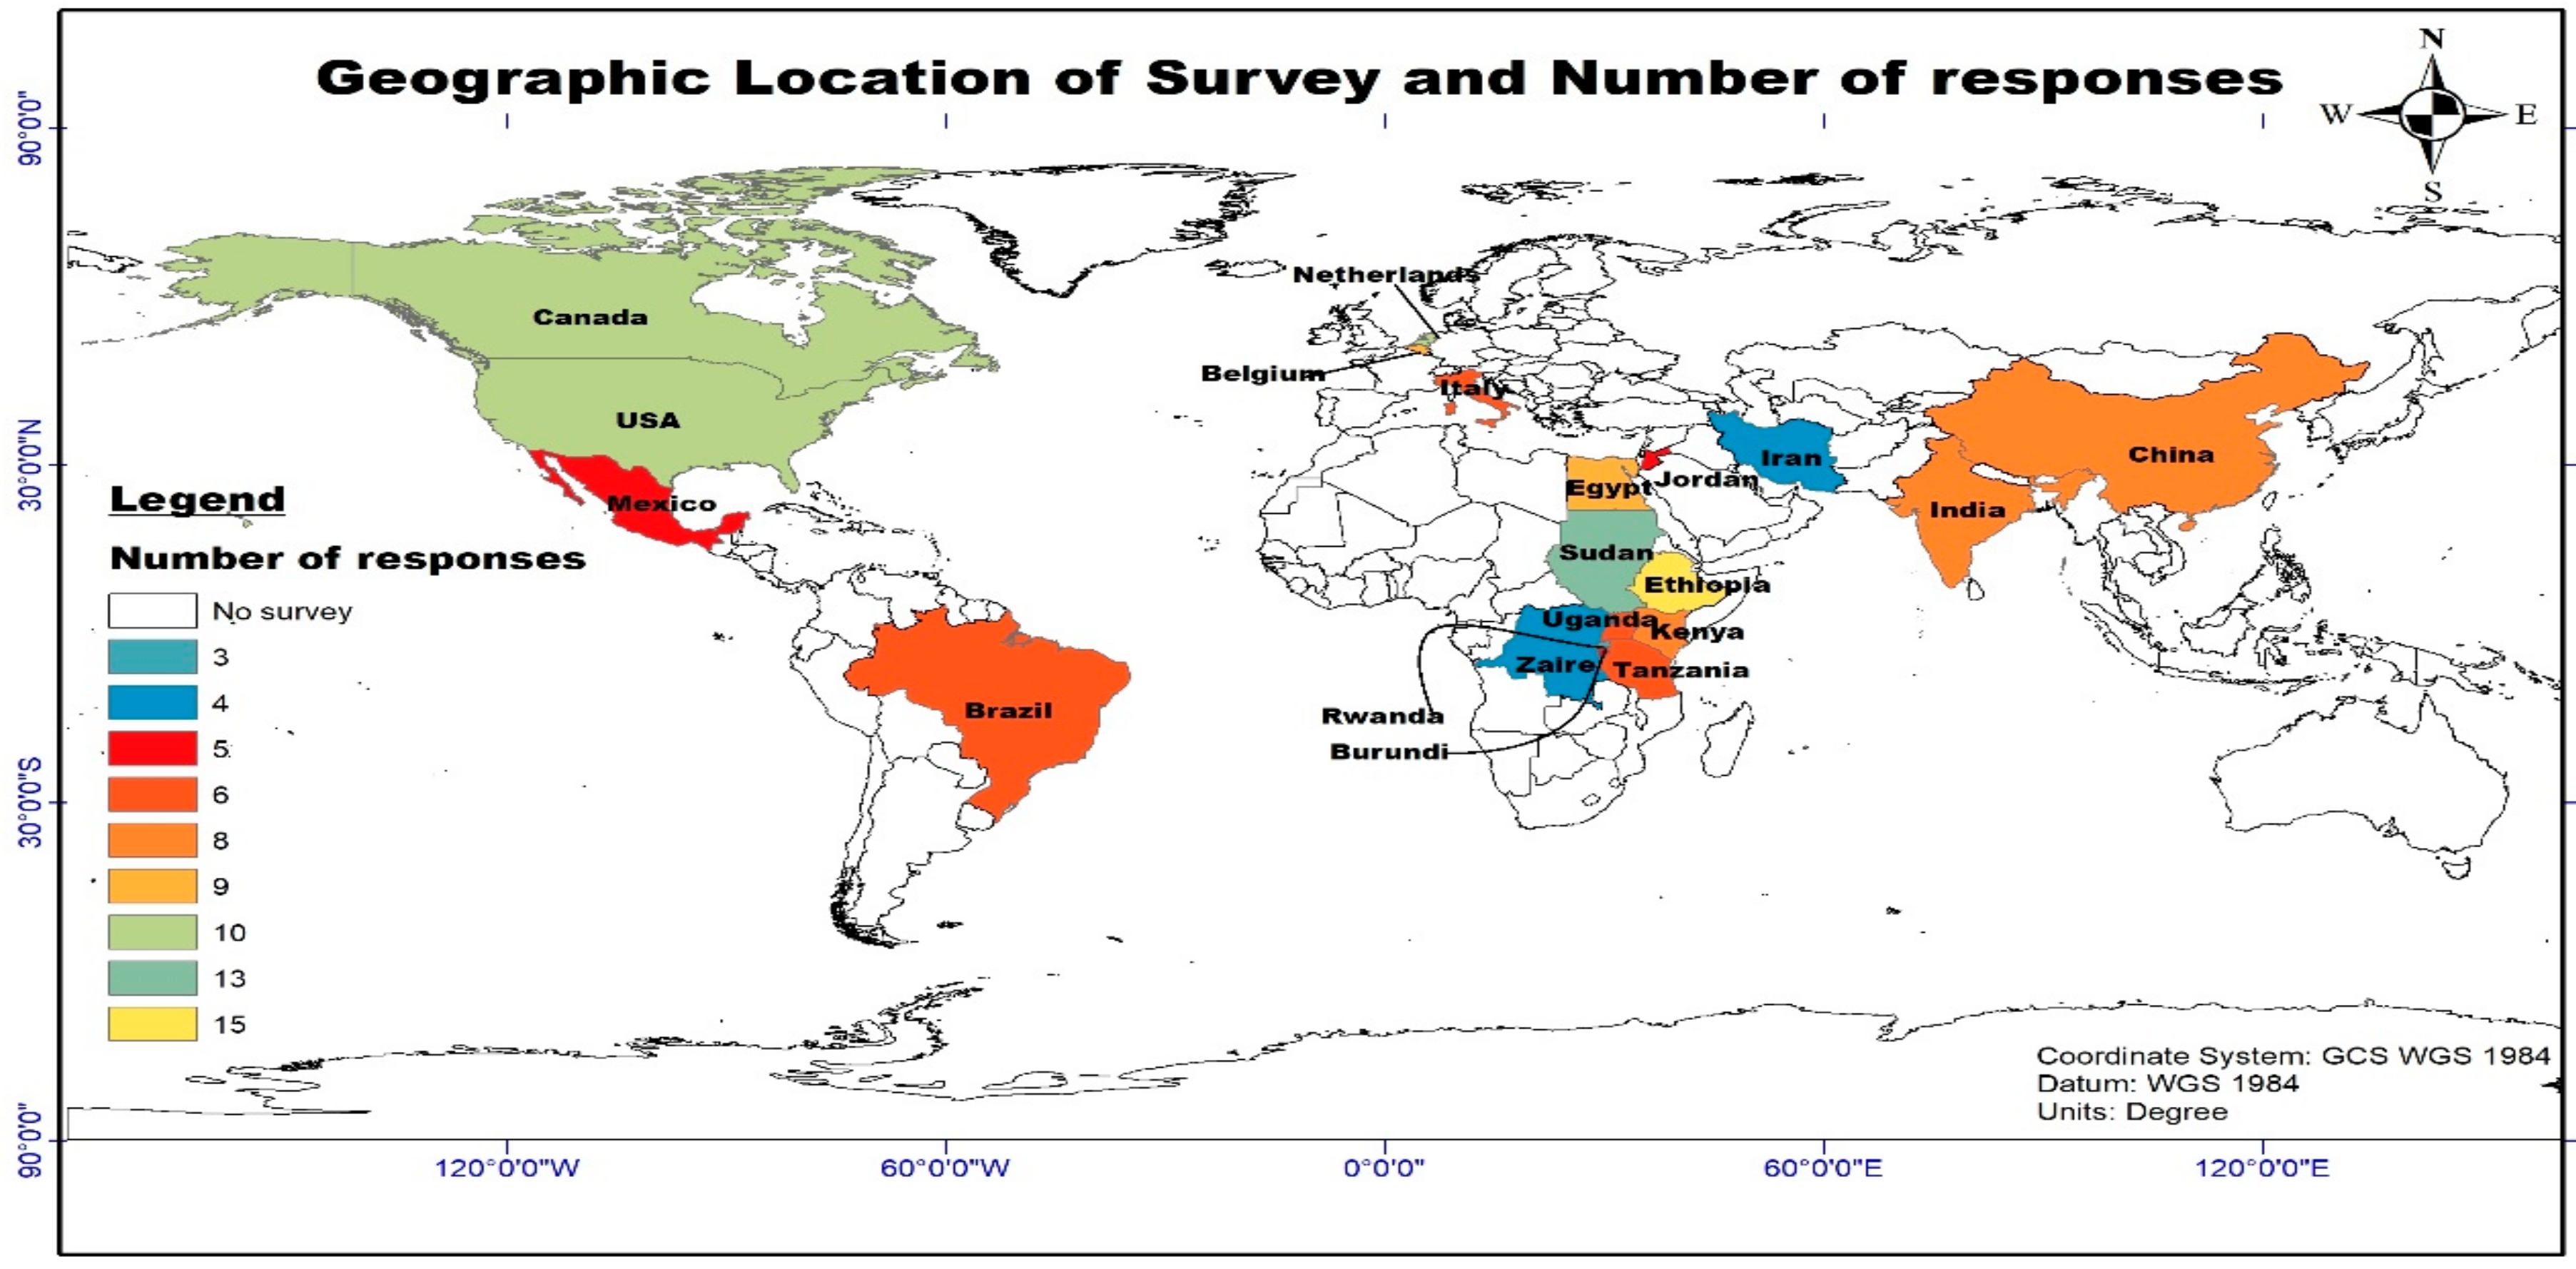
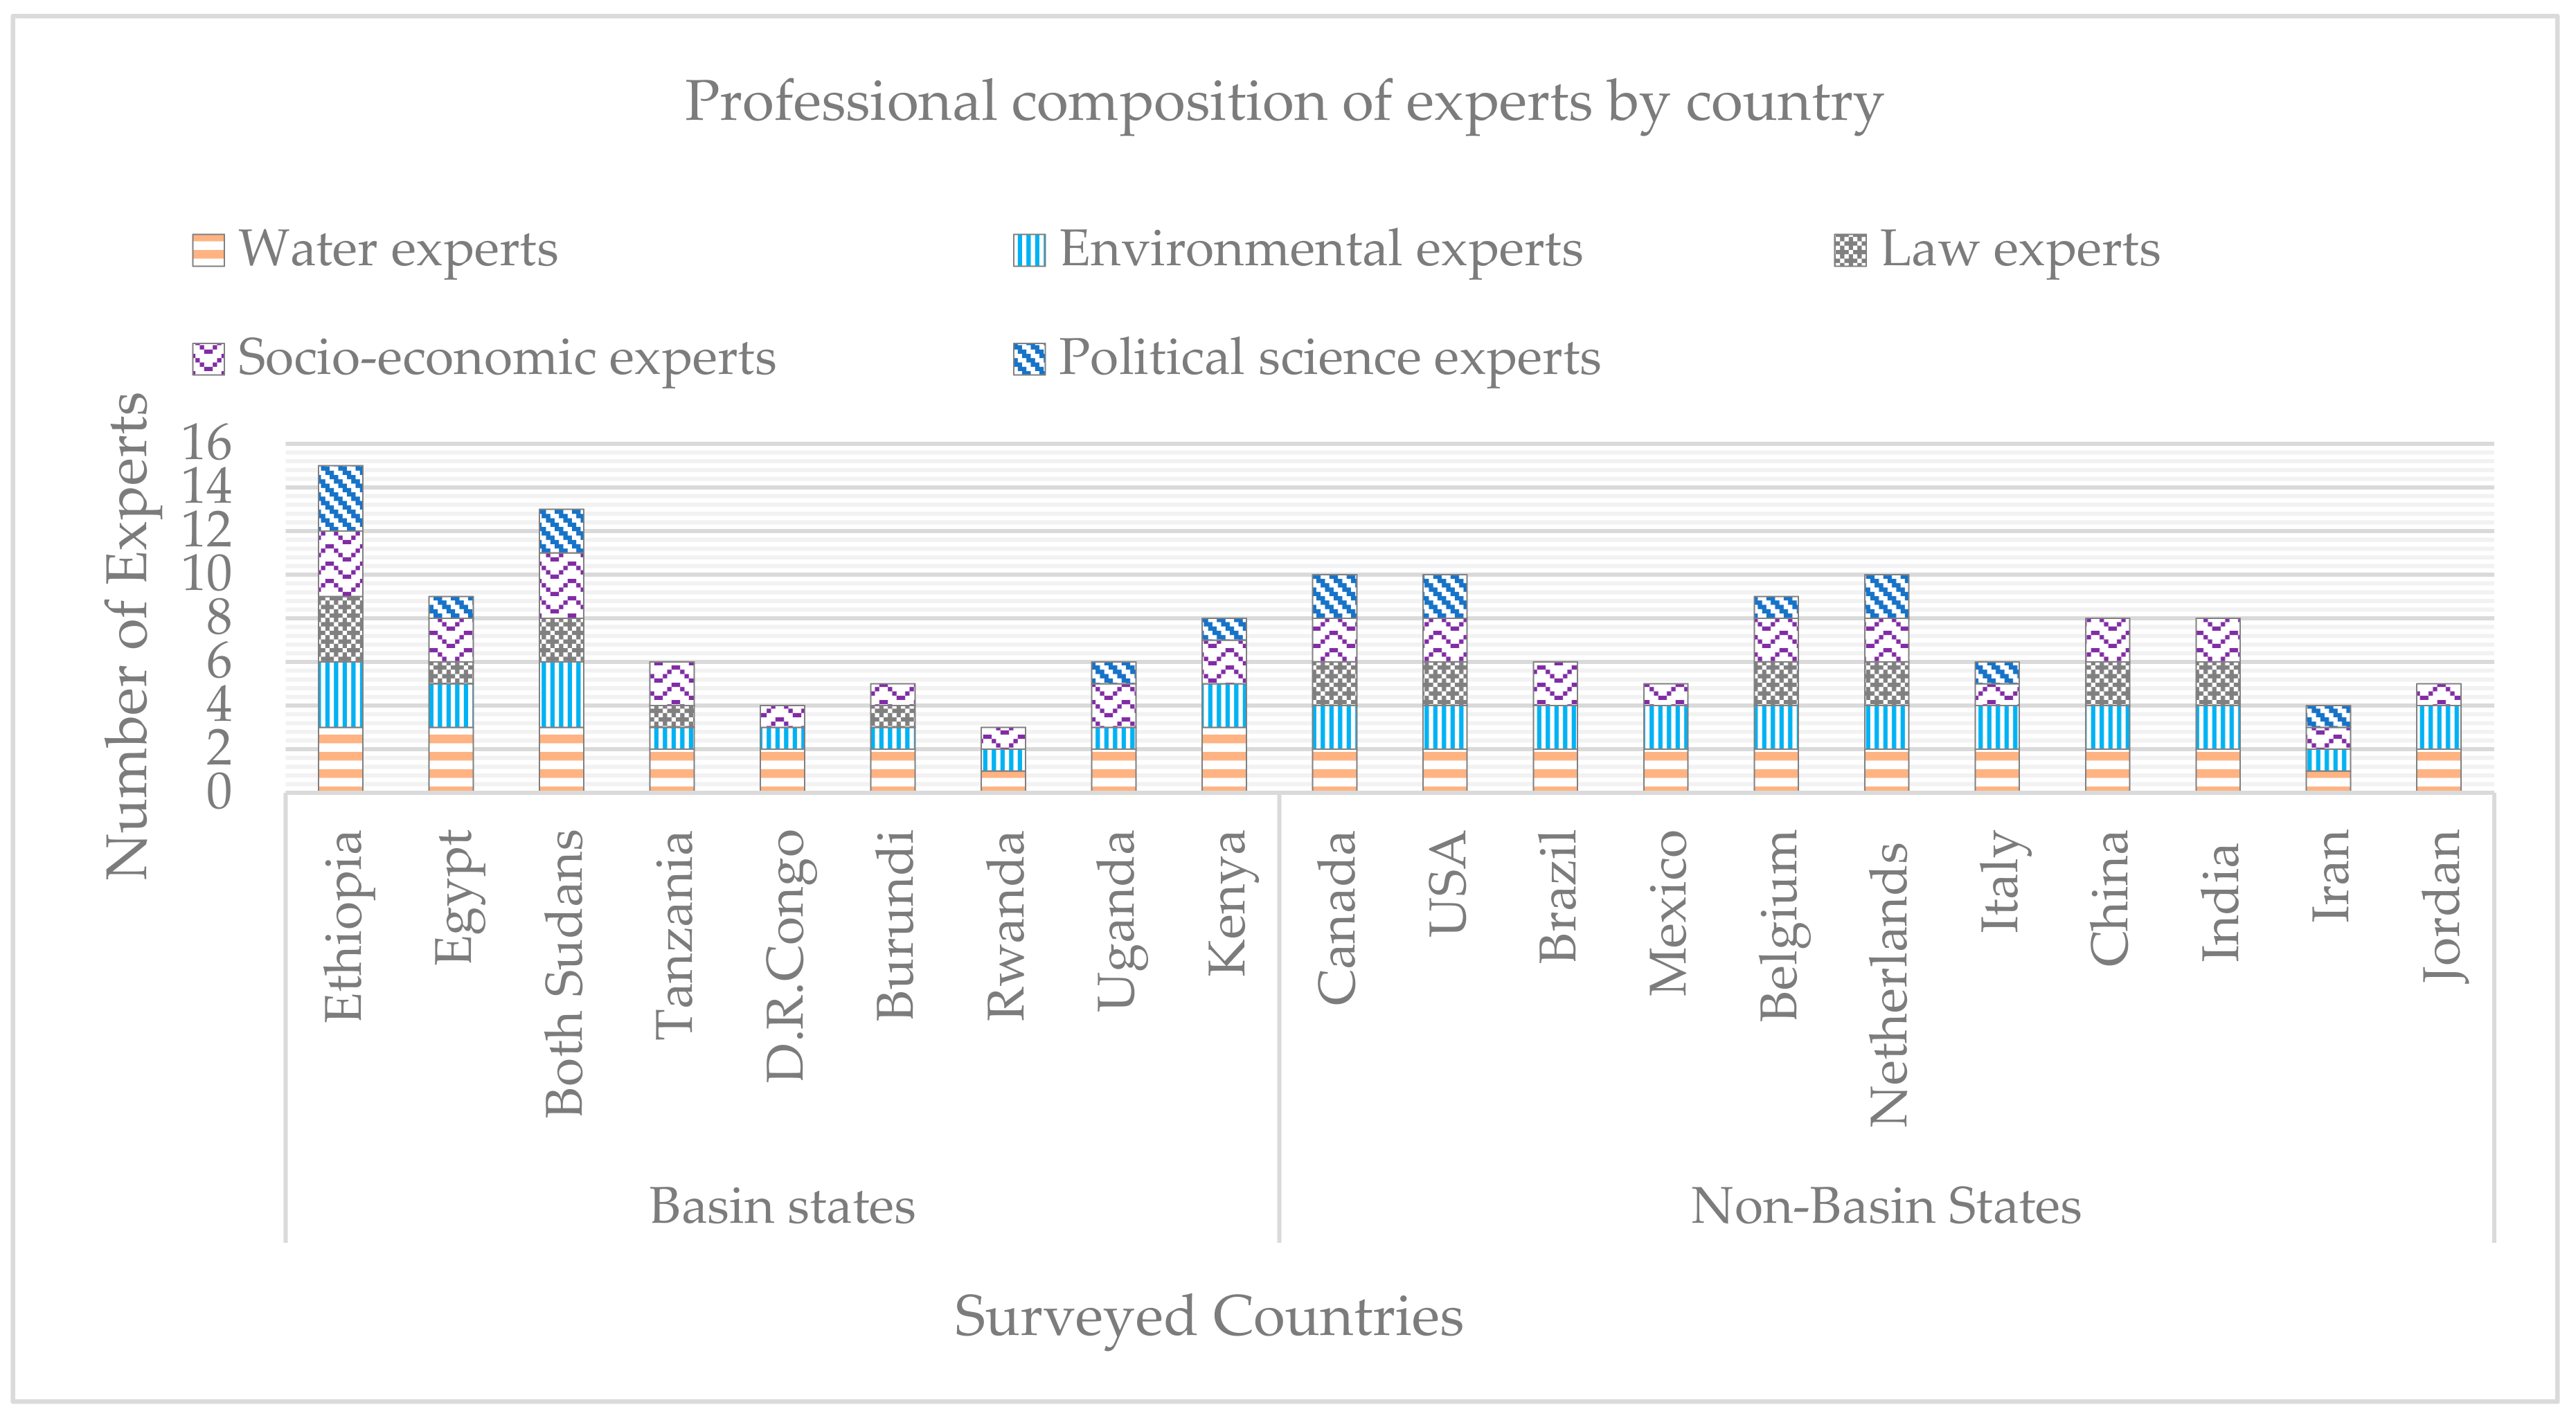
The questionnaire was prepared with a Likert scale of 1–5 representing the following for each indicator: 1. Not important, 2. Less important, 3. Neutral, 4. Moderately important, and 5. Very important. It was distributed via email to a total of 215 experts in Africa, Asia, Europe, North America, and South America, with 150 complete responses collected, following a snowball sampling method. The experts represented five professions: Hydrology/water resources, environmental science, law, socioeconomics, and political science. All experts had an educational background at the master’s level or above, and worked in universities, ministries, embassies, regional and international agencies and institutes, nongovernmental organizations, and independent consultants (
Figure 2 and
Figure 3).
To differentiate potential partialities within, outside, and between countries, experts were also grouped as basin and non-basin professionals. To ensure fair representation of experts across all continents, when we planned three responses from each four professions in the nine basin countries due to the difficulty and time it takes to reach out the questionnaire to experts outside of Africa, two responses per five professions was targeted from at least two countries found in the remaining four continents excluding Antarctica and Australia. Accordingly, 135 and 80 experts were targeted from basin and non-basin countries, respectively. The quota of questionnaires among professions also targeted equality. Apart from basin countries, the choice of representative countries from the four continents were made based on their involvement in international water disputes. For example, from Europe, Belgium and the Netherlands were selected given their experience on the Meuse River. Similarly, the USA had negotiations with Canada and Mexico on the Colombia and Rio Grande Rivers, respectively. Additionally, from the Middle East and Asia, Jordan and Israel (Jordan River), Iran and Iraq (Tigris River), as well as China and India (Mekong River), were selected.
3.2.3. Analysis of Survey Data
To avoid overfitting and reduce dimensionality, a principal component analysis (PCA) was employed on all indicators under each factor. A PCA reduces the size of the independent variable set by retaining the maximum variance using fewer dimensions than the original number of indicators. The number of principal components (PCs) retained in this study followed by Formann [
36], such that the proportion between the number observations and number variables (v) is greater than 5 × 2
V. For this study, three PCs were retained under each of the seven factors. All data were confirmed to follow a normal distribution.
After completing the PCA, a k-means clustering algorithm was used to identify groupings of expert responses. K-mean clustering is a partitional clustering approach identifies a user-defined number of clusters (K), which are designated by their means or centroids. To group n-number of observations into a K-number of clusters, this technique uses either the Euclidean or rectilinear distance of these scaled points from the centroids as a measure of similarity. This is performed in an iterative process. First, the numbers of hypothetical clusters (
K) based on characteristics as geography, profession and hydrologic position of watercourse states is decided. Second, among the data points, initial centroids are randomly selected. The number of these randomly selected observations (an associated starting centroid) are, by default, equal to the number of assumed clusters. Third, the Euclidean distance between these initial centroids and each data point is calculated using Equation (1). Then, individual observations are classified into k-clusters depending on their minimum distance from the randomly selected centroids. The smaller the Euclidean distance between a given centroid and data points, the higher the probability to be grouped in a similar cluster. However, each time the centroid changes, the cluster of data points also changes. Thus, at each step, centroids are updated by taking the average of the data points that are categorized in the same cluster in the preceding iteration. This continues until a consistent cluster assignment is obtained.
where
du,v is Euclidean distance between a given centroid and variable
u and
v, and 1,2 …
q are data points or observations of each variables.
Accordingly, we first set the number of hypothesized clusters at K = 2 for groupings between basin and non-basin or upstream and downstream, K = 4 for grouping among basin states, and K = 5 for grouping by profession. Given these specified number of clusters, the algorithm iterated to identify patterns of differences or similarities that existed in the survey data. However, because the ideal number of clusters for a given dataset can be different from what is anticipated, an optimal number of clusters was detected using an elbow method for proofing our assumptions. Repeating the steps above, all variances (within sum of squared errors (SSE)) corresponding to each K values from 2 to (n − 1) were calculated, where n is the number of observations. Then, by plotting (K vs. SSE), a point marking the approximate location where a rapid decline in the slope of the variance ends and began to flatten (forming an elbow shape) was noted. At this point, because the rate of change in the variance was quite small for additional clusters, the corresponding number of clusters (K-value) was selected as appropriate. This also allowed a k-means cluster obtained by an optimal K-value to verify the initially selected number of clusters. Further, the number of respondents categorized in each group from each country was also used as a check to examine the existence of expected grouping in the survey responses.
Although the k-mean clustering identifies patterns and reasons for grouping in the data, it cannot determine the degree of difference between groupings, thus Analysis of Variance (ANOVA) was included to evaluate potentially statistically significant differences among basin countries, and a t-test was used to identify potentially significant differences between, within, and outside of the basin countries for individual indicators. To be statistically significant, results may surpass the 95% confidence level (p-value < 0.05).
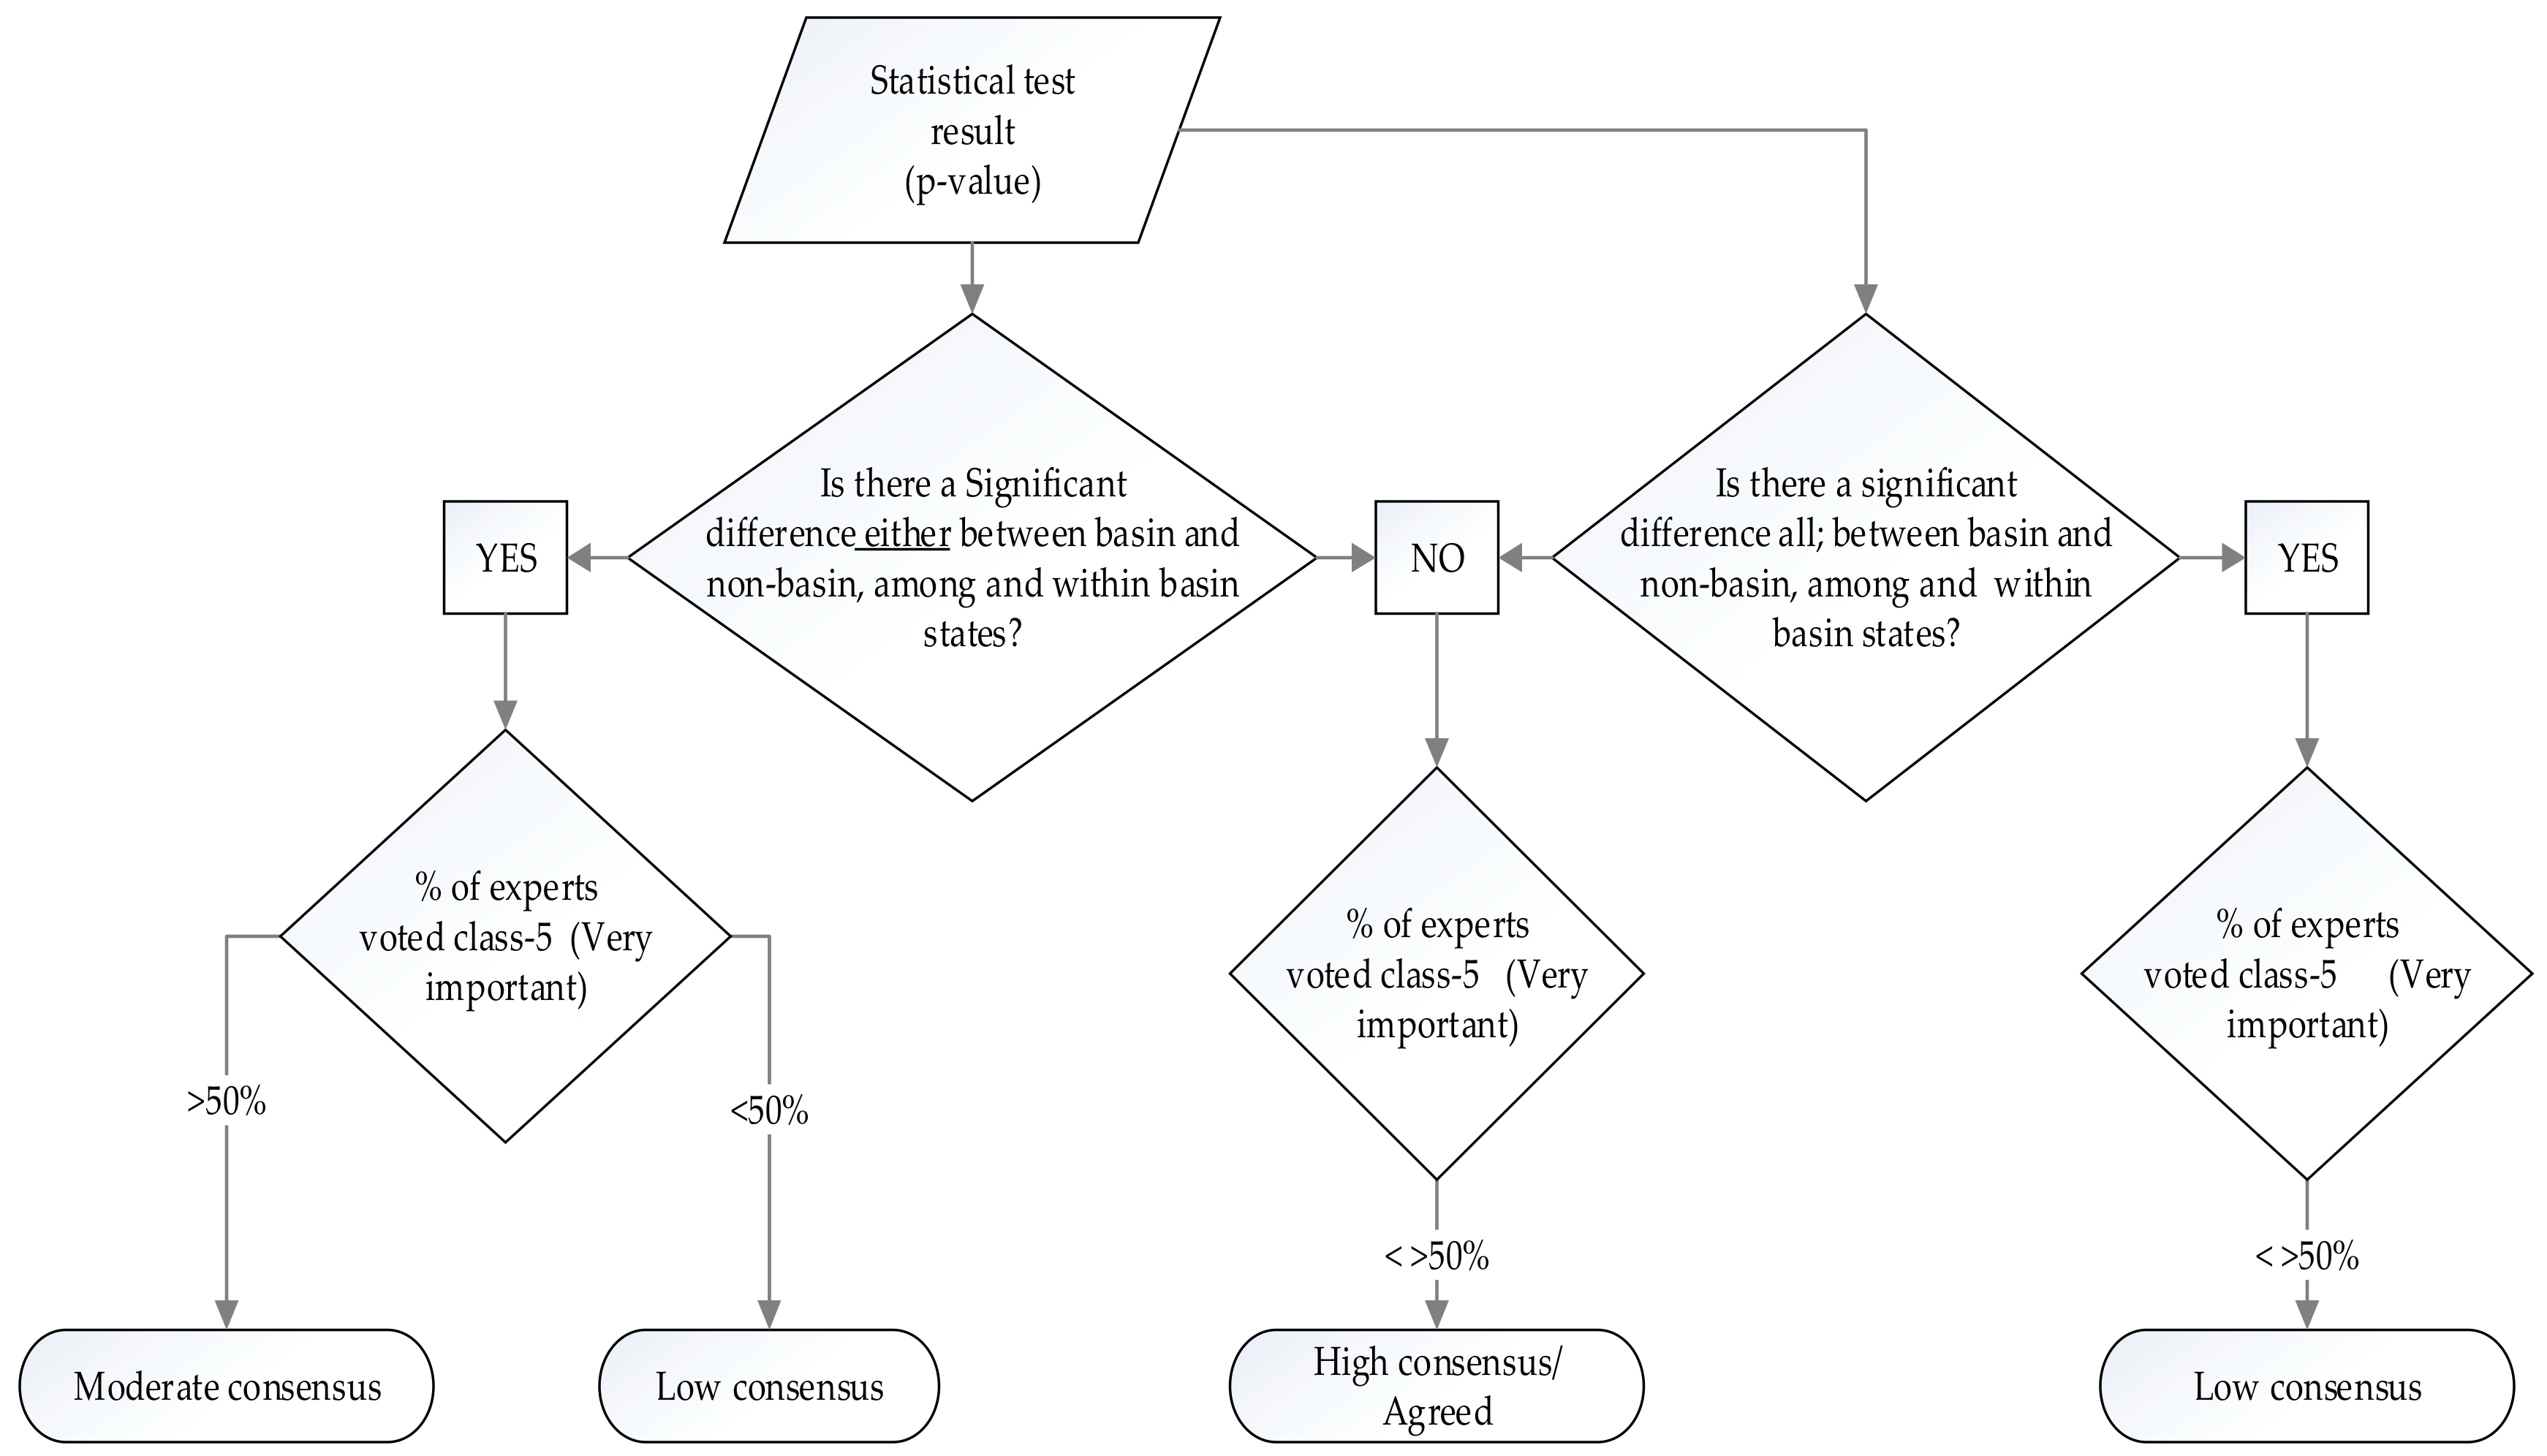
3.2.4. Final Indicator Selection
The selection of the final set of indicators was based on both statistical significance and the percentage of responses with a Likert score of 5 (very important) (
Figure 4). All indicators were classified into levels of consensus according to the following:
- (1)
If there is no statistically significant difference among basin countries and between basin and non-basin countries, regardless of the percentage of experts selecting ‘very important,’ then the degree of consensus for that indicator is considered high;
- (2)
If there is a statistically significant difference either among basin countries or between basin and non-basin countries, but the percentage of experts selecting ‘very important’ is >50%, then the degree of consensus is considered moderate;
- (3)
If there is a statistically significant difference either among basin countries or between basin and non-basin countries, and the percentage of experts selecting ‘very important’ is <50%, then the degree of consensus is considered low; and
- (4)
If there is a statistically significant difference among basin countries and between basin and non-basin countries, regardless of the percentage of experts selecting ‘very important,’ then the degree of consensus for that indicator is considered low.
4. Results
In the following section, we present results and outcomes from all respondents, analysis comparing among basin countries and basin versus non-basin groupings, and key indicators identified for the Nile Basin that may be used for equitable and reasonable water allocation among the states.
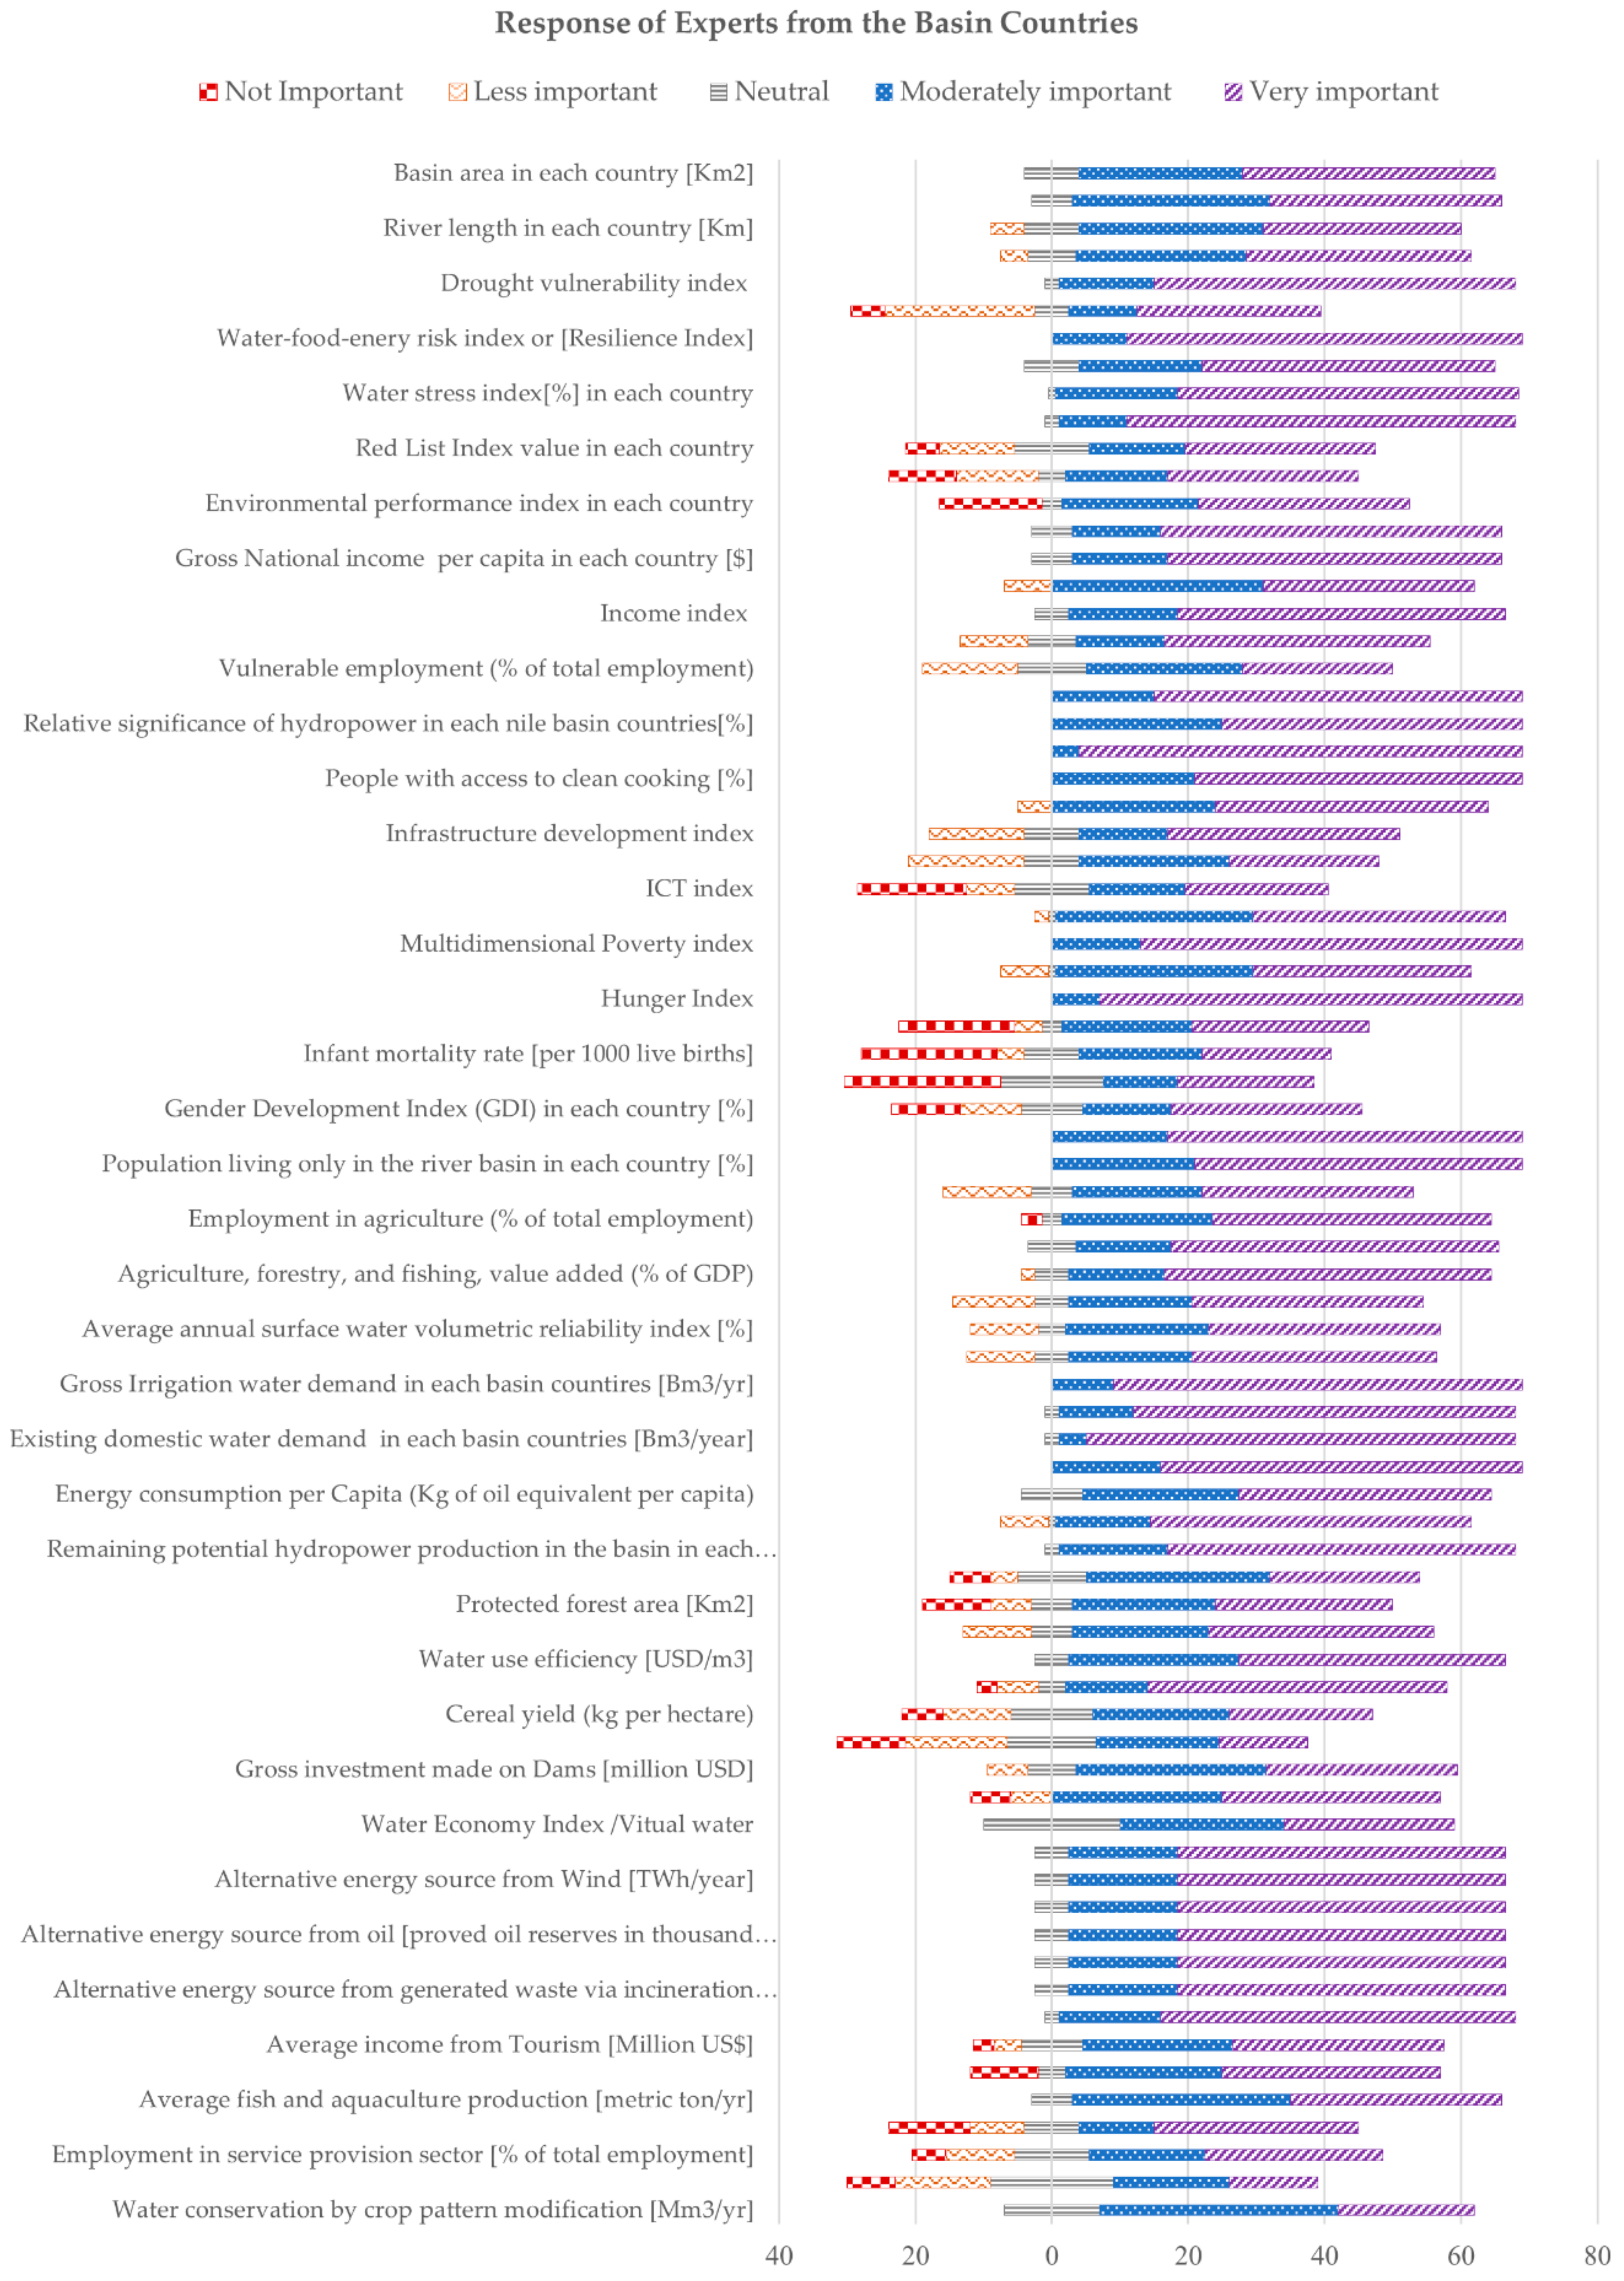
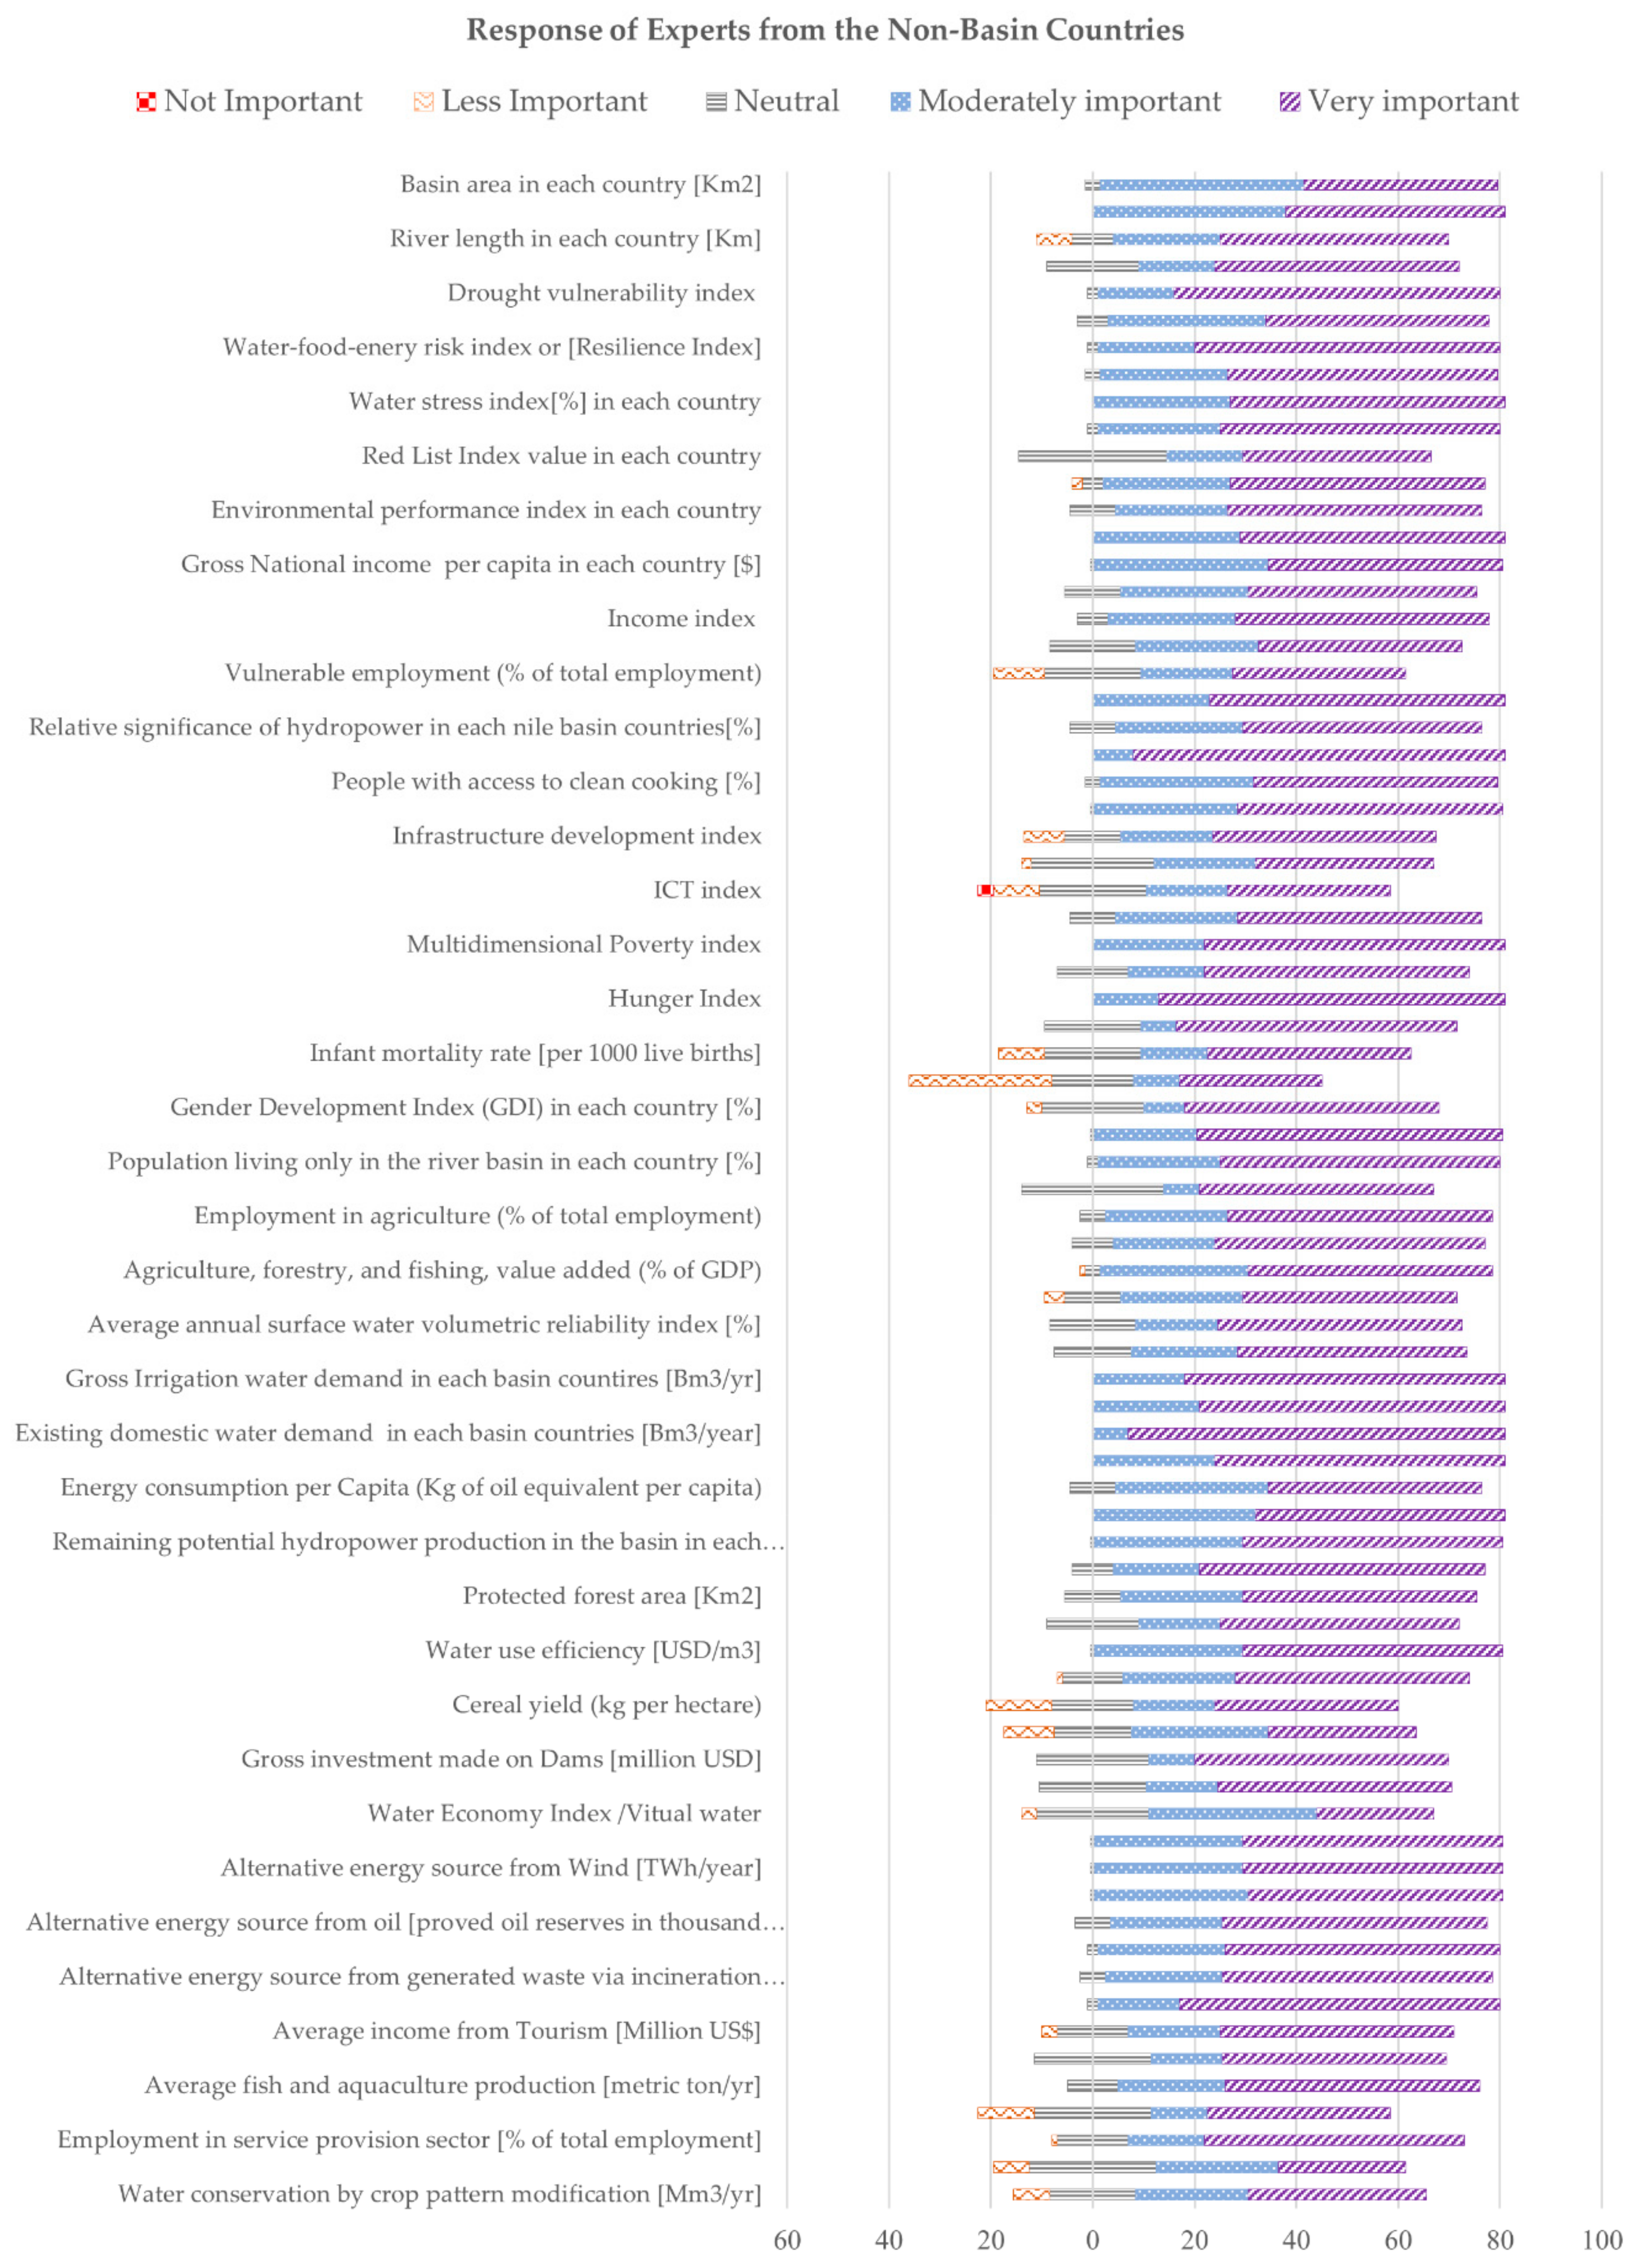
4.1. Responses of All Experts
According to the summary of data (
Figure 5 and
Figure 6), the response from basin country experts covered all classes from not important to very important (1–5) for most of the indicators. For non-basin countries, this was not the case. This emphasizes that experts from basin countries appeared more divided on most of the indicators than non-basin experts. Yet, basin experts also expressed a common positive inclination for some indicators, including water-food-energy risk index, population without electricity, the relative significance of hydropower, access to drinking water, access to clean cooking, multidimensional poverty, hunger index, existing irrigation demand, and future domestic water demand. Contrarily, although approximately 80% of non-basin experts considered the majority of indicators to be important, there were some exceptions on which they were divided, including ICT index, life expectancy index, cereal yield, and industry (%GDP).
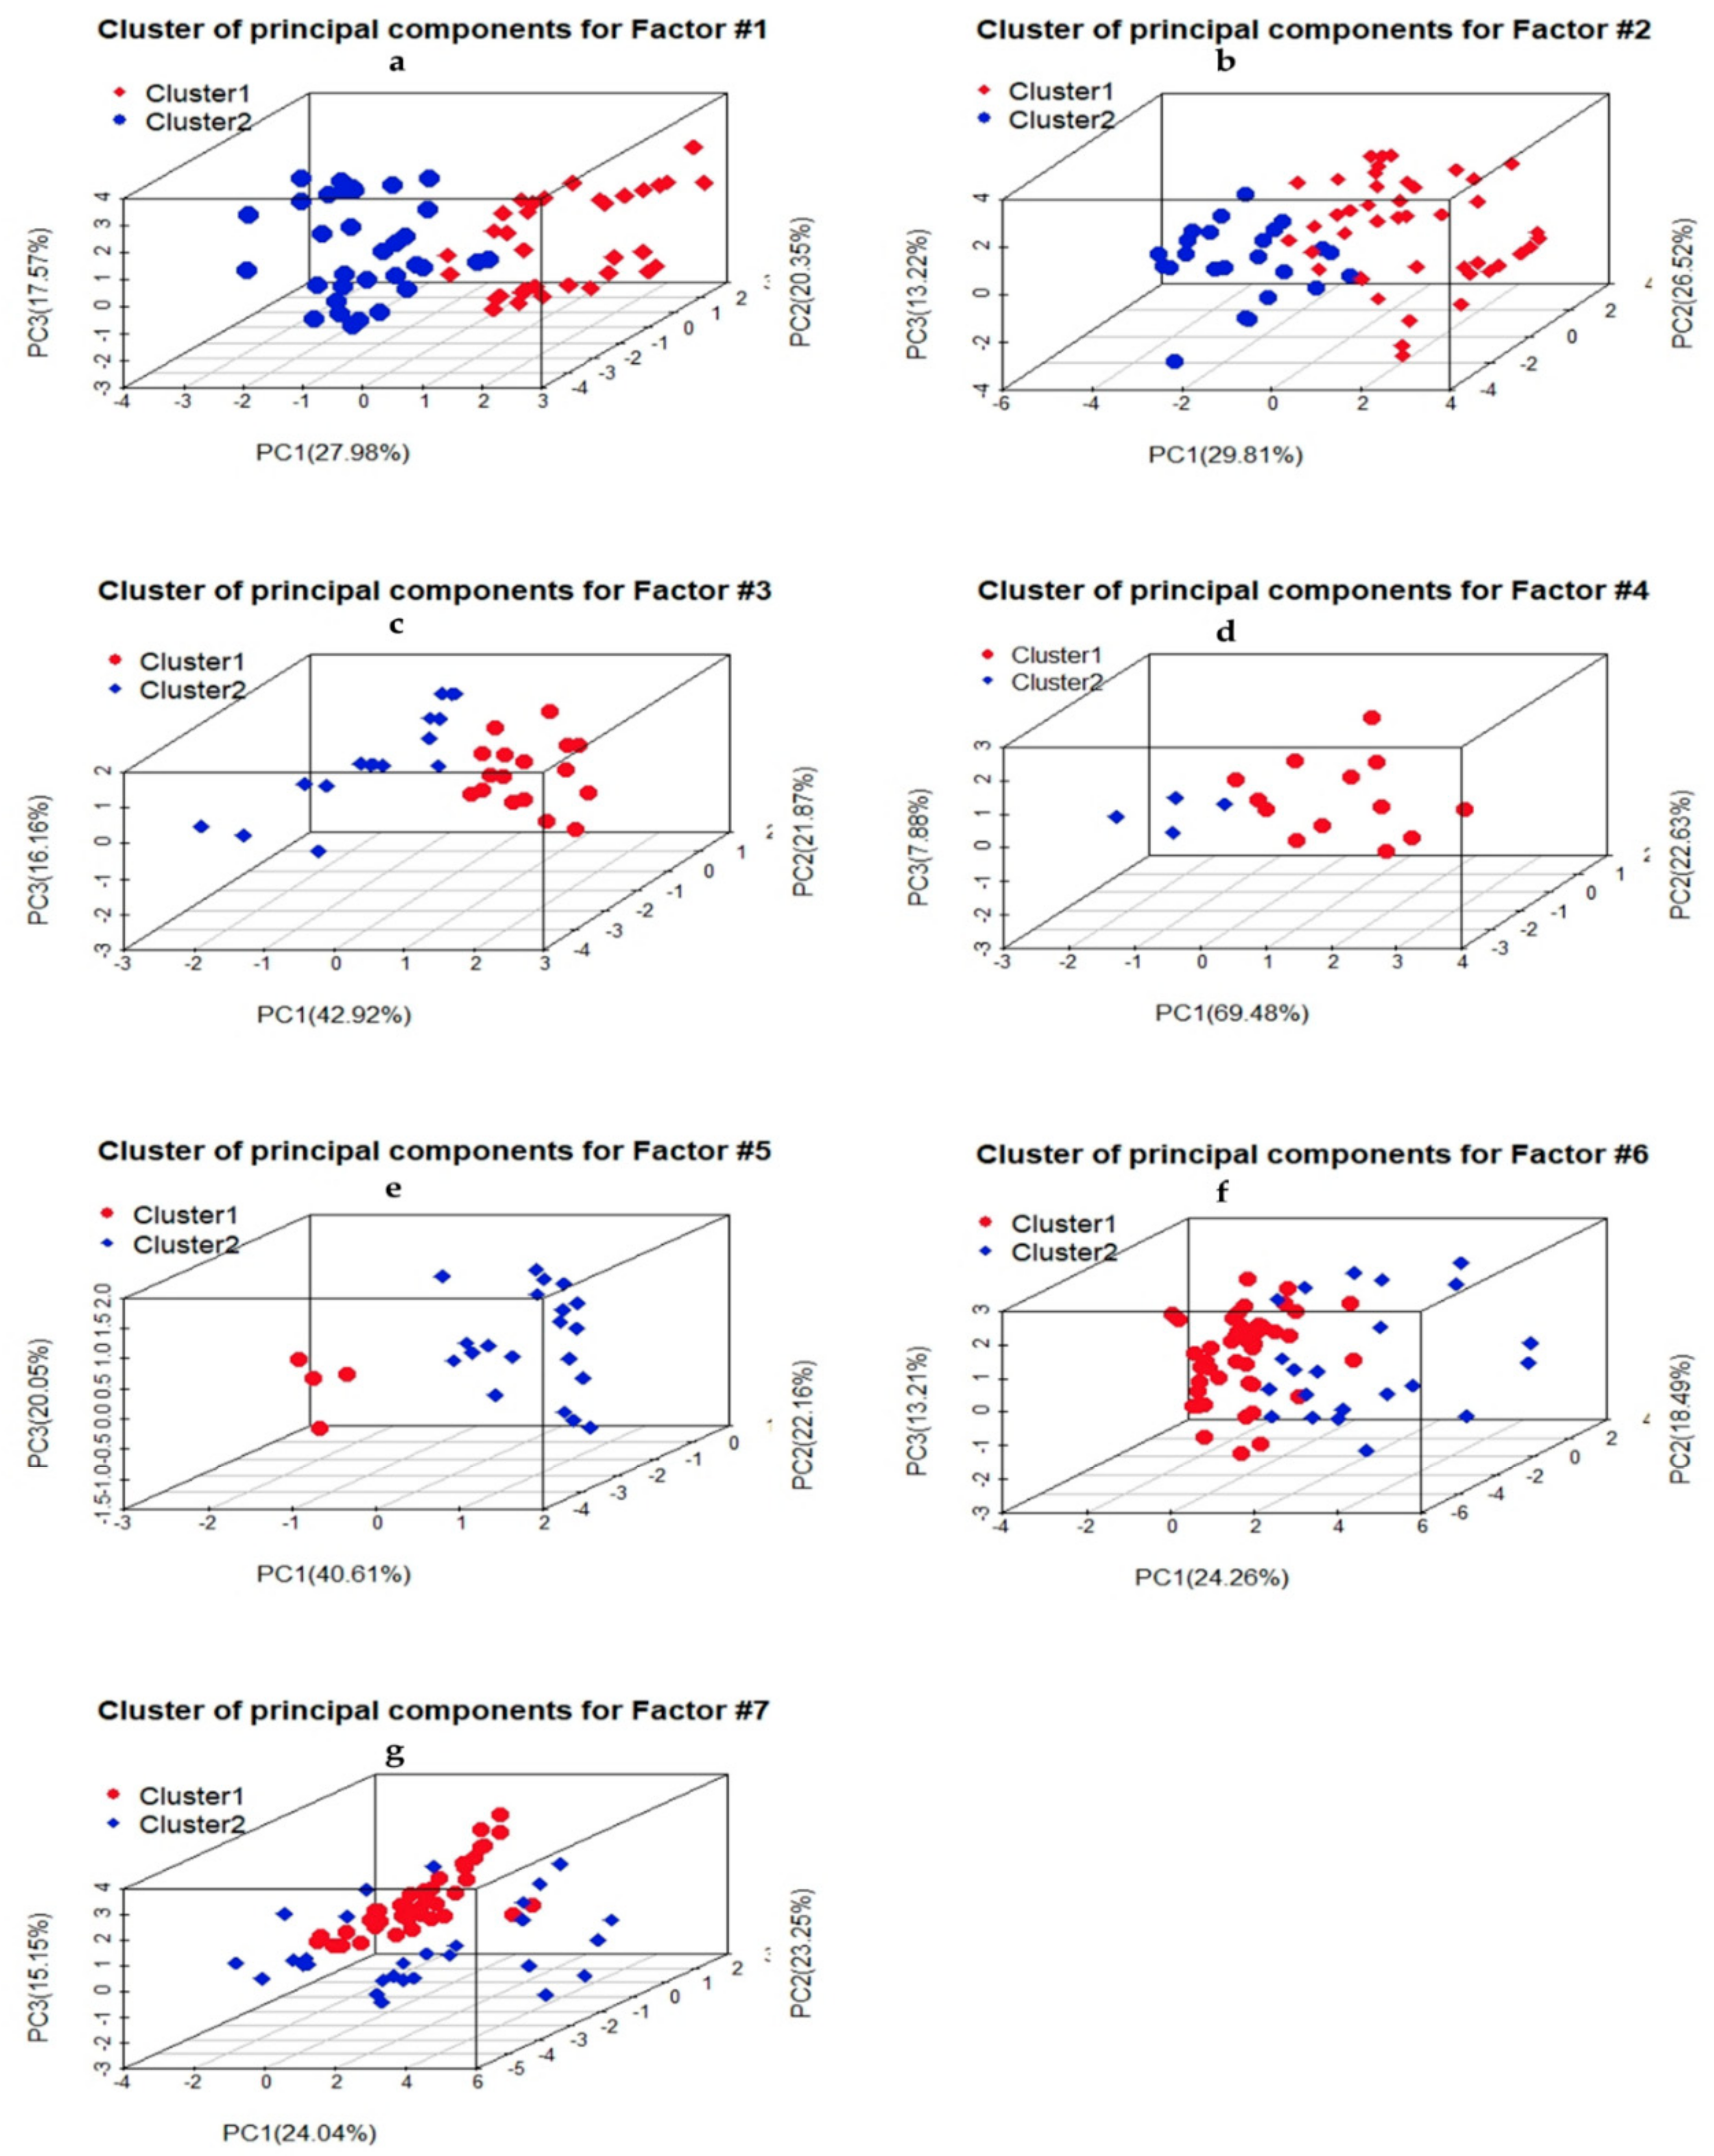
4.2. Comparison among Basin States
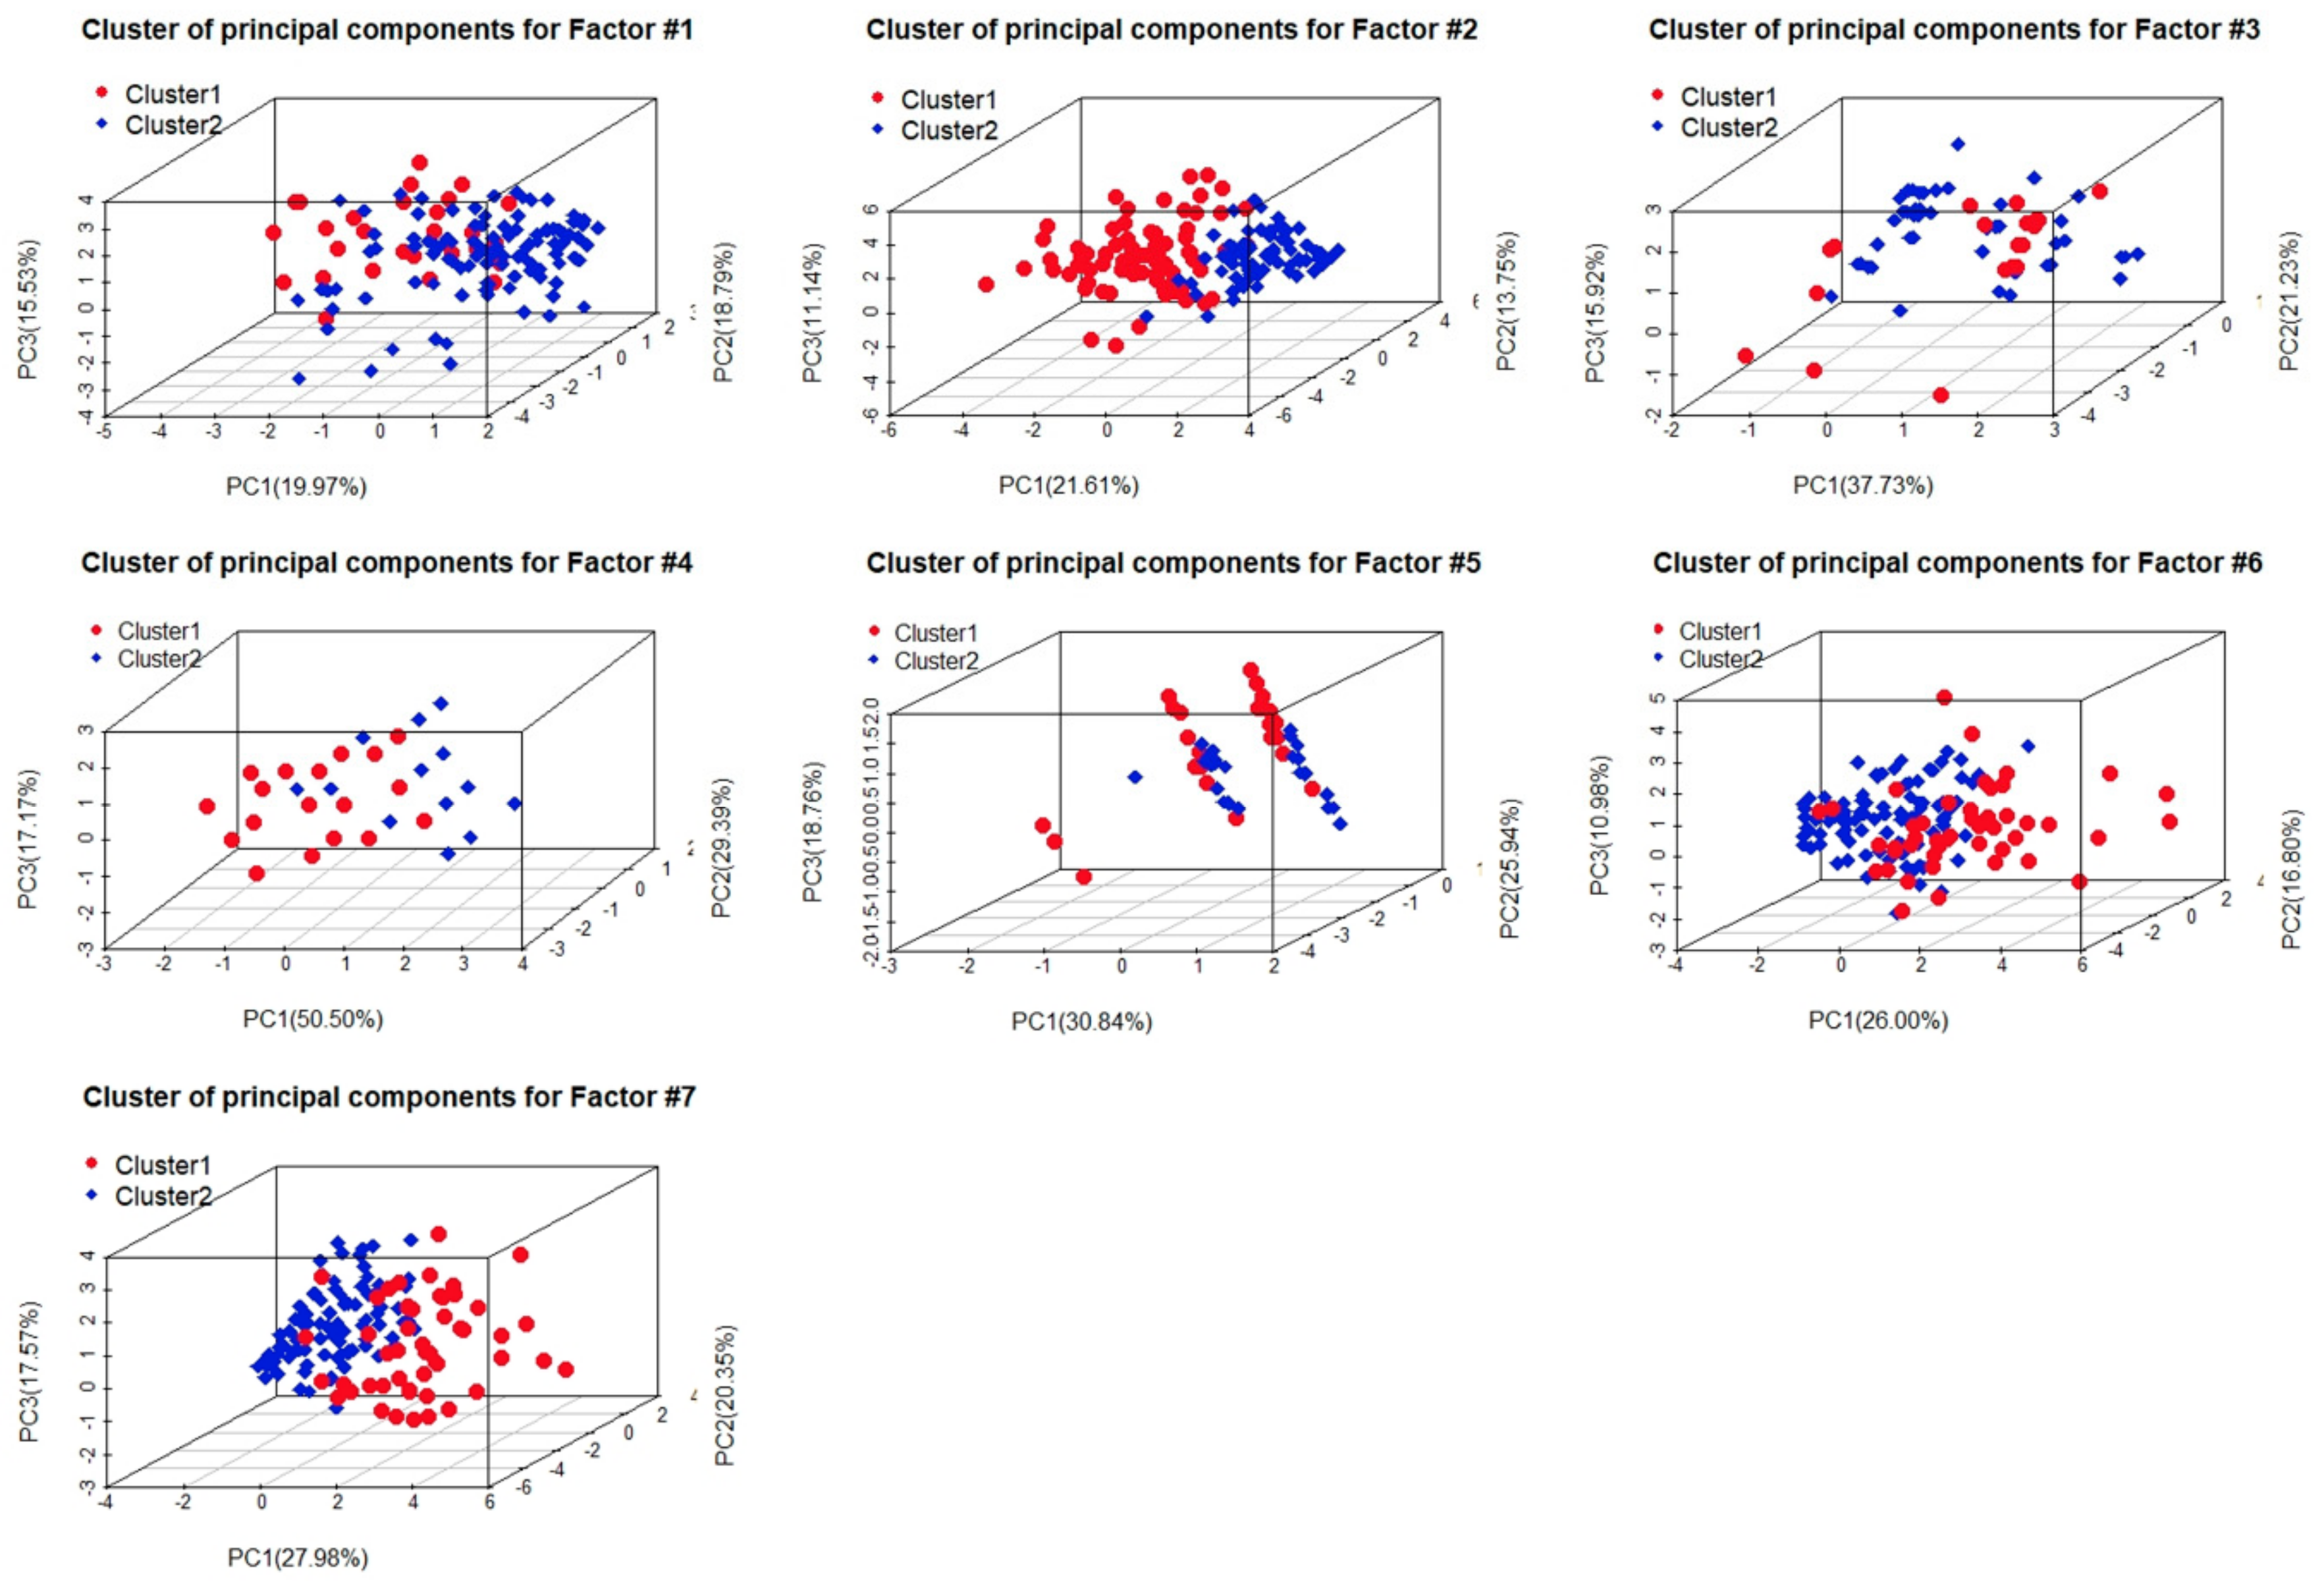
The sum of the variance explained from the first three PCs for each factor ranged from 60% to 95%, expressing the scope of agreement and disagreement between basin experts. The clusters based on these PCs for each factor were quite mixed and did not show a clear distinction (
Figure 7,
Figure A1 and
Figure A2). Overall, the influence of the expert’s profession (
Figure A1) and home country (
Figure A2) appears negligible, whereas a country being grouped by hydrologic position (upstream vs. downstream) did indeed illustrate clearer clusters (
Figure 7). This was particularly clear from factors 1 to 5, but less so for factors 6 and 7 (costs of conservation and protection, and the availability of alternative uses (
Figure 7f,g), where a stronger similarity was observed). Thus, not all indicators necessarily imply a difference in opinion between upstream and downstream states.
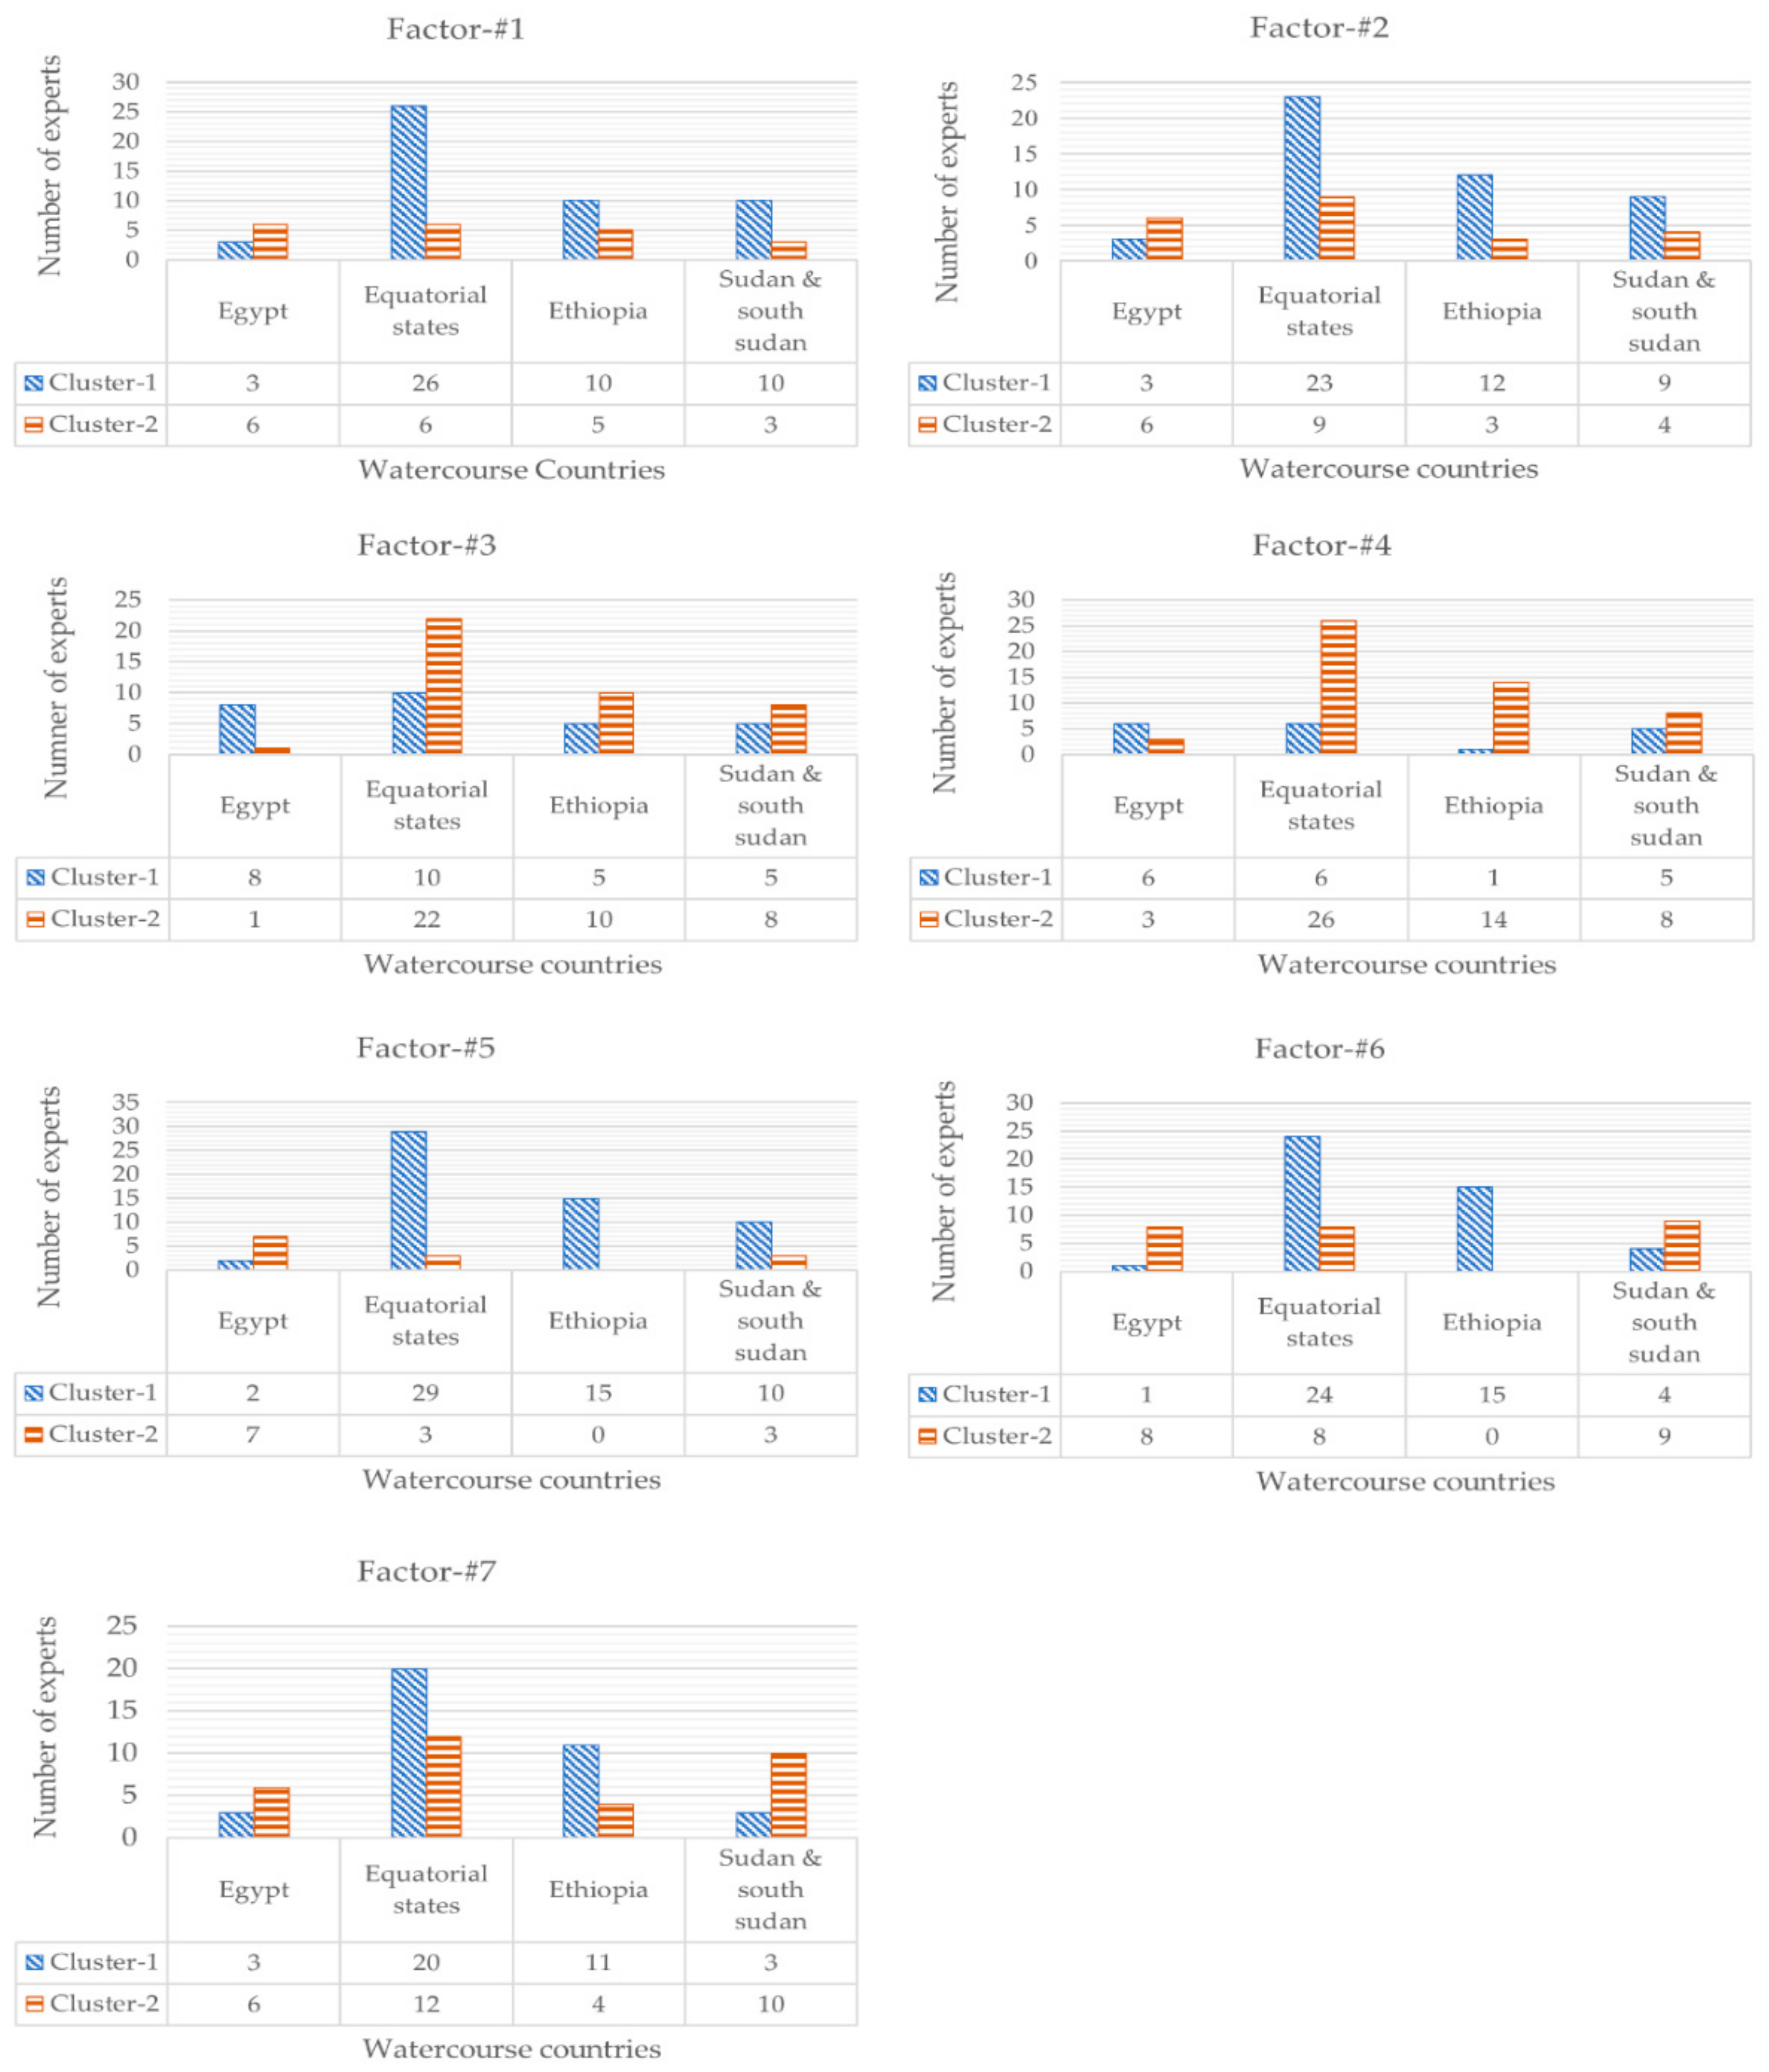
Beyond the confirmation of optimal number of clusters to be (
k = 2), the number of experts falling into each distinct cluster based on hydrologic position is also insightful (
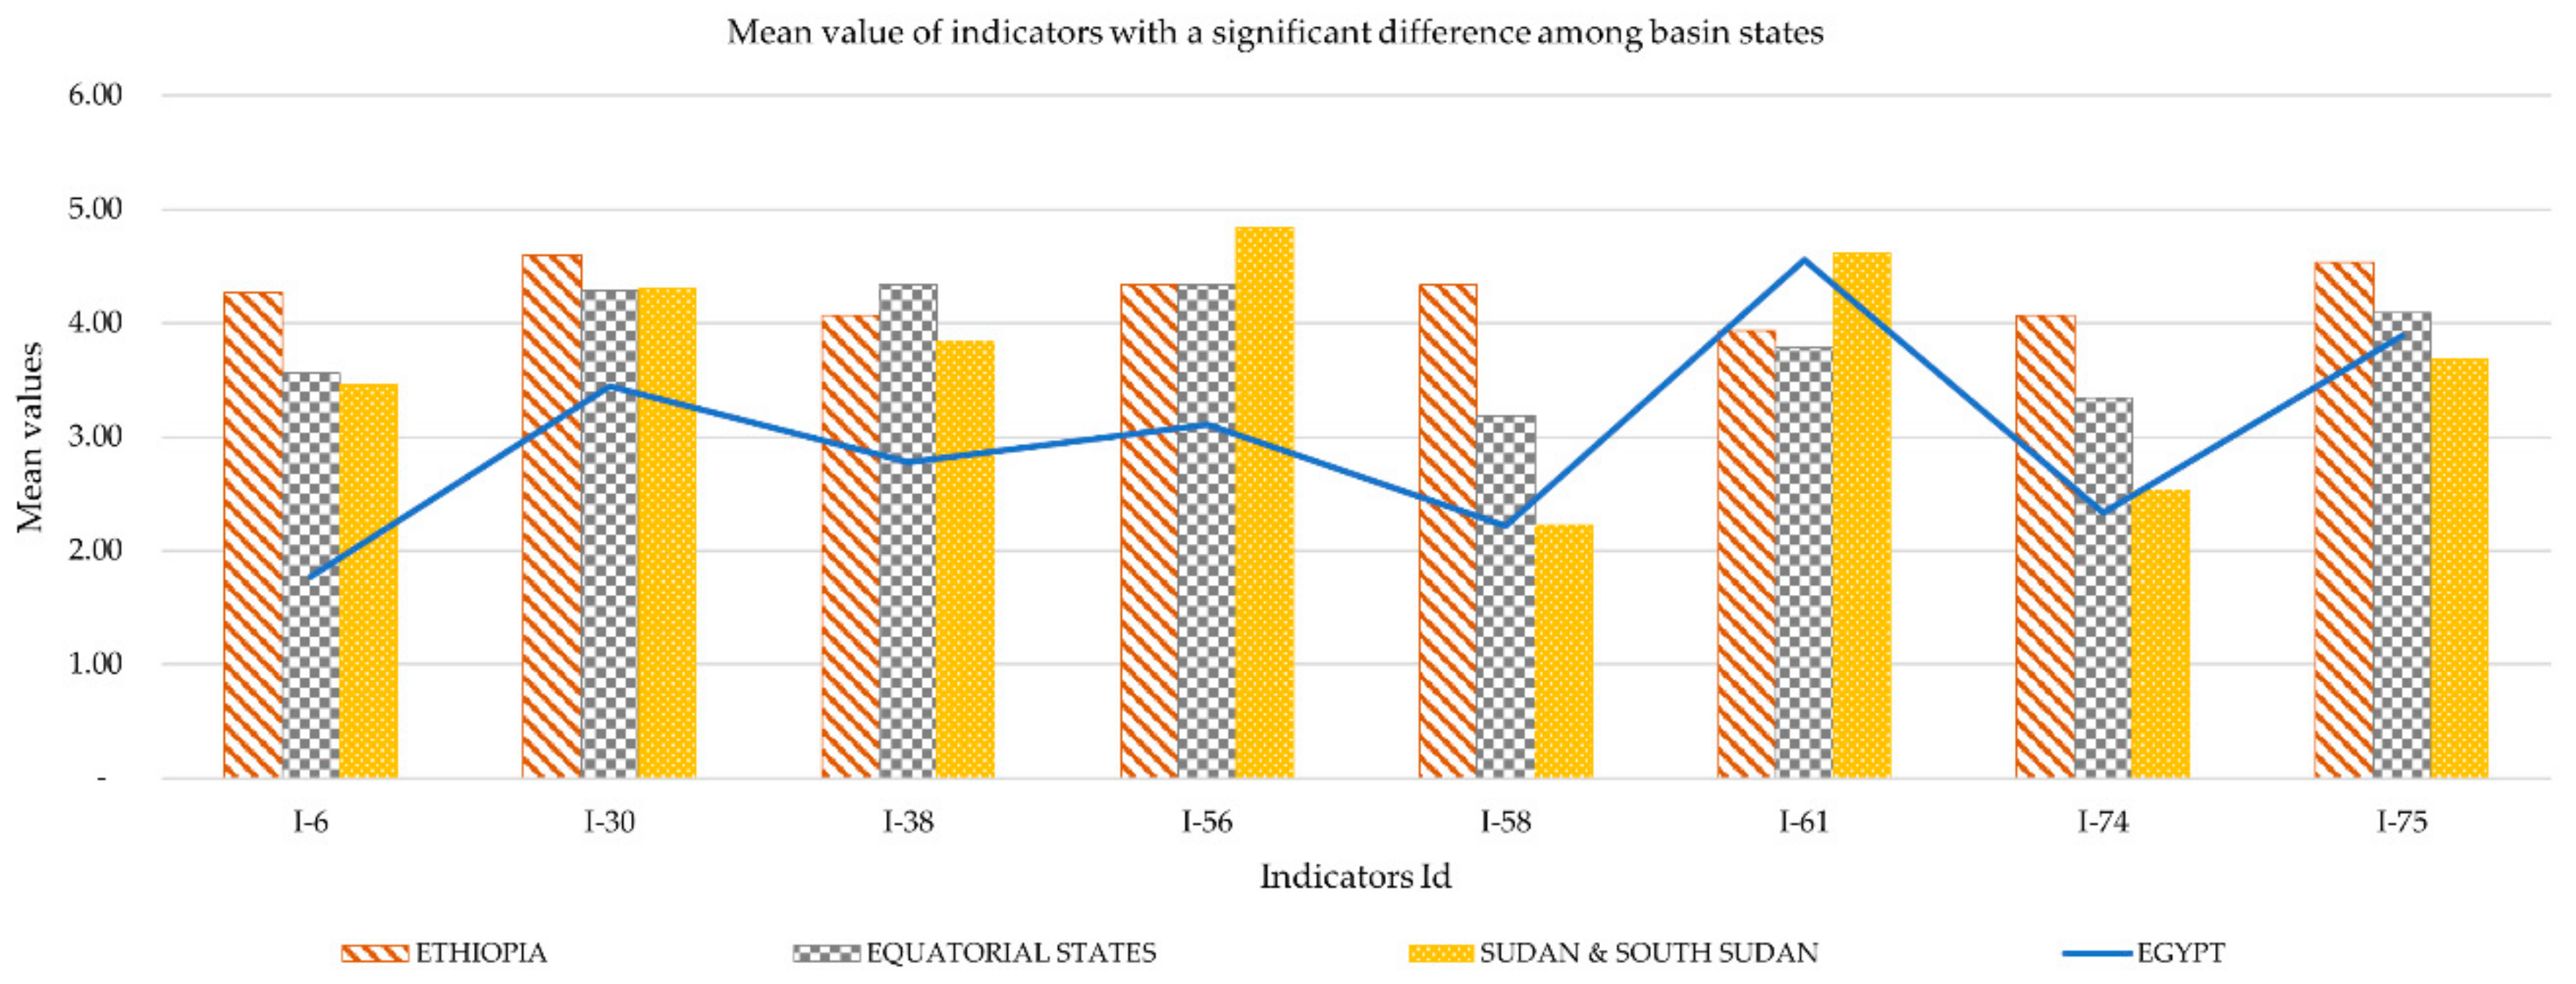
Figure 8). Sudan and Egypt were visibly similar for indicators focused on factor 6 (costs of conservation and protection) and factor 7 (availability of alternative uses). However, for factors 1–5, most Sudanese experts’ responses more closely matched upstream expert opinions, leaving a relatively clear separation between Egypt versus other basin states. Although these conclusions can be drawn at the factor scale, broad dissimilarities across all indicators listed under each factor are not necessarily evident. Rather, it is typical only a few indicators under each factor that strongly influence the division by hydrologic position. These specific indicators can be identified through the proposed statistical tests.
Whereas a general agreement exists on 67 indicators among basin countries, a significant difference exists for eight indicators among basin states as well as two indicators between Egyptian experts (
Table S2). Apart from Egypt’s experts, there were no significant differences detected within other basin states. The eight indicators which resulted in a significant difference based on hydrologic position included the average drought-affected people per year in each country (I-6), population living below the income poverty line (I-30), population growth rate (I-38), wetland area (I-56), estimated cost to conserve erosion hot spot areas (I-58), virtual water (I-61), revenue and job opportunity from ports (I-74), and water conservation by crop pattern modification (I-75). The two indicators for which Egyptian experts also significantly disagreed within themselves included the average drought affected people per year in each country (I-6) and estimated cost to conserve erosion hot spot areas (I-58).
4.3. Comparison between Basin and Non-Basin Countries
To compare findings from the within-basin assessment, and particularly to understand the degree to which outcomes strongly favored national interests, the same analysis was repeated to examine the level of agreement between basin and non-basin states. Contrary to the within basin states analysis, clusters between groupings of basin and non-basin states did not indicate a distinct separation (
Figure 9). Clusters based on experts’ professions between basin and non-basin states was also relatively indistinct at the factor scale.
To address possible differences between basin and non-basin states on individual indicators outcomes from a t-test were examined (
Table S2). This resulted in basin states experts having a significant difference with non-basin experts on 14 indicators. Three of these indicators were also identified as differences among basin states. These indicators included the average drought-affected people per year (I-6), red list index (I-11), total greenhouse gas emissions (I-12), environmental performance index (I-13), transport index (I-26), ICT index (I-27), education index (I-32), infant mortality rate (I-33), gender development index (I-35), areas exposed for severe soil erosion (I-52), protected forest area (I-53), cost to conserve erosion hot spot areas (I-58), employment in service provision sector (I-73), and revenue and job opportunity from ports (I-74),
To investigate the potential sources of these differences, we compared experts’ responses by continent and the Middle East region. However, this did not indicate any potential geographic influence on the result. Similarly, the hydrologic position of non-basin countries did not appear to illustrate any distinct differences.
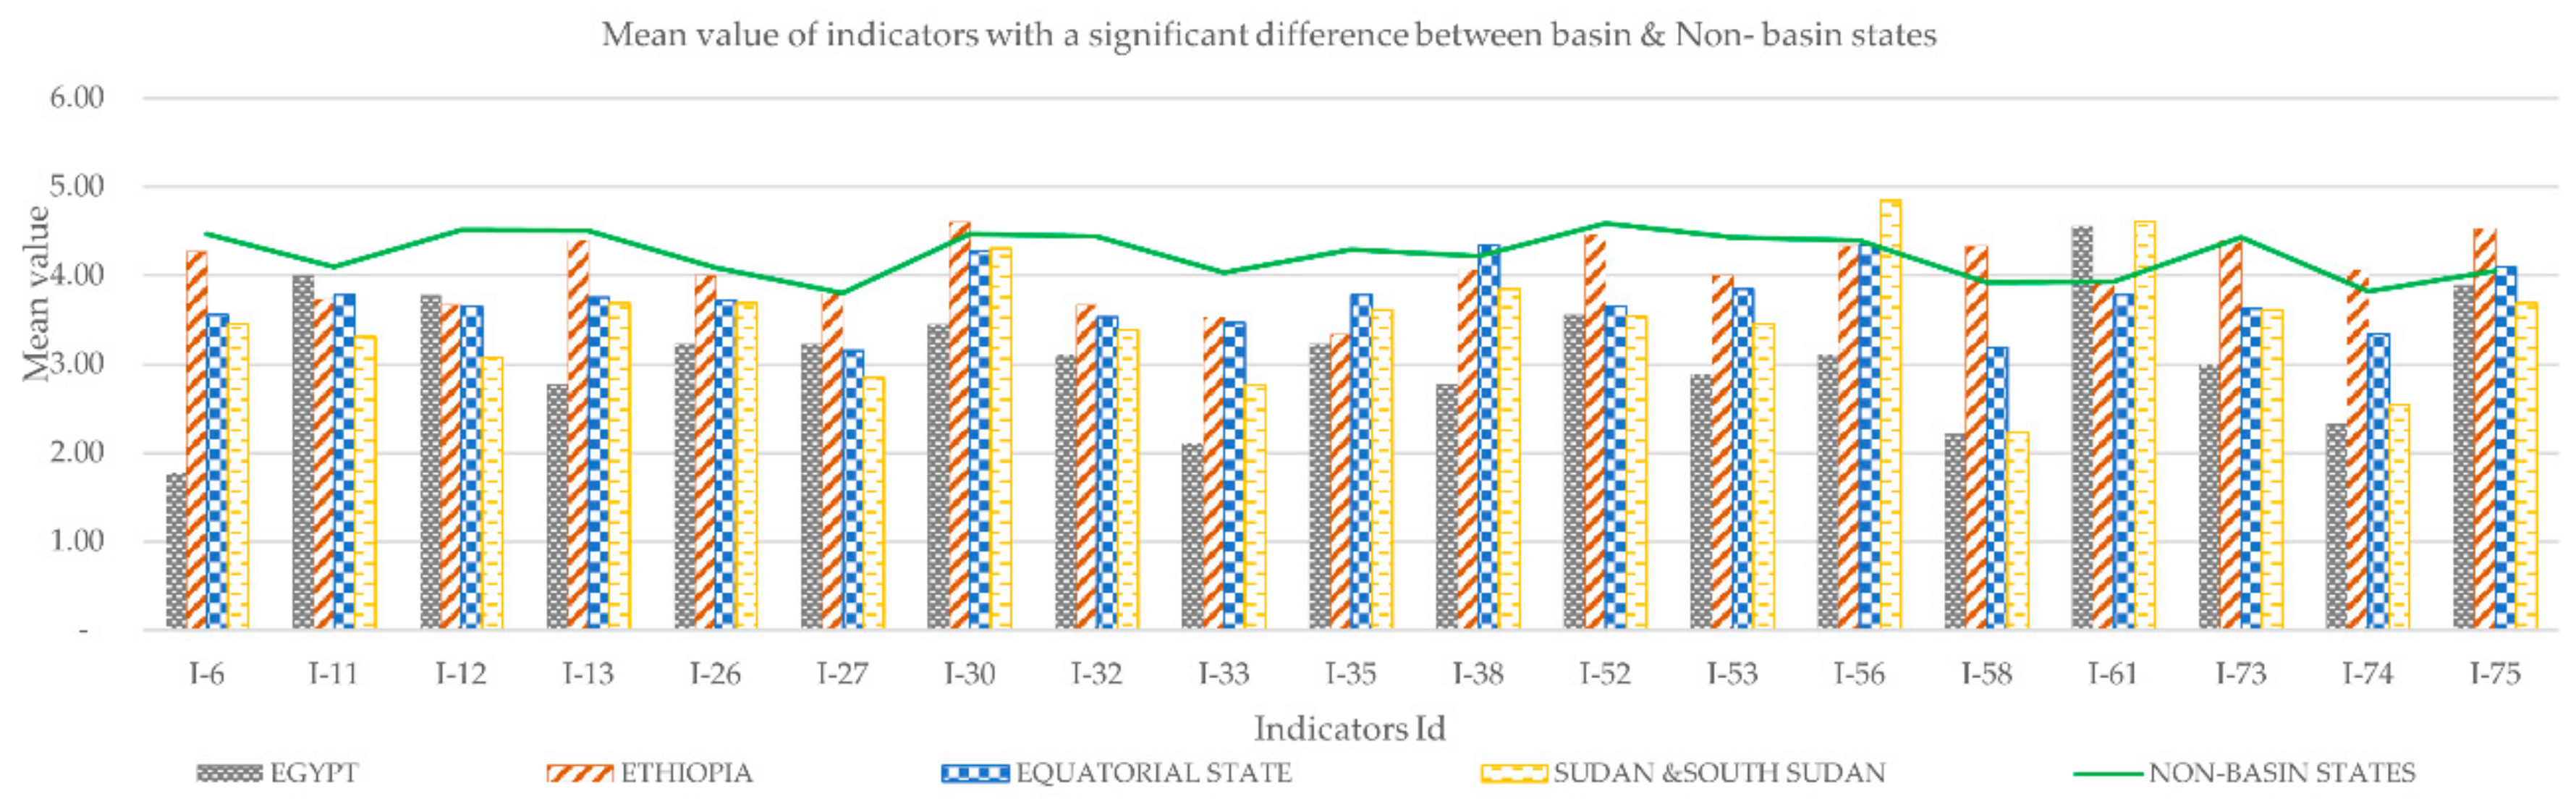
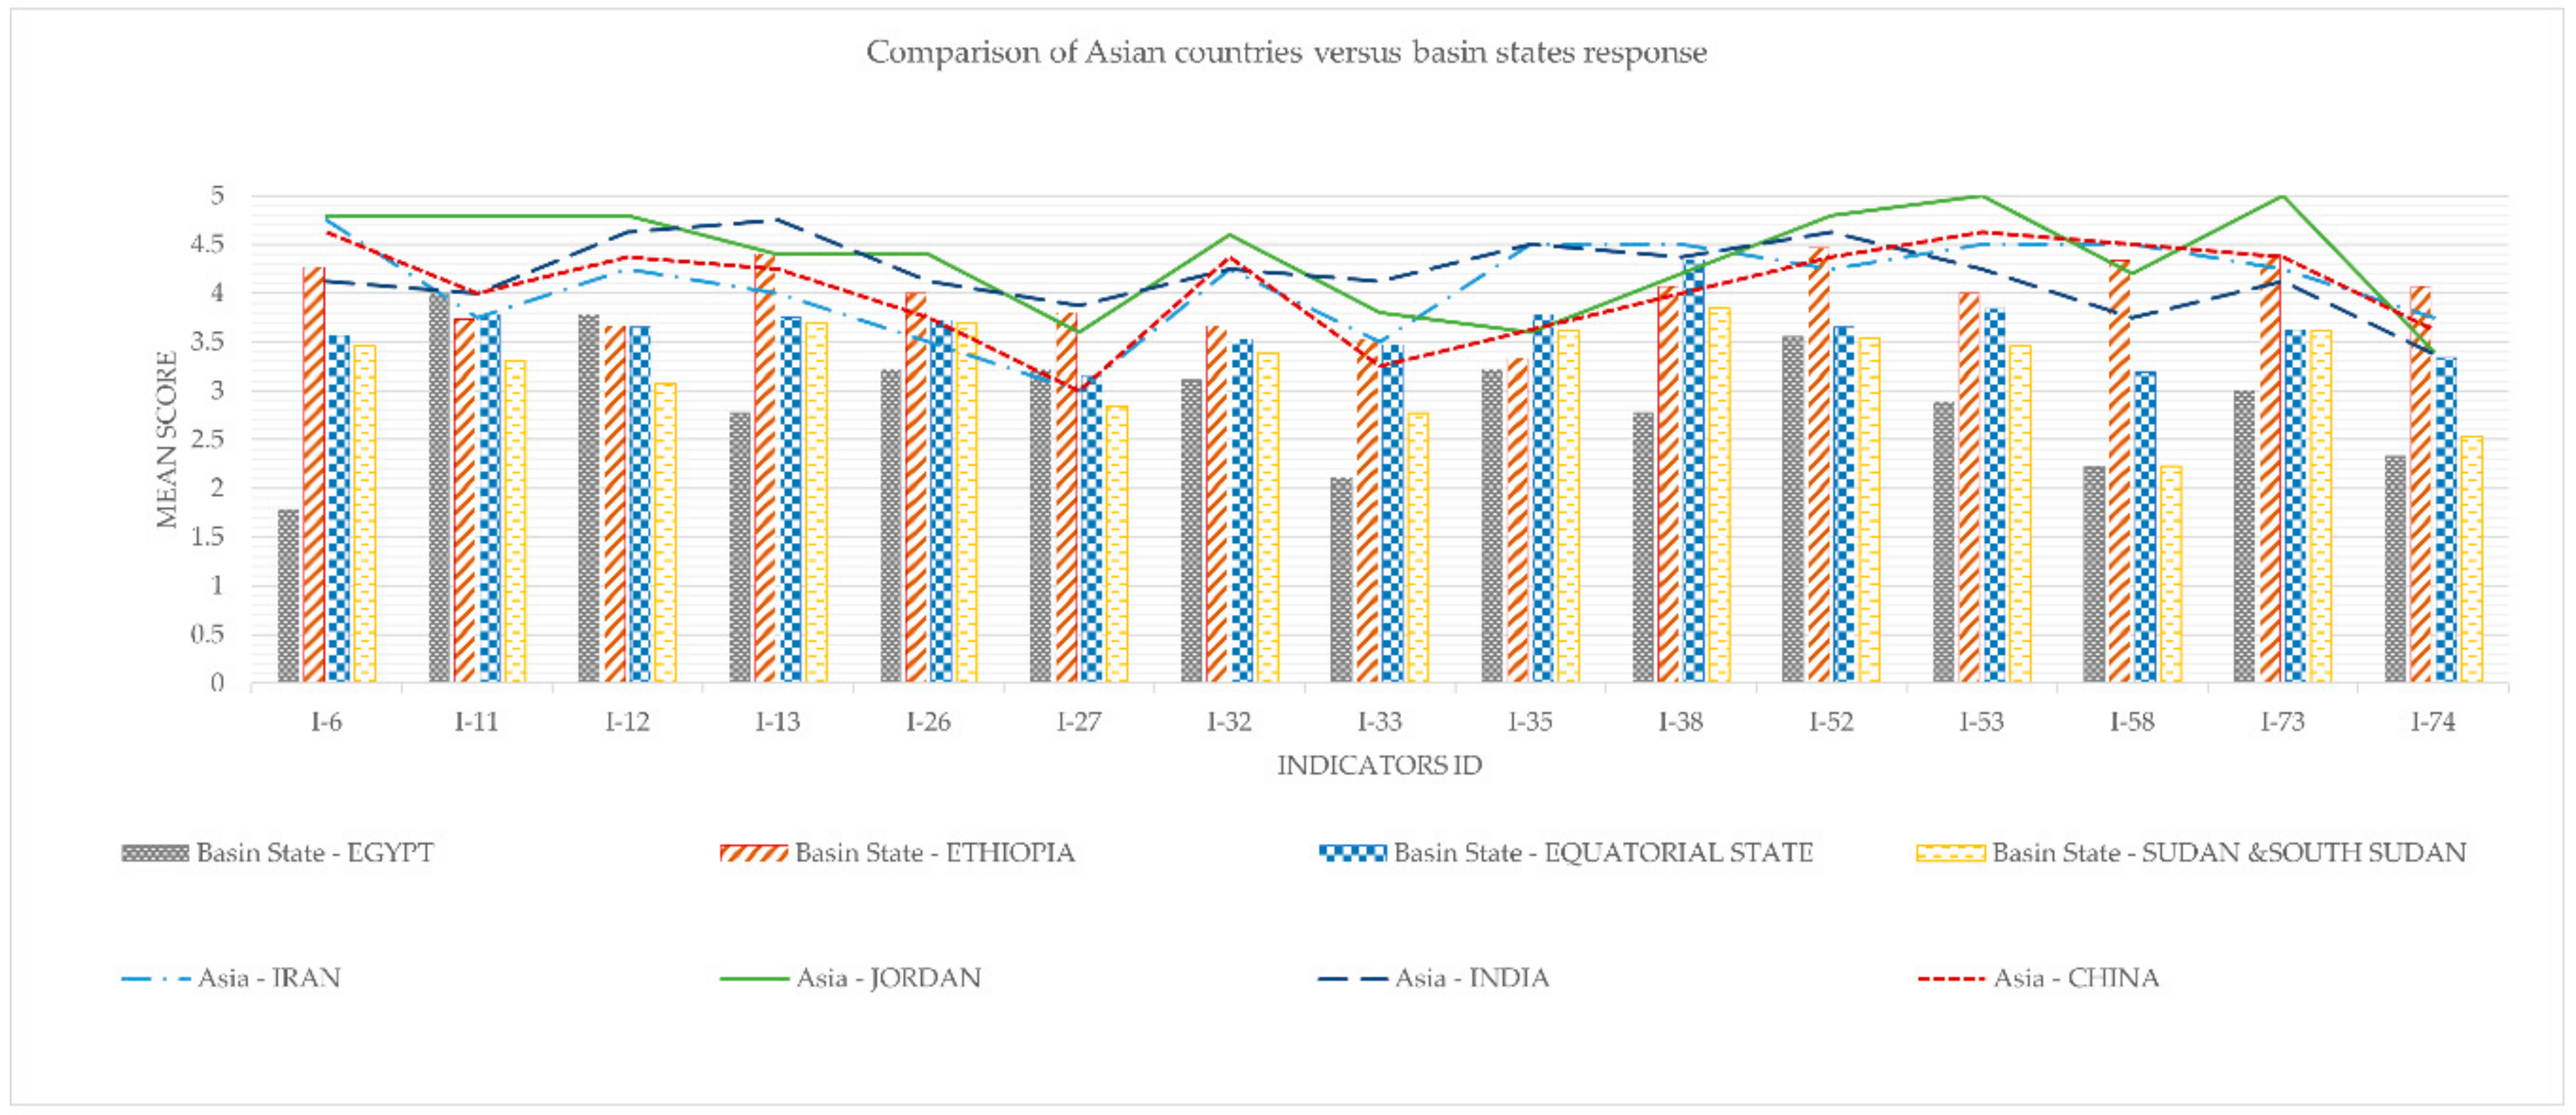
Comparing individual basin states with aggregated non-basin countries, for the 19 indicators (mean value), one or more basin states exhibited a statistically significant difference with non-basin countries (
Figure 10), except for red list index value in each country (I-11). Predominantly, the non-basin experts’ opinions aligned with upstream states, especially with Ethiopia. The largest gap for most of the indicators was observed between Egypt and non-basin experts. Sudan experts’ opinions aligned closely with Egypt for indicators such as I-58 and I-74. However, for the remaining indicators, Sudan responses aligned more closely with upstream states, particularly with equatorial countries.
4.4. Important Indicators within Nile Basin
To categorize indicator consensus levels based on expert responses, both the statistical test results and the majority rules detailed in the methods section were applied. Accordingly, for 56 indicators, expert responses exhibited no significant difference, irrespective of their profession and country, and were classified as a high consensus level (
Table S2). In contrast, for three indicators, there was no statistically significant agreement either among basin states or between basin and non-basin groups. Thus, they were classified at a level of low consensus. These three indicators included the average drought affected people per year (I-6), estimated cost to conserve erosion hot spot areas (I-58), and revenue and job opportunity from ports (I-74). Nine indicators with a statistically significant disagreement either among basin states or between the basin and non-basin states, yet experts rated the indicators as very important more than50% of the time were classified at a level of moderate consensus. Finally, there were seven indicators for which there was no statistically significant agreement, either among basin states or between basin and non-basin groups. Experts rated the indicators as very important <50% of the time, and they were classified at a level of low consensus. As a result, 10 of the 75 indicators fell into the low consensus category.
5. Discussion
To the best of our knowledge, this study is the first to identify indicators that define factors listed under the 1997 UN Watercourse Convention by involving multidisciplinary experts from five areas of expertise around the globe. Overall, though the majority of 215 experts tended to rate most of the indictors as important, there were also notable differences between indicators. The investigations into possible sources of these differences by clustering analysis indicate neither professional background nor experts’ geographic home in terms of basin and non-basin states play a significant role. A clear grouping in data was observed, however, considering experts in upstream versus downstream countries. Still, this does not necessarily imply there are no difference between basin and non-basin or individual countries. Rather, the statistical test outcomes confirmed the existence of a significant difference for 8 (among basin countries) and 11 (between basin and non-basin countries) indicators. In addition, Egyptian experts had a significant difference on 2 of these 19 indicators among themselves.
The mean comparison of these 19 indicators suggests that Egypt experts’ preferences are different from other countries. This also seems likely due to the influence of national interests than other scientific justification for water allocation. Considering the socioeconomic conditions of Egypt versus other basin states—with the largest per capita water storage, fewest impoverished people, fixed crop types, and largest port-based income [
33,
37,
38,
39]—the influence of nationalistic bias is not unexpected. Sudan exhibits a mix of characteristics. Given the high crop water requirements in both Egypt and Sudan as compared to other basin states [
40], both are interested in virtual water trade (I-61). Similarly, experts from Sudan and Egypt valued the importance of considering costs to conserve severe erosion (I-58) and opportunities from ports (I-74) less. However, the two countries were distinctly different on the remaining indicators, with Sudan generally aligning more with other basin states (
Figure A3–
Appendix A). Comparing countries, these indicator preferences were generally aligned with the positions of basin states regarding the Cooperative Framework Agreement, the most recent legal instrument based on the principle of equitable and reasonable utilization still waiting for the required number of ratifications to go into force [
31]. Nevertheless, none of the experts from the non-basin countries were observed to side with a particular basin country (
Figure A4–
Appendix A).
.Therefore, in addition to 24 unique indicators previously applied in different studies to inform fair share of basin states [
8,
9,
10,
11], this study introduced 51 additional indicators. Of these, 56 out of the 75 indicators were categorized as highly important, and of the remaining 19 indicators for which significant differences were observed, the level of consensus was labelled as moderate and low (9 and 10), respectively. Out of to the 24 indicators used in previous studies on different river basins, 16 of them were found highly relevant to the Nile basin.
6. Conclusions
The principle of equitable and reasonable utilization agreed to by Egypt, Sudan, and Ethiopia in their 2015 Declaration of Principles (DoP) does not readily allow for quantification of water sharing due to limitations of international laws in detailing measurable criteria for factors listed in this document and the UNWC guidelines. This study identified and evaluated basin-specific indicators by engaging professionals from basin and non-basin states. As observed from the summary of survey result, although experts from different geographic locations have divided responses on the importance of 75 proposed indicators, about 60% and 80% of basin and non-basin professionals, respectively, had a tendency to consider the majority of indicators to be relevant. The statistical tests revealed that experts grouped as basin versus non-basin and downstream versus upstream states had a significant difference among, between, and within countries on 19 indicators. The findings also illustrate that the major differences in assigning importance levels to proposed indicators mainly occurred between Egypt and other countries, even more so than between basin and non-basin states. Furthermore, a clustering analysis indicates that these differences were likely more a result of national interests rather than profession background.
Though the position of Sudan varies from indicator to indicator, the findings of this study are generally similar to the position that basin countries have on the Cooperative Framework Agreement and current disagreements over the Grand Ethiopian Renaissance Dam. In conclusion, out of 75 indicators, multidisciplinary experts identified 56 as highly relevant indicators, while only 9 (10) indicators were categorized as moderate (less) relevant. On this basis, given the number of highly important indicators, the degree of disagreement is not interpreted to be as wide as reported in press releases following talks and negotiations discussing political engagements over the use of the Nile River. Rather, the indicators for which there is a high level of consensus can potentially lead to a solid foundation for putting the UNWC into action and pave the way for utilization of the Nile River based on the equitable and reasonable principle. Moreover, in addition to facilitating the allocation of water between riparian countries, breaking down these broad factors into measurable indicators could help legal and water resource policy makers to resolve disputes and mitigate controversial issues in the river basin. However, as highlighted in the results, since competing interests of the basin countries potentially influence expert’s judgment and these interests vary from basin to basin, all indicators evaluated in this study for the Nile River basin may not be appropriate for other basins, as local context must be considered. Even within the same basin, regularly gauging expert opinions about indicators may also be important as countries and conditions change.
As the number of experts surveyed increases from all locations, the categories of moderately important indicators may change. However, we deem the 56 highly important indicators as adequate to improve measurability of the UNWC factors, capture the unique features of the Nile basin, and accommodate conflicting interests of states. Beyond laying a foundation for operationality of the UNWC, the outcomes of this study pave the way for the quantification of water allocations to riparian countries. Future work should address investigating the priority or weight of individual indicators for use in water resources modelling.
Supplementary Materials
The following are available online at
https://www.mdpi.com/2073-4441/12/9/2499/s1, Table S1: Factors, Potential indicators and their description, Table S2: Cumulative percentage vote of indicators and the level of consensus among experts.
Author Contributions
Conceptualization, Y.G. and S.A.T.; Data curation, Y.G.; Formal analysis, Y.G.; Funding acquisition, G.A. and S.A.T.; Investigation, Y.G.; Methodology, Y.G. and S.A.T.; Project administration, S.A.T.; Resources, P.B., G.A. and S.A.T.; Software, Y.G.; Supervision, P.B. and S.A.T.; Validation, P.B. and S.A.T.; Visualization, Y.G.; Writing—original draft, Y.G.; Writing—review & editing, P.B., G.A., M.M. and S.A.T. All authors have read and agreed to the published version of the manuscript.
Funding
This work was financially supported by a collaborative partnership between the University of Calgary, Canada and Bahir Dar University (BDU), Ethiopia.
Acknowledgments
The authors would like to thank University of Wisconsin-Madison for facilitating data collection and research visit.
Conflicts of Interest
The authors declare no conflict of interest.
Appendix A
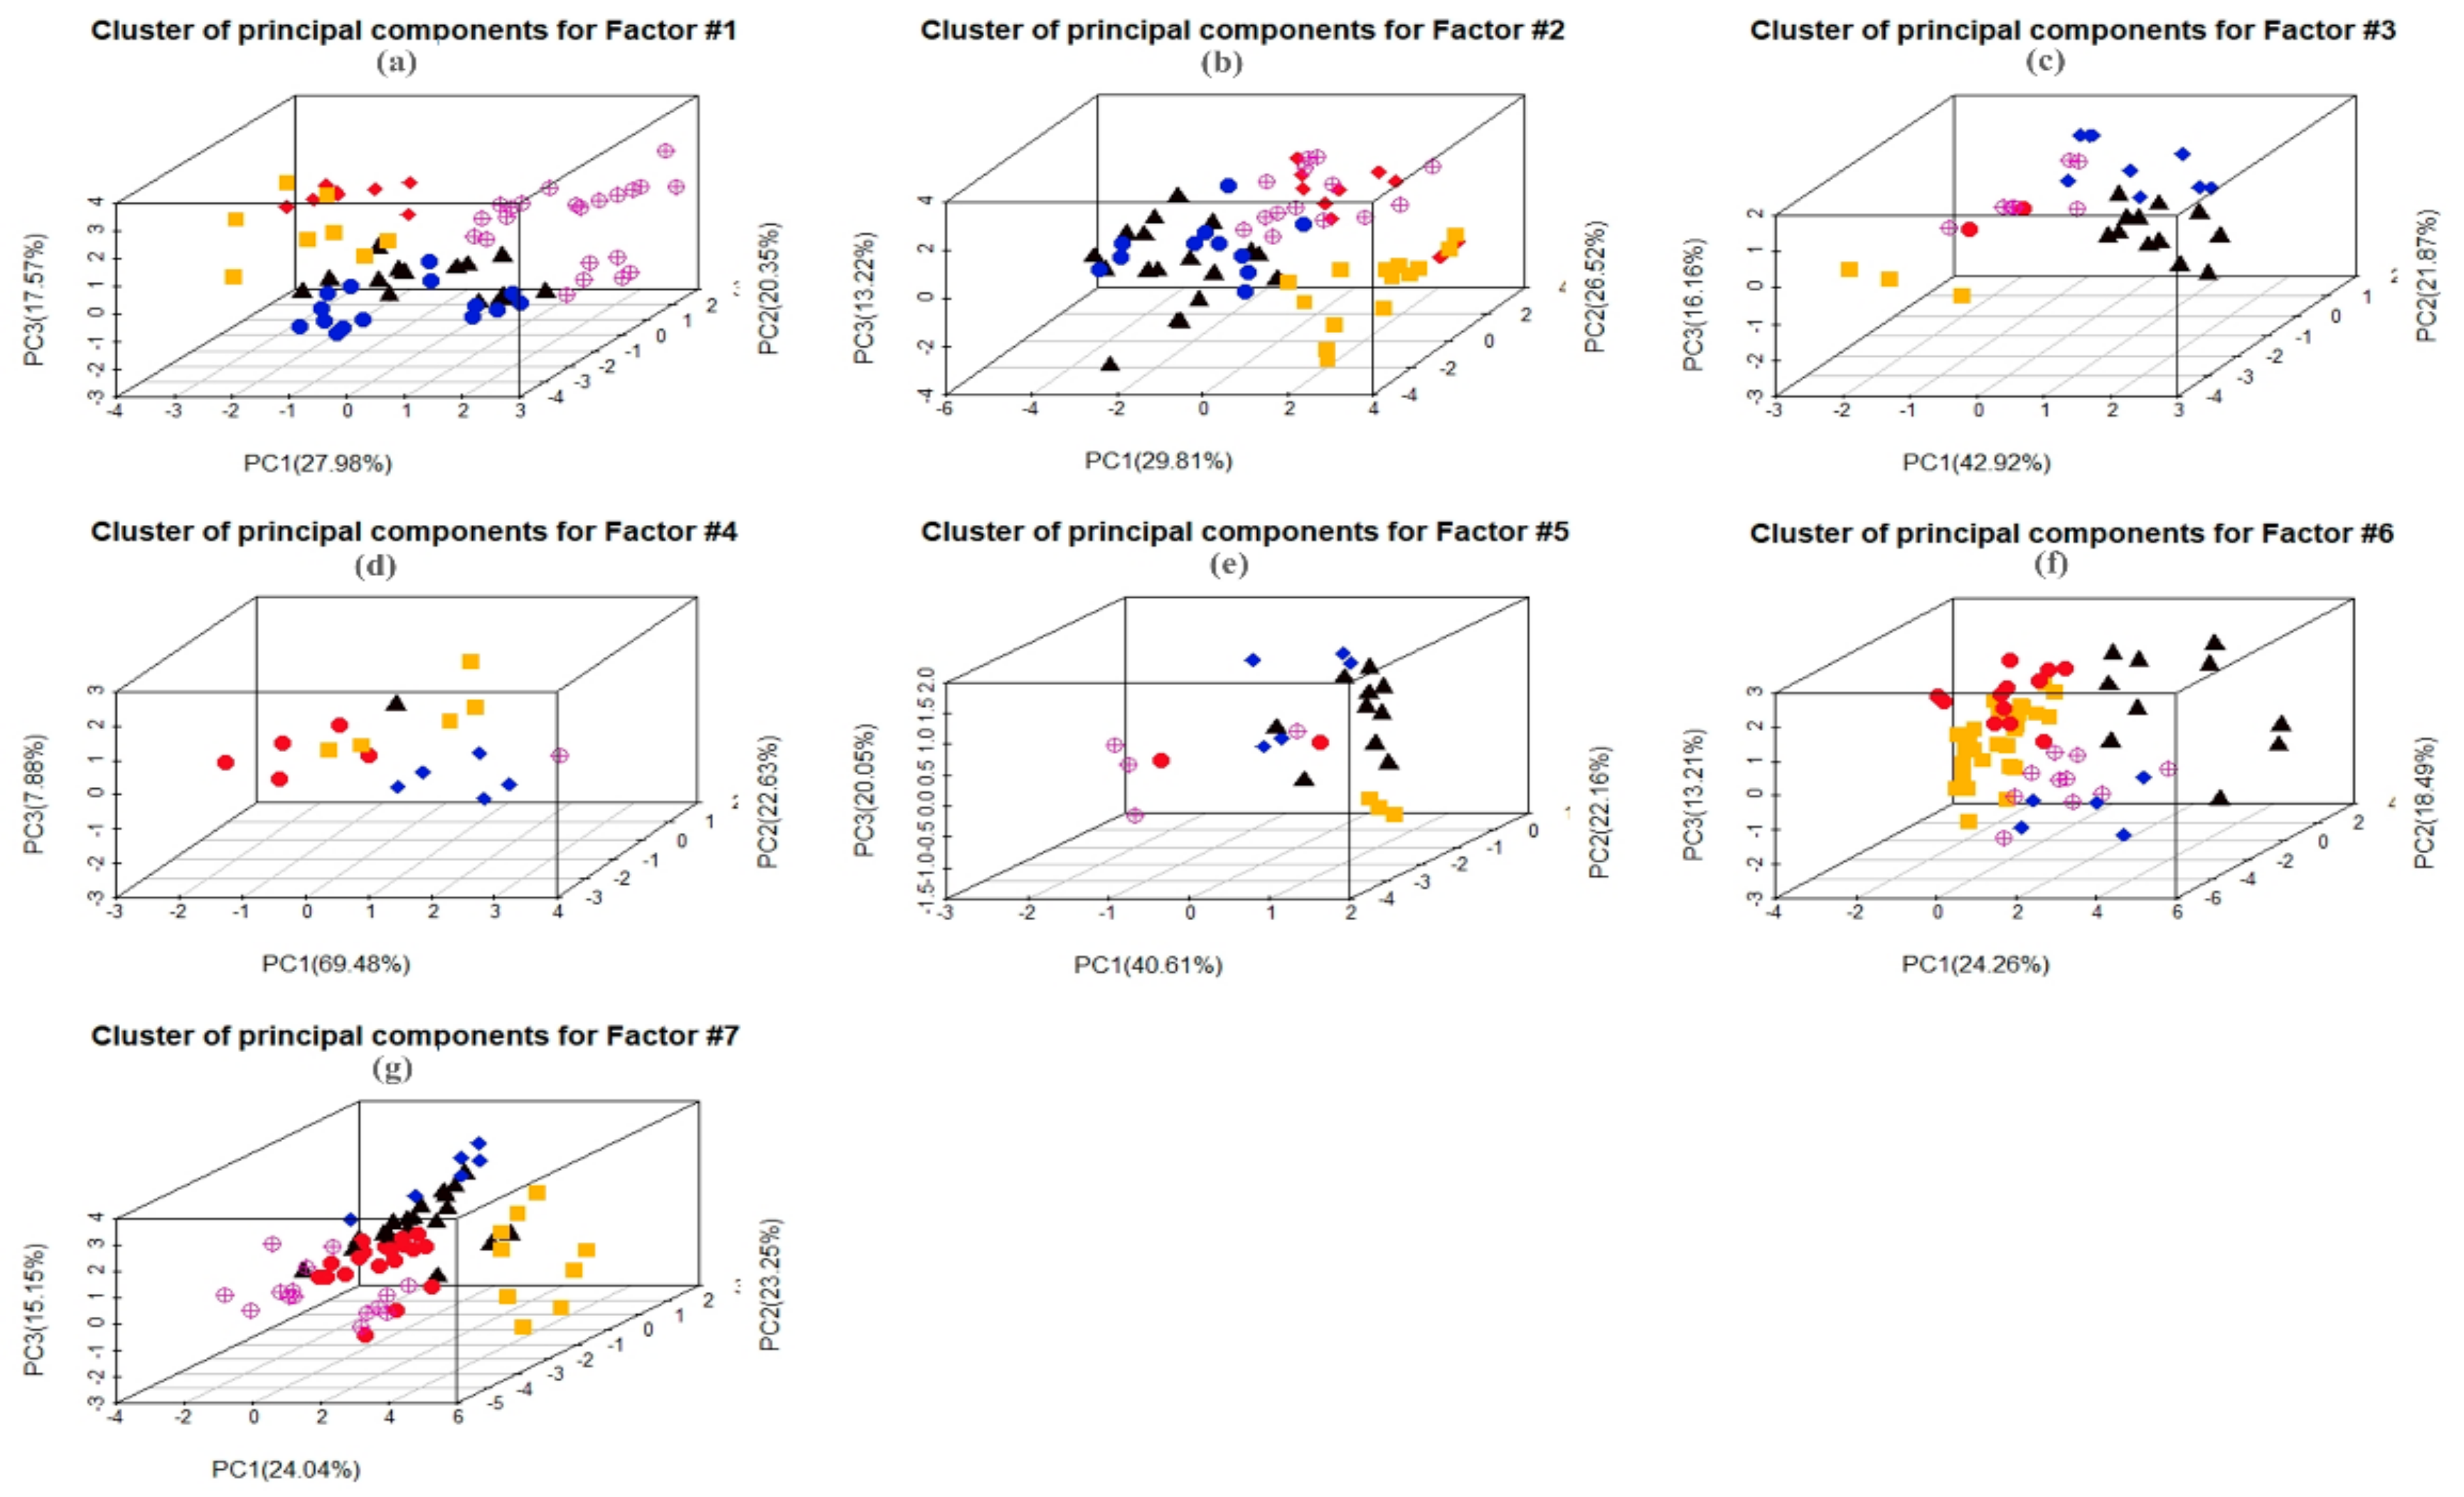
Figure A1.
A cluster based on basin experts’ professions, in which black triangles are hydrologists, yellow rectangles are socioeconomics, purple crossed circles are environmentalists, red circles are political scientists, and blue diamonds are law experts, where (a) are experts response divisions on indicators under factor-#1—natural features, (b) factor-#2—socioeconomic needs of basin states, (c) factor-#3—the population dependent on the watercourse, (d) factor-#4—the effects of water use, (e)factor-#5—existing and potential uses, (f) factor-#6—costs of conservation & protection, and (g) factor-#7—availability of alternative and comparable values.
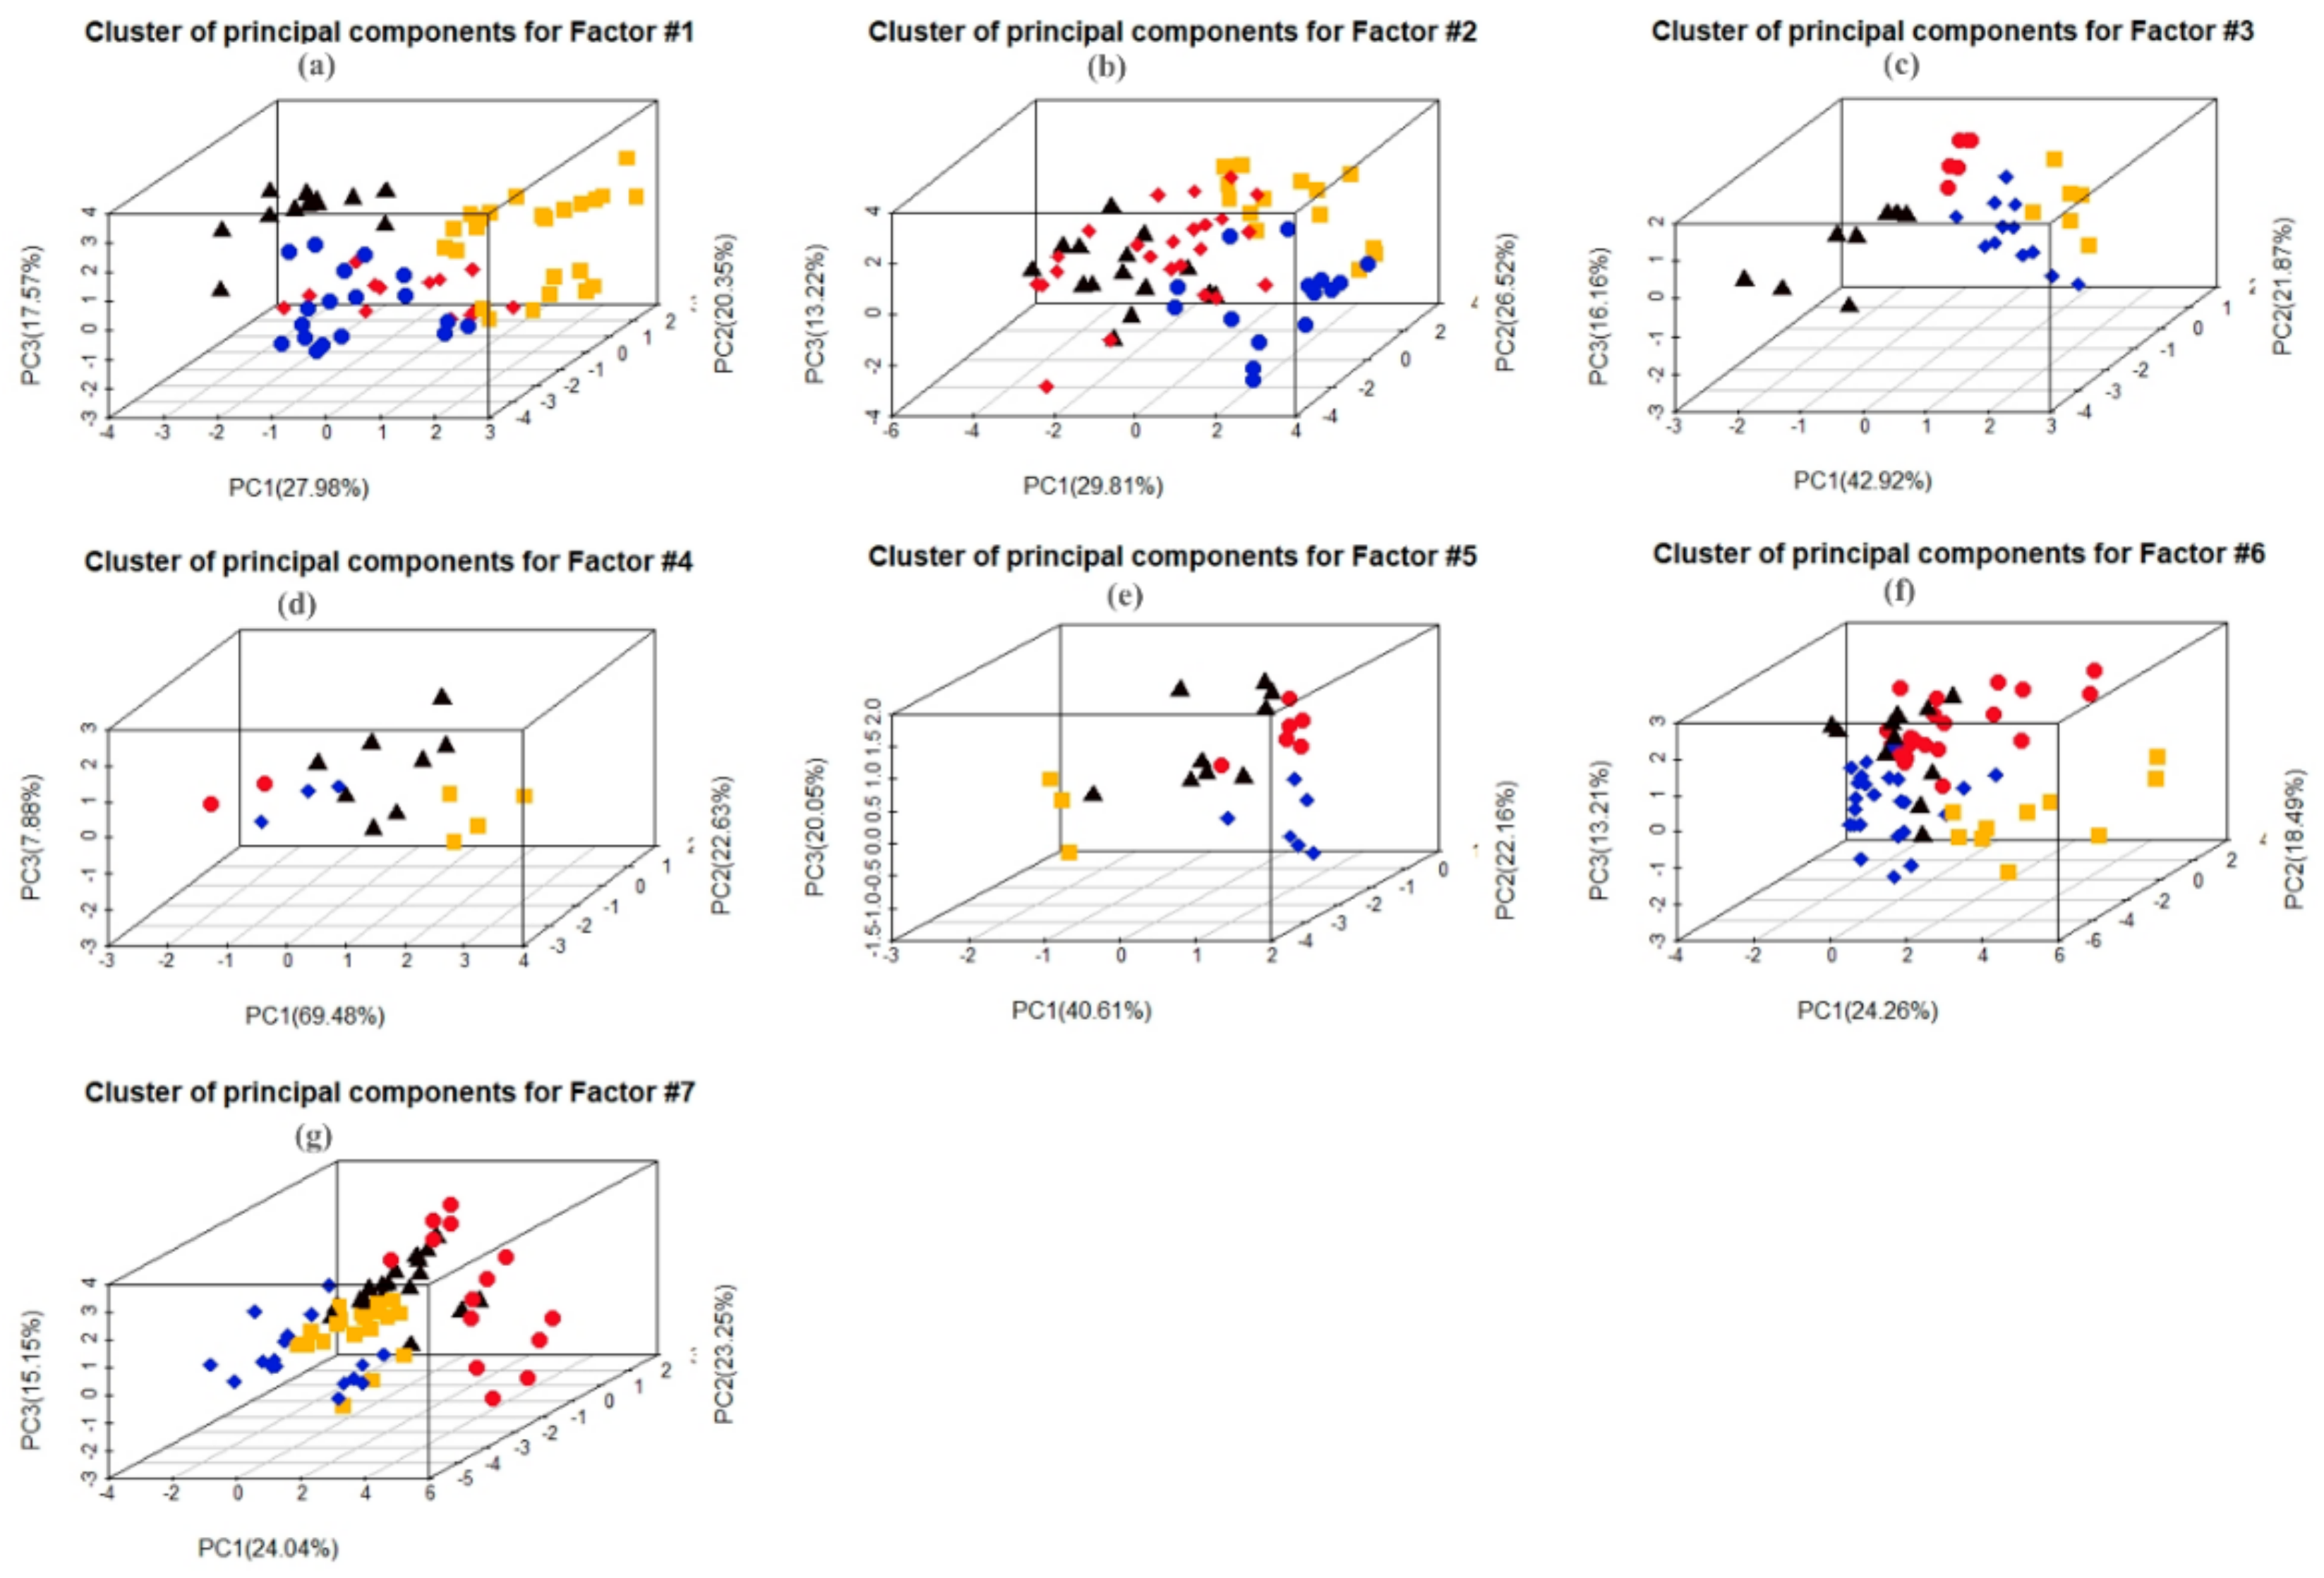
Figure A2.
A cluster based on individual basin experts’ country of origin, in which black triangles are Egyptian, yellow rectangles are Ethiopians, red circles are equatorial states, and blue diamonds are Sudanese, where (a) is experts response division on indicator under factor-#1 called natural features, (b) factor-#2—socioeconomic needs of basin states, (c) factor-#3—the population dependent on the watercourse, (d) factor-#4—the effects of water use, (e)factor-#5—existing and potential uses, (f) factor-#6—costs of conservation and protection, and (g) factor-#7—availability of alternative and comparable values.
Figure A3.
Mean value of indicators for which basin states were statistically significantly different.
Figure A3.
Mean value of indicators for which basin states were statistically significantly different.
Figure A4.
The response of Arab league and middle east countries as compared to basin states experts.
Figure A4.
The response of Arab league and middle east countries as compared to basin states experts.
References
- Boretti, A.; Rosa, L. Reassessing the projections of the World Water Development Report. NPJ Clean Water 2019, 2, 1–4. [Google Scholar] [CrossRef]
- Roth, V.; Lemann, T.; Zeleke, G.; Subhatu, A.T.; Nigussie, T.K.; Hurni, H. Effects of climate change on water resources in the upper Blue Nile Basin of Ethiopia. Heliyon 2018, 4, e00771. [Google Scholar] [CrossRef] [PubMed] [Green Version]
- Abbaspour, K.C.; Faramarzi, M.; Ghasemi, S.S.; Yang, H. Assessing the impact of climate change on water resources in Iran. Water Resour. Res. 2009, 45, 1–16. [Google Scholar] [CrossRef] [Green Version]
- Yihdego, Z.; Rieu-Clarke, A. An exploration of fairness in international law through the Blue Nile and GERD. Water Int. 2016, 41, 528–549. [Google Scholar] [CrossRef]
- Rieu-Clarke, A.; Moynihan, R.; Magsig, B.-O. Un Watercourses Convention User’s Guide; IHP-HELP Centre for Water Law: Dundee, UK, 2012. [Google Scholar]
- Salman, S.M.A. The Helsinki Rules, the UN Watercourses Convention and the Berlin Rules: Perspectives on International Water Law. Int. J. Water Resour. Dev. 2007, 23, 625–640. [Google Scholar] [CrossRef]
- Muhammad, M.R. Principles of international water law: Creating effective transboundary water resources management. Int. J. Sustain. Soc. 2009, 1, 207–223. [Google Scholar]
- Gabriel, E. Development of International law and the united nation watercourse convention. In Development of International Law and the UN Watercourse Convention, in Hydropolitcs in the Developing world: A Southern African Perspective; University of Pretoria: Pretoria, South Africa, 2002; pp. 89–96. [Google Scholar]
- Tekuya, M. The Egyptian Hydro Hegemony In The Nile Basin: The Quest For Changing The Status Quo. J. Water Law 2018, 26, 10–20. [Google Scholar]
- Jonathan, L.; Mark, G. Equity in Transboundary Water Law: Valuable Paradigm or Merely Semantics. Colo. J. Int. Environ. Law Policy 2006, 17, 89–122. [Google Scholar]
- Wouters, P.K. An Assessment of Recent Developments in International Watercourse Law through the Prism of the Substantive Rules Governing Use Allocation (in English). Nat. Resour. J. 1996, 36, 417–440. [Google Scholar]
- Anikó Raisz, J.E.S. Cross border issues of the Hungarian water resources. Q. J. Environ. Law 2017, 7, 73–98. [Google Scholar]
- Dellapenna, J.W. The customary international law of transboundary fresh waters. Int. J. Glob. Environ. 2001, 1, 264–305. [Google Scholar] [CrossRef]
- McIntyre, O. Utilization of shared international freshwater resources–The meaning and role of “equity” in international water law. Water Int. 2013, 38, 112–129. [Google Scholar] [CrossRef]
- Rajamani, L. Differential Treatment in International Environmental Law; Oxford University Press: New York, NY, USA, 2012. [Google Scholar]
- FitzMaurice, M. Intergenerational Trusts and Environmental Protection. By Catherine Redgwell. [Melland Schill Studies in International Law, Juris Publishing, Manchester University Press. 1999. xiv + 200 pp.]. Int. Comp. Law Q. 2000, 49, 244–245. [Google Scholar] [CrossRef]
- Jeffrey, D.K. A Short Guide to the Rio Declaration. Colo. J. Int. Environ. Law Policy 1993, 4, 119–140. [Google Scholar]
- Franck, T.M. Fairness in International Law and Institutions; Oxford University Press: London UK, 1995. [Google Scholar]
- Bruce, L. Does Article 6 (Factors Relevant to Equitable and Reasonable Utilization) in the UN Watercourses Convention misdirect riparian countries? Water Int. 2013, 38, 130–145. [Google Scholar]
- Beaumont, P. The 1997 UN Convention on the Law of Non-navigational Uses of International Watercourses: Its Strengths and Weaknesses from a Water Management Perspective and the Need for New Workable Guidelines. Int. J. Water Resour. Dev. 2000, 16, 475–495. [Google Scholar] [CrossRef]
- Ziad, A.M.; Bassam, I.S. A Decision Tool for Allocating the Waters of the Jordan River Basin between all Riparian Parties. Water Resour. Manag. 2003, 17, 447–461. [Google Scholar]
- Kampragou, E.; Eleftheriadou, E.; Mylopoulos, Y. Implementing Equitable Water Allocation in Transboundary Catchments: The Case of River Nestos/Mesta. Water Resour. Manag. 2006, 21, 909–918. [Google Scholar] [CrossRef]
- Fariba, A.; Jalal, A.; Ali, M. Modelling Equitable and Reasonable Water Sharing in Transboundary Rivers: The Case of Sirwan-Diyala River. Water Resour. Manag. 2017, 31, 1191–1207. [Google Scholar]
- Collins, R.O. The Waters of the Nile: Hydropolitics and the Jonglei Canal 1900–1988; Clarendon Press: Oxford, UK, 1990. [Google Scholar]
- Abdalla, I.H. The 1959 Nile Waters Agreement in Sudanese-Egyptian relations. Middle East. Stud. 1971, 7, 329–341. [Google Scholar] [CrossRef]
- Lumumba, P.L.O. The interpretation of the 1929 treaty and its Legal Relevance and Implications for the Stability of the Region. Afr. Sociol. Rev. Rev. Afr. De Sociol. 2010, 11, 10–24. [Google Scholar] [CrossRef]
- Lawson, F.H. Egypt versus Ethiopia: The Conflict over the Nile Metastasizes. Int. Spect. 2017, 52, 129–144. [Google Scholar] [CrossRef]
- Obengo, J.O. Hydropolitics of the Nile: The case of Ethiopia and Egypt. Afr. Secur. Rev. 2016, 25, 95–103. [Google Scholar] [CrossRef]
- Mohamed, N.N. Continuous Dispute Between Egypt and Ethiopia Concerning Nile Water and Mega Dams. In The Handbook of Environmental Chemistry; Negm, A., Abdel-Fattah, S., Eds.; Grand Ethiopian Renaissance Dam Versus Aswan High Dam; Springer: Berlin/Heidelberg, Germany, 2018. [Google Scholar]
- Bayeh, E. Agreement on Declaration of Principles on the Grand Ethiopian Renaissance Dam Project: A Reaffirmation of the 1929 and 1959 Agreements? Arts Soc. Sci. J. 2016, 7, 1–13. [Google Scholar]
- Salman, S.M.A. The Nile Basin Cooperative Framework Agreement: A peacefully unfolding African spring? Water Int. 2013, 38, 17–29. [Google Scholar] [CrossRef]
- Salman, S.M.A. The Grand Ethiopian Renaissance Dam: The road to the declaration of principles and the Khartoum document. Water Int. 2016, 41, 512–527. [Google Scholar] [CrossRef]
- NBI. The Nile Basin Water Resource Atlas. 2016. Available online: http://atlas.nilebasin.org/treatise/nile-basin-water-resources-atlas/ (accessed on 10 May 2019).
- Abtew, W.; Dessu, S.B. The Nile River and Transboundary Water Rights. In The Grand Ethiopian Renaissance Dam on the Blue Nile; Springer International Publishing: Cham, Switzerland, 2019; pp. 13–27. [Google Scholar]
- John, O.; Hellen, O.-N.; Lydia, N.; Nancy, L.; Nicholas, W. Exploration of food security situation in the Nile basin region. Dev. Agric. Econ. 2011, 3, 74–285. [Google Scholar]
- Formann, A.K. Die Latent-Class-Analyse: Einführung in Theorie und Anwendung; Beltz: Weinheim, Germany, 1984. [Google Scholar]
- Ahmed, A.A.; Ismail, U.H.A.E. Sediment in the Nile River System; UNESCO International Hydrological Programme International Sediment Initiative: Khartoum, Sudan, 2008. [Google Scholar]
- Grebmer, K.v.; Bernstei, J.; Patterson, F.; Wiemers, M.; Chéilleachair, R.N.; Foley, C.; Gitter, S.; Ekstrom, K.; Fritschel, H. Global Hunger Index The Challenge Of Hunger And Climate Change. Global Hunger Index, Dublin / Bonn2019. Available online: https://www.globalhungerindex.org/results.html (accessed on 10 May 2019).
- Commercial Ports. Maritime Transport Sector. Available online: http://mts.gov.eg/en/sections/10/1-10-Commercial-Ports (accessed on 12 May 2019).
- El-Marsafawy, S.M.; Swelam, A.; Ghanem, A. Evolution of Crop Water Productivity in the Nile Delta over Three Decades (1985–2015). Water 2018, 10, 1168–1170. [Google Scholar] [CrossRef] [Green Version]
Figure 1.
Map of the Nile basin.
Figure 1.
Map of the Nile basin.
Figure 2.
Quantity and spatial distribution of the survey.
Figure 2.
Quantity and spatial distribution of the survey.
Figure 3.
Country, number, and profession composition of experts responded the survey.
Figure 3.
Country, number, and profession composition of experts responded the survey.
Figure 4.
Flowchart for identifying the consensus level for each indicator.
Figure 4.
Flowchart for identifying the consensus level for each indicator.
Figure 5.
A percentage summary of survey responses for indicators from basin state experts.
Figure 5.
A percentage summary of survey responses for indicators from basin state experts.
Figure 6.
A percentage summary of survey responses for indicators from non-basin state experts.
Figure 6.
A percentage summary of survey responses for indicators from non-basin state experts.
Figure 7.
A cluster based on hydrologic position of basin states (i.e., cluster 1 and cluster 2 represent upstream and downstream countries, respectively), where (a) is experts response division on indicators under factor-#1—called geography, hydrology, ecology, and natural features, (b) factor-#2—socio-economic needs of basin states, (c) factor-#3—the population dependent on the watercourse, (d) factor-#4—the effects of water use, (e) factor-#5—existing and potential uses, (f) factor-#6—costs of conservation and protection, and (g) factor-#7—availability of alternative and comparable values and uses.
Figure 8.
The number of experts from upstream and downstream states in each cluster, organized by factor. Where factor-#1 is geography, hydrology, ecology, and natural features, factor-#2 is socio-economic needs of basin states, factor-#3 is the population dependent on the watercourse, factor-#4 is the effects of water use, factor-#5 is existing and potential uses, factor-#6 is costs of conservation and protection, and factor-#7 is availability of alternative and comparable values and uses.
Figure 9.
Clusters based on membership in basin (red circles) or non-basin (blue diamonds) states. Where factor—#1 is geography, hydrology, ecology, and natural features, factor-#2 is socio-economic needs of basin states, factor-#3 is the population dependent on the watercourse, factor-#4 is the effects of water use, factor-#5 is existing and potential uses, factor-#6 is costs of conservation and protection, and factor-#7 is availability of alternative and comparable values and uses.
Figure 10.
Mean value of all indicators for which individual basin states and non-basin states were statistically significantly different within, among, and between each other. | drought affected people per year (I-6), Red List Index (I-11), greenhouse gas emissions (I-12), environmental performance index (I-13), transport Index (I-26), ICT index (I-27), population living below poverty line (I-30), education index (I-32), infant mortality rate (I-33), gender development index (I-35), population growth rate (I-38), areas exposed for severe soil erosion (I-52), protected forest area (I-53), wetland area (I-56), estimated cost to conserve erosion areas (I-58), virtual water export (I-61), employment in service provision sector (I-73), revenue and job opportunity from ports (I-74), and water saving by crop pattern modification (I-75).
© 2020 by the authors. Licensee MDPI, Basel, Switzerland. This article is an open access article distributed under the terms and conditions of the Creative Commons Attribution (CC BY) license (http://creativecommons.org/licenses/by/4.0/).


