The Impact of Agricultural Production and Policy on Water Quality during the Dry Year 2018, a Case Study from Germany

Coordination Unit Climate, Johann Heinrich von Thünen-Institute, Bundesallee 49, 38116 Braunschweig, Germany
*
Author to whom correspondence should be addressed.
Water 2020, 12(6), 1519; https://doi.org/10.3390/w12061519
Submission received: 14 March 2020
/
Revised: 1 May 2020
/
Accepted: 18 May 2020
/
Published: 26 May 2020
(This article belongs to the Special Issue Land Use and Water Quality)
Abstract
:The hot summer of 2018 posed many challenges with regard to water shortages and yield losses, especially for agricultural production. These agricultural impacts might further pose consequent threats for the environment. In this paper, we deduce the impact of droughts on agricultural land management and on water quality owing to nitrate pollution. Using national statistics, we calculate a Germany-wide soil surface nitrogen budget for 2018 and deduce the additional N surplus owing to the dry weather conditions. Using a model farm approach, we compare fertilization practices and legal restrictions for arable and pig breeding farms. The results show that, nationwide, at least 464 kt of nitrogen were not transferred to plant biomass in 2018, which equals an additional average nitrogen surplus of 30 kg/ha. The surplus would even have amounted to 43 kg/ha, if farmers had continued their fertilization practice from preceding years, but German farmers applied 161 kt less nitrogen in 2018 than in the year before, presumably as a result of the new implications of the Nitrates Directive, and, especially on grassland, owing to the drought. As nitrogen surplus is regarded as an “agri-drinking water indicator” (ADWI), an increase of the surplus entails water pollution with nitrates. The examples of the model farms show that fertilization regimes with high shares of organic fertilizers produce higher nitrogen surpluses. Owing to the elevated concentrations on residual nitrogen in soils, the fertilization needs of crops in spring 2019 were less pronounced than in preceding years. Thus, the quantity of the continuously produced manure in livestock farms puts additional pressure on existing storage capacities. This may particularly be the case in the hot-spot regions of animal breeding in the north-west of Germany, where manure production, biogas plants, and manure imports are accumulating. The paper concludes that water shortages under climate change not only impact agricultural production and yields, but also place further challenges and threats to nutrient management and the environment. The paper discusses preventive and emergency management options for agriculture to support farmers in extremely dry and hot conditions.
1. Introduction
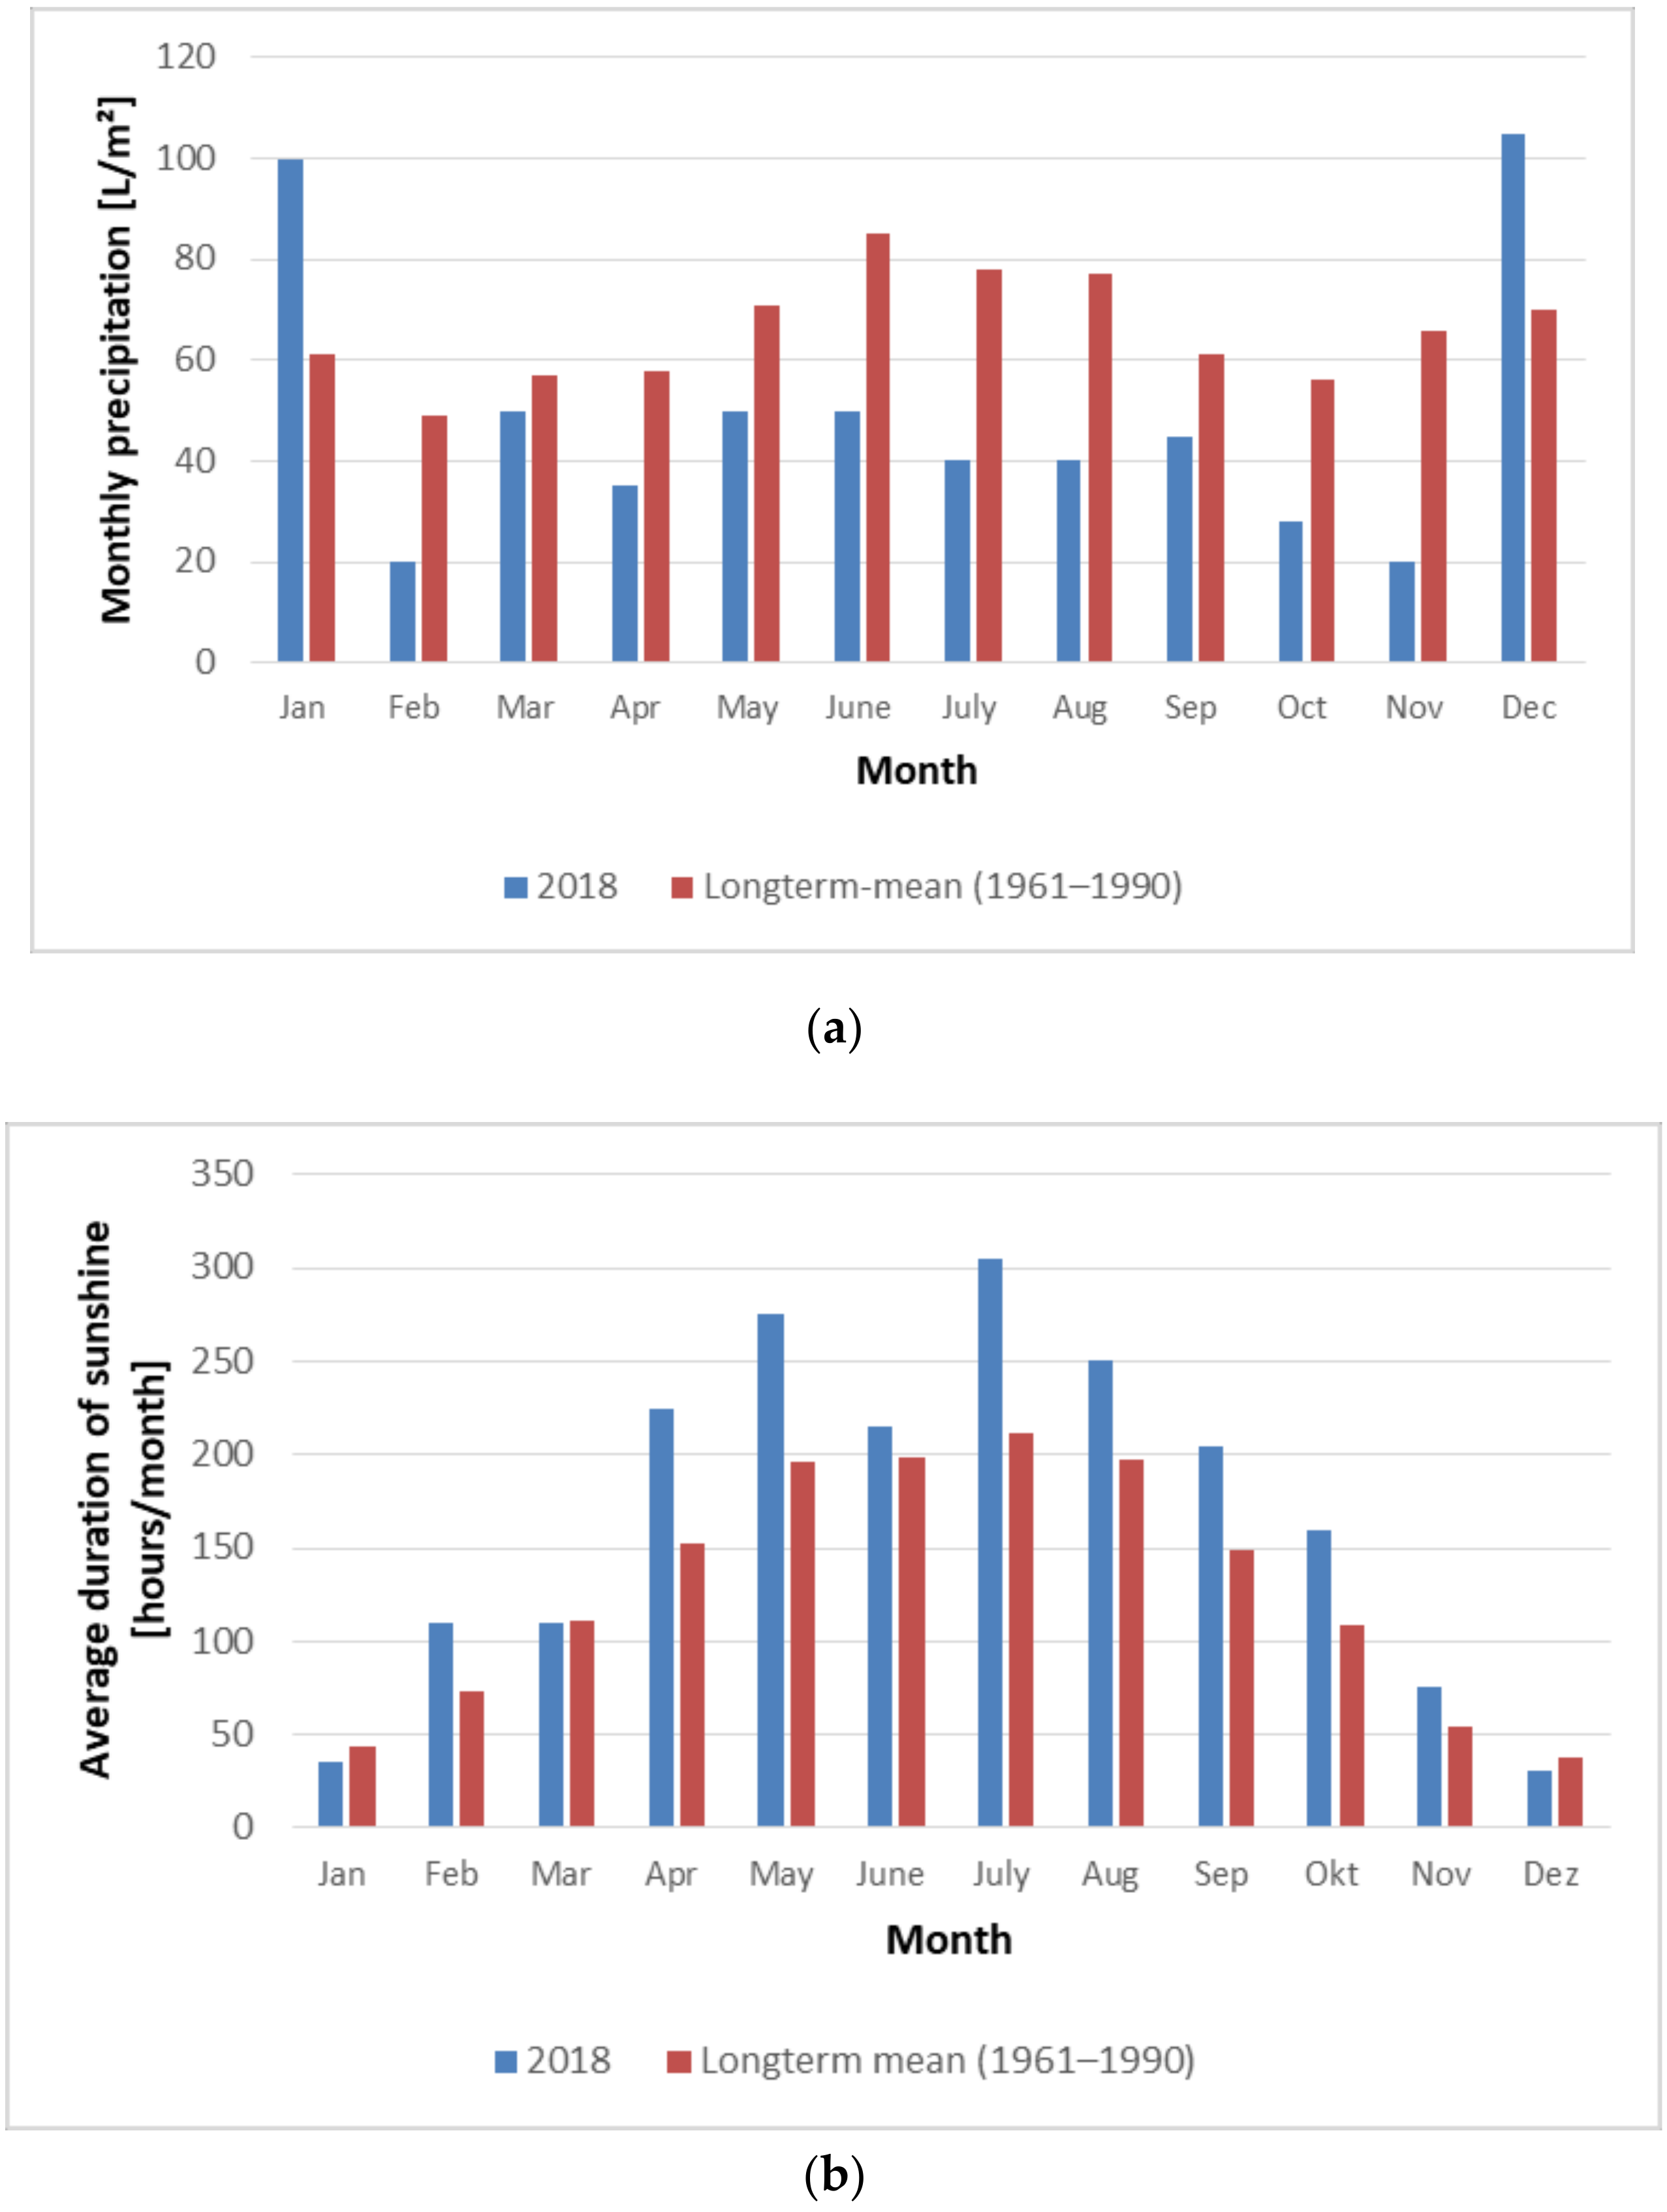
The summer of 2018 was one of the hottest and driest in Europe [1]. Like in other European countries, precipitation in 2018 fell far below the long-term mean (Figure 1a). This refers to all months between February and November 2018 [2].
In comparison with the long-term mean, extended sunny periods between April and November 2018 dominated [1] (Figure 1b). These dry and sunny weather conditions led to a drastic reduction in soil moisture in autumn 2018 [3]. In September and October 2018, the usable field capacity dropped to around 30%, with the exception of south-east Bavaria in southern Germany, where values above 100% were attained. In November 2018, usable field capacity still remained at levels between 35% and 55% [3]. In some areas in the eastern German federal states, the values were remarkably low, at 0–25% [3].
Figure 1.
Conditions in Germany in 2018: (a) average monthly precipitation compared with long-term means (in L/m2) [2] (source: [2], translated); (b) average monthly sunshine in 2018 in Germany compared with long-term means (in hours/month) [4] (source: [4], translated).

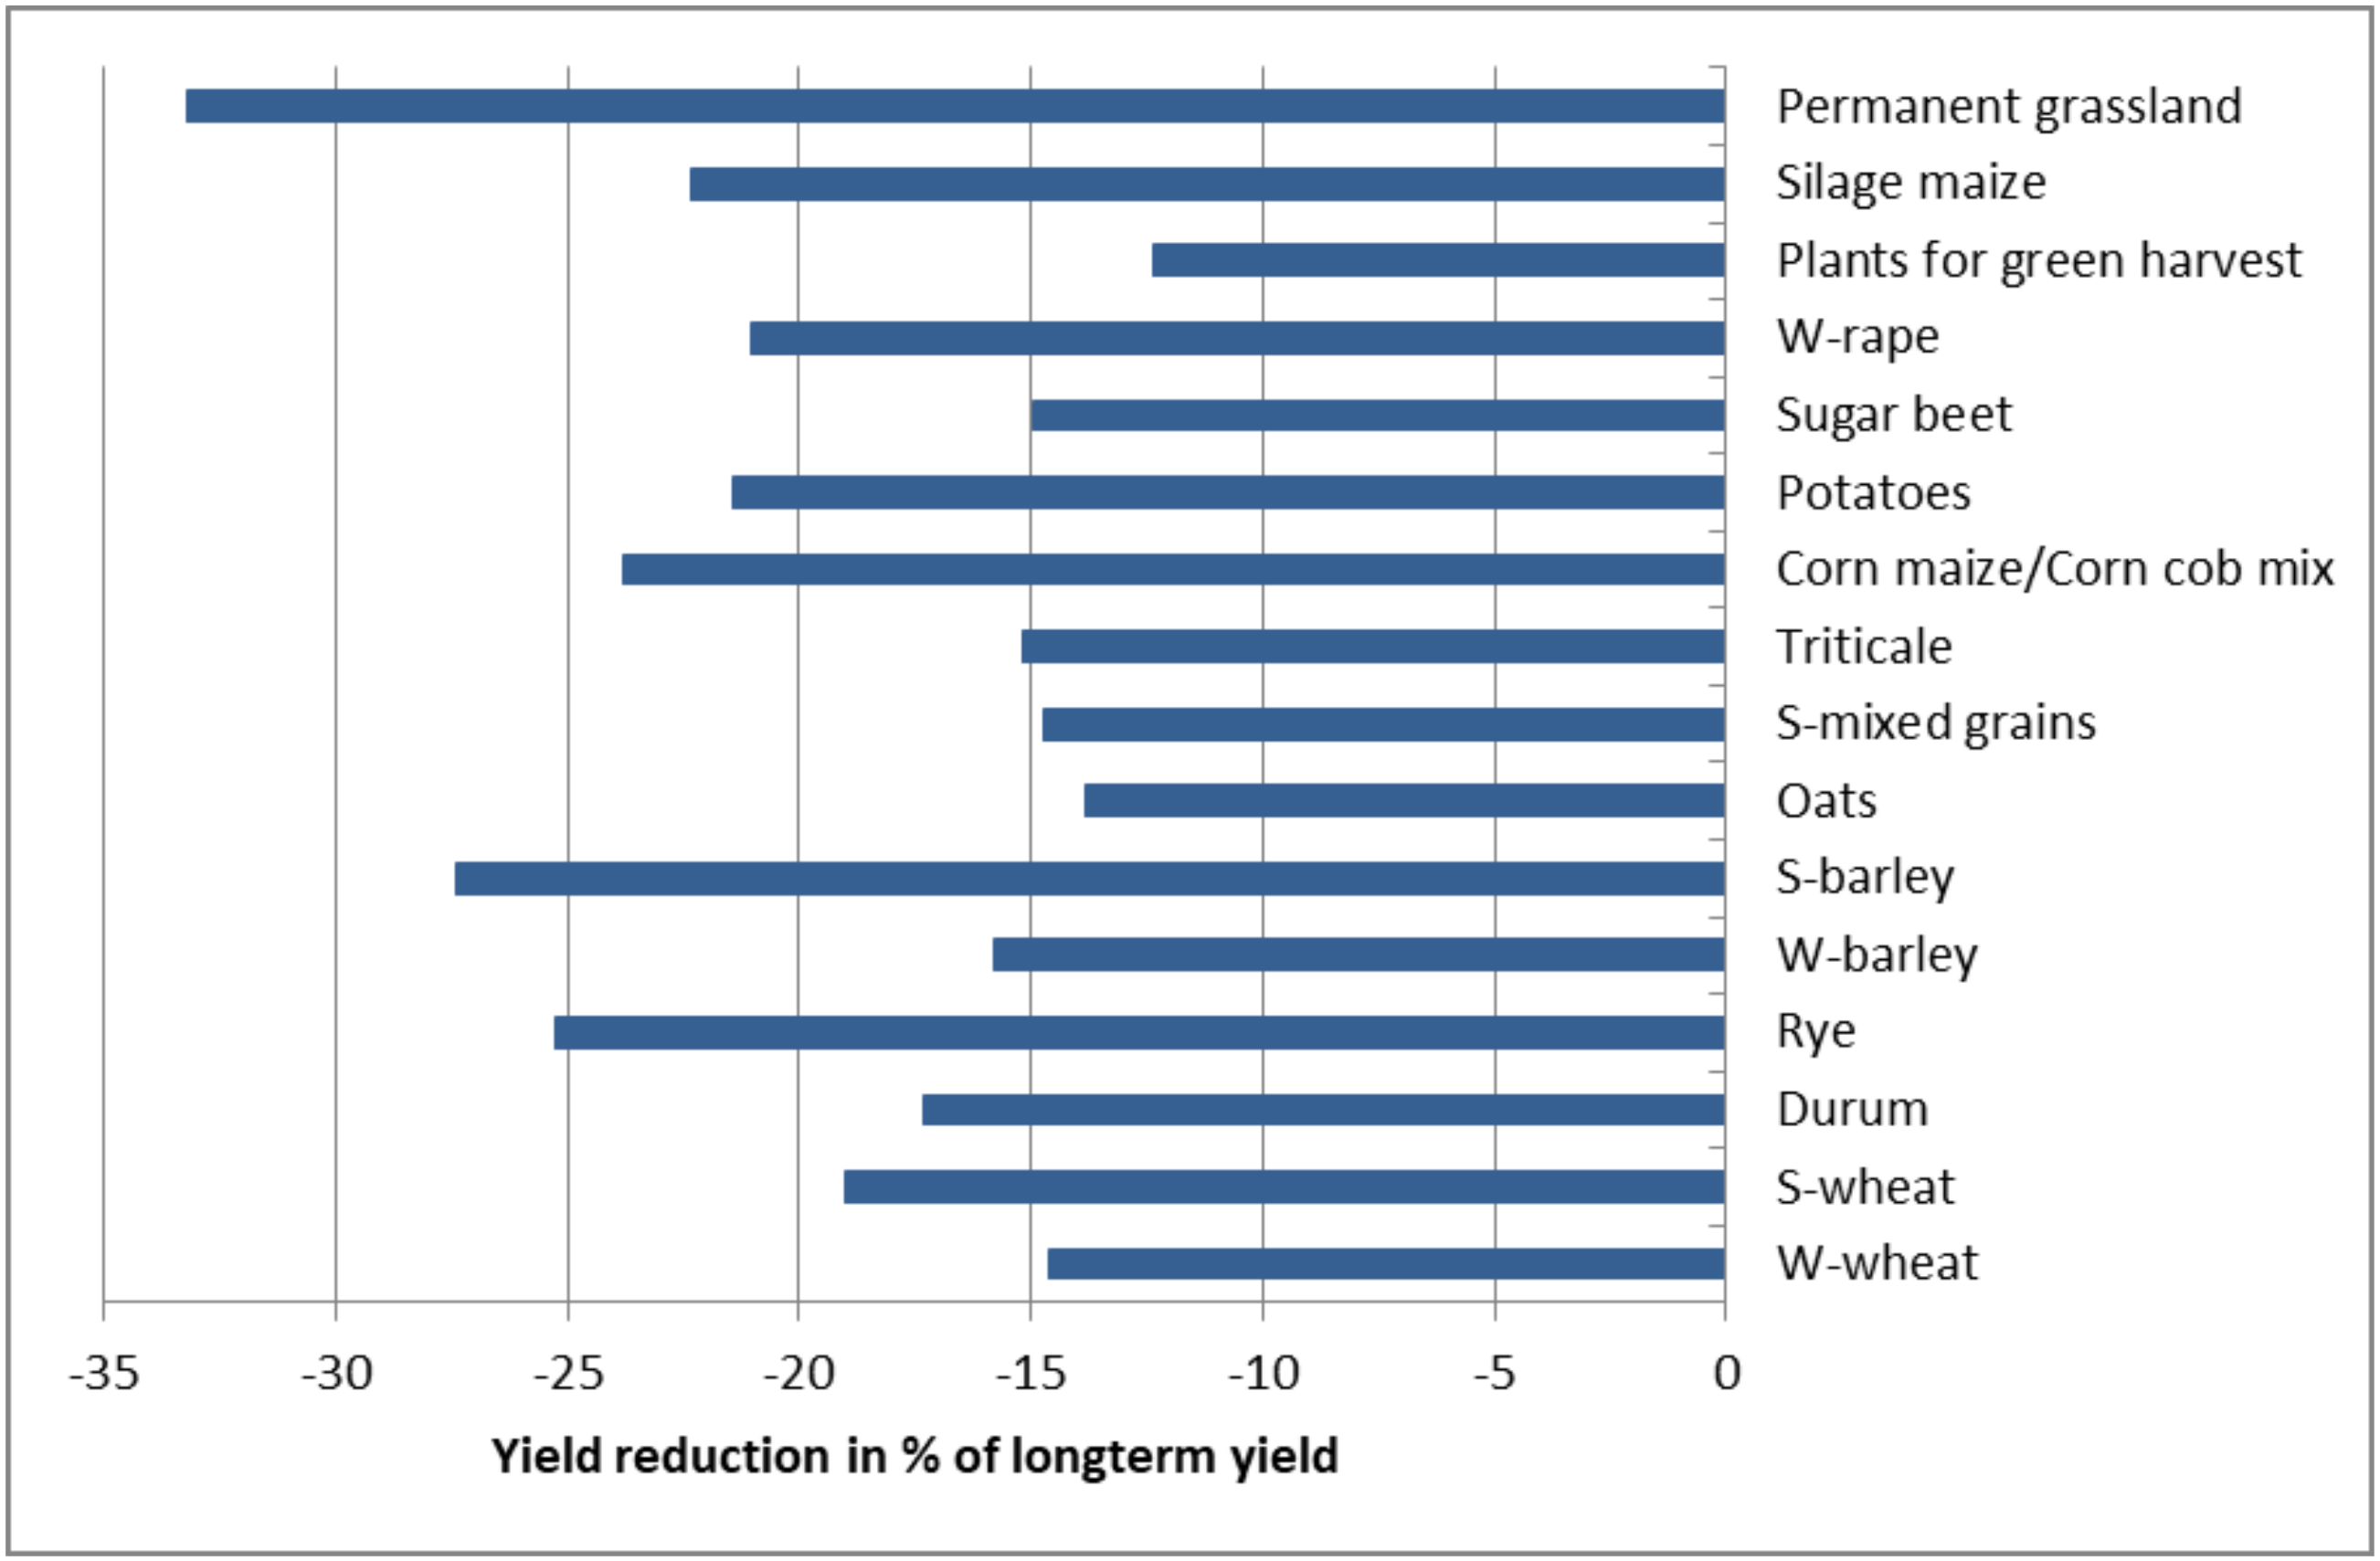
This had an enormous impact on the agriculture of European Union (EU) Member States in northern Europe, like Germany, especially owing to decreasing crop yields. In comparison with the long-term level, yield reductions in 2018 nationwide were significant for all arable crops and for grassland (Figure 2).
The year 2018 can thus be regarded as an example of the impact of extreme weather on agriculture, and serves as a basis for discussion on how extreme events also influence land use and water quality issues. Globally, anthropogenic climate forcing has doubled the probability of years that are both warm and dry in the same location relative to their baseline data [6]. Further, they find an increased joint probability that key crop and pasture regions simultaneously experience unusually warm conditions in conjunction with dry years. That extreme events severely impact agricultural production has been analyzed, for example, by Rosenzweig et al. [7]. Research has also been conducted to analyze the impact on extreme events on nutrient concentrations in groundwater using modelling approaches or statistical regression analysis [6,7].
According to the Organisation for Economic Co-Operation and Development (OECD) [8,9], the gross nitrogen budget (GNB) is an appropriate method to calculate comparable indicators on the regional and national scale. The GNB, as national farm gate budget, is the only European agri-environmental indicator (AEI) for nitrogen efficiency, whereby low efficiency goes along with high nitrogen surplus [10]. Budgets are used in numerous studies as a tool to monitor changes in nitrogen and phosphorus leaching to groundwater and surface water [11,12,13,14,15,16,17,18,19,20,21,22,23]. As investigated in the Horizon 2020 European Union-funded project FAIRWAY (farm systems management and governance for producing good water quality for drinking water supplies), running from 2017 to 2021, nitrogen surplus can be regarded as an “agri-drinking water indicator” (ADWI) [24], which is applied on different scales, from national to farm scale, within the European Union; an increase in N surplus entails an increase in water pollution with nitrates [25]. Different budget types were categorized and visualized by means of diagrams, and their implementation at different scales in Europe has been investigated [25].
Gu et al. [26] analyzed the impact of climate change on nutrient surpluses in China on an average perspective until 2050. Bouwman et al. [27] calculated global nitrogen budgets and included global change analysis for the future. The direct relationship between an extreme weather event like a drought and its impact on the nitrogen surplus as indicator for water pollution has so far not been investigated.
This article further discusses the impact on agriculture regarding weather and growing conditions in 2018, the impact on yield and nitrogen uptake, as well as economic aspects. Furthermore, we analyze the potential water quality impact by agriculture according to farm type and discuss possible measures for reducing losses in autumn/winter, for reducing risk of crop failure, and for increasing the overall N-efficiency. We thus discuss nitrogen flows and surpluses that could potentially influence the water quality. The specific impact of agricultural production on nitrogen concentrations in ground water and surface water is not directly analyzed in this paper.
The effects of extreme weather conditions on nitrogen supply due to climate change can be summarized as follows [28]:
- Relative/absolute lack of water and of the resulting lack of nutrients owing to missing precipitation and increased evaporation, especially in spring and early summer. This can result in reduced nitrogen efficiency.
- Depending on the individual level of the infiltration capacity of soils, excess water due to high precipitation may lead to a reduction of air-filled pores, which will affect root growth. Moreover, nitrogen losses are likely to occur as a result of leaching and/or aerial emission. This would also lead to low nitrogen efficiency.
- Owing to an increase in temperature, the vegetation period is prolonged. This has an effect on the nitrogen dynamics in soil, stimulating microbial mineralization of soil biomass. This affects soil nitrogen dynamics.
Climate change, therefore, indicates a need for the implementation of adapted nitrogen fertilization strategies and optimized land use systems.
2. Materials and Methods
We calculated a simplified nationwide nitrogen soil surface budget in order to estimate changes in the average nitrogen surplus and the total value of nitrogen surplus as a result of the dry weather in 2018. In addition, we calculated nitrogen budgets for two model farms in order to highlight the effects of fertilization practices in certain farm types.
2.1. Simplified Nationwide Nitrogen Soil Surface Budget
A simplified nationwide nitrogen soil surface budget for Germany for the average of the preceding years (2012–2017), as well as with the data specifically available for the dry year 2018, was established. As our focus is on the impact of the drought on agricultural plant production, we used a simplified soil surface budget as the budgeting method. We estimated the nitrogen inflow by the quantities of all relevant types of fertilizers used and deduced the nitrogen removal by crop according to average yields in the preceding years (2012–2017) and the dry year 2018. For this nationwide estimation, we did not consider N-deposition, as this was assumed not to change much between succeeding years. As there is no precise method available for the quantification of legume N-fixation in order to estimate differences between years [18,29], we did not include nitrogen inflows from this source. The N-uptake by grazing animals was assumed to be negligible; as most farm animals are now kept indoors, methods for quantification are not precise and statistics are not available.
2.1.1. Estimation of Nitrogen Fertilization
Nitrogen fertilization was calculated separately for the different fertilizer types:
- Manure: The number of farm animals, grouped in animal categories, was taken from the last national Farm Structural Survey in 2016 [30]. Animal counts were multiplied with nitrogen excretion data for each animal category as listed in the annex of the Fertilization Ordinance [31], the national legal basis for implementing Nitrates Directive [32]. For each animal category, the percentage of nitrogen incorporated in liquid and solid manure was estimated. For each manure type, gaseous losses of nitrogen in the stable and in storage, respectively, during application of the animal manure on the field were calculated according to standard values of the Fertilization Ordinance [31], and not in accordance with the German emission inventory [33]. The plant availability of nitrogen in organic fertilizers like manure applied to soil was calculated in the year of application and the following year as percentage of the applied nitrogen, in accordance with the standards of the German Fertilization Ordinance [31].
- Compost: The total amount of nitrogen in compost used in agriculture was estimated by the national Scientific Advisory Board on Fertilizer Issues (Wissenschaftlicher Beirat für Düngungsfragen—WBD) [35].
- Sewage sludge: The total amount of nitrogen in agriculturally used sewage sludge was estimated by WBD [35].
- Digestate of plant origin: Total nitrogen from digestates of plant origin from biogas plants was estimated using information from the website of the German Biogas Association [36]. The overall installed electrical output is currently 4,200 MW, produced with circa 1/3 manure and 2/3 plant material, for example, maize (on 1 ha 50 t biomass with 3.8 kg N/t and an electrical yield of 21,000 kWh can be produced). This results in a nitrogen inflow from digestates of 233,016 t N, rounded off to 250,000 t N.
- Mineral fertilizer consumption: According to the Federal Ministry of Food and Agriculture (Bundesministerium für Ernährung und Landwirtschaft—BMEL) [37], mineral fertilizer consumption in Germany dropped from 1,658,800 t in the season 2016/2017 to 1,496,600 t in the season 2017/2018.
2.1.2. Estimation of Nitrogen Removal
Nitrogen removal by crop was calculated as an average of the years 2012–2017 and for the dry year 2018, using data on yields of main crops and utilized agricultural area (UAA) per crop according to Destatis [7]. Not considered were pulses for grain production (132,000 ha), field vegetables (118,000 ha), vinyards (100,000 ha), forests and short rotation coppices (1,142,600 ha). Specifications on the average concentration of nitrogen in harvested crops were taken from the annex of the current, recently adapted German Fertilization Ordinance of 2020 [38].
2.1.3. Estimation of Nitrogen Surplus
The nitrogen surplus of a soil surface budget can be derived by subtracting the nitrogen fertilization from the nitrogen removal by plants. We calculated the mean nitrogen surplus from the data of the years 2012–2017. Owing to the climatic conditions in 2018, a certain amount of nitrogen was not transferred into plant biomass. Thus, the difference between the mean surplus in the years 2012–2017 and the year 2018 reveals this amount of nitrogen.
2.2. Water Quality Impact by Agriculture for Different Farm Types
In order to more clearly demonstrate the impact on water quality by agricultural activities during the course of the year 2018 on the farm level, we set up two basic model farms, taking into account the guidelines of the Nitrates Directive [32] and its interpretation for Germany in the Fertilization Ordinance which came into effect in 2017 [31]. On this basis, we compared the results of the nitrogen soil surface budgets of the following two virtual 100 ha model farms and assumed fertilization and budgeting according to the German Fertilization Ordinance [31]:
- Arable farm (25 ha winter-quality wheat, 15 ha winter-barley, 15 ha summer-barley, 15 ha oats, 15 ha grain maize, 15 ha winter-oilseed rape);
- Arable farm with pig production, producing the same crops as (1), but using the harvested crops as feedstuff for 3500 pigs per year (1250 places for fattening pigs from 28 kg to 118 kg).
3. Results
3.1. Nitrogen Supply from Manure and Other Organic Sources
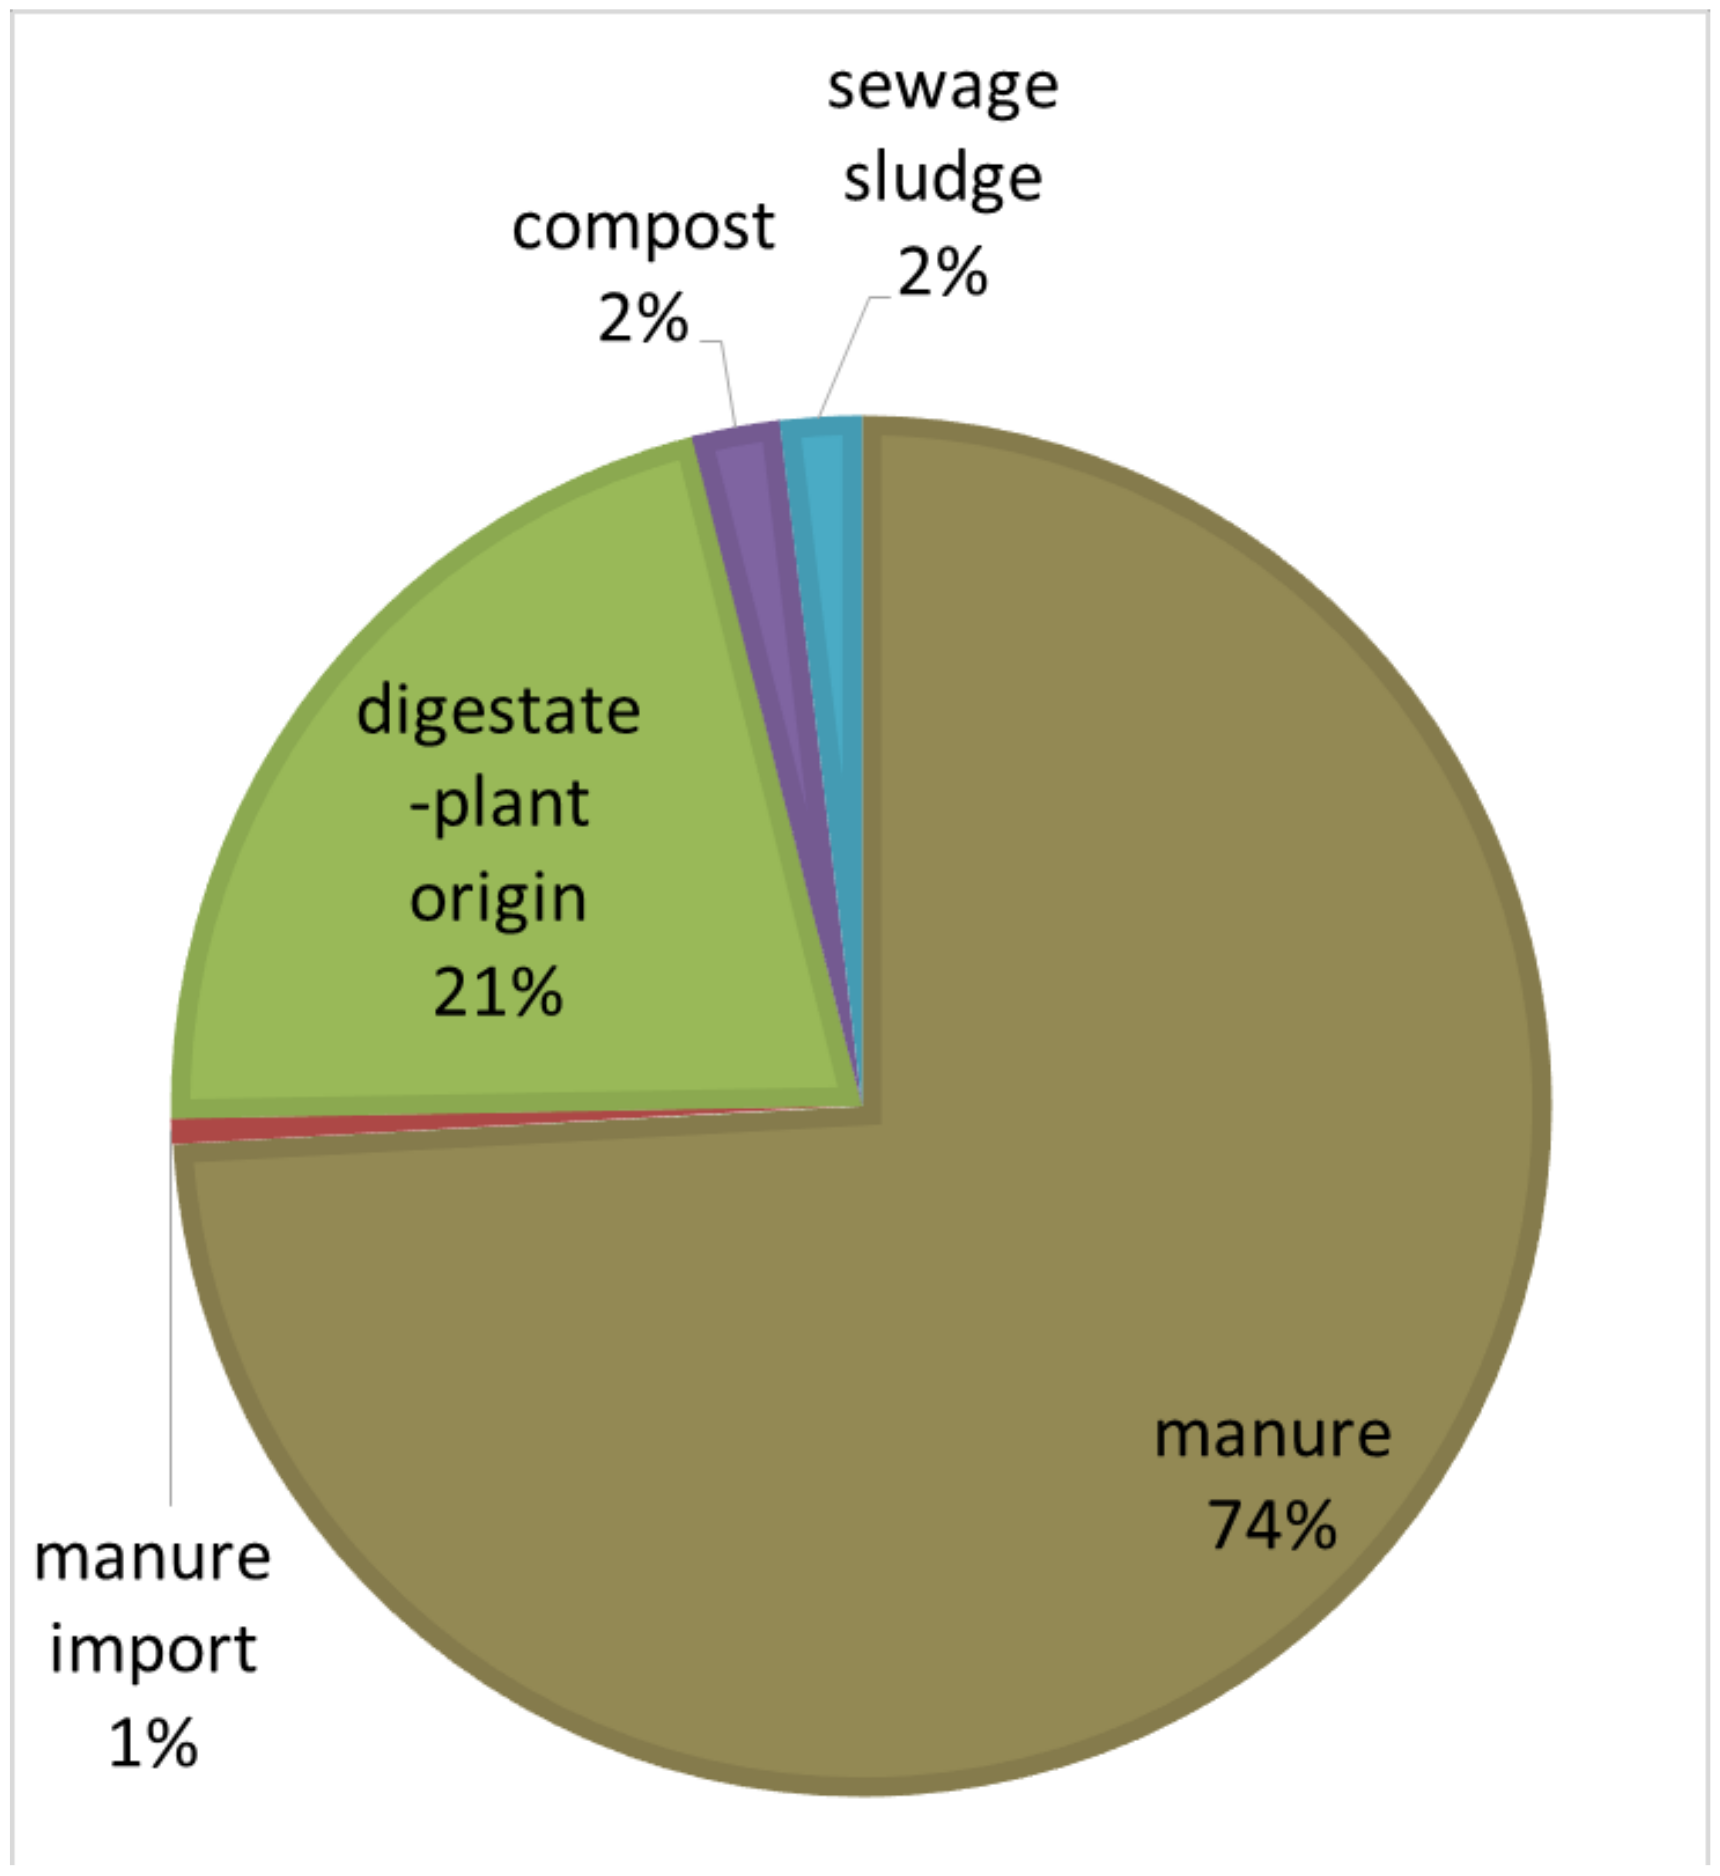
The pie chart of Figure 3 shows the nitrogen supply to German agriculture by most organics—manure, compost, biogas digestate, and sewage sludge—applied to soil as organic fertilizer, organic mineral fertilizer, or soil conditioner. Approximately 75% of all organic nitrogen applied to the soil is of animal origin, deriving from solid or liquid manure from German farms and amounting to 867,463 t N per year. This net-amount does not include nitrogen emissions from stables and storage. These emissions are estimated to be 267,305 t N annually, according to calculation figures from German Fertilization Ordinance [31], on the basis of the gross nitrogen excretion of all farm animals. The gross nitrogen excretion sums up to 1,134,768 t N per year. However, this is quite particular for the German case, and almost one quarter of the N inflow is of plant origin and was processed in biogas plants. This can be explained by the support of biogas produced from energy crops through the German Renewable Energy Law (EEG). The other types of organics—sewage sludge and compost, as well as manure imports from the neighboring Netherlands—are, on the national level, of minor importance.
3.2. Nitrogen Removals by Crops
For main crop groups, Table 1 summarizes the average yields of the years 2012 to 2017 and the yields achieved in 2018. The nitrogen demand as basis of the fertilization demand refers to the average yields in the previous years and is listed in the annex of the Fertilization Ordinance [31]. According to this ordinance, Nmin-values in spring, N mineralized from certain crops in previous years, and N delivered from last year’s organic fertilization also have to be taken into consideration for the calculation of the current fertilization need. From the organic fertilizers applied to soil, only a share is accounted for as plant available in the year of application (this figure was calculated separately for the different types of organic fertilizer). The listed level of mineral fertilization results from the nitrogen demand minus the plant available nitrogen from the different sources mentioned above.
In Table 2, total figures on production as an average for 2012 to 2017 and for the year 2018, nitrogen inflow by fertilization, and removal by harvested crops are listed with reference to the same crop groups as in Table 1. As there was less nitrogen uptake by the crops in 2018 compared with the mean of the six preceding years owing to lack of water, 464,000 t of nitrogen could not be transferred into crop biomass. Figure 4 gives a summary of the situation in 2018.
The total nitrogen excreted in livestock production and applied with other organic fertilizers in German agriculture amounts, with 1,438 kt, to the same level as the nitrogen in mineral fertilizers (1,496 kt/year). Figure 4 illustrates that, in 2018, the mineral nitrogen fertilizer applied in Germany was, with 1,496 kt, reduced by 11.5% (194 kt) in comparison with the preceding year 2017 [37]. In both cases, 267 kt nitrogen/year (18.6% of the N of organic origin) is calculated as gaseous losses in the stable or during manure storage, and 161 kt nitrogen/year (11.2% of the N of organic origin) after fertilizer application. In addition, another 464 kt of nitrogen could not be transferred to biomass in 2018.
3.3. Surplus of Nitrogen due to Dry Weather Conditions
From an environmental perspective, with decreasing yields due to the drought, less nitrogen was harvested from the fields. This left 464 kt of nitrogen in the soils that was not transferred to biomass. With reference to the UAA of 15,200,000 ha cultivated in Germany with arable crops and grassland, this equals an additional amount of 30 kg N/ha to the nitrogen surplus owing solely to the drought. This amount would have been even higher (up to 43 kg N/ha) if farmers had not reduced their mineral fertilizer input in 2018 by 11.5% in comparison with the preceding year 2017 [37]. As the impacts of the drought in 2018 became visible by June, most of fertilizers for arable crops had already been applied, with the exemption of late top dressing with nitrogen, especially in baking wheat. Intensive grassland receives several fertilizer inputs between spring and early autumn, allowing for adaptations during the whole vegetation period. Thus, it can be assumed that mineral N inputs have been reduced especially on wheat and on grassland.
The official national soil surface budget for 2018 has not yet been calculated. N surplus as an average of the preceding years (2015 to 2017) is reported to be 1178 kt N/year or 71 kg N/ha × year, respectively [39,40]. Thus we can estimate that the N-surplus for the dry year 2018 could amount to up to 100 kg N per ha, depending on the developments of further elements such as N-deposition, N fixation of legumes, and so on. In the past, the national soil surface budgets already indicated an increase in N surplus for dry years. In 2003, the N surplus amounted to 92 kg N/ha × year, in comparison with 74 N/ha × year as the mean value of the two preceding years, and in 2006, the surplus was 76 kg N/ha × year, compared with 66 N/ha × year as the mean of the years 2004 and 2005. As the drought 2018 was the most severe incident of this type up to now, an induced increase of the national N surplus of 30 or even 40 kg/ha × year is highly probable.
3.4. Impact of the Dry Summer 2018 on Nitrogen Flows on the Farm Level
With a soil surface budget, we show the influence of the weather conditions in 2018 on the pollution potential of nitrates inputs from agriculture for two fictive model farms according to the rules of the German Fertilization Ordinance as affective in 2018 [31]. In Table 3, N-fertilization planning and N-budgeting is outlined for an arable model-farm; the crops grown are winter quality wheat, winter barley, summer barley, oats, grain maize, and winter oilseed rape. In 2018, target yields and target qualities were calculated as three-year averages, and the corresponding nitrogen demand of the crops was drawn from the annex of the Fertilization Ordinance [31]. Plant available nitrogen in soil was determined as Nmin per soil analysis. Elevated nitrogen delivery was expected from the catch crops preceding barley and maize. No nitrogen delivery had to be accounted for owing to high organic matter content in the soils or in connection with former organic fertilization [31]. Nitrogen fertilization need is calculated as nitrogen demand minus the share of plant available nitrogen. Nitrogen fertilization is completely realized with mineral fertilizers. Owing to the drought, realized yields were reduced, in this example, according to the average reduction as shown in Figure 2. As a consequence, less nitrogen was withdrawn from the field, resulting in a total farm-wide nitrogen surplus of 2,528 kg N/100 ha and 25 kg/ha, respectively.
In the following year, the farmer adapted to changed climate conditions and decided to cultivate winter wheat with a minor raw protein concentration, needing less nitrogen in the late growth phase. He also reduced the target yield to 7 tons instead of 8 tons in 2018. Target yields of the other crops remained unchanged. Owing to high Nmin-values in spring, fertilization needs were less pronounced than in 2018. Mineralization from catch crop was much lower than in 2018, as growing conditions for catch crops were not favorable and there was less plant biomass. Owing to less nitrogen input in this year, the total farm-wide nitrogen surplus was negative, with −900 kg and −9 kg/ha, respectively.
In Table 4, N-fertilization planning and N-budgeting for a pig rearing farm are outlined. The main difference to the arable model farm is that, in this farm, the produced pig manure needs to be utilized owing to limited storage capacities for liquid manure. With 1,250 pig fattening places on the farm, circa 14,250 kg nitrogen is generated per year, as calculated by standard figures from the annex of the Fertilization Ordinance [31]. The ordinance also allows the deduction of emissions from stables and storages from the excreted nitrogen (for pigs, 20% of the N-excretions). In liquid pig manure applied to soil, at least 60% of the nitrogen content is available in the first year. Further, a subsequent nitrogen delivery of 10% of the nitrogen applied in the preceding year has to be accounted for [31].
Aiming at the use of all liquid manure produced on the farm and complying with all fertilization rules, mineral fertilization in 2018 was conducted primarily for winter wheat, oilseed rape, and winter barley. This is useful for steering the plant growth via late nitrogen applications.
Owing to the yield reductions in 2018 and with manure fertilization in the fictive pig breeding model farm, a nitrogen surplus of 4,774 kg N per farm and 47 kg N/ha, respectively, has been reached with a calculation as net soil surface budget. A corresponding calculation as gross farm budget, including standard gaseous nitrogen losses from stable and storage (2,850 kg N per farm) and during application (1,450 kg N per farm), is higher and amounts in total to 10,787 kg N and 107 kg N/ha per farm, respectively.
In 2019, owing to the elevated nitrogen concentration in soil in spring, the calculated fertilization need is lower than in the preceding year. Thus, the farm manure produced by the pig farm covers almost all plant fertilization needs, only for winter wheat there is a possibility of a mineral top dressing. This situation becomes especially aggravated when taking the elevated Nmin concentrations into account.
These calculations show that the pressure on fertilization might be a lot higher for pig breeding farms or other types of livestock farming, as manure storage capacity is usually limited. This model farm is of course fictive and does not take into account an export of manure, which might ease the pressure.
4. Discussion
Our study is limited to Germany as the case study for Central Europe in a region with temperate climate. Owing to a long-term average yearly precipitation level of circa 800 mm (regional variation from <500 mm to >1200 mm), rain-fed agriculture is dominating. According to the DIPSIR model of the European Environmental Agency EAA [41,42,43]—the abbreviation stands for Driving forces, Pressures, States, Impacts and Responses, we refer to nitrogen surplus as a pressure indicator for water contamination, whereby groundwater and surface water closely interfere with each other. In Switzerland, waterbody pollution by adjacent agricultural fields is a primary water quality issue [44]. In Germany, between 2012 and 2014, around 50% of nitrogen was discharged into surface waters via groundwater [45].
Droughts affect the concentration of nitrates and other solubles in the groundwater [44]. According to a meta-analysis, higher nitrate in some agricultural catchments could be linked to reduced dilution of groundwater drainage input and increased influence of sediment nitrogen fluxes. In the immediate post-drought period, several studies found that nitrate was flushed from the catchment soils [46].
4.1. Pressure on the Environment and Groundwater Quality
In 2018, at least 464 kt N was applied across Germany as fertilizer, but not taken up by growing crops. As the severe drought in 2018 continued in many parts of Germany until late autumn [3], winter crops or cover crops sown in autumn often did not germinate. Winter crops like W-oilseed rape were often not sown at all. This had effects on the Nmin-values in soil (after harvest, autumn, and spring). These are standardized determinations of the plant available mineral nitrogen within the root zone, usually up to 90 cm depth. Owing to the drought, Nmin-analyses at harvest time showed values significantly above those of 2015–2017 [47]; the effect was particularly evident if crops were over-fertilized. Owing to high temperature and little precipitation after harvest and in autumn, there was often no leaching, despite high N-surpluses due to poor harvests. Often, soils below 60–70 cm depth were still completely dry in late autumn and showed a deficit of rain of 50–200 mm. Consequently, in autumn 2018 and spring 2019, high amounts of residual nitrogen could be detected in soils. Figure 5 shows an example from southern Germany, where arable cropping, partly irrigated, dominates. Nmin-values in spring 2019 were on average 36 kg/ha higher than in spring 2018, even though, owing to irrigation, yields did not drop as far as in areas without irrigation [48].
The elevated soil content of plant-available nitrogen has to be estimated precisely and crop fertilization has to be adjusted accordingly. In this way, the N surplus of the previous drought year can be counterbalanced through adapted fertilizer input in the subsequent year.
Factors explaining the elevated Nmin-concentrations in spring are the dry weather conditions in the preceding year, which put the vegetation under water stress and reduce their nutrient uptake [49], a stimulation of mineralization and nitrification when dry soils are rewet [50] and a prolongation of the water recharge rate, in summer owing to high evaporation or extreme events connected to a large proportion of run-off, and in winter owing to less total precipitation [44].
4.2. General Economic Impact
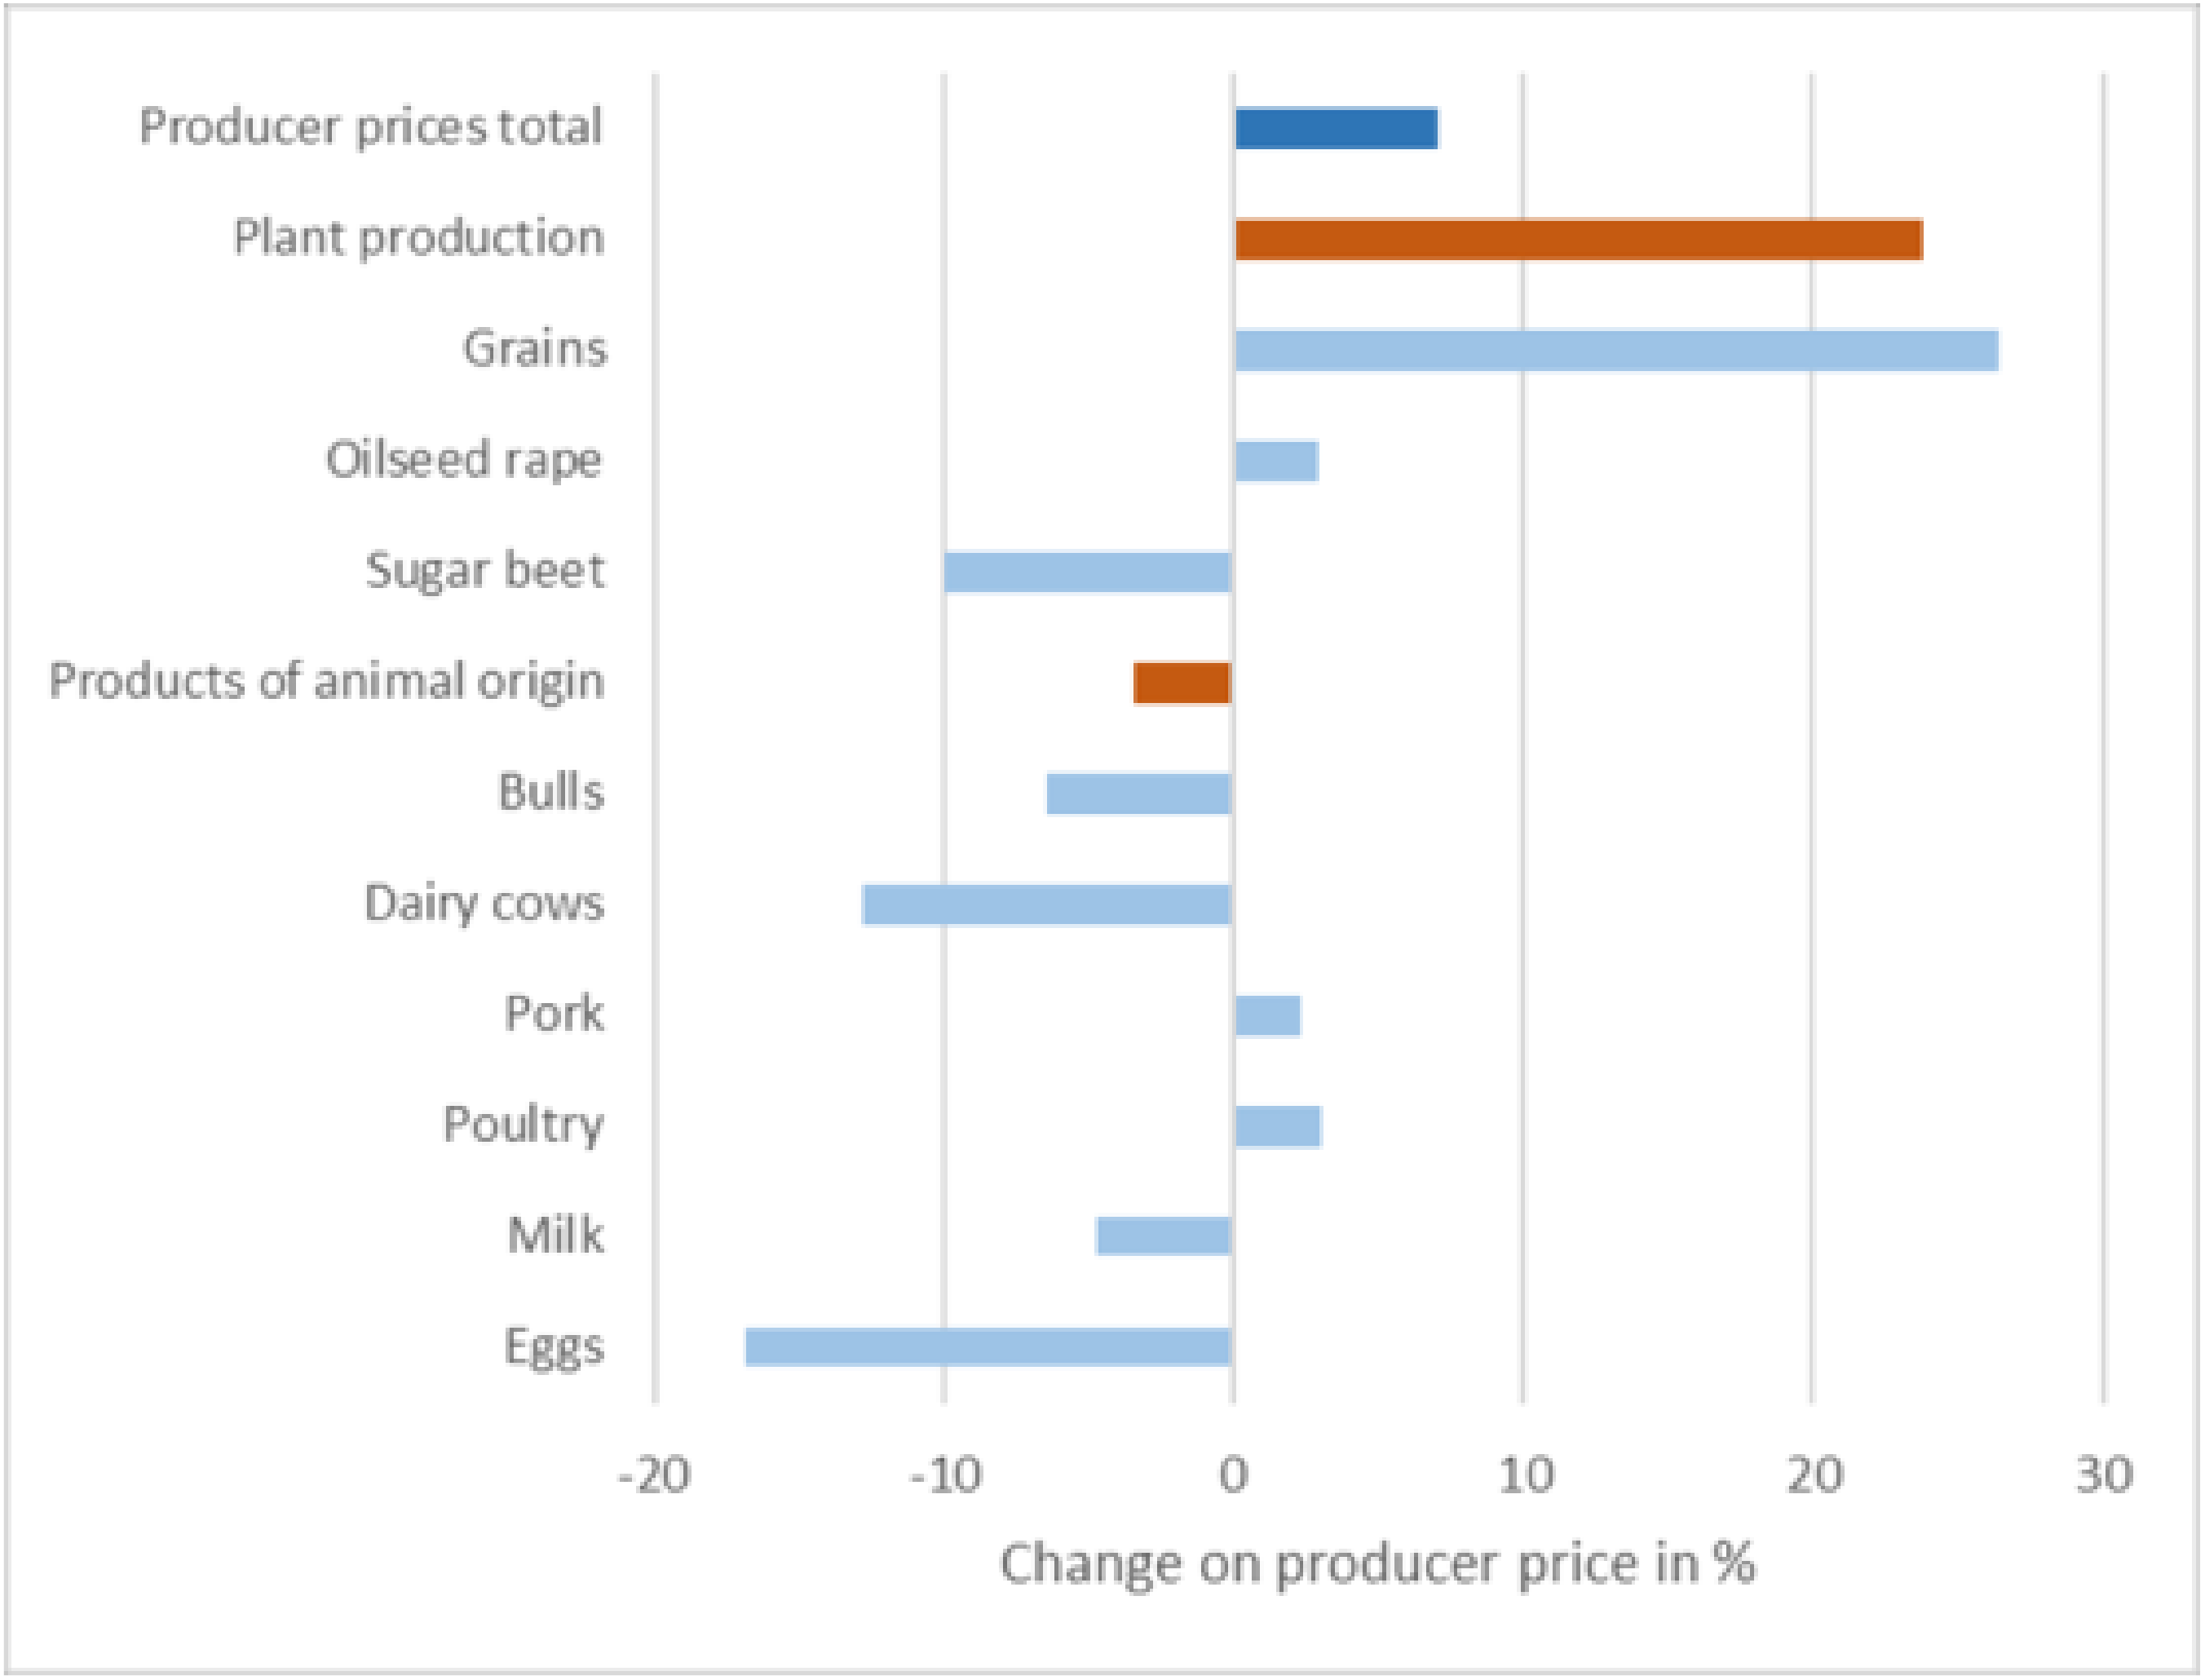
From the farmer’s perspective, a reduction in yield and/or in quality leads to less farm income. Especially dairy farms and producers of beef suffered from a decrease of harvested roughages (such as grassland or maize). One consequence of this shortage in feedstuff was that farmers had to reduce the number of livestock, for example, fattening bulls or even dairy cattle. While the prices for agricultural products of animal origin thus decreased, the prices for plant products increased (Figure 6). This was especially the case for those plant products used as feed, for example, roughage and grains, and even straw [51].
As a consequence, the Federal Ministry of Food and Agriculture and the agricultural ministries of the federal states together put into effect an emergency management plan for farmers including financial support as well as some specific options, for example, on fodder provision: farmers were allowed—after having undergone a simplified application procedure—to harvest catch crop plots they had cultivated as part of the so-called “Greening” in the framework of the Common Agricultural Policy of the European Union without losing their subsidies [53].
4.3. Pressure on Specific Farm Types
Owing to the elevated concentrations on residual nitrogen in soils, the fertilization need of crops in spring 2019 was less pronounced than in preceding years. As a result, the quantity of continuously produced manure in livestock farms may have exceeded existing storage capacities. This may particularly be the case in the hot-spot region of livestock production in the north-west of Germany, where manure production, biogas plants, and—bordering the Netherlands—manure import is accumulating, while export opportunities are limited. These factors result in a particularly high local pressure on soil and ground water quality [54].
The situation for the farmers in autumn 2018 was further aggravated as the rules of the German Fertilization Ordinance, adopted in 2017 [31], largely restricted manure application on arable land in autumn after harvest. These rules only allowed fertilization in autumn for barley, W-oilseed rape, fodder crops, and catch crop, and only in cases plants were in need for nitrogen, at most with a dose of 60 kg N/ha. Owing to an infringement process on the implementation of the Nitrates Directive, new and even stricter amendments of the Fertilization Ordinance were passed in March 2020 and set into effect 1st of May 2020. Fertilization in autumn is now restricted to W-oilseed rape and W-barley. In areas with groundwater bodies in bad chemical condition, from 2021 onwards, no fertilization will be allowed in autumn [38].
Legislation, however, also produces opportunities for the application of animal manure; while according to the German Fertilization Ordinance [31], the target yield for fertilization planning had usually to be deduced from a three-year average, extreme weather events may be left out, so farmers may calculate the same long-term target yield for 2019 as in the previous year, to the detriment of the environment. However, farmers had to take the elevated spring Nmin-values into account.
Owing to the exemption clause in autumn 2018, in order to overcome feedstuff shortages, environmentally relevant grassland and catch crop plots were regionally harvested more intensively, possibly leading to a higher nutrient export from these plots. The effect is probably limited, as—under the dry conditions in 2018—yields of grassland decreased, especially for the second and third cuts.
4.4. Measures for the Adaption to Climate Change
Subsequently, we list measures to adapt to pressures on agriculture linked to climate change.
4.4.1. Measures for Reducing Nitrogen Losses in Autumn/Winter
Late top dressing with nitrogen is always at risk with respect to droughts. However, when the situation of drought becomes obvious in May or June, these N inputs can be omitted. Therefore, crops producing high quality without high nitrogen inputs are favorable for risky cultivation sites. Baking wheat varieties exist with high baking quality performance in combination with low protein concentration in the grains. These varieties do not need high quantities of nitrogen in late development stages [55]. What hampers the introduction of these nitrogen efficient varieties is the lack of analytical methods for a quick assessment of their baking quality as criterion for the payment of the farmers replacing the raw protein content as criterion [56,57]. Newly discovered, old species like spelt, emmer, and einkorn wheat produce high quality grains with less nitrogen fertilization. Producing these kind of crops minimizes the residual nitrogen in soil after harvest [58].
A need for nitrogen fertilization in autumn is justified by the necessity to feed young crops with readily available nutrients. However, in most cases, there is sufficient nitrogen left from preceding crops, especially owing to climate change, where the vegetation period is prolonged, with warm temperatures until November or even December. In the case of sufficient precipitation or remaining soil moisture, mineralization will occur until this time. A ban of nitrogen fertilization in autumn would result in an increase of the pressure on manure storage capacities in order to store manure over the winter period (with respect to the pig model farm 450 m3 manure storage is necessary in the case in which 60 kg/ha was applied in autumn). The new amendments of the Fertilization Ordinance include further restrictions on manure application in autumn [38].
The cultivation of catch crops is a highly efficient measure to keep nitrogen from leaching during the winter period [59,60,61]. In Germany, the cultivation of catch crops over the winter season was practiced in 2018 on 1.43 mio ha. If winter catch crops would be grown in all suitable crop rotations with summer crops and maize, 2.89 mio ha could be covered [62], an increase of almost 50%. With regard to water protection, winter hardy catch crops are most efficient, but seed bed preparation in spring for the following main crop might become difficult. The new amendments of the Fertilization Ordinance thus includes the cultivation of winter catch crops in areas of groundwater bodies in bad chemical conditions, in case the yearly precipitation exceeds a certain limit [38].
Owing to dry weather conditions in autumn, the germination and further establishment of a catch crop cover might be difficult. In the case of sufficient annual precipitation, the undersowing of forage or catch crops in the preceding main crop might be a solution [63].
Moreover, in the case of sufficient annual precipitation, double cropping may be the choice in order to almost permanently cover the soil and gain income from more than one harvest by year. Furthermore, N removal through a second crop offers opportunities to curb down N surplus and residual mineral N in the soil.
Grassland turnover in general leads to high mineralization rates of the soil humus, with negative effects on the concentration of the mobile soil nitrogen. Therefore, grassland renewal in autumn is problematic with respect to water protection.
4.4.2. Measures Reducing Risk of Crop Failure
The risk of crop failure can be reduced by using crop mixtures instead of the cultivation of one single breed [64].
Some crops show an adaption to changed climatic conditions, especially droughts, owing to their specific yield and quality production mechanisms [65]. Intensive efforts are made to increase plant resistance to droughts through breeding [66].
Plants composing grasslands respond differently to the combined effects of climatic change, resulting in compositional changes in plant communities [67]. Grassland with a higher percentage of herbs with deeper roots shows a better heat/drought stress tolerance, but produces lower yields. Harvesting grassland in early spring/summer would primarily ensure a certain amount of hay available for the cattle, but early cutting violates German legislation on environmental friendly production (e.g., bird protection). This implies that dairy cattle farming will probably have to increase the main forage area (thus, reducing animal density) and conserve more hay and silage to cope with feedstuff shortages [68].
4.4.3. Measures for Increasing N-Efficiency during the Season
There is a long list of measures that could be realized in order to increase nitrogen-efficiency during the whole season (for more details, see [58]):
- Soil analysis of Nmin in autumn and spring (instead of using standard values); the autumn value gives information on the precision of the fertilization planning and the spring value informs on the current level of plant available nitrogen in soil;
- Improving prognosis of N delivery from soil (originating from organic matter, organic fertilization, and preceding crop/catch crop);
- Monitoring plant needs and adjusting fertilization accordingly (i.e., by applying of different methods of plant analysis;
- Using farm rapid analysis methods (i.e., near-infrared spectrocospy—NIRS) for the evaluation of the fertilizer value of organic fertilizers, especially liquid manure [71];
- Using low-emission application techniques like drip hose, trailing shoe, or injection of liquid manure and adjusting supplementary mineral fertilization accordingly;
- Using acidification of liquid manure, nitrification, or urease inhibitors in order to prevent the mineralization and evaporation of organically bound nitrogen;
- Implementation of N-efficient crops and rotations with long-term land cover (catch crop cultivation) and crop mixtures;
- Limitation of the organically bound nitrogen being applied as fertilizer to a lower value, such as 170 kg N/ha and year (as declared in the Nitrates Directive [32]); if not yet performed, extend the rule to all organic fertilizers, not only to animal manure;
- Application of precision farming techniques;
- Installation of field irrigation.
4.4.4. Tightening Legislation
After the EU court took legal action against Germany, the current Fertilization Ordinance [31] is being revised and tightened [54]. This will most likely pose further restrictions on fertilization and management options for farmers.
Unfortunately, with the recent revision of the German Fertilization Ordinance [38], nitrogen soil surface budgets on the farm level as control instruments for excessive use of manure are no longer compulsory.
On the whole, climate change poses a great challenge for the implementation of the Water Framework Directive, its “daughter directives”, and the national and regional transcripts.
5. Conclusions
According to our research, extreme summer droughts like in 2018 result in less yield, less plant uptake of nitrogen, a reduced nitrogen efficiency, and an increased N surplus. This is because of reduced plant growth and thus reduced nitrogen uptake by plants, as well as owing to a prolongation of the water recharge rate and an increased mineralization of soil biomass after soil rewetting. As agri-drinking water indicator, the elevated N surplus puts more pressure on the quality of surface, ground, and drinking water.
Presuming a fertilization level defined by plant needs according to fertilization planning under regular climate conditions, the main factors influencing the N surplus are splitting and timing of fertilization and the share of organically bound nitrogen in the fertilizers applied.
Monitoring of plant needs in the framework of precision farming and the splitting and timing of fertilization accordingly may in future lead to a reduction of N surplus.
The examples of the model farms show clearly, however, that fertilization regimes with high shares of organic fertilizers produce higher nitrogen surpluses (gross and net). Taking into account the subsequent delivery of plant-available nitrogen, for example, after crop failure, the reasonable use of farm-own manure is limited quantitatively.
There are feasible options to mitigate the risks of crop failure or risk of overfertilization of crops during droughts. However, many of these options imply an extensification of current agricultural practices.
Author Contributions
Conceptualization, B.O., C.H., and S.K.; Methodology, S.K.; Investigation, S.K.; Resources, S.K.; Data curation, S.K.; Writing—Original draft preparation, S.K.; Writing—Review and editing, C.H. and B.O.; Visualization, S.K. All authors have read and agreed to the published version of the manuscript.
Funding
This project has received funding from the European Union’s Horizon 2020 research and innovation program under grant agreement No. 727984.
Conflicts of Interest
The authors declare no conflict of interest.
References
- DWD. Erste Bilanz des Deutschen Wetterdienstes zum Jahr 2018 in Deutschland—2018 ist das wärmste Jahr in Deutschland seit Messbeginn1881. In Proceedings of the Pressemitteilung, Offenbach, Germany, 20 December 2018; Available online: https://www.dwd.de/DE/presse/pressemitteilungen/DE/2018/20181220_jahr2018_rekord.pdf?__blob=publicationFile&v=2 (accessed on 28 January 2020).
- DWD. Durchschnittlicher monatlicher Niederschlag in Deutschland von Februar 2018 bis Februar 2019 (in Liter pro Quadratmeter). 2019. Available online: http://dwd.de (accessed on 28 January 2020).
- DWD. Auch im Herbst 2018 Riss die Trockenserie in der Landwirtschaft Nicht ab. 2019. Available online: https://www.dwd.de/DE/fachnutzer/landwirtschaft/berichte/32__rueckblicke/2018/bericht_herbst_2018.pdf?__blob=publicationFile&v=7; (accessed on 28 January 2020).
- DWD. Durchschnittliche Sonnenscheindauer pro Monat in Deutschland von Februar 2018 bis Februar 2019 (in Stunden). 2019. Available online: http://dwd.de (accessed on 28 January 2020).
- Destatis. Wachstum und Ernte—Feldfrüchte—2018. Fachserie 3 Reihe 3.2.1; Statistisches Bundesamt (Destatis): Wiesbaden, Germany, 2019. [Google Scholar]
- Sarhadi, A.; Ausín, M.C.; Wiper, M.P.; Touma, D.; Diffenbaugh, N.S. Multidimensional risk in a nonstationary climate: Joint probability of increasingly severe warm and dry conditions. Sci. Adv. 2018, 4, 3487. [Google Scholar] [CrossRef] [Green Version]
- Rosenzweig, C.; Iglesias, A.; Yang, X.B.; Epstein, P.R.; Chivian, E. Climate change and extreme weather events Implications for food production, plant diseases, and pests. Glob. Chang. Hum. Health 2001, 2, 90–104. [Google Scholar] [CrossRef]
- OECD. OECD Core Set of Indicators for Environmental Performance Reviews: A Synthesis Report by the Group on the State of the Environment; Environment Monographs; No. 83; OECD Publishing: Paris, France, 1993. [Google Scholar]
- Kremer, A.M. Methodology and Handbook—Eurostat/OECD—Nutrient Budgets EU-27, Norway, Switzerland; European Commission, Eurostat: Brussels, Belgium, 2007; 112p, Available online: https://ec.europa.eu/eurostat/documents/2393397/2518760/Nutrient_Budgets_Handbook_%28CPSA_AE_109%29_corrected3.pdf/4a3647de-da73-4d23-b94b-e2b23844dc31 (accessed on 28 January 2020).
- Eurostat. Agri-Environmental Indicator—Gross Nitrogen Balance. 2018. Available online: https://ec.europa.eu/eurostat/statistics-explained/index.php/Agri-environmental_indicator_-_gross_nitrogen_balance (accessed on 15 May 2020).
- van Beek, C.L.; Brouwer, L.; Oenema, O. The use of farm gate balances and soil surface balances as estimator for nitrogen leaching to surface water. Nutr. Cycl. Agroecosyst. 2003, 67, 233–244. [Google Scholar] [CrossRef]
- Wick, K.; Heumesser, C.; Schmid, E. Groundwater nitrate contamination: Factors and indicators. J. Environ. Manag. 2012, 111, 178–186. [Google Scholar] [CrossRef] [PubMed] [Green Version]
- Lord, I.; Antony, S.G. Agricultural nitrogen balances and water quality in the UK. Soil Use Manag. 2002, 18, 362–369. [Google Scholar] [CrossRef]
- Sieling, K.; Kage, H. N balance as an indicator of N leaching in an oilseed rape—Winter wheat—Winter barley rotation. Agric. Ecosyst. Environ. 2006, 115, 261–269. [Google Scholar] [CrossRef]
- Rankinen, K.; Salo, T.; Granlund, K.; Rita, H. Simulated nitrogen leaching, nitrogen mass field balanes and their correleation on four farms in south-western Finland during the peeriod 2000–2005. Agric. Food Sci. 2007, 16, 98–107. [Google Scholar]
- Dalgaard, T.; Bienkowski, J.F.; Bleeker, A.; Dragosit, U.; Drouet, J.L.; Durand, P.; Frumau, A.; Hutchings, N.J.; Kedziora, A.; Magliulo, V.; et al. Farm nitrogen balances in six European landscapes as an indicator for nitrogen losses and basis for improved management. Biogeosciences 2012, 9, 5303–5321. [Google Scholar] [CrossRef] [Green Version]
- Spiess, E. Nitrogen, phosphorus and potassium balances and cycles of Swiss agriculture from 1975 to 2008. Nutr. Cycl. Agroecosyst. 2011, 91, 351–365. [Google Scholar] [CrossRef]
- Poisvert, C.; Curie, F.; Moatar, F. Annual agricultural N surplus in France over a 70-year period. Nutr. Cycl. Agroecosyst. 2017, 107, 63–78. [Google Scholar] [CrossRef]
- Oenema, O.; Kros, H.; de Vries, W. Approaches and uncertainties in nutient budgets. Implications for nutrient management and environmental policies. Eur. J. Agron. 2003, 20, 3–16. [Google Scholar] [CrossRef]
- Cameira, M.R.; Rolim, J.; Valente, F.; Faro, A.; Dragosits, U.; Cordovil, C.M.D.S. Spatial distribution and uncertainties of nitrogen budgets for agriculture in the Tagus river basin in Portugal—Implications for effectiveness of mitigation measures. Land Use Policy 2019, 84, 278–293. [Google Scholar] [CrossRef]
- Gourley, C.J.P.; Aarons, S.R.; Powel, M. Nitrogen use efficiency and manure management practices in contrasting dairy production systems. Agric. Ecosyst. Environ. 2012, 147, 73–81. [Google Scholar] [CrossRef]
- D’Haene, K.; Magyar, M.; Mulier, A.; De Neve, S.; Pálmai, O.; Nagy, J.; Németh, T.; Hofman, G. Comparison of N and P farm gate balances between the intensive agriculture in Flanders and the extensive agriculture in Hungary. In Proceedings of the 14th World Fertilizer Congress of the International Centre for Fertilizers, CIEC, Chiang Mai, Thailand, 22–27 January 2006. [Google Scholar]
- Mulier, A.; Hofman, G.; Baecke, E.; Carlier, L.; De Brabander, D.; De Groote, G.; De Wilde, R.; Fiems, L.; Janssens, G.; Van Cleemput, O.; et al. A methodology for the calculation of farm level nitrogen and phosphorus balances in Flemish agriculture. Eur. J. Agron. 2003, 20, 45–51. [Google Scholar] [CrossRef]
- Kim, H.; Surdyk, N.; Abel, H.; Møller, I.; Hansen, B. The link between agricultural impact on drinking water quality—Lessons learned in Denmark and France. Water 2020. under review. [Google Scholar]
- Klages, S.; Heidecke, C.; Osterburg, B.; Bailey, J.; Calciu, I.; Casey, C.; Dalgaard, T.; Frick, H.; Glavan, M.; D’Haene, K.; et al. Nitrogen surplus—A unified indicator for water pollution in Europe? Water 2020, 12, 1197. [Google Scholar] [CrossRef] [Green Version]
- Gu, B.; Jub, X.; Chang, J.; Ge, Y.; Vitousek, P.M. Integrated reactive nitrogen budgets and future trends in China. Proc. Natl. Acad. Sci. USA 2015, 112, 8792–8797. [Google Scholar] [CrossRef] [PubMed] [Green Version]
- Bouwman, L.; Klein Goldewijk, K.; Van Der Hoek, K.W.; Beusen, A.H.W.; Van Vuuren, D.P.; Willems, J.; Rufino, M.C.; Stehfest, E. Exploring global changes in nitrogen and phosphorus cycles in agriculture induced by livestock production over the 1900–2050 period. Proc. Natl. Acad. Sci. USA 2013, 110, 20882–20887. [Google Scholar] [CrossRef] [Green Version]
- Dobers, E.S. Anpassungsbedarf bei der Nährstoffversorgung. In Kühlen Kopf Bewahren—Anpassung der Landwirtschaft an den Klimawandel; KTBL Kuratorium für Technik u. Bauwesen i. d. Landwirtschaft e.V.: Darmstadt, Germany, 2019; pp. 75–89. [Google Scholar]
- Kolbe, H. Comparison of methods for calculation of legume N2 fixation for use in practical agriculture. Pflanzenbauwissenschaften 2009, 13, 23–36. [Google Scholar]
- Destatis. Viehhaltung der Betriebe—Agrarstukturerhebung—2016. Fachserie 3 Reihe 2.1.3; Statistisches Bundesamt (Destatis): Wiesbaden, Germany, 2017. [Google Scholar]
- Federal Ministry of Justice and Consumer Protection. Düngeverordnung (DüV) vom 26. Mai 2017. Verordnung über die Anwendung von Düngemitteln, Bodenhilfsstoffen, Kultursubstraten und Pflanzenhilfsmitteln nach den Grundsätzen der guten Fachlichen Praxis beim Düngen. BGBl I; Bundesanzeiger Verlag GmbH: Köln, Germany, 2017; pp. 1305–1348. Available online: https://www.gesetze-im-internet.de/d_v_2017/D%C3%BCV.pdf (accessed on 20 April 2020).
- Council of the European Union. Council Directive 91/676/EEC of 12 December 1991 Concerning the Protection of Waters against Pollution Caused by Nitrates from Agricultural Sources. OJ L 375, 31.12.1991; Council of the European Union: Brussels, Belgium, 1992; pp. 1–8. Available online: https://eur-lex.europa.eu/legal-content/EN/TXT/PDF/?uri=CELEX:31991L0676&from=EN) (accessed on 20 May 2020).
- Haenel, H.-D.; Rösemann, C.; Dämmgen, U.; Döring, U.; Wulf, S.; Eurich-Menden, B.; Freibauer, A.; Döhler, H.; Schreiner, C.; Osterburg, B.; et al. Calculations of Gaseous and Particulate Emissions from German Agriculture 1990–2018. Report on Methods and Data (RMD), Submission 2020. Thünen Report 57; Johann Heinrich von Thünen-Institute: Braunschweig, Germany, 2020; p. 414. [Google Scholar]
- Zinke, O. Wirtschaftsdünger—Weniger Gülleimporte aus den Niederlanden. Agrarheute 2018. Available online: https://www.agrarheute.com/management/betriebsfuehrung/weniger-guelleimporte-niederlanden-548856 (accessed on 28 January 2020).
- WBD Anwendung von Organischen Düngern Und Organischen Reststoffen in der Landwirtschaft. Standpunkt des Wissenschaftlichen Beirats für Düngungsfragen, 30p. 2015. Available online: https://www.bmel.de/SharedDocs/Downloads/Ministerium/Beiraete/Duengungsfragen/OrgDuengung.pdf?__blob=publicationFile (accessed on 28 January 2020).
- German Biogas Association Figures and Facts about Biogas. Available online: https://www.biogas.org/edcom/webfvb.nsf/id/EN-Figures-and-facts-about-biogas (accessed on 28 January 2020).
- BMEL Statistisches Jahrbuch 2018. 40. Inlandsabsatz von Handelsdünger. a. Nach Sorten und Nährstoffen. 1.000 t Nährstoff. 3060210. 2019. Available online: https://www.bmel-statistik.de/footernavigation/archiv/statistisches-%20jahrbuch/ (accessed on 28 January 2020).
- Federal Ministry for Food and Agriculture. Verordnung zur Änderung der Düngeverordnung und Anderer Vorschriften vom 28. BGBl. I; Bundesanzeiger Verlag GmbH: Köln, Germany; pp. 846–861. Available online: https://www.bgbl.de/xaver/bgbl/start.xav?startbk=Bundesanzeiger_BGBl&start=%2F%2F%2A%5B%40attr_id=%27bgbl120s0846.pdf%27%5D#__bgbl__%2F%2F*%5B%40attr_id%3D%27bgbl120s0846.pdf%27%5D__1589993256631 (accessed on 15 May 2020).
- BMEL Statistischer Monatsbericht des Bundesministeriums für Landwirtschaft und Ernährung, Kapitel, A. Landwirtschaft. Nährstoffbilanzen und Düngemittel. MBT-0111130-0000 Flächenbilanz von 1990 bis 2017—in kg N/ha, MBT-0111160-0000Flächenbilanz von 1990 bis 2017—kt N. 2020. Available online: https://www.bmel-statistik.de/landwirtschaft/statistischer-monatsbericht-des-bmel-kapitel-a-landwirtschaft/ (accessed on 31 January 2020).
- Bach, M.; Godlinski, F.; Greef, J.-M. Handbuch Berechnung der Stickstoff-Bilanz für die Landwirtschaft in Deutschland Jahre 1990–2008. In Berichte aus dem Julius Kühn-Institut; Federal Research Centre for Cultivated Plants: Braunschweig, Germany, 2011; Volume 159, 28p. [Google Scholar]
- EAA (2018): Glossary—List of Environmental Terms Used by EEA. Available online: https://www.eea.europa.eu/help/glossary#c4=10andc0=allandb_start=0andc2=dpsir (accessed on 20 February 2018).
- Gabrielsen, P.; Bosch, P. Internal Working Paper Environmental Indicators: Typology and Use in Reporting; European Environment Agency: Copenhagen, Denmark, 2003; 20p. [Google Scholar]
- Smeets, E.; Weterings, R. Environmental Indicators: Typology and Overview. Technical Report No. 25; European Environment Agency: Copenhagen, Denmark, 1999; 19p. [Google Scholar]
- Benateau, S.; Gaudard, A.; Stamm, C.; Altermatt, F. Climate Change and Freshwater Ecosystems: Impacts on Water Quality and Ecological Status. Hydro-CH2018 Project; Federal Office for the Environment (FOEN): Bern, Switzerland, 2019; p. 110. Available online: https://www.zora.uzh.ch/id/eprint/169641/7/Climate_change_and_freshwater_ecosystems.pdf (accessed on 22 May 2020).
- Hannappel, S.; Köpp, C.; Zühlke, S. Aufklärung der Ursachen von Tierarzneimittelfunden im Grundwasser—Untersuchung eintragsgefährdeter Standorte in Norddeutschland. UBA Texte 2016, 54, 149. Available online: https://www.umweltbundesamt.de/publikationen/aufklaerung-der-ursachen-von-tierarzneimittelfunden (accessed on 29 April 2020).
- Mosley, L.M. Drought impacts on the water quality of freshwater systems; review and integration. Earth Sci. Rev. 2015, 140, 203–214. [Google Scholar] [CrossRef]
- LWK Niedersachsen Vorabveröffentlichung der Ernte-Nmin-Werte 2018—aus den Wasserschutz-und ergänzenden Untersuchungen in Pflanzenbauversuchen der LWK Niedersachsen, 26p. 2018. Available online: https://m.lwk-niedersachsen.de/?file=30940 (accessed on 28 January 2020).
- Wbl-mr-Hessen Nmin-Werte der WRRL-Beratung im Hessischen Ried. Stand 26.02.2018 bzw. 05.04.2019. Wasser-, Boden-und Landschaftspflegeverband Hessen, Griesheim, Germany. 2018. 2019. Available online: http://wbl-mr-hessen.de/ (accessed on 28 January 2020).
- Prasuhn, V.; Albisser, C.V. Grundwasserqualität und Bewässerung—Eine Lysimeterstudie zur Schadstoffverfrachtung ins Grundwasser. Aqua Gas 2014, 4, 54–58. [Google Scholar]
- Morecroft, M.D.; Burt, T.P.; Taylor, M.E.; Rowland, A.P. Effects of the 1995–1997 drought on nitrate leaching in lowland England. Soil Use Manag. 2000, 16, 117–123. [Google Scholar] [CrossRef]
- Zinke, O. Futterversorgung—Futtermangel bedroht Existenzen. Agrarheute 2019. Available online: https://www.agrarheute.com/markt/futtermittel/futtermangel-bedroht-existenzen-552437 (accessed on 15 May 2020).
- Destatis Preise—Preisindizes für die Land-und Forstwirtschaft. Available online: https://www.destatis.de/DE/Themen/Wirtschaft/Preise/Landwirtschaftspreisindex-Forstwirtschaftspreisindex/Publikationen/Downloads-Land-und-Forstwirtschaftpreise/erzeugerpreise-land-forstwirtschaft-2170100191094.html (accessed on 1 May 2020).
- BMEL Erweiterte Möglichkeiten der Futternutzung von ökologischen Vorrangflächen. Available online: https://www.bmel.de/SharedDocs/Pressemitteilungen/2018/136-Vorrangflaechen.html;jsessionid=EA792F11361CAE8462715428C4FB260A.2_cid385 (accessed on 28 January 2020).
- Meergans, F.; Lenschow, A. Die Nitratbelastung in der Region Weser-Ems: Inkohärenzen in Wasser-, Energie- und Landwirtschaftspolitik. Neues Archiv für Niedersachsen 2018, 2, 105–117. [Google Scholar]
- Böse, S. Stickstoffeffizienz von Weizensorten. Praxisnah 2016, 2, 2–4. [Google Scholar]
- Laidig, F.; Piepho, H.-P.; Hüsken, A.; Begemann, J.; Rentel, D.; Drobek, T.; Meyer, U. Predicting loaf volume for winter wheat by linear regression models based on protein concentration and sedimentation value using samples from VCU trials and mills. J. Cereal Sci. 2018, 84, 132–141. [Google Scholar] [CrossRef]
- Gabriel, D.; Pfitzner, C.; Haase, N.; Hüsken, A.; Prüfer, H.; Greef, J.-M.; Rühl, G. New strategies for a reliable assessment of baking quality of wheat—Rethinking the current indicator protein content. J. Cereal Sci. 2017, 77, 126–134. [Google Scholar] [CrossRef]
- Klages, S.; Apel, B.; Feller, C.; Hofmeier, M.; Homm-Belzer, A.; Hüther, J.; Loeloff, A.; Olfs, H.-W.; Osterburg, B. Effizient düngen—Anwendungsbeispiele zur Düngeverordnung; Bundesanstalt für Landwirtschaft und Ernährung (BLE): Bonn, Germany, 2018; p. 68. [Google Scholar]
- Basche, A.D.; Miguez, F.E.; Kaspar, T.C.; Castellano, M.J. Do cover crops increase or decrease nitrous oxide emissions? A meta-analysis. J. Soil Water Conserv. 2014, 69, 471–482. [Google Scholar] [CrossRef] [Green Version]
- Thapa, R.; Mirsky, S.B.; Tully, K.L. Cover Crops Reduce Nitrate Leaching in Agroecosystems: A Global Meta-Analysis. J. Environ. Qual. 2018, 47, 1400–1411. [Google Scholar] [CrossRef] [PubMed]
- Tonitto, C.; David, M.B.; Drinkwater, L.E. Replacing bare fallows with cover crops in fertilizer-intensive cropping systems: A meta-analysis of crop yield and N dynamics. Agric. Ecosyst. Environ. 2006, 112, 58–72. [Google Scholar] [CrossRef]
- BMEL. Referat 123 Erntebericht 2018; BMEL: Berlin, Germany, 2018; Available online: https://www.bmel.de/SharedDocs/Downloads/DE/_Landwirtschaft/Pflanzenbau/Ernte-Bericht/ernte-2018.pdf;jsessionid=5F69D1B154A2B0C2FBD21C5593A9C1C9.internet2851?__blob=publicationFile&v=2 (accessed on 15 May 2020).
- Valkama, E.; Lemola, R.; Känkänen, H.; Turtola, E. Meta-analysis of the effects of undersown catch crops on nitrogen leaching loss and grain yields in the Nordic countries. Agric. Ecosyst. Environ. 2015, 203, 93–101. [Google Scholar] [CrossRef]
- Paulsen, H.M.; Schochow, M.; Ulber, B.; Kühne, S.; Rahmann, G. Mixed cropping systems for biological control of weeds and pests in organic oilseed crops. Asp. Appl. Biol. 2006, 79, 215–220. [Google Scholar]
- Rafiee, M.; Abdipour, F. Mixed Cropping system with Biofertilizer under Dry land condition: I. Evaluation of Drought Tolerance. Bull. Environ. Pharm. Life Sci. 2015, 4, 49–54. [Google Scholar]
- Schimmelpfennig, S.; Heidecke, C.; Beer, H.; Bittner, F.; Klages, S.; Krengel, S.; Lange, S. Klimaanpassung in Land- und Forstwirtschaft—Ergebnisse eines Workshops der Ressortforschungsinstitute FLI, JKI und Thünen-Institut. Thünen Working Paper 2018, 86; Johann Heinrich von Thünen-Institute: Braunschweig, Germany, 2018; 110p. [Google Scholar]
- Ghahramani, A.; Howden, S.M.; del Prado, A.; Thomas, D.T.; Moore, A.D.; Ji, B.; Ates, S. Climate Change Impact, Adaptation, and Mitigation in Temperate Grazing Systems: A Review. Sustainability 2019, 11, 7224. [Google Scholar] [CrossRef] [Green Version]
- Elsässer, M.; Grant, K. Anpassungsstrategien zur Sicherung von Ertrag und Qualität im Grünland. In Kühlen Kopf bewahren—Anpassungen der Landwirtschaft an den Klimawandel; KTBL Kuratorium für Technik u. Bauwesen i. d. Landwirtschaft e.V.: Darmstadt, Germany, 2019; pp. 135–173. [Google Scholar]
- Freebairn, D.M.; Ghahramani, A.; Robinson, J.B.; Mc Clymon, D.J. A tool for monitoring soil water using modelling, on-farm data, and mobile technology. Environ. Model. Softw. 2018, 104, 55–63. [Google Scholar] [CrossRef]
- Zinke, O. Wetterprognose—Deutscher Wetterdienst will Dürren vorhersagen. Agrarheute 2019. Available online: https://www.agrarheute.com/management/betriebsfuehrung/deutscher-wetterdienst-will-duerren-vorhersagen-552709 (accessed on 5 March 2020).
- Severin, K.; Hoffmann, A.; Licht, F.; Olfs, H.-W.; Rest, T.; Tillmann, P. Die Nahinfrarotspektroskopie (NIRS) zur Untersuchung von Güllen und Gärresten. Standpunkt des VDLUFA; Verband Deutscher Landwirtschaftlicher Untersuchungs- und Forschungsanstalten e.V. (VDLUFA): Speyer, Germany, 2019. [Google Scholar]
Figure 2.
Yield reduction in Germany in 2018 in % of long-term yield (2012–2017) [5] (source: [5], translated).

Figure 3.
Nitrogen from organic fertilizers in Germany applied to soil in 2018 (source: own calculation).
Figure 3.
Nitrogen from organic fertilizers in Germany applied to soil in 2018 (source: own calculation).

Figure 4.
N-budget in 2018 (without N-deposition, legume N-fixation, and N-uptake by grazing animals in kt N/year): N-supply from organic fertilizers (left), N-removal by crop, gaseous losses in stable, storage and during fertilizer application, fertilizer not transferred into biomass (right) (source: own calculation).

Figure 5.
Spring Nmin-values in 2018 and 2019 (0–90 cm depth) with reference to the preceding crop [47]; average increase in Nmin-value of 36 kg/ha (source: [48], adapted and translated).

Figure 6.
Development of producer prices in agriculture between January 2018 to January 2019 [52] (source: [52], adapted and translated).


Table 1.
Calculated nitrogen supply for different crops from available organic and mineral fertilization, according to average yields (2012–2017) and rough estimates on N mineralization based on regulations of the German Fertilization Ordinance [31].
Table 1.
Calculated nitrogen supply for different crops from available organic and mineral fertilization, according to average yields (2012–2017) and rough estimates on N mineralization based on regulations of the German Fertilization Ordinance [31].
| Average Yield (2012–2017) | Yield 2018 | N-Demand | N in Soil Available | N from Preceding Crop | N from Manure of Preceding Year | Fertilization Demand | N Applied with Organic Fertilizer to Soil | N Available in the First Year of Fertilization | Mineral N Fertilization | |
|---|---|---|---|---|---|---|---|---|---|---|
| t/ha | t/ha | kg N/ha | kg N/ha | kg N/ha | kg N/ha | kg N/ha | kg N/ha | kg N/ha | kg N/ha | |
| W-Wheat | 7.94 | 6.78 | 230 | 42 | 10 | 6 | 172 | (77) | 35 | 137 |
| S-Wheat | 5.79 | 4.69 | 180 | 42 | 6 | 132 | (77) | 35 | 97 | |
| Durum | 5.55 | 4.59 | 165 | 42 | 6 | 117 | (77) | 35 | 82 | |
| Rye | 5.65 | 4.22 | 148 | 42 | 6 | 100 | (77) | 35 | 65 | |
| W-Barley | 7.21 | 6.07 | 180 | 42 | 6 | 132 | (77) | 35 | 97 | |
| S-Barley | 6.82 | 4.95 | 140 | 42 | 6 | 92 | (77) | 35 | 57 | |
| Oats | 4.78 | 4.12 | 115 | 42 | 6 | 67 | (77) | 35 | 32 | |
| S-mixed Grains | 4.42 | 3.77 | 119 | 42 | 6 | 71 | (77) | 35 | 36 | |
| Triticale | 6.39 | 5.42 | 140 | 42 | 6 | 92 | (77) | 35 | 57 | |
| Corn Maize/Corn Cob Mix | 9.88 | 7.53 | 210 | 42 | 10 | 6 | 152 | (77) | 35 | 117 |
| Potatoes | 44.50 | 34.96 | 180 | 42 | 6 | 132 | (77) | 35 | 97 | |
| Sugar beet | 74.20 | 63.10 | 180 | 42 | 6 | 132 | (77) | 35 | 97 | |
| W-Rape | 3.80 | 3.00 | 195 | 42 | 6 | 147 | (77) | 35 | 112 | |
| Plants for green Harvest | 26.29 | 23.04 | 200 | 42 | 10 | 6 | 142 | (77) | 35 | 107 |
| Silage Maize | 44.11 | 34.27 | 200 | 42 | 10 | 6 | 142 | (77) | 35 | 107 |
| Permanent rassland | 6.74 | 4.91 | 145 | 30 | 6 | 109 | (77) | 35 | 74 |
Table 2.
Calculated nitrogen supply for different crops from available organic and mineral fertilization, according to average yields (2012–2017) and rough estimates on nitrogen mineralization based on regulations of German Fertilization Ordinance [31].
Table 2.
Calculated nitrogen supply for different crops from available organic and mineral fertilization, according to average yields (2012–2017) and rough estimates on nitrogen mineralization based on regulations of German Fertilization Ordinance [31].
| Total Production (2012–2017) | Total Production (2018) | Mineral Fertilization | Organic Fertilization (net) | Total Fertilization | Removal by Crop 2012–2017 | Removal by Crop 2018 | Fertilizer N not Transferred into Crop Yield 2018 | Fertilizer not Applied in 2018 | Gaseous Losses in Stable/during Storage | Gaseous Losses during Application | |
|---|---|---|---|---|---|---|---|---|---|---|---|
| 1000 t | 1000 t N | ||||||||||
| W-Wheat | 24,601 | 19,613 | 425 | 205 | 630 | 445 | 355 | 90 | 37 | 54 | 33 |
| S-Wheat | 381 | 526 | 6 | 4 | 11 | 6 | 9 | −2 | 1 | 1 | 1 |
| Durum | 98 | 139 | 1 | 1 | 3 | 1 | 2 | −1 | 0 | 0 | 0 |
| Rye | 3621 | 2206 | 41 | 42 | 84 | 55 | 33 | 21 | 7 | 11 | 7 |
| W-Barley | 8743 | 7397 | 118 | 80 | 198 | 144 | 122 | 22 | 16 | 21 | 13 |
| S-Barley | 2660 | 2216 | 22 | 26 | 48 | 37 | 31 | 6 | 6 | 7 | 4 |
| Oats | 613 | 577 | 4 | 8 | 13 | 9 | 9 | 1 | 2 | 2 | 1 |
| S-mixed Grains | 73 | 43 | 1 | 1 | 2 | 1 | 1 | 0 | 0 | 0 | 0 |
| Triticale | 2527 | 1950 | 23 | 26 | 49 | 42 | 32 | 10 | 5 | 7 | 4 |
| Corn Maize/Corn Cob Mix | 4622 | 3331 | 55 | 31 | 86 | 64 | 46 | 18 | 6 | 8 | 5 |
| Potatoes | 10,797 | 8740 | 24 | 16 | 40 | 38 | 31 | 7 | 3 | 4 | 3 |
| Sugar Beet | 27,038 | 24,628 | 35 | 24 | 59 | 49 | 44 | 4 | 5 | 6 | 4 |
| W-Rape | 5107 | 3665 | 151 | 89 | 240 | 171 | 123 | 48 | 16 | 24 | 14 |
| Plants for green Harvest | 9359 | 8525 | 38 | 24 | 62 | 54 | 49 | 5 | 5 | 6 | 4 |
| Silage Maize | 91,661 | 74,229 | 223 | 137 | 360 | 348 | 282 | 66 | 28 | 36 | 22 |
| Permanent Grassland | 30,108 | 22,160 | 331 | 295 | 626 | 635 | 468 | 168 | 58 | 78 | 47 |
| Sum | 1499 | 1010 | 2508 | 2100 | 1636 | 464 | 194 | 267 | 161 | ||
Table 3.
Soil surface budget of a fictive arable 100 ha model farm in the dry year 2018 and the year 2019, set up according to [31].
Table 3.
Soil surface budget of a fictive arable 100 ha model farm in the dry year 2018 and the year 2019, set up according to [31].
| Crop | W-Quality Wheat | W-Barley | S-Barley | Oats | Grain Maize | W-Oilseed Rape | ||||||
|---|---|---|---|---|---|---|---|---|---|---|---|---|
| Year | ‘18 | ‘19 | ‘18 | ‘19 | ‘18 | ‘19 | ‘18 | ‘19 | ‘18 | ‘19 | ‘18 | ‘19 |
| area cultivated (ha) | 25 | 15 | 15 | 15 | 15 | 15 | ||||||
| target yield(tons/ha) | 8 | 7 | 7 | 5 | 5,5 | 9 | 4 | |||||
| target quality (% raw protein) | 16 | 13 | 13 | 11 | 11 | 10 | 23 2 | |||||
| N demand (kg N/ha) | 260 | 215 | 180 | 180 | 140 | 140 | 130 | 130 | 200 | 200 | 200 | 200 |
| plant available N in soil (kg N/ha) | ||||||||||||
| N plant available in spring (kg N/ha) | −40 | −70 | −40 | −90 | −40 | −80 | −40 | −65 | −40 | −80 | −40 | −90 |
| N mineralized from soil organic matter (kg N/ha) | 0 | 0 | 0 | 0 | 0 | 0 | 0 | 0 | 0 | 0 | 0 | 0 |
| N mineralized from former manure application (kg N/ha) | 0 | 0 | 0 | 0 | 0 | 0 | 0 | 0 | 0 | 0 | 0 | 0 |
| N mineralized from preceding crop (kg N/ha) | −10 | −10 | 0 | 0 | −40 | −10 | 0 | 0 | −30 | −10 | 0 | 0 |
| N fertilization need during vegetation period (kg N/ha) | 210 | 135 | 140 | 90 | 60 | 50 | 90 | 65 | 130 | 110 | 160 | 110 |
| mineral N fertilization (maximum, kg N/ha) | 210 | 135 | 140 | 90 | 60 | 50 | 90 | 65 | 130 | 110 | 160 | 110 |
| N soil surface budget | ||||||||||||
| N inflow | ||||||||||||
| mineral fertilizer (kg N/ha) | 210 | 135 | 140 | 90 | 60 | 50 | 90 | 65 | 130 | 110 | 160 | 110 |
| organic fertilizer (kg N/ha) | 0 | 0 | 0 | 0 | 0 | 0 | 0 | 0 | 0 | 0 | 0 | 0 |
| manure of own farm (kg N/ha) | 0 | 0 | 0 | 0 | 0 | 0 | 0 | 0 | 0 | 0 | 0 | 0 |
| biological N-fixation/mineralization from preceding crop (kg N/ha) | 0 | 0 | 0 | 0 | 40 | 10 | 0 | 0 | 30 | 10 | 0 | 0 |
| sum (kg N/ha) | 210 | 135 | 140 | 90 | 100 | 60 | 90 | 65 | 160 | 120 | 160 | 110 |
| N removal (kg N/ha) | ||||||||||||
| yield realized (tons/ha) | 7.5 | 7 | 6.2 | 6.2 | 6 | 6 | 5 | 5 | 9 | 9 | 3.5 | 3.5 |
| N concentration in main product (kg N/tons fresh matter) | 24 | 18.1 | 18 | 18 | 15 | 15 | 15 | 15 | 15 | 15 | 34 | 34 |
| N removal with main product (kg N/ha) | 181 | 127 | 111 | 111 | 91 | 91 | 76 | 76 | 136 | 136 | 117 | 117 |
| total N removal (kg N/ha) | 181 | 127 | 111 | 111 | 91 | 91 | 76 | 76 | 136 | 136 | 117 | 117 |
| N surplus (kg N/ha) | 29 | 8 | 29 | −21 | 9 | −31 | 15 | −11 | 24 | −16 | 43 | −7 |
| N surplus per crop (kg N/crop) 1 | 731 | 208 | 435 | −315 | 141 | −288 | 218 | −158 | 362 | −239 | 641 | −109 |
1 2018: N surplus on farm level 2,528 kg N/100 ha; on average, 25 kg N/ha; 2019: N surplus on farm level −900 kg N/100 ha; on average, −9 kg N/ha; 2 in dry matter (dm).
Table 4.
Soil surface budget of a fictive 100 ha pig rearing model farm in the dry year 2018 and the year 2019, set up according to [31].
Table 4.
Soil surface budget of a fictive 100 ha pig rearing model farm in the dry year 2018 and the year 2019, set up according to [31].
| Crop | W-Quality Wheat | W-Barley | S-Barley | Oats | Grain Maize | W-Oilseed Rape | ||||||
|---|---|---|---|---|---|---|---|---|---|---|---|---|
| Year | ‘18 | ‘19 | ‘18 | ‘19 | ‘18 | ‘19 | ‘18 | ‘19 | ‘18 | ‘19 | ‘18 | ‘19 |
| area cultivated (ha) | 25 | 15 | 15 | 15 | 15 | 15 | ||||||
| target yield (tons/ha) | 8 | 7 | 7 | 5 | 5,5 | 9 | 4 | |||||
| target quality (% raw protein) | 16 | 13 | 13 | 11 | 11 | 10 | 23 2 | |||||
| N demand (kg N/ha) | 260 | 215 | 180 | 180 | 140 | 140 | 130 | 130 | 200 | 200 | 200 | 200 |
| plant available N in soil (kg N/ha) | ||||||||||||
| N plant available in spring (kg N/ha) | −40 | −70 | −40 | −90 | −40 | −80 | −40 | −65 | −40 | −80 | −40 | −90 |
| N mineralized from soil organic matter (kg N/ha) | 0 | 0 | 0 | 0 | 0 | 0 | 0 | 0 | 0 | 0 | 0 | 0 |
| N mineralized from former manure application (kg N/ha) | −6 | −9 | −14 | −13 | −9 | −7 | −13 | −9 | −17 | −16 | −13 | −16 |
| N mineralized from preceding crop (kg N/ha) | −10 | −10 | 0 | 0 | −40 | −10 | 0 | 0 | −30 | −10 | 0 | 0 |
| N fertilization need during vegetation period (kg N/ha) | 204 | 126 | 126 | 77 | 51 | 43 | 77 | 56 | 113 | 94 | 147 | 94 |
| manure application | ||||||||||||
| N-excretion pigs (kg N/ha) | 80 | 115 | 175 | 160 | 107 | 90 | 160 | 116 | 210 | 196 | 165 | 196 |
| minus maximum N-emissions from stable and storage (20%) | 64 | 92 | 140 | 128 | 85.6 | 72 | 128 | 92.8 | 168 | 156.8 | 132 | 157 |
| minus maximum N-emissions after application to soil (10%) | 56 | 80.5 | 123 | 112 | 75 | 63 | 112 | 81 | 147 | 137.2 | 115.5 | 137 |
| minimum plant availability in year of application (60%) | 38 | 55 | 84 | 77 | 51 | 43 | 77 | 56 | 101 | 94 | 79 | 94 |
| mineral N fertilization (maximum, kg N/ha) | 166 | 71 | 42 | 0 | 0 | 0 | 0 | 0 | 12 | 0 | 68 | 0 |
| N soil surface budget | ||||||||||||
| N inflow | ||||||||||||
| mineral fertilizer (kg N/ha) | 166 | 71 | 42 | 0 | 0 | 0 | 0 | 0 | 12 | 0 | 68 | 0 |
| organic fertilizer (kg N/ha) | 0 | 0 | 0 | 0 | 0 | 0 | 0 | 0 | 0 | 0 | 0 | 0 |
| manure of own farm (kg N/ha) | 56 | 80.5 | 123 | 112 | 75 | 63 | 112 | 81.2 | 147 | 137.2 | 116 | 137.2 |
| biological N-fixation/mineralization from preceding crop (kg N/ha) | 10 | 10 | 0 | 10 | 40 | 10 | 0 | 10 | 30 | 10 | 0 | 10 |
| sum (kg N/ha) | 232 | 161 | 165 | 122 | 115 | 73 | 112 | 92 | 189 | 147 | 183 | 147 |
| N removal (kg N/ha) | ||||||||||||
| yield realized (tons/ha) | 7.5 | 7 | 6.2 | 6.2 | 6 | 6 | 5 | 5 | 9 | 9 | 3.5 | 3.5 |
| N concentration in main product (kg N/tons fresh matter) | 24 | 24 | 18 | 18 | 15 | 15 | 15 | 15 | 15 | 15 | 34 | 34 |
| N removal with main product ((kg N/ha) | 181 | 168 | 111 | 111 | 91 | 91 | 76 | 76 | 136 | 136 | 117 | 117 |
| total N removal (kg N/ha) | 181 | 168 | 111 | 111 | 91 | 91 | 76 | 76 | 136 | 136 | 117 | 117 |
| N surplus (kg N/ha) | 51 | −7 | 54 | 11 | 24 | −18 | 37 | 16 | 53 | 11 | 66 | 30 |
| N surplus per crop (kg N/crop) 1 | 1271 | −185 | 803 | 168 | 359 | −267 | 551 | 240 | 800 | 168 | 991 | 448 |
1 2018: N surplus on farm level 4,774 kg N/100 ha; on average, 48 kg N/ha; 2019: N surplus on farm level 573 kg N/100 ha; on average, 6 kg N/ha; 2 in dry matter (dm).
© 2020 by the authors. Licensee MDPI, Basel, Switzerland. This article is an open access article distributed under the terms and conditions of the Creative Commons Attribution (CC BY) license (http://creativecommons.org/licenses/by/4.0/).
Share and Cite
MDPI and ACS Style
Klages, S.; Heidecke, C.; Osterburg, B. The Impact of Agricultural Production and Policy on Water Quality during the Dry Year 2018, a Case Study from Germany. Water 2020, 12, 1519. https://doi.org/10.3390/w12061519
AMA Style
Klages S, Heidecke C, Osterburg B. The Impact of Agricultural Production and Policy on Water Quality during the Dry Year 2018, a Case Study from Germany. Water. 2020; 12(6):1519. https://doi.org/10.3390/w12061519
Chicago/Turabian StyleKlages, Susanne, Claudia Heidecke, and Bernhard Osterburg. 2020. "The Impact of Agricultural Production and Policy on Water Quality during the Dry Year 2018, a Case Study from Germany" Water 12, no. 6: 1519. https://doi.org/10.3390/w12061519
Note that from the first issue of 2016, this journal uses article numbers instead of page numbers. See further details here.