Pattern of Water Use at the United Arab Emirates University


Department of Geography and Urban Sustainability, College of Humanities and Social Sciences, United Arab Emirates University, Al-Ain P.O. Box 15551, UAE
*
Author to whom correspondence should be addressed.
Water 2019, 11(12), 2652; https://doi.org/10.3390/w11122652
Submission received: 7 October 2019
/
Revised: 4 December 2019
/
Accepted: 12 December 2019
/
Published: 16 December 2019
(This article belongs to the Section Water Use and Scarcity)
Abstract
:In this study, indoor water use at the United Arab Emirates University (UAEU) was assessed for three years (2016, 2017, and 2018). A geographic information system (GIS) was employed to determine where water use is high within the university, when and why water is used, who uses it, and how to minimize its usage. Diverse data were employed to elucidate the broad patterns of university water use. It was assumed that water use is directly proportional to the number of students and is lower during winter. The relationship between water use and number of students in academic buildings was modeled using least squares regression. The results indicate a low correlation between water use and the number of students, possibly due to the centralized usage of academic buildings and movement of students between them. The hypothesis of activity-driven consumption indicated that most water use occurred in residential buildings (47.5%), averaging 81.7 L per person per day (LPD). This value is lower than the metrics for dormitories in the United States (121 LPD) and Europe (143 LPD). A survey of 412 students revealed that half the respondents were not aware of water issues. Most of them (87%) preferred to drink bottled water and were not willing to use gray water for flushing (56%) or urinals (60%). The findings of this study will improve the understanding of university water use which will facilitate the development of effective water conservation policies and the establishment of such practices among the next generation.
1. Introduction
In its 2021 vision, the United Arab Emirates (UAE) identified water as an area that requires further research, as water is a basic human need and the country spends millions of dollars every year desalinating and transporting water to its various cities and villages [1]. Water challenges in the UAE include the severe scarcity of groundwater reserves, high salinity levels in the existing groundwater, high cost of producing drinking water, limited re-use of water, and limited collection and treatment of wastewater outside the urban areas [2]. The water scarcity in the UAE has forced the water departments to rely on desalination. The UAE is the second-highest producer of desalinated water in the world, after Saudi Arabia [3]. Today, most of the potable water in the country (42% of the total water requirement) comes from some 70 major desalination plants [4]. Desalination is an expensive process with significant environmental impacts, such as effects on marine life. More details about the impacts of desalination plants related to brine discharge, air pollution, noise, and land use planning were provided by References [1,5].
The high intake of water for household and farming purposes is the main reason for the water shortage [6]. The low-priced water supply in the UAE leads people to waste water without much concern [6]. Specifically, the average per capita water consumption rate in the UAE is 500 L per person per day (LPD) [4], which is high compared with the averages for households in Africa (47 LPD), Asia (95 LPD), and the United Kingdom (334 LPD) [7] as well as Spanish homes (198 LPD) [8].
One of the main challenges for the future is to ensure the supply of clean water to the UAE population. Population growth and the increasing water use per capita strongly impact the water balance [9]. There are many reasons behind this high use, such as the location of the UAE in a hot and arid climate, high income, and increases in population, tourism, and industry. While the total UAE demand for water is gradually increasing and is currently estimated to be 4.5 billion cubic meters (BCM) per year, it is assumed that should current demand pattern and rates continue, the UAE’s total annual water demand is expected to double by 2030 to reach between 9 and 10 BCM [10]. About 65% of desalinated water is consumed by households and residences [1], while the remainder is employed for other purposes. With the scarcity of water in the UAE and increasing demand, it has become necessary to conduct research on water conservation. Various solutions have been proposed, such as the introduction of cost-reflective water price regimes, sustainable building codes, total wastewater reuse, leakage reduction, and diversification of supply sources in terms of renewable energy-powered desalination and cloud seeding [1]. A survey of 1000 UAE residents, conducted in 2013 by the Abu Dhabi-based Emirates Center for Strategic Studies, revealed that 84.5% of respondents agreed that water resources are being wasted in the country [11]. The survey concluded with a recommendation that it is important to engage schools and universities in raising awareness and providing education about this issue so that future custodians of this precious resource will have the right attitude, skills, and competencies to address water crises.
A considerable portion of human activity occurs within buildings. Therefore, minimizing energy and water use in buildings will help reduce the impact on the environment. Efforts could be made at both the individual and institutional levels to optimize water usage and consequently reduce costs and help protect the environment. Public institutions such as universities host a substantial portion of water users. Many universities worldwide have taken initiatives to reduce water use on their campuses [12]. For example, the University of Southern Queensland in Australia significantly reduced its water use by replacing all single-flush toilets with dual-flush systems, saving an estimated 2.5 million L/year [13]. Similar efforts have been made by Stanford University, the University of Arizona, and the University of Colorado-Boulder in the United States [14]. Plymouth University in the United Kingdom led a water conservation policy from 1991 to 2004 that resulted in a 45% reduction in water use as well as financial savings of 1.6 million GBP [15]. Saving water on university campuses is considered a part of the efforts toward sustainable development. Typical university students and others in the 17–24 age group consume more water per capita for personal use than either children or adults aged 25 years and over [16,17]. In fact, the effect of age on water use is about twice those of ethnicity and socioeconomic status [17]. The results of a water use study conducted at Arizona State University in the United States indicated that students use over three times more water than a person truly requires to meet his or her basic needs [17]. However, Petersen et al. [18] found that public awareness, competitions, and incentives reduced electricity consumption by hostel students by about one-third and water use by 3%.
Visualization of water use on large campuses requires a tool that can display spatial locations and attribute information (tabular data) about the buildings. A GIS can be utilized to answer the questions of who, what, when, where, and how water is used, to analyze consumers more precisely, to allocate campaign time more efficiently, and to facilitate decision making [19,20]. The benefit of using a GIS in this research is its ability to provide a holistic view of the problem [21,22], which is made possible by the simultaneous integration of different variables (water use with information about time, building locations, students/faculty/staff, facility types) from a variety of sources, creating new information and reviewing it systematically, and allowing decision makers to use it to assess interrelationships. The GIS can be utilized by large organizations to manage their water use in innovative ways (space optimization), decreasing operational costs. This approach greatly reduces the amount of time needed to analyze problems within a community and allows administrators to determine appropriate responses quickly.
The main objectives of this study were to utilize a GIS to assess indoor water use in different buildings at United Arab Emirates University (UAEU), to identify the reasons for the variations, benchmark water use at the university based on that at other universities, improve understanding of student water use habits on the UAEU campus and the willingness of students to use water conservation methods, and to measure the level of awareness of the students regarding water issues and challenges within the UAE.
2. Materials and Methods
2.1. Study Area
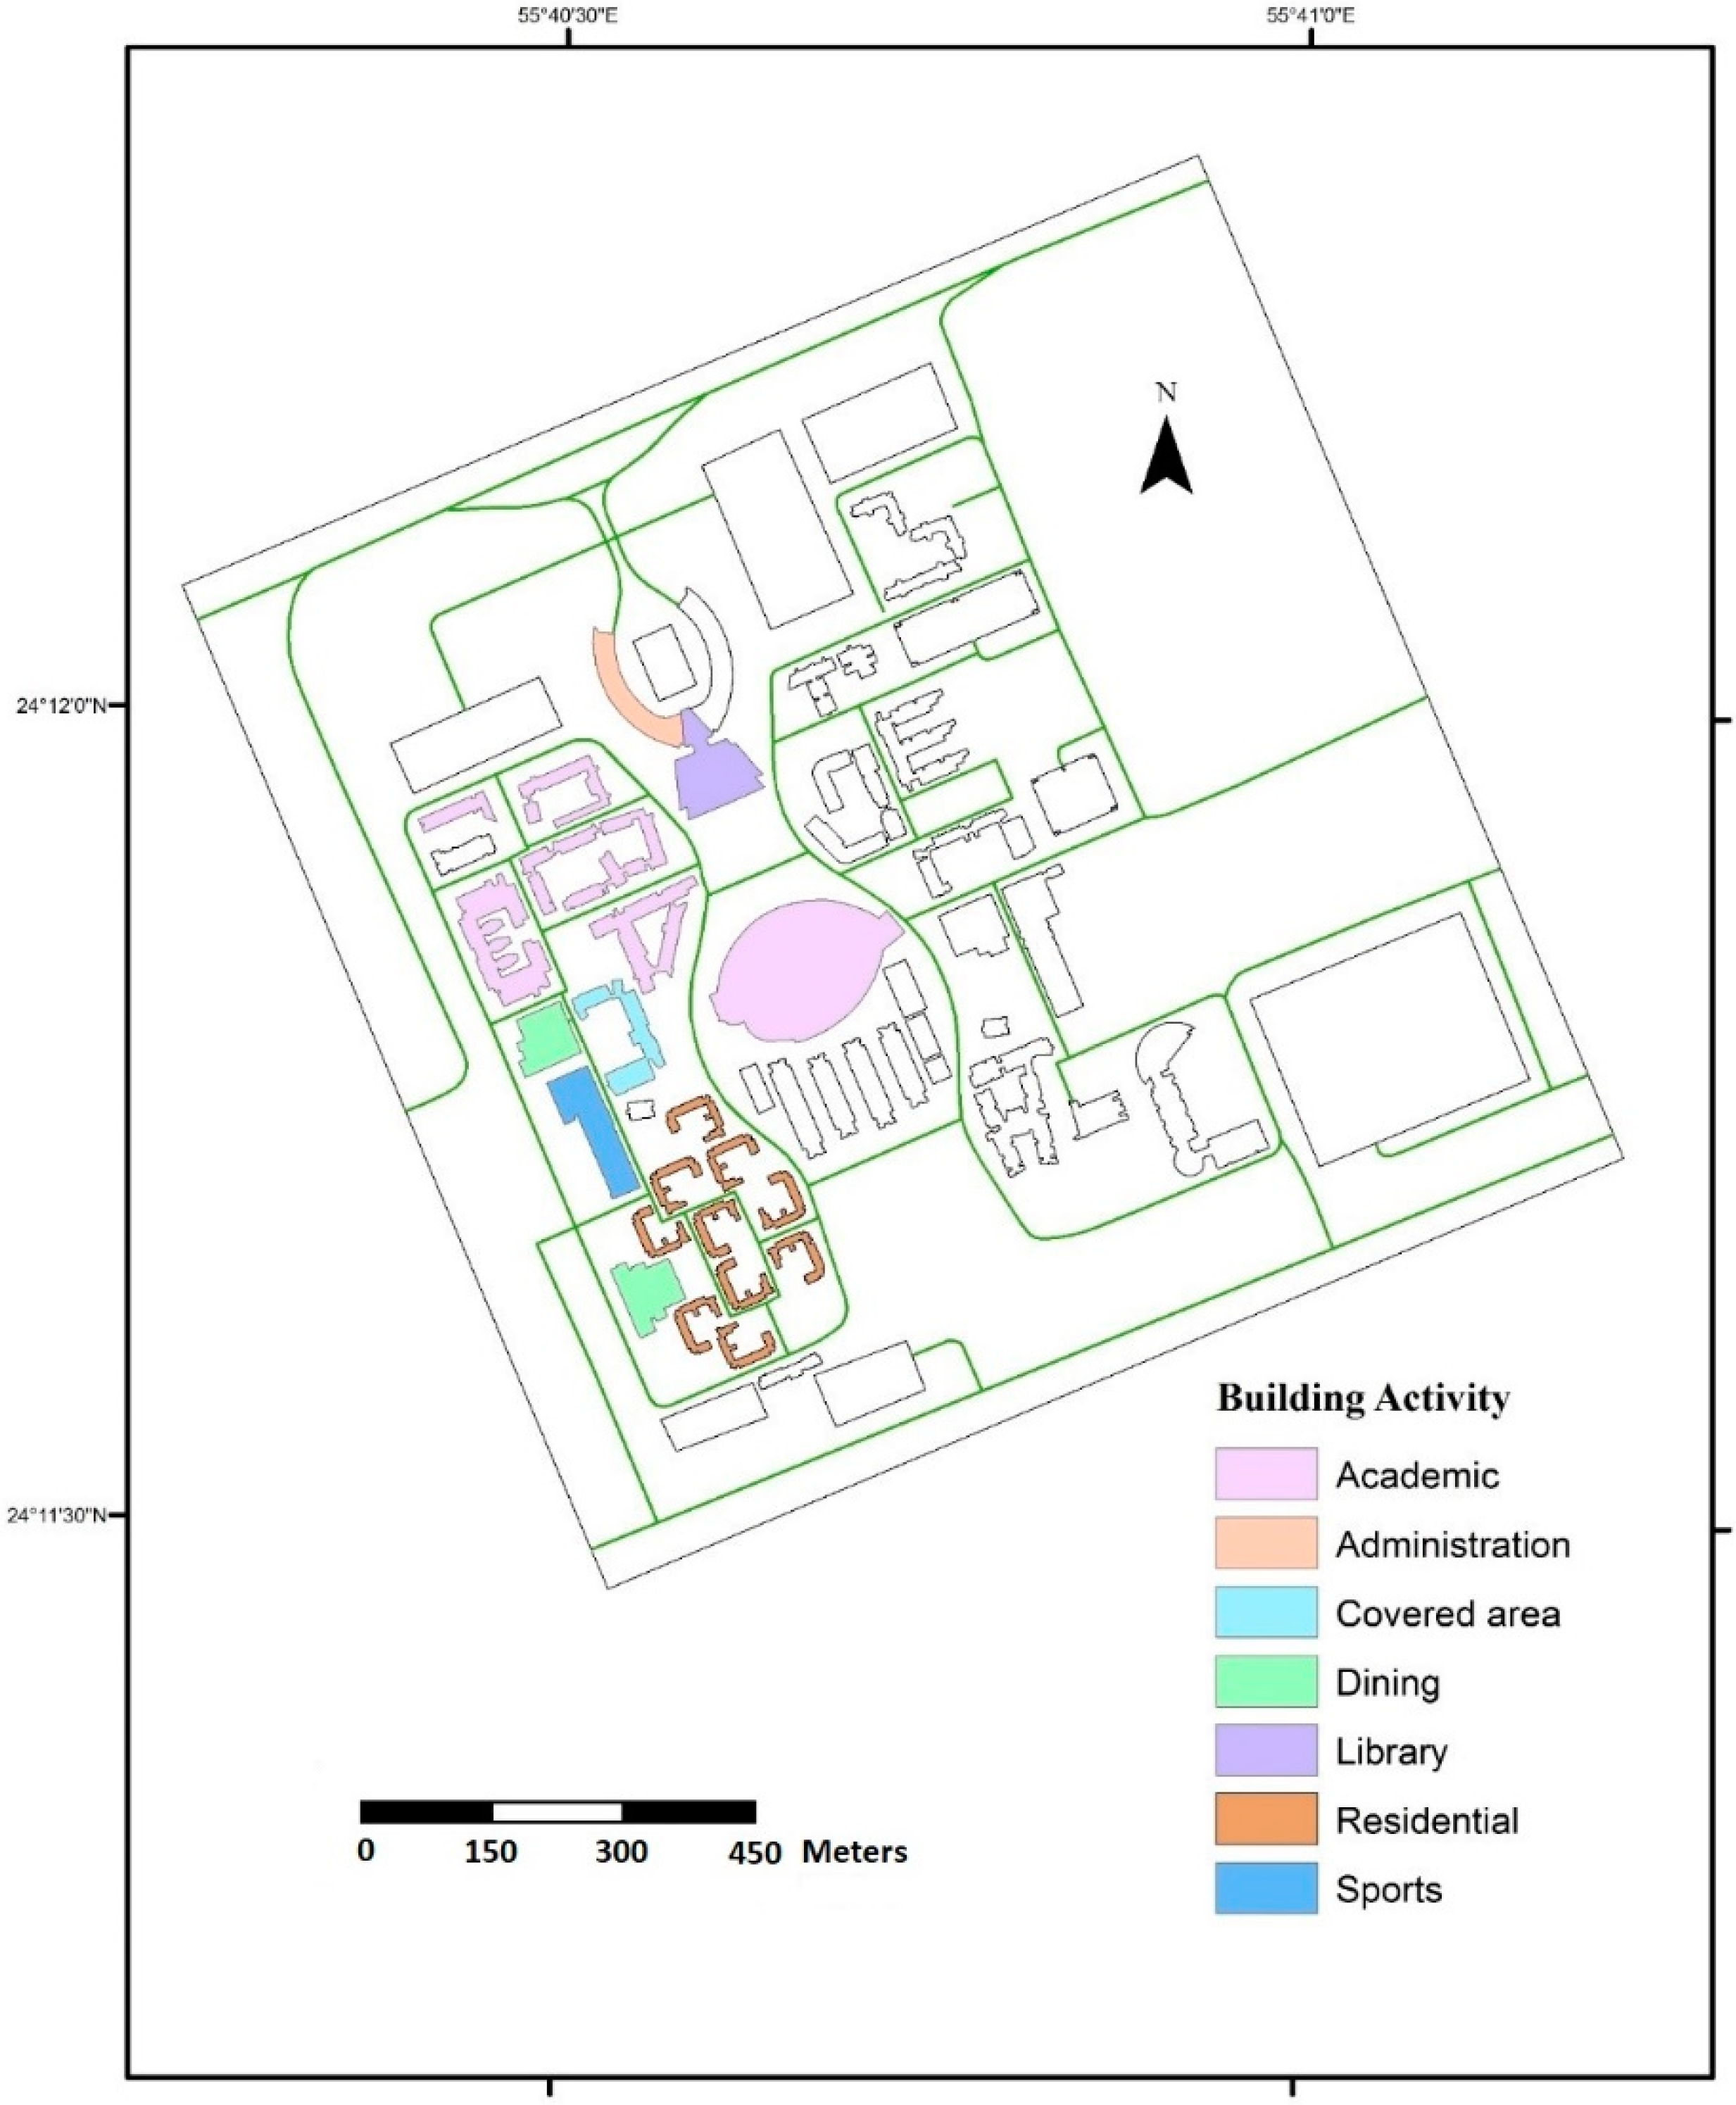
UAEU was founded in 1976 by the late Sheikh Zayed Bin Sultan Al Nahyan and is one of the largest public institutions in the UAE, with a total of 13,810 students, among whom, 19% are male and 81% are female. There were 981 academic staff members at the university during the 2016–2017 academic year [23]. The university has nine colleges and offers courses in all major disciplines, excluding dentistry. Moreover, it provides many services, such as student restaurants, residences, a library, and culture and sports facilities. The university occupies an area of 80 ha spread across various locations within Al Ain city. This study was focused on the main campus in the Al Magam district, which geographically falls between 24.192° N and 24.208° N latitude and 55.676° E and 55.687° E longitude (Figure 1). Potable water is supplied to the university by the Al Ain Distribution Company (AADC), whose main water sources are desalination plants at Al Fujariah (around 200 km from Al Ain) and Abu Dhabi (around 160 km from Al Ain). In 2017, AADC introduced new water tariffs [24]. According to the company, account holders that are federal and local government departments, public authorities, and public corporations whose premises are used principally for government purposes, are charged 10.4 Arab Emirates Dirham (AED)/1000 L, which is higher than the rate for homes (7.8 AED/1000 L).
In addition, the university has a few wells for irrigation operated by the university campus development sector. According to campus development, watering plants consumes a minor amount of potable water on the campus, as it uses gray water for these purposes. Therefore, water demand is driven by other activities (Figure 1).
2.2. Data
Data were obtained from various departments within the university, such as the Khadamat and Campus Development Department. The data included maps, class schedules, the numbers of students, and the monthly water meter readings for three years (2016, 2017, and 2018). Water meters for individual buildings at the university were installed in 2016. Therefore, data are available from 2016 onward. The water use data were checked to ensure that the links between the usage data and staffing or building data were correct, so that the calculations were reliable. A GIS was used for data processing and visualization of the water use at the UAEU combining various GIS layers, such as the space/area of the university buildings, temporal variation in water use, and number of students.
2.3. Methods
To assess water use broadly for this study, buildings were classified based on activity as academic buildings (used for teaching/lectures and offices), residential buildings (hostels), dining halls (catering, cooking), sport complexes (gymnasium and basketball), and a library (Figure 1, Table 1). Some of the sites could not be considered “single-activity” sites, for instance, the academic buildings also include a few small coffee break venues. Therefore, the classification is somewhat general. The aggregated use for a given purpose was obtained by combining the total water use at each building dedicated to the relevant activities. Buildings with higher water use were then analyzed in more detail. There are many hostels at the university; however, only 10 hostels that have water meters were assessed in this study. It was difficult to conduct least-squares regression for hostels (use versus number of users) because the number of students in each hostel was the same (250). Therefore, the monthly water use data for 2016, 2017, and 2018 were summarized using the totals and averages over space (cross-sectional) and time (longitudinal). The percentage of water use in each building was employed for a comparative study of different sites (benchmarking). The relationship between water use and number of students in academic buildings was modeled using least-squares regression. Despite the considerable size of the UAEU campus, the number of samples for individual activities was often too small to conduct comprehensive statistical analysis of the data.
The main task of the second objective was to benchmark the water use at UAEU based on that at international universities, such as the University of Bordeaux in France and Keele University in the United Kingdom, as well as the metrics for dormitories in the United States and Europe. The comparison was based on average use according to the LPD metric.
To assess student water use behaviors and awareness levels related to UAE water issues, two surveys were conducted. Approval to conduct the surveys was obtained from the Ethical Committee of the Research Affairs at UAEU. The first pilot survey was distributed to 50 students. This sample size was based on the recommendation of Parfitt [25] that at least 20 participants should be taken to determine whether a survey instrument is appropriate for the task for which it has been designed. The main objective of the pilot survey was to ensure that the questions were understandable, concise, and free of technical jargon. Based on the pilot survey, some questions were modified to improve the internal validity of the survey. The second main survey (sample of 412 students) was formulated based on the stated preference approach, and most items were multiple choice questions. The sample size was calculated using Equation (1), which yields the minimum number of survey forms required for a given confidence level with a normal distribution response from a large population [26].
where N is the minimum sample size, z is the z-value of a given confidence level (1.96 for a 95% confidence level), s is the coefficient of variation (assumed to be 0.5), and e is the tolerance level (assumed to be 5%). Based on Equation (1), the minimum sample size was determined to be 384. Since the UAEU student population is 19% male and 81% female, the minimum number of male student responses required was 73 and the minimum number of female student responses required was 311. A total of 412 students at UAEU answered the online survey questions, including 84 male students and 328 female students. In the analysis, the answers were expressed in terms of percentages relative to the total number of responses received. The survey results were analyzed using summaries of descriptive statistics.
3. Results and Discussion
3.1. Relationship Between Activities and Water Use
The first step in the analysis was to test the hypothesis of activity-driven use. The monthly water use at UAEU during 2016, 2017, and 2018 was obtained for 21 women’s side buildings, including the College of Information Technology (CIT), which is a shared college. It was difficult to obtain data for the men’s side because there were no water meters installed in individual buildings. Since females constitute around 81% of the total population, the data that could be collected reflect the general trend of water use at the university. The water use here does not include drinking water since the majority (87%) of students use bottled water (see Section 3.4).
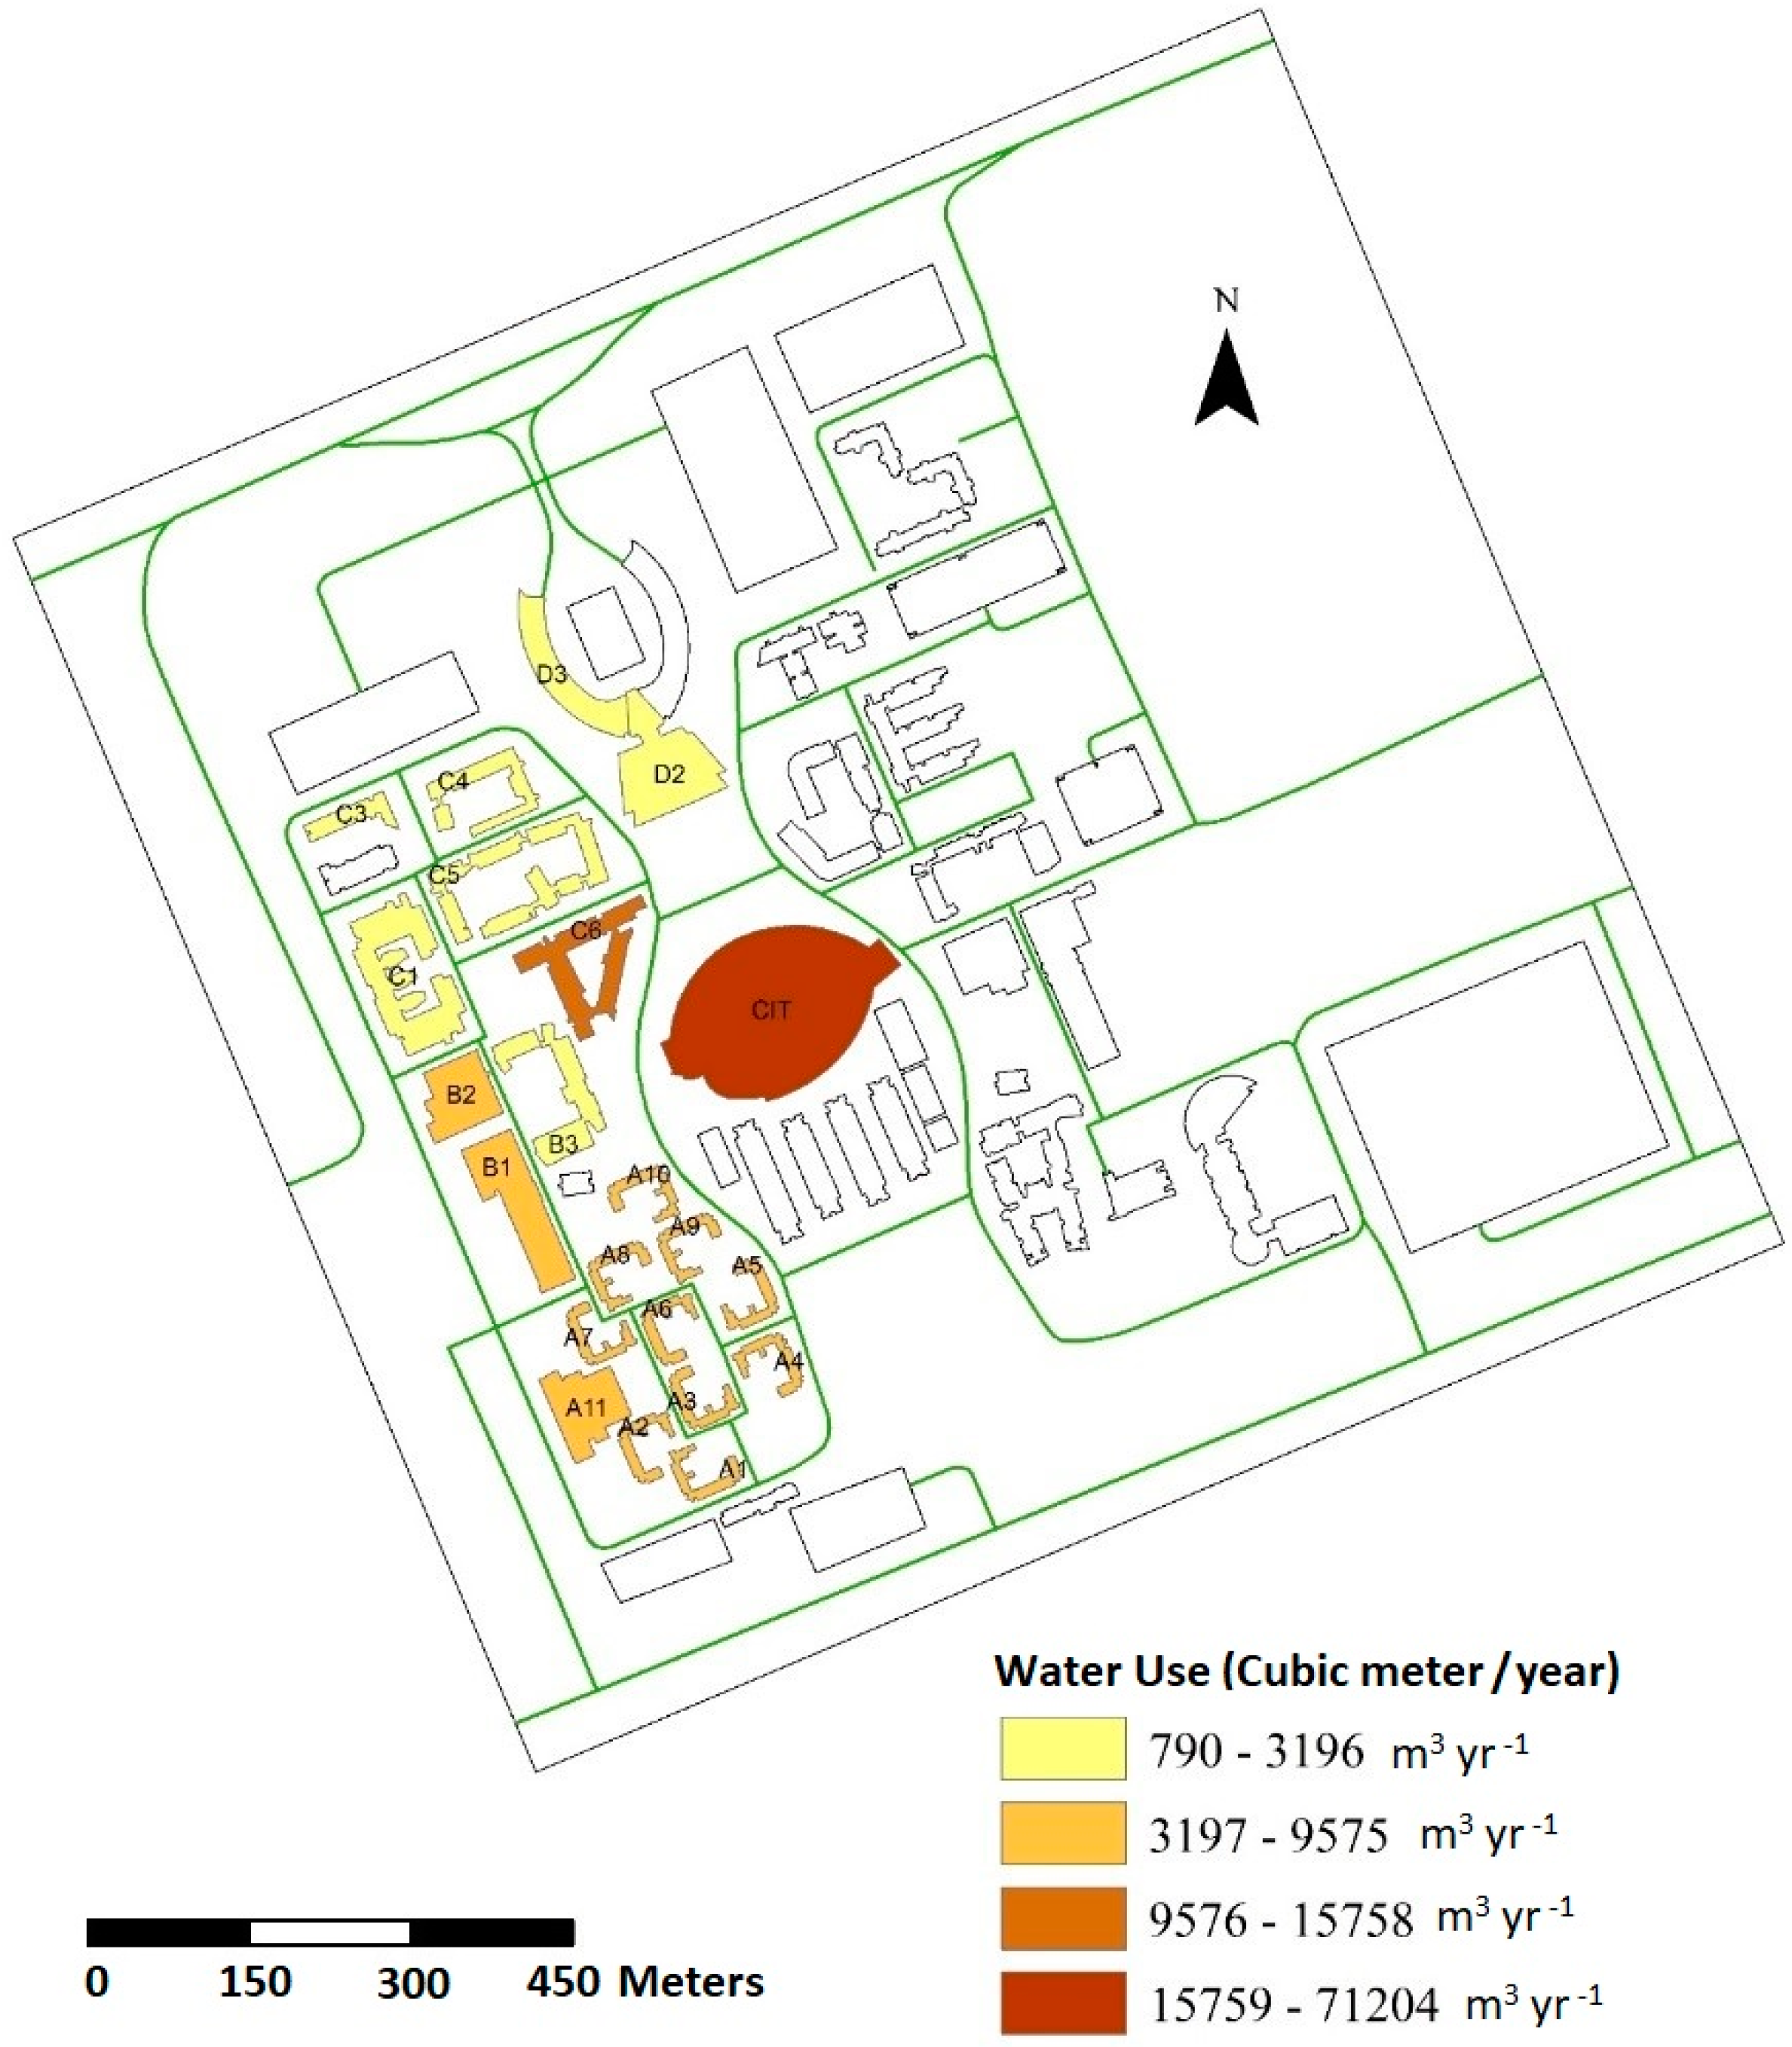
Based on the averages over three years, residential buildings (hostels) consume 47.5% of water, followed by the CIT and other academic buildings (Table 1, Figure 2). The high use in hostels is in line with a University of California, Berkeley, study that found that the highest water usage is in residence halls, due to the use of faucets, toilets, showers, and clothes washing machines [27].
On the college level, the highest water use was found at the CIT (30.4%) (Table 1, Figure 2), which may have several possible causes. First, the CIT is the only college in the university that includes sections for both men and women, which are separated by a gate. Therefore, it could be considered as two buildings in one, which explains the large number of classes. Moreover, many events, such as conferences and workshops, are organized at the CIT because of its facilities. Additional factors include two restaurants located in the building and the use of the college as an avenue for textbook distribution at the beginning of each semester, which normally takes around two weeks (Table 2). The study results indicate that the residential buildings and the CIT are the sites with the highest water use. This information can be employed to adapt water conservation techniques and water conservation campaigns at these sites.
There are 10 women’s hostels with 250 students each, amounting to a total capacity of 2500 students (Table 3). The remainder of the students live in hostels outside the study area. The total water use at the hostels is 74,594 m3/year with an average LPD of 81.7 (Table 3). The percentages based on occupancy were found to be less significant (Table 3). However, the maximum water use occurs in the hostels near academic classes (A9 and A10) (Table 3), indicating that these hostels are always at full capacity, which could be because students prefer to live in hostels close to academic buildings. There are many reasons for the higher water use in residential hostels, such as longer time spent at the hostels (showering, brushing, flushing of toilets, ablution, and use of washing machines). The study of household water usage conducted by Jethoo and Poonia [28] revealed that clothes washing machines have the highest use. In academic buildings (lecture rooms, labs), water use is mainly for sanitary purposes (lavatories/toilets) [29].
The library has low-water use (Table 1). A study conducted by Bonnet et al. [12] included libraries as one of the components of a university campus and yielded the same result, “water use is one of the smallest of the campus.” Academic libraries are increasingly being converted from spaces for housing printed books to spaces for students to study, collaborate, learn, and socialize, and act as centers of learning, culture, and the intellectual community.
3.2. Benchmarking of Water Use at the United Arab Emirates University (UAEU) Based on Other Universities
The water use benchmarking was based on a comparison of the water consumed at UAEU with the consumption at international universities. The total water use at UAEU for all buildings was 201,626 m3/year in 2016, 188,467 m3/year in 2017, and 115,583 m3/year in 2018, with an average of 168,559 m3/year. Dividing the average by the total number of students under study (11,340) gives 14.9 m3/year/student, which is equivalent to 40 LPD. The average water use per student at the University of Bordeaux in France is 38.4 LPD [12], which is comparable to that at UAEU. However, a recent study at Keele University in the United Kingdom revealed that the total water use during the 2015–2016 academic year was 532,415 m3 [30]. Keele University had a population of 9641 students and 1687 staff, totaling 11,328 individuals. Dividing the water use by the total population (532,415 m3/11,328 people) resulted in 47 m3/person or 129 LPD. The high-water use at Keele University may be because the university has residential buildings for faculty and staff on the campus, which is not the case at UAEU. However, the average water use at the UAEU hostels is higher, at 81.7 LPD (Table 2). The values at both the university level (40 LPD) and the hostel level (81.7 LPD) are lower than the metrics for dormitories in the United States (121 LPD) [31] and Europe (143 LPD) [32]. The lower LPD water use at UAEU is attributable to several factors. For instance, residential buildings (hostels), which account for 47.5% of the water consumption at the university (Table 1), are not fully occupied throughout the semester. Students must go home every week on Thursday evening (between 1 and 2 p.m.) and return to the hostel on Saturday evening (after approximately 4 p.m.), which indicates that the students spend only 68% of their time in the hostels each week. Moreover, the majority of the students are in classes during the day, 86% of them do not use tap water for drinking, and 94% do not wash their clothes in the hostels (see Section 3.4).
The water use data for seven sectors in Al Ain City (2002–2012) show that the residential (61.1%), governmental (20%), agricultural (10.3%), and commercial (5.4%) sectors have the highest water usage, while non-metered services (1.7%), public services (1.2%), and the industrial sector (0.3%) have the lowest usage [33]. The education facilities in Al Ain constitute the fifth largest consumer of electricity and the tenth largest water-consuming segment. In 2014, schools consumed 4.8 million m3 of water, representing an average of 9023 m3 per account or 752 m3 per month. The average monthly water use for any building at UAEU is less than 752 m3, except for that of the CIT. Based on this analysis, it is clear that the indoor water use at UAEU is below international and local water use metrics. However, on average, water costs the university around two million dirhams annually (AED 2,030,429 = EUR 474,399 = USD 553,250). Thus, more conservation efforts are needed.
3.3. Modeling the Relationship Between Number of Users and Water Use
Least-squares regression and the coefficient of determination (R²) were used to study the relationship between water use and number of students. R² is the proportion of the variance of the dependent variable (water use) that can be predicted using the independent variable (number of students). An R² value of 1 indicates that the regression model perfectly fits the data. In this study, R² ranged from 0.09 to 0.47 (Table 4), indicating a low correlation between water use and number of students. Statistical significance is attained when a p-value is equal to or smaller than significance (α) level (p ≤ 5%). The water use is not significant with the number of students because the calculated p-value ranges between 0.202 and 0.625 (Table 4), which is greater than 0.05. There could be several reasons for this finding. First, the number of students using the academic buildings varies because students may have lectures in different buildings on the same day (i.e., they are in a state of movement). Second, because the schedule distribution is more centralized, although some buildings are allocated to certain colleges, the actual users are students from other colleges. Bonnet et al. [12] reported that the water use of lecture buildings should be directly related to occupancy, that is to say, to the numbers of students and staff, rather than to surface area. However, the results of this study show that water use is not consistent with the number of students.
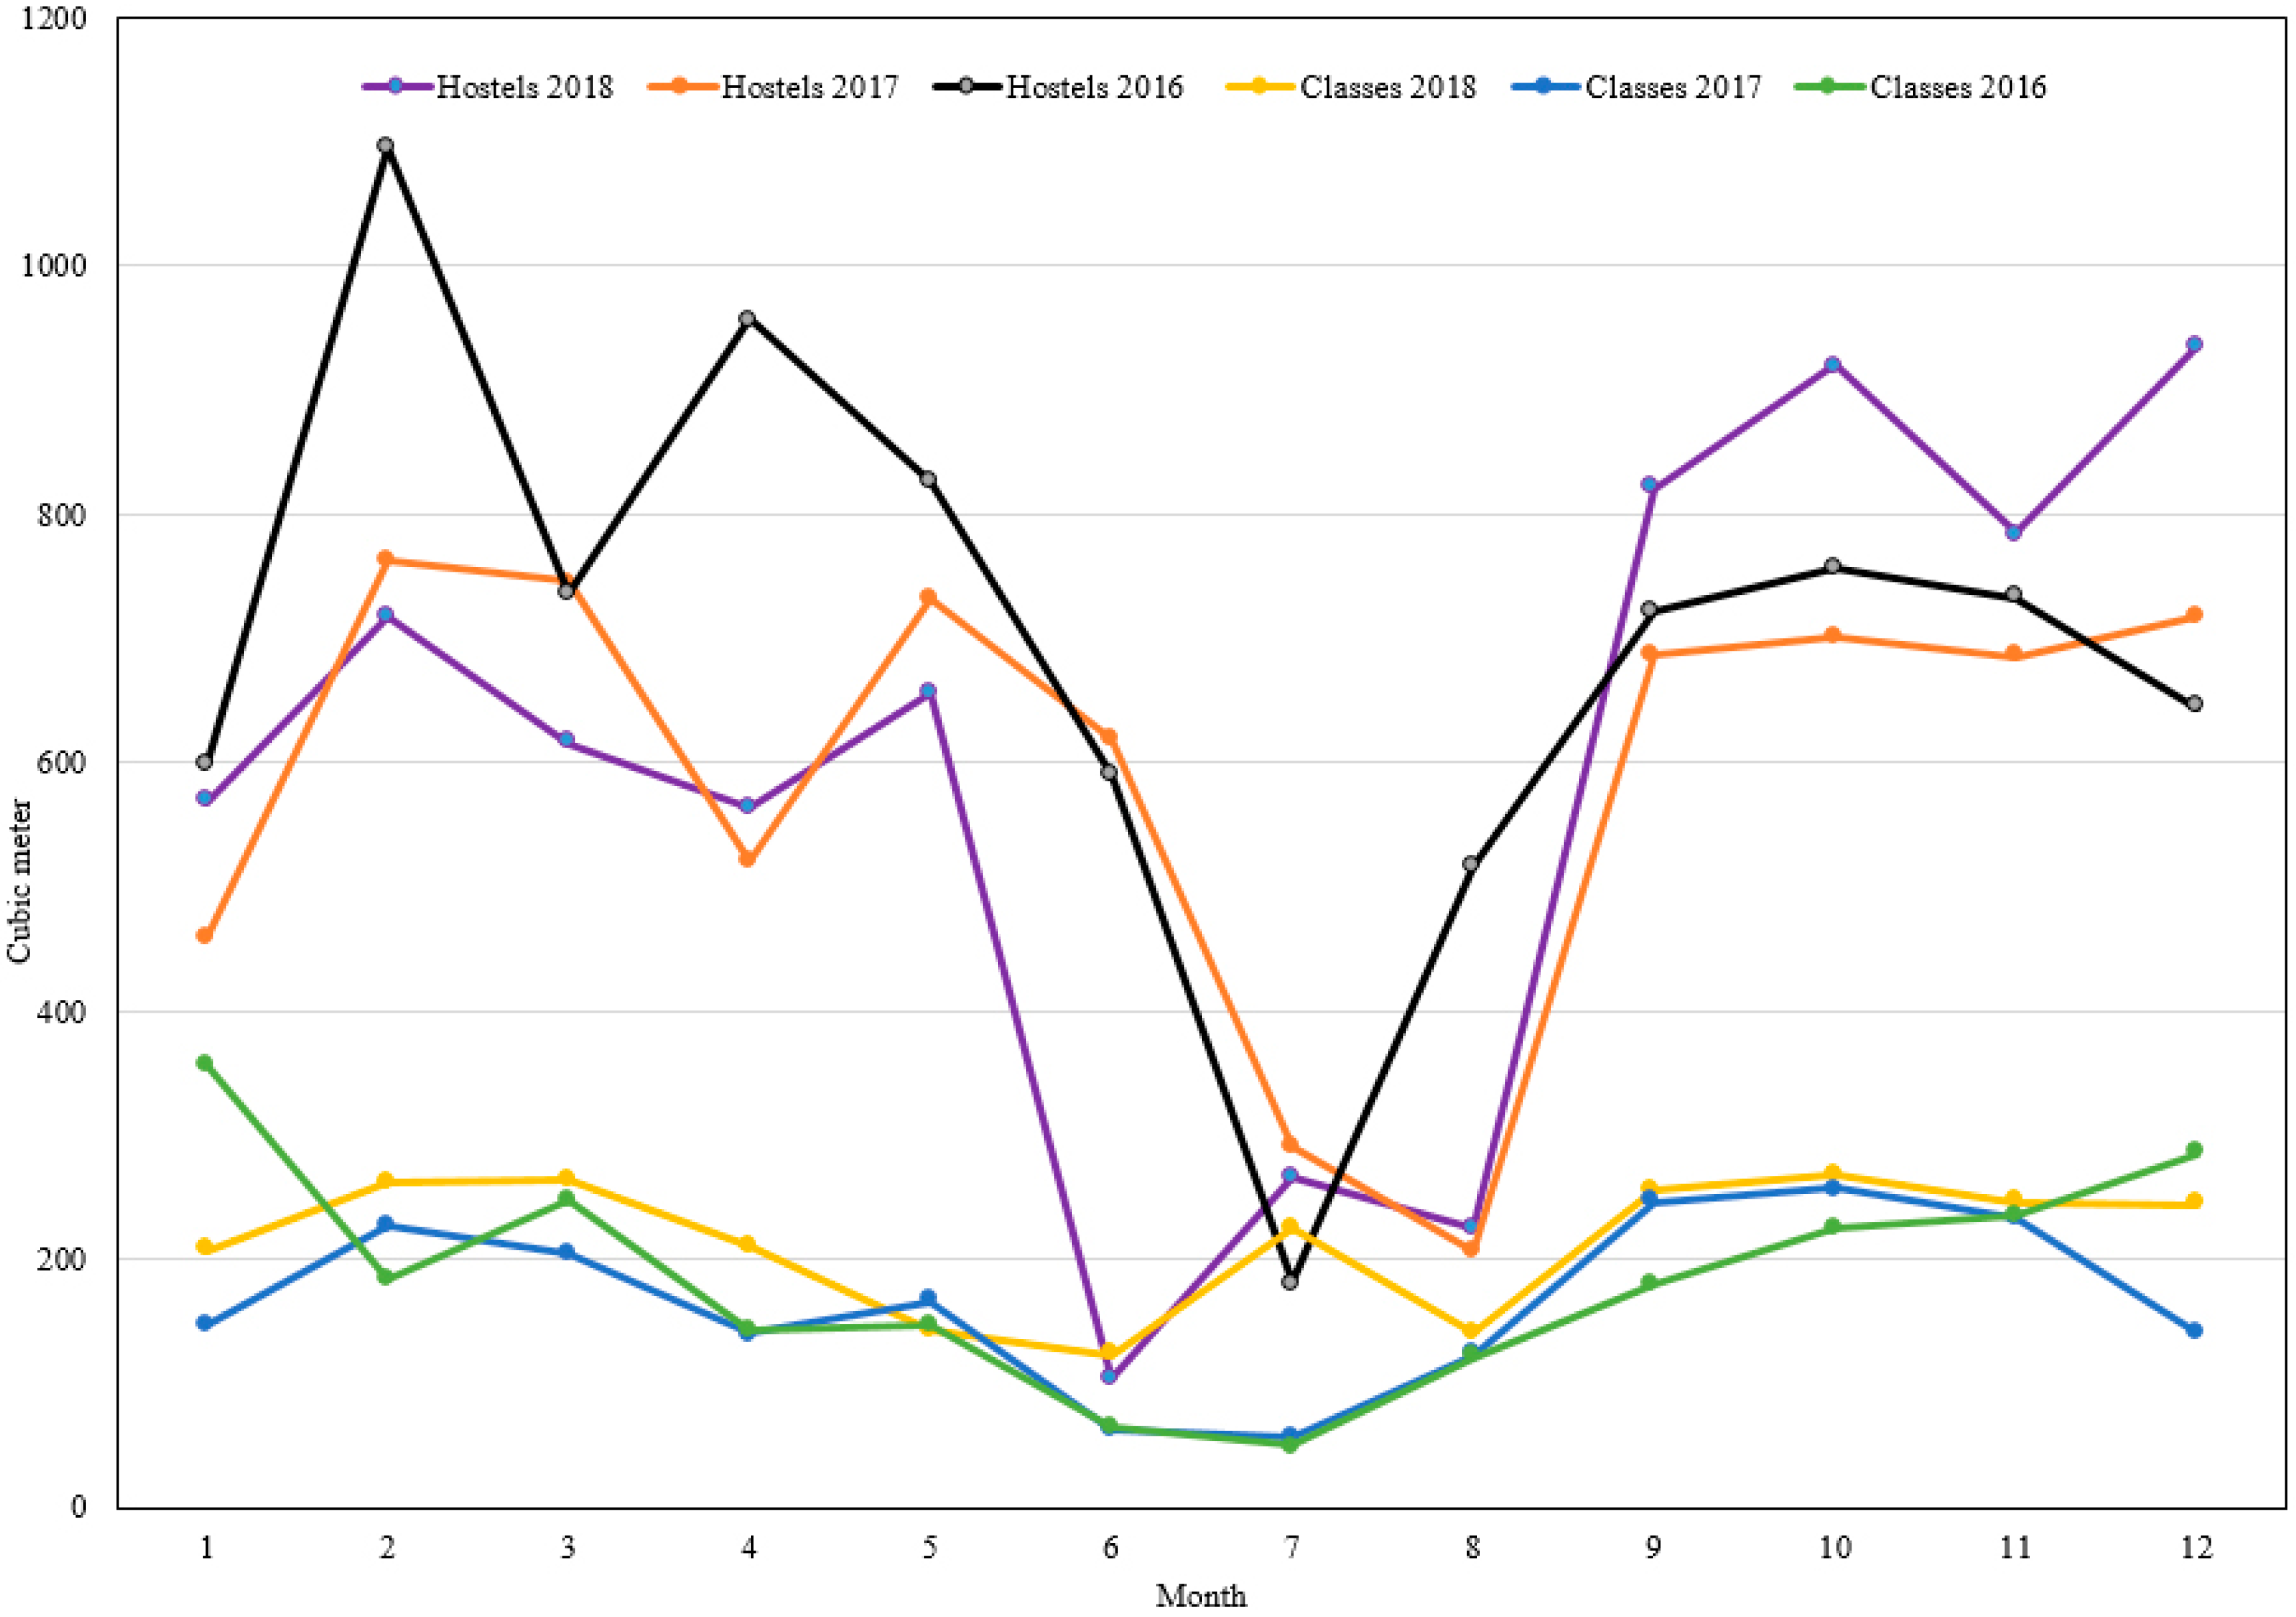
The temporal variations show that the lowest water use occurs during holidays, such as winter, spring, and summer breaks, which is very evident in the summer, as all of the trends show sharp decreases during July 2016, 2017, and 2018, irrespective of building type (Figure 3). However, the CIT shows high water use during the summer (July–August), which may be due to its utilization for summer courses.
3.4. Understanding Student Water Use Habits on the UAEU Campus
One of the main objectives of the survey was to understand student water use habits. Among the survey respondents, about 80% were female and 20% were male, in line with the general percentages of men and women at the university. Approximately 57% of the respondents live in UAEU hostels, while 43% live at their homes in Al Ain city. Only 12% of the students reported home water bills of less than 500 AED, while 57% reported water bills higher than 500 AED and about 31% did not know what the water bill was for their residences. A previous study showed that residents with high income and education levels easily underestimate their own use [34]. The members of this group consume more water than those of other groups and are not concerned about their water bills, leading them to underestimate their water use [34]. Therefore, there is a need for greater public awareness among families and their children regarding the financial and environmental costs of water. Corral-Verdugo et al. [35] emphasized the importance of public perception of water use because this perception facilitates the development of attitudes and behaviors that lead to water conservation.
For questions related to water use behavior, the results revealed that only 47% of the respondents close the tap while brushing their teeth, only 42% turn off the tap when they soap in the shower, and only 24% of them close the tap while washing their face. Furthermore, about 82% of the students spend more than 5 min showering. According to the respondents, 94% of students wash their clothes at their homes, while 6% wash their clothes at the university hostels. Additionally, most of the respondents (69%) spend less than 2 min performing ablution (washing for prayer), while about 31% spend 3–5 min. The students were also asked about their primary source of drinking water on the university campus, and 87% reported using bottled water for drinking instead of drinking from the tap, for many reasons. For instance, 40% of the students who do not drink tap water were worried about the quality of the water from the tap, 32% believe tap water is not clean, 18% dislike the taste of tap water, and 10% think it is more convenient to buy bottles of water than to carry a reusable water bottle. Generally, the UAE is among the top six countries worldwide in annual per capita bottled water use: about 182 L compared to a global average of 40 L [36]. The high use of bottled water is due to the high standard of living because the cost of bottled water is considered to be low or reasonable by most people [37]. However, the water provider company (AADC) states that the water in its network is safe to drink, although it stresses the necessity of cleaning water tanks and pipelines in homes and public institutions.
For questions related to student willingness to use water conservation methods, 56% of the students reported being willing to participate in a competition that rewards them for consuming less water in their rooms. However, when the students were asked if they were willing to use gray water for toilet flushing and hence, reduce potable water use, 56% of them said no (Table 5). Approximately 35% of the students who do not want to use gray water for toilets have little knowledge about gray water. While 31% of them believe that gray water is unclean, 18% of them do not want to use gray water for psychological reasons, and 15% dislike the smell of gray water. Furthermore, when the students were asked if they were willing to use urinals to reduce water use if they were installed at some toilets in the university, about 60% said no (Table 5). About 33% of the students who do not want to use urinals have little knowledge about them, 29% do not want to use urinals for psychological reasons, 22% worry about re-splash, and 16% worry about the smell of urine. The advantages of urinals, whether for males or females, are lower costs, simpler maintenance, smaller space requirements, reduced water use for flushing compared to flush toilets, a more hygienic, contact-free urination process, faster use, and easier recycling of nutrients as fertilizer [38]. While the use of urinals by men is common, it is uncommon for women. A study conducted in Australia in 2011 showed that more than half of the women interviewed would use a urinal if it were available [39]. Since the 2000s, female urinals have been introduced in a few European public toilets [40]. Thus, more research similar to that conducted in this study is needed to enrich the discussion regarding urinals for women. Furthermore, the students were asked if they were willing to take a course specifically focused on water conservation methods, and 64% of them said yes. Thus, there is a demand for more courses/workshops related to water conservation methods, which might change student perceptions of gray water and urinals.
3.5. Student Awareness of Water Issues and Challenges in the UAE
Among the students surveyed, 68% were aware that there is a water problem in the UAE, while 32% were not. The UAE has a severe freshwater shortage and extremely high salinity levels in the ground water aquifers. However, when the students were asked about the types of water problems in the UAE, 36% of them said there is a problem only with water quantity, 10% said there is a problem only with water quality. Only 31% answered the question correctly and said there are issues with both water quality and quantity, while 23% were not sure what the water issue is. Furthermore, 51% of the students did not even know that the UAE is among the countries with the highest water use in the world and 80% did not know the average per capita water use in the UAE. While one of the main sources of drinking water in the UAE is desalinated seawater, 51% of the students did not know this fact. Half of the students (50%) did not know that the UAE is among the countries with the greatest numbers of desalination plants worldwide. Moreover, almost half of the students (51%) did not know that the UAE suffers from rapid depletion of ground water, 82% thought that the amount of rainfall in the UAE is sufficient to refill the underground water aquifers, and only 18% were actually aware of the scarcity of rain. Overall, students need more public awareness about water issues in the UAE. In fact, evapotranspiration has been taking water out of the ground at approximately the same rate that rainfall has been adding it. Thus, there is no real net gain in the groundwater reserves from rain in the UAE [41].
4. Conclusions
Understanding water use at public institutions such as universities is very important because, although the LPD is low, these institutions have high numbers of users. To assess university water usage, it is essential to have meters installed in each individual building to temporally monitor usage. The outputs of the present study include thematic maps showing buildings with high water use, a graph displaying temporal variations in water use, and statistics to elucidate student water use habits and awareness levels. The results will facilitate an understanding of the broad pattern of water usage on the UAEU campus and the formulation of a plan to minimize it. The methodology used in this study could be adopted by similar universities/institutions.
Students, faculty members, and staff are encouraged to participate in water conservation efforts. The study proposes additional real-time metering at buildings with higher use. It is recommended that the university set certain standards for the usage of water-saving installations, pipes, faucets, and fittings, and use efficient taps and closets, as well as water-saving low-flow shower heads. Currently, urinals are not installed in any part of the university and their installation would reduce water use. However, 60% of the students surveyed are not willing to use urinals. Thus, more research such as that performed in this study is needed to enrich the discussion regarding urinals for women.
It is also possible to install water meters in each room in the hostels and to reward students who consume less water, which would affect positive changes in water usage in the long run. In addition, a device to detect and stop internal spills, such as that developed by Sharjah Electricity and Water Authority, could be installed to reduce water use. It would be advisable to embed a background of water conservation into the curriculum framework, especially in the foundational courses at the university. The use of gray water for toilet flushing could reduce potable water use, and public awareness among students regarding this option should be increased. Universities should also check the cleanliness of water tanks and pipeline networks to encourage the use of tap water for drinking, thereby reducing the environmental impact of plastic bottles.
Author Contributions
Conceptualization: M.M.Y. and T.S.A.; Data curation: L.E., Y.A. and R.A.; Formal analysis: M.M.Y. and T.S.A.; Funding acquisition: M.M.Y.; Investigation: T.S.A.; Methodology: M.M.Y.; Project administration: M.M.Y.; Supervision: M.M.Y. and T.S.A.; Visualization: M.M.Y.; Writing—Original draft: M.M.Y.; Writing—Review and editing: T.S.A.
Funding
This research was funded by the United Arab Emirate University-Research Affairs-SURE Plus 2017/2018 (Project No. G00002797). The views and conclusions are those of the authors and should not be taken as those of the sponsor.
Acknowledgments
The United Arab Emirates University-Research Affairs is gratefully acknowledged for the support. The authors would like to acknowledge Khadamat Facilities Management and Campus Development Department for providing data about water use at United Arab Emirates University and maps. Gratitude is also extended to Yaser Al Jaberi, David Harris, Naeema Al Hosani, Mahmoud Alhader, and Eng. Bakri A. of Al Ain Distribution Company, Alaa Al-Din Mohammed Al Hassan of Sharjah Electricity and Water Authority, Robert Bridi for reviewing the research, and Shehab Majud for following-up with editing. We thank the water Journal editorial team and the anonymous reviewers for their constructive comments and suggestions.
Conflicts of Interest
The authors declare no conflict of interest.
References
- Giwa, A.; Dindi, A. An investigation of the feasibility of proposed solutions for water sustainability and security in water-stressed environment. J. Clean. Prod. 2017, 165, 721–733. [Google Scholar] [CrossRef]
- Alsharhan, A.S.; Wood, W.W. Water resources in the United Arab Emirates. Dev. Water Sci. 2003, 50, 245–264. [Google Scholar]
- Mohsen, M.S.; Akash, B.; Abu Abdo, A.; Akash, O. Energy options for water desalination in UAE. Procedia Comput. Sci. 2016, 83, 894–901. [Google Scholar] [CrossRef] [Green Version]
- UAE Government (The Official Portal). UAE Fact Sheet. 2019. Available online: https://www.government.ae/en/about-the-uae/fact-sheet (accessed on 14 September 2019).
- Dawoud, M.A.; Al Mulla, M.M. Environmental Impacts of Seawater Desalination: Arabian Gulf Case Study. Int. J. Environ. Sustain. 2012, 1, 22–37. [Google Scholar] [CrossRef]
- UK Essays. Water Scarcity Problem in UAE. 2013. Available online: https://www.ukessays.com/essays/economics/water-scarcity-uae-8845.php?vref=1 (accessed on 19 September 2019).
- Food and Agriculture Organization of the United Nations (FAO). WATER and PEOPLE: Whose Right Is It? 2019. Available online: http://www.fao.org/3/Y4555E/Y4555E00.htm (accessed on 14 September 2019).
- Morote, Á.F.; Hernández, M.; Rico, A.M. Causes of Domestic Water Consumption Trends in the City of Alicante: Exploring the Links between the Housing Bubble, the Types of Housing and the Socio-Economic Factors. Water 2016, 8, 374. [Google Scholar] [CrossRef] [Green Version]
- Murad, A.A.; Al Nuaimi, H.; Al Hammadi, M. Comprehensive assessment of water resources in the United Arab Emirates (UAE). Water Resour. Manag. 2007, 21, 1449–1463. [Google Scholar] [CrossRef]
- Al-Mulla, M. UAE State of the Water Report. In Proceedings of the 2nd Arab Water Forum, Cairo, Egypt, 20–23 November 2011. [Google Scholar]
- Khaleejtimes. Over 84% of Nationals Admit Water is Wasted in the UAE, Says Study. 2013. Available online: https://www.khaleejtimes.com/nation/general/over-84-of-nationals-admit-water-is-wasted-in-the-uae-says-study (accessed on 26 August 2019).
- Bonnet, J.; Devel, C.; Faucher, P.; Roturier, J. Analysis of electricity and water end-uses in university campuses: Case-study of the University of Bordeaux in the framework of the Ecocampus European Collaboration. J. Clean. Prod. 2002, 10, 13–24. [Google Scholar] [CrossRef]
- University of Southern Queensland, Water-Consumption. 2019. Available online: https://www.usq.edu.au/about-usq/values-culture/environment-sustainability/water-consumption (accessed on 8 September 2019).
- University of Colorado Boulder, Campus Water Use. CU Environmental Center. 2006. Available online: https://www.colorado.edu/ecenter/sites/default/files/attached-files/campus_water_use.pdf (accessed on 9 September 2019).
- Plymouth University, Water. 2019. Available online: https://www.plymouth.ac.uk/students-and-family/sustainability/water (accessed on 9 September 2019).
- Campbell, H.; Johnson, R.M.; Larson, E.H. Prices, Devices, People, or Rules: The Relative Effectiveness of Policy Instruments in Water Conservation. Rev. Policy Res. 2004, 21, 637–662. [Google Scholar] [CrossRef]
- Knox, A.; Cutts, B. Water consumption and conservation among college students. Int. J. Sci. Soc. Law 2010, 2010, 14–16. [Google Scholar]
- Petersen, J.E.; Shunturov, V.; Janda, K.; Platt GWeinberger, K. Dormitory residents reduce electricity consumption when exposed to real-time visual feedback and incentives. Int. J. Sustain. High. Educ. 2007, 8, 16–33. [Google Scholar] [CrossRef]
- Singh, S.; Samaddar ASrivastava, R. Sustainable drinking water management strategy using GIS. Manag. Environ. Qual. 2010, 21, 436–451. [Google Scholar] [CrossRef]
- Tsihrintzis, V.A.; Hamid, R.; Fuentes, H.R. Use of Geographic Information Systems (GIS) in Water Resources: A Review. Water Resour. Manag. 1996, 10, 251–277. [Google Scholar] [CrossRef]
- Chang, K.-T. Introduction to Geographic Information Systems, 6th ed.; McGraw Hill: New York, NY, USA, 2015. [Google Scholar]
- Longley, P.A.; Goodchild, M.F.; Maguire, D.J.; Rhind, D.W. Geographic Information Systems and Science; John Wiley & Sons, Ltd.: London, UK, 2011. [Google Scholar]
- UAEU. UAEU Facts and Figures. 2019. Available online: https://www.uaeu.ac.ae/en/about/facts_and_figures.shtml (accessed on 14 September 2019).
- Al Ain Distribution Company-AADC. Water and Electricity Tariff. 2019. Available online: https://www.aadc.ae/en/pages/maintarrif.aspx (accessed on 14 September 2019).
- Parfitt, J. Questionnaire design and sampling. In Methods in Human Geography; Flowerdew, R., Martin, D., Eds.; Pearson Education Limited: London, UK, 2005. [Google Scholar]
- Roses, R.P.; Prassas, E.S.; McShane, W.R. Traffic Engineering, 3rd ed.; Pearson Education Inc.: Hoboken, NJ, USA, 2004. [Google Scholar]
- Buckley, R.A. Water Use Characteristics of College Students; Senior Research Seminar, ES196; University of California: Berkeley, CA, USA, 2004; Available online: https://nature.berkeley.edu/classes/es196/projects/2004final/buckley.pdf (accessed on 16 September, 2019).
- Jethoo, A.; Poonia, M. Water Consumption Pattern of Jaipur City (India). 2011. Available online: http://www.ijesd.org/papers/114-F10070.pdf (accessed on 11 June 2019).
- Iversen, J. Analysis of Potable Water Use at Yale University. 2010. Available online: https://sustainability.yale.edu/sites/default/files/files/research-publications/AnalysisPotableWaterUse_YaleUniversity.pdf (accessed on 12 September 2019).
- Gu, Y.; Wang, H.; Xu, J.; Wang, Y.; Wang, X.; Robinson, Z.P.; Li, F.; Wu, J.; Tan, J.; Zhi, X. Quantification of interlinked environmental footprints on a sustainable university campus: A nexus analysis perspective. Appl. Energ. 2019, 246, 65–76. Available online: https://ideas.repec.org/a/eee/appene/v246y2019icp65-76.html (accessed on 19 September 2019). [CrossRef]
- Berardi, U.; Alborzfard, N. Water consumption in dormitories: Insight from an analysis in the USA. In Sustainable Water Use and Management, Green Energy and Technology; Filho, W.L., Sümer, V., Eds.; Springer: Cham, Switzerland, 2015; pp. 45–63. [Google Scholar] [CrossRef]
- Mudgal, S.; Lauranson, R. Study on Water Performance of Buildings; European Commission (DG ENV): Brussels, Belgium, 2009; Reference Number: 070307/2008/520703/ETU/D2. [Google Scholar]
- Younis, H.I. Water Demand Forecasting in Al-Ain City. Master’s Thesis, United Arab Emirates University, Al Ain, UAE, 2016. Available online: https://scholarworks.uaeu.ac.ae/all_theses/188/ (accessed on 12 September 2019).
- Fan, L.; Fei, W.; Guobin, L.; Yang, X.; Qin, W. Public perception of water consumption and its effects on water conservation behavior. Water 2014, 6, 1771–1784. [Google Scholar] [CrossRef] [Green Version]
- Corral-Verdugo, V.; Frias-Armenta, M.; Perez-Urias, F.; Orduna-Cabrera, V.; Espinoza-Gallego, N. Residential water consumption, motivation for conserving water and the continuing tragedy of the commonsm. Environ. Manag. 2002, 30, 527–535. [Google Scholar] [CrossRef] [PubMed]
- IBWA. Market Report Findings; International Bottled Water Association: Alexandria, VA, USA, 2013; Available online: http://www.bottledwater.org/economics/ (accessed on 10 September 2019).
- Maraqa, M.; Ghoudi, K. Survey of public attitude towards bottled and tap water quality in the UAE. Glob. Nest J. 2015, 17, 607–617. [Google Scholar]
- Demiriz, M. Female urinals. In Proceedings of the CIB W062 2010–36th International Symposium of Water Supply and Drainage for Buildings; 2010. Available online: http://www.irbnet.de/daten/iconda/CIB20413.pdf (accessed on 13 September 2019).
- Kyriakou, D.; Jackson, J. We know squat about female urinals. Plumb. Connect. Available online: https://www.map-testing.com/assets/files/female%20urinals.pdf (accessed on 14 December 2019).
- Wikipedia, Female Urinal. 2018. Available online: https://en.wikipedia.org/wiki/Female_urinal (accessed on 14 September 2019).
- Gonzalez, R.; Ouarda, T.; Marpu, P.; Allam, M.; Eltahir, E.; Pearson, S. Water budget analysis in arid regions, application to the United Arab Emirates. Water 2016, 8, 415. [Google Scholar] [CrossRef] [Green Version]
Figure 1.
Geographic location and building activities at the United Arab Emirates University (UAEU).
Figure 1.
Geographic location and building activities at the United Arab Emirates University (UAEU).

Figure 2.
Schematic map of water use at the UAEU in 2017.

Figure 3.
Temporal variation of water use at the UAEU (2016–2018).


Table 1.
Total water use by building type (m3).
| 2016 | % | 2017 | % | 2018 | % | Average % | |
|---|---|---|---|---|---|---|---|
| CIT * | 89,182 | 44.8 | 71,204 | 38.3 | 9100 | 8.1 | 30.4 |
| Residential | 81,776 | 41.1 | 70,218 | 37.8 | 71,787 | 63.6 | 47.5 |
| Academic | 10,489 | 5.3 | 23,781 | 12.8 | 12,970 | 11.5 | 9.9 |
| Dining | 10,298 | 5.2 | 13,522 | 7.3 | 12,536 | 11.1 | 7.9 |
| Sports | 6633 | 3.3 | 6295 | 3.4 | 5702 | 5.1 | 3.9 |
| Library | 802 | 0.4 | 790 | 0.4 | 758 | 0.7 | 0.5 |
| Total | 199,180 | 100 | 185,810 | 100 | 112,853 | 100 | 100 |
* The College of Information Technology (CIT) is kept separate from the “Academic” category because of its high-water use.
Table 2.
Numbers of students who visited the CIT to obtain their hardcopy textbooks.
| Semester | Female | Male | Total | % * |
|---|---|---|---|---|
| Fall 2016/2017 | 10,454 | 1374 | 11,828 | 86 |
| Spring 2016/2017 | 9439 | 1258 | 10,697 | 77 |
| Fall 2017/2018 | 8268 | 1016 | 9284 | 67 |
| Spring 2017/2018 | 5696 | 1035 | 6731 | 49 |
* The percentages were calculated based on a total of 13,810 students.
Table 3.
Average total water use at residential buildings (hostels).
| Hostel | Average Water Use 2016–2018 (m3) | % | Water Use per Student per Year (m3/250) | Water Use in Terms of LPD (m3∙(1000/365)) |
|---|---|---|---|---|
| A1 | 5883 | 7.9 | 23.53 | 64.5 |
| A2 | 4843 | 6.5 | 19.37 | 53.1 |
| A3 | 8646 | 11.6 | 34.59 | 94.8 |
| A4 | 6223 | 8.3 | 24.89 | 68.2 |
| A5 | 7203 | 9.7 | 28.81 | 78.9 |
| A6 | 7155 | 9.6 | 28.62 | 78.4 |
| A7 | 6830 | 9.2 | 27.32 | 74.8 |
| A8 | 8541 | 11.4 | 34.16 | 93.6 |
| A9 | 10,293 | 13.8 | 41.17 | 112.8 |
| A10 | 8977 | 12.0 | 35.91 | 98.4 |
| Total: 74,594 | Total: 100 | Average: 29.84 | Average: 81.7 |
Table 4.
Relationship between water use (dependent variable, y) and number of students (independent variable, x) in academic buildings.
Table 4.
Relationship between water use (dependent variable, y) and number of students (independent variable, x) in academic buildings.
| Semester | Model | R² | P-Value |
|---|---|---|---|
| Fall 2016/2017 | y = 0.1114x + 682.72 | 0.4689 | 0.202143 |
| Spring 2016/2017 | y = 0.147x + 516.69 | 0.4299 | 0.229596 |
| Fall 2017/2018 | y = 0.2331x + 1182 | 0.0896 | 0.624652 |
| Spring 2017/2018 | y = 0.328x + 1128.8 | 0.1328 | 0.546537 |
Table 5.
Student willingness to use water conservation methods.
| Features | Number of Respondents | Respondents (%) | |
|---|---|---|---|
| Are you willing to use gray water for toilet flushing? | Yes No | 182 230 | 44% 56% |
| Are you willing to use urinals? | Yes No | 165 247 | 40% 60% |
| Are you willing to take a course designed for water conservation methods? | Yes No | 263 149 | 64% 36% |
© 2019 by the authors. Licensee MDPI, Basel, Switzerland. This article is an open access article distributed under the terms and conditions of the Creative Commons Attribution (CC BY) license (http://creativecommons.org/licenses/by/4.0/).
Share and Cite
MDPI and ACS Style
Yagoub, M.M.; AlSumaiti, T.S.; Ebrahim, L.; Ahmed, Y.; Abdulla, R. Pattern of Water Use at the United Arab Emirates University. Water 2019, 11, 2652. https://doi.org/10.3390/w11122652
AMA Style
Yagoub MM, AlSumaiti TS, Ebrahim L, Ahmed Y, Abdulla R. Pattern of Water Use at the United Arab Emirates University. Water. 2019; 11(12):2652. https://doi.org/10.3390/w11122652
Chicago/Turabian StyleYagoub, M. M., Tareefa S. AlSumaiti, Latifa Ebrahim, Yaqein Ahmed, and Rauda Abdulla. 2019. "Pattern of Water Use at the United Arab Emirates University" Water 11, no. 12: 2652. https://doi.org/10.3390/w11122652
Note that from the first issue of 2016, this journal uses article numbers instead of page numbers. See further details here.